Article

Response Analysis of Microbial Community Structures and Functions Under Water and Sediment Changes in the Middle and Lower Yellow River

1
Nanjing Hydraulic Research Institute, Nanjing 210029, China
2
School of Civil Engineering, Yantai University, Yantai 264005, China
*
Author to whom correspondence should be addressed.
Diversity 2025, 17(1), 41; https://doi.org/10.3390/d17010041
Submission received: 27 October 2024 / Revised: 29 December 2024 / Accepted: 30 December 2024 / Published: 7 January 2025
(This article belongs to the Section Freshwater Biodiversity)

Abstract

:
Safety and ecological health are restricted by the high amount of suspended sediment in the Yellow River. To solve the problems of the high sediment content and siltation in the Yellow River, the Xiaolangdi Reservoir (XLDR) has been carrying out water–sediment regulation (WSR) since 2002. To clarify the effects of the water and sediment changes caused by WSR on microbial communities, we analysed the composition of the microbial communities and functional groups in surface water and sediments before and after WSR using high-throughput sequencing and microbial functional annotation. Proteobacteria, Actinobacteria, Bacteroidetes, and Firmicutes were detected as the main microbial communities in the Yellow River’s middle and lower reaches. The water temperature (WT), dissolved oxygen (DO), total nitrogen (TN), total phosphorus (TP), and evolution of the microbial communities were all correlated (p < 0.05). The biodiversity indices of the surface water and sediment microbes, respectively, greatly declined. The WSR programme broke down nutrients that had been adsorbed on the sediments, which diminished microbial metabolic activity and impaired the water bodies’ capacity to purify themselves. In summary, this study provides the biological information needed for the ecological conservation of the Yellow River basin, as well as insights into the changes in and response characteristics of microorganisms following severe disturbances in rivers with high sediment concentrations.

Graphical Abstract

1. Introduction

As the mother river of China, the Yellow River is vitally strategic in the country’s social and economic advancement and in its ecological civilization [1]. For many years, the Yellow River was one of the most well-known high-sediment rivers in the world. However, in addition to its long-term downstream flooding hazards, the river’s water quality is declining [2]. In 2002, the Yellow River Conservancy Commission (YRCC) began carrying out a water–sediment regulation programme (WSR) due to the seriously uncoordinated water–sediment relationship in the middle and lower reaches of the Yellow River. The Yellow River faces numerous focal problems in flood control, governance, and development in its lower reaches. The WSR programme’s goal was to scour the riverbed and decrease its flood level, and by 2013, the WSR programme succeeded in scouring the bed of the lower Yellow River to a depth of 2 m, causing the channel to be narrower and deeper [3]. Along with changing runoff, WSR harms the middle and lower Yellow River environment as a whole [4]. Hydrological connectivity in the middle and lower reaches of the Yellow River basin is drastically altered by the presence of ecosystem fragmentation characteristics [5].
Microorganisms (including bacteria, fungi, and archaea) are important in ecosystems, and river microorganisms are the initial part of river biomes and ecosystem structure, characterised by their rich variety, functional diversity, and sensitive response. They also have a function in the transformation and circulation of river substrate nutrients, the formation and decomposition of organic matter, river material circulation and energy flow, and other kinds of ecological processes [6]. River microbiota contribute to essential geochemical processes and ecological functions but are sensitive to changes in environmental drivers [7]. Microorganisms in surface water are essential for its self-purification and biogeochemical cycles [8]. Changes in water quality could affect the species variety in a river, as well as their abundance and functional communities [9]. Recent research has revealed certain environmental elements, such as nitrogen, phosphorus, and heavy metals, that are critical in determining the make-up of microbial communities in surface water [10,11,12]. The abundance and diversity of microorganisms in the Yellow River basin are closely related to the organic matter concentration in the water [13]. Furthermore, surface water and sediment frequently have different microbial reactions to pollution [14]. The reason for this is that flowing surface water transports contaminants, whereas, comparatively, stationary sediments are either a sink or source of contaminants [15]. As an essential component of aquatic ecosystems, sediment not only provides habitats for aquatic plants and animals, but also enables microorganisms to flourish and survive [16]. Some studies have found that the microbial community in sediment might be impacted by the deposition and resuspension of suspended sediment in turbid rivers with high suspended sediment concentrations. The spatial and vertical distribution of microorganisms in turbid rivers (e.g., the Yellow River) might be different from that in other rivers [17].
Previous research has shown that variations in water and sediment critically impact the functional characteristics and structure of river microbial communities. Compared to other significant rivers in China, the Yellow River’s overall diversity index of its microbial community is at a medium level; nevertheless, the water and sediment transfer by the XLDR crucially impacts it [18]. On the other hand, little is known about the effects of the microbial communities in the middle and lower Yellow River watershed, which are impacted by several WSRs. Due to the large variety of microbial community compositions, complexity of influencing factors, and insufficient observational data during the nonwatery sediment regulation phase, our current understanding of the effects of WSR on the prediction of microbial community abundance, diversity, community composition, and functioning, as well as the magnitude of their impacts, has not been adequately recognised.
To comprehensively characterise the response relationship between different stages of WSR and the structural and functional characteristics of the microbial communities in the middle and lower Yellow River basin, as well as to explore how the water environment would change in this area under natural recovery scenarios after WSR, we conducted physicochemical and biological surveys in September 2022 (post-WSR) and May 2023 (pre-WSR) in the middle and lower Yellow River basin, as well as along observational sections within the XLDR. Using high-throughput sequencing and an understanding of the spatial and temporal characteristics of water quality and environmental factors, we extracted the microbial community structure and diversity in the middle and lower reaches of the Yellow River and investigated the relationship between water and sediment changes. Our major objectives in this study were to (I) determine the spatial distribution characteristics of the microbial community structure in the middle and lower reaches of the Yellow River basin affected by WSR; (II) reveal the microbial community structure’s response to the different water environmental factors; and (III) compare the differences in microbial community functions in the pre- and post-WSR periods and synthesise and analyse the effect of the changes in water and sediment on the microbial communities in the Yellow River basin.

2. Materials and Methods
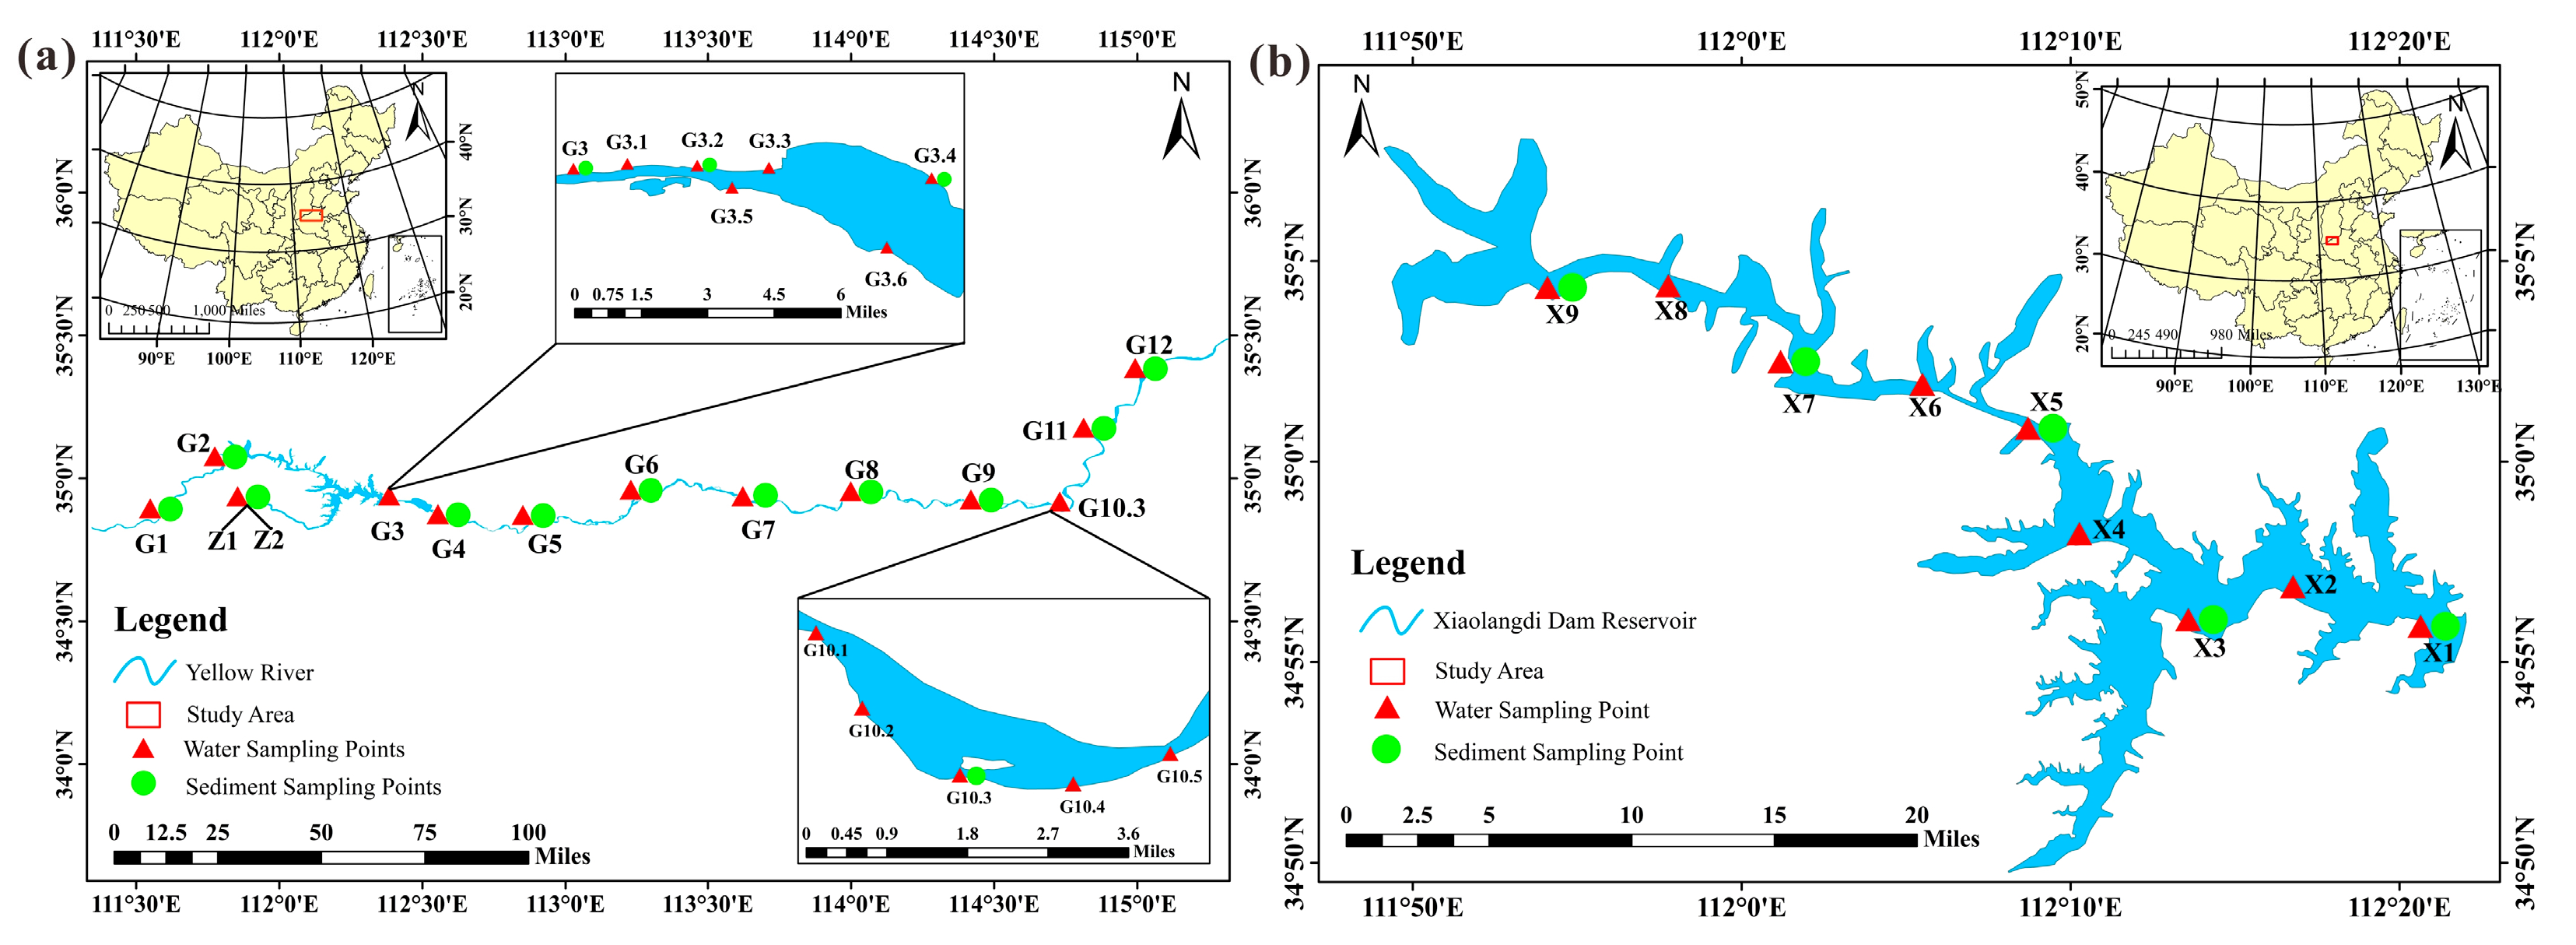
2.1. Study Area

The middle and lower reaches of the Yellow River were observed and sampled in pre- and post-WSR periods. The section from Bailang to Gaocun in the middle and lower reaches of the Yellow River was selected as the study area (Figure 1a), which spans the provinces of Henan and Shandong (34°45′ N to 35°30′ N, 111°30′ E to 115°20′ E), with a total length of approximately 440 km and a watershed area of approximately 432 km2. According to the natural geomorphological features and flow of the middle and lower reaches of the Yellow River, every 50 km from Bailang (G1) was used as an observation section, of which the total number of observation sections in the main stream was 12; for a distance of 15 km in the watershed below Xiaolangdi Dam, every 2 km was used as an observation section, with a total of 7 observation sections (G3, C3.1, G3.2, G3.3, G3.4, G3.5, G3.6); in the Jiahetan basin, there was an approximately 10 km river section, and every 2 km was used as an observation section, with a total of 5 observation sections (G10.1, G10.2, G10.3, G10.4, G10.5); and the tributary section was set as Z1, Z2. The XLDR area within the Yellow River basin was selected as a control, in which the watershed area was approximately 694,000 square kilometres, the total length was approximately 50 km, and one observation section was set up every 5 km, totalling nine observation sections (Figure 1b).

2.2. Sample Collection and Water Quality Physicochemical Research Methods

Water environmental factors such as WT, DO, turbidity (Tur), electrical conductivity (EC), and pH were determined using a multiparameter water quality instrument (YSL-EXO). Two (100 mL) composite surface water microbial samples were collected at a depth of 0.5 m below the river surface using a plexiglass collector, as well as 2 L of surface water samples for subsequent water quality experiments. Two (100 g) composite sediment microbial samples were collected using a Petersen grab. The surface water samples and sediments collected were kept frozen in clean polyethylene bottles and transported to the laboratory. The surface water samples were filtered and immediately analysed in the laboratory, and the sediment samples were stored in a refrigerator at −20 °C for subsequent microbiological determinations. Chemical oxygen demand permanganate (CODMn) was determined by the potassium permanganate method; TN was determined by UV spectrophotometry with alkaline potassium persulfate digestion; TP was determined by molybdenum, antimony, and scandium colorimetry with potassium per sulphate digestion; ammoniacal nitrogen (NH4+) was determined by salicylic acid spectrophotometry; nitrate (NO3) and nitrite nitrogen (NO2) were also detected and analysed by UV spectrophotometry; and phosphates (PO4) were determined by molybdenum blue spectrophotometry.

2.3. DNA Extraction, PCR, and Illumina MiSeq Sequencing

According to the manufacturer’s instructions, the water samples were filtered through a microporous filter membrane with a pore size of 0.2 μm, and total bacterial DNA was extracted from the water and sediment samples using the CTAB method, while the DNA was quantified using Nanodrop, and the quality of the DNA extracted was checked by 1.2% agarose gel electrophoresis. For the bacterial 16SrRNA gene in this paper, the Greengenes database (Release 13.8, https://greengenes2.ucsd.edu/, accessed on 6 June 2023) was used. The V3-V4 region of the 16S RNA gene was amplified using F (ACTCCTACGGGGAGGCAGCA) and R (GGACTACHVGGGTWTCTAAT) primers. PCR amplification recovery products were used to quantify the libraries using a Quant-iT PicoGreen dsDNA Assay Kit on a microplate reader (BioTek, FLx800) fluorescence quantification system, and library enrichment products were purified using BECKMAN AMPure XP Beads. The purified amplification products were sequenced on the Illumina MiSeq platform, with an optimal sequencing length of 200–450 bp. The DNA extraction, PCR amplification, and on-line sequencing were all performed by Shanghai Personal Biotechnology Company Limited.

2.4. Data Analysis

SPSS (version 26.0) software was utilised to perform an independent sample t test to compare the significant differences between the pre-WSR and post-WSR water environment factors. Microbial OTU data were statistically analysed on the Personal Genetics Cloud Platform (https://www.genescloud.cn/analysisProcess/projectOverview, accessed on 10 June 2023). A redundancy analysis (RDA) was performed in the Canoco (version 5.0) software for data processing and analysis. Microbial community structural compositions, bacterial diversity indices, and related metadata were organised using Excel, while microbial community metabolic functions were annotated and analysed using Origin 2021 software. The sampling distribution was mapped using ArcGIS (10.6) software.

3. Results

3.1. Differential Changes in Physicochemical Characteristics of Environmental Factors in the Pre- and Post-WSR Periods

The median level of the DO values pre-WSR was higher than the median value post-WSR; there was a significant difference in the WT values (p < 0.01), with a lower median level of water temperature pre-WSR than post-WSR, as shown in Table 1. The median levels of TN, TP, and CODMn in the pre stage were significantly higher than the median levels in the post stage. On the one hand, the water affected by WSR contained a large amount of sediment during the re-discharge process below the dam, and the sediment occupied space in the water and decreased the volume of the water, diminishing the dissolved oxygen in the water. In addition, the sediment prevented the exchange of air and water, thereby diminishing the replenishment of oxygen in the water. However, the water bodies in the study reaches were partially purified during the post-WSR period [19]. On the other hand, the pre-WSR in the study reached G5-G12, the basin flow rate was significantly higher, and the disturbance in the water body led to the release of nitrogen and phosphorus from the sediments [20]. The main channel followed the same trend in its NH4+ levels as the XLDR one, and the overall post stage NH4+ levels were higher than the overall pre stage levels (Table 2). Additionally, it is probable that the post stage WT was better suited for algae growth, which would have reduced the water’s ability to purify itself and resulted in pollution with higher levels of nitrogen and ammonia indicators [21].
The Xiaolangdi Hydraulic Dam was built to control floods, increase low flows, generate electricity, and irrigate surrounding agriculture [22]. In addition to providing these functions, dams have reduced the number of physical barriers for the natural transmission of water flow and sediment, resulting in decreased flow velocities and increased sediment residence time in the reservoir, which contribute to sediment deposition and accretion before WSR [23]. The water environmental factors pH, Tur, DO, TSS, and CODMn in the XLDR were significantly different from those in the main channel, which might have been influenced by WSR, which decreased the runoff in the reservoir area, and the pollutants were transported in a dissolved form through groundwater and surface water, as shown in Table 2 [24]. Dams and WSR influenced sediment erosion, deposition, and transport, which scoured the river channel and enabled the redistribution and accumulation of pollutants [25]. The results show that water quality indicators and environmental factors such as TN, TP, and CODMn in the same observations between pre- and post-WSR samples were significantly different and showed spatial variability.

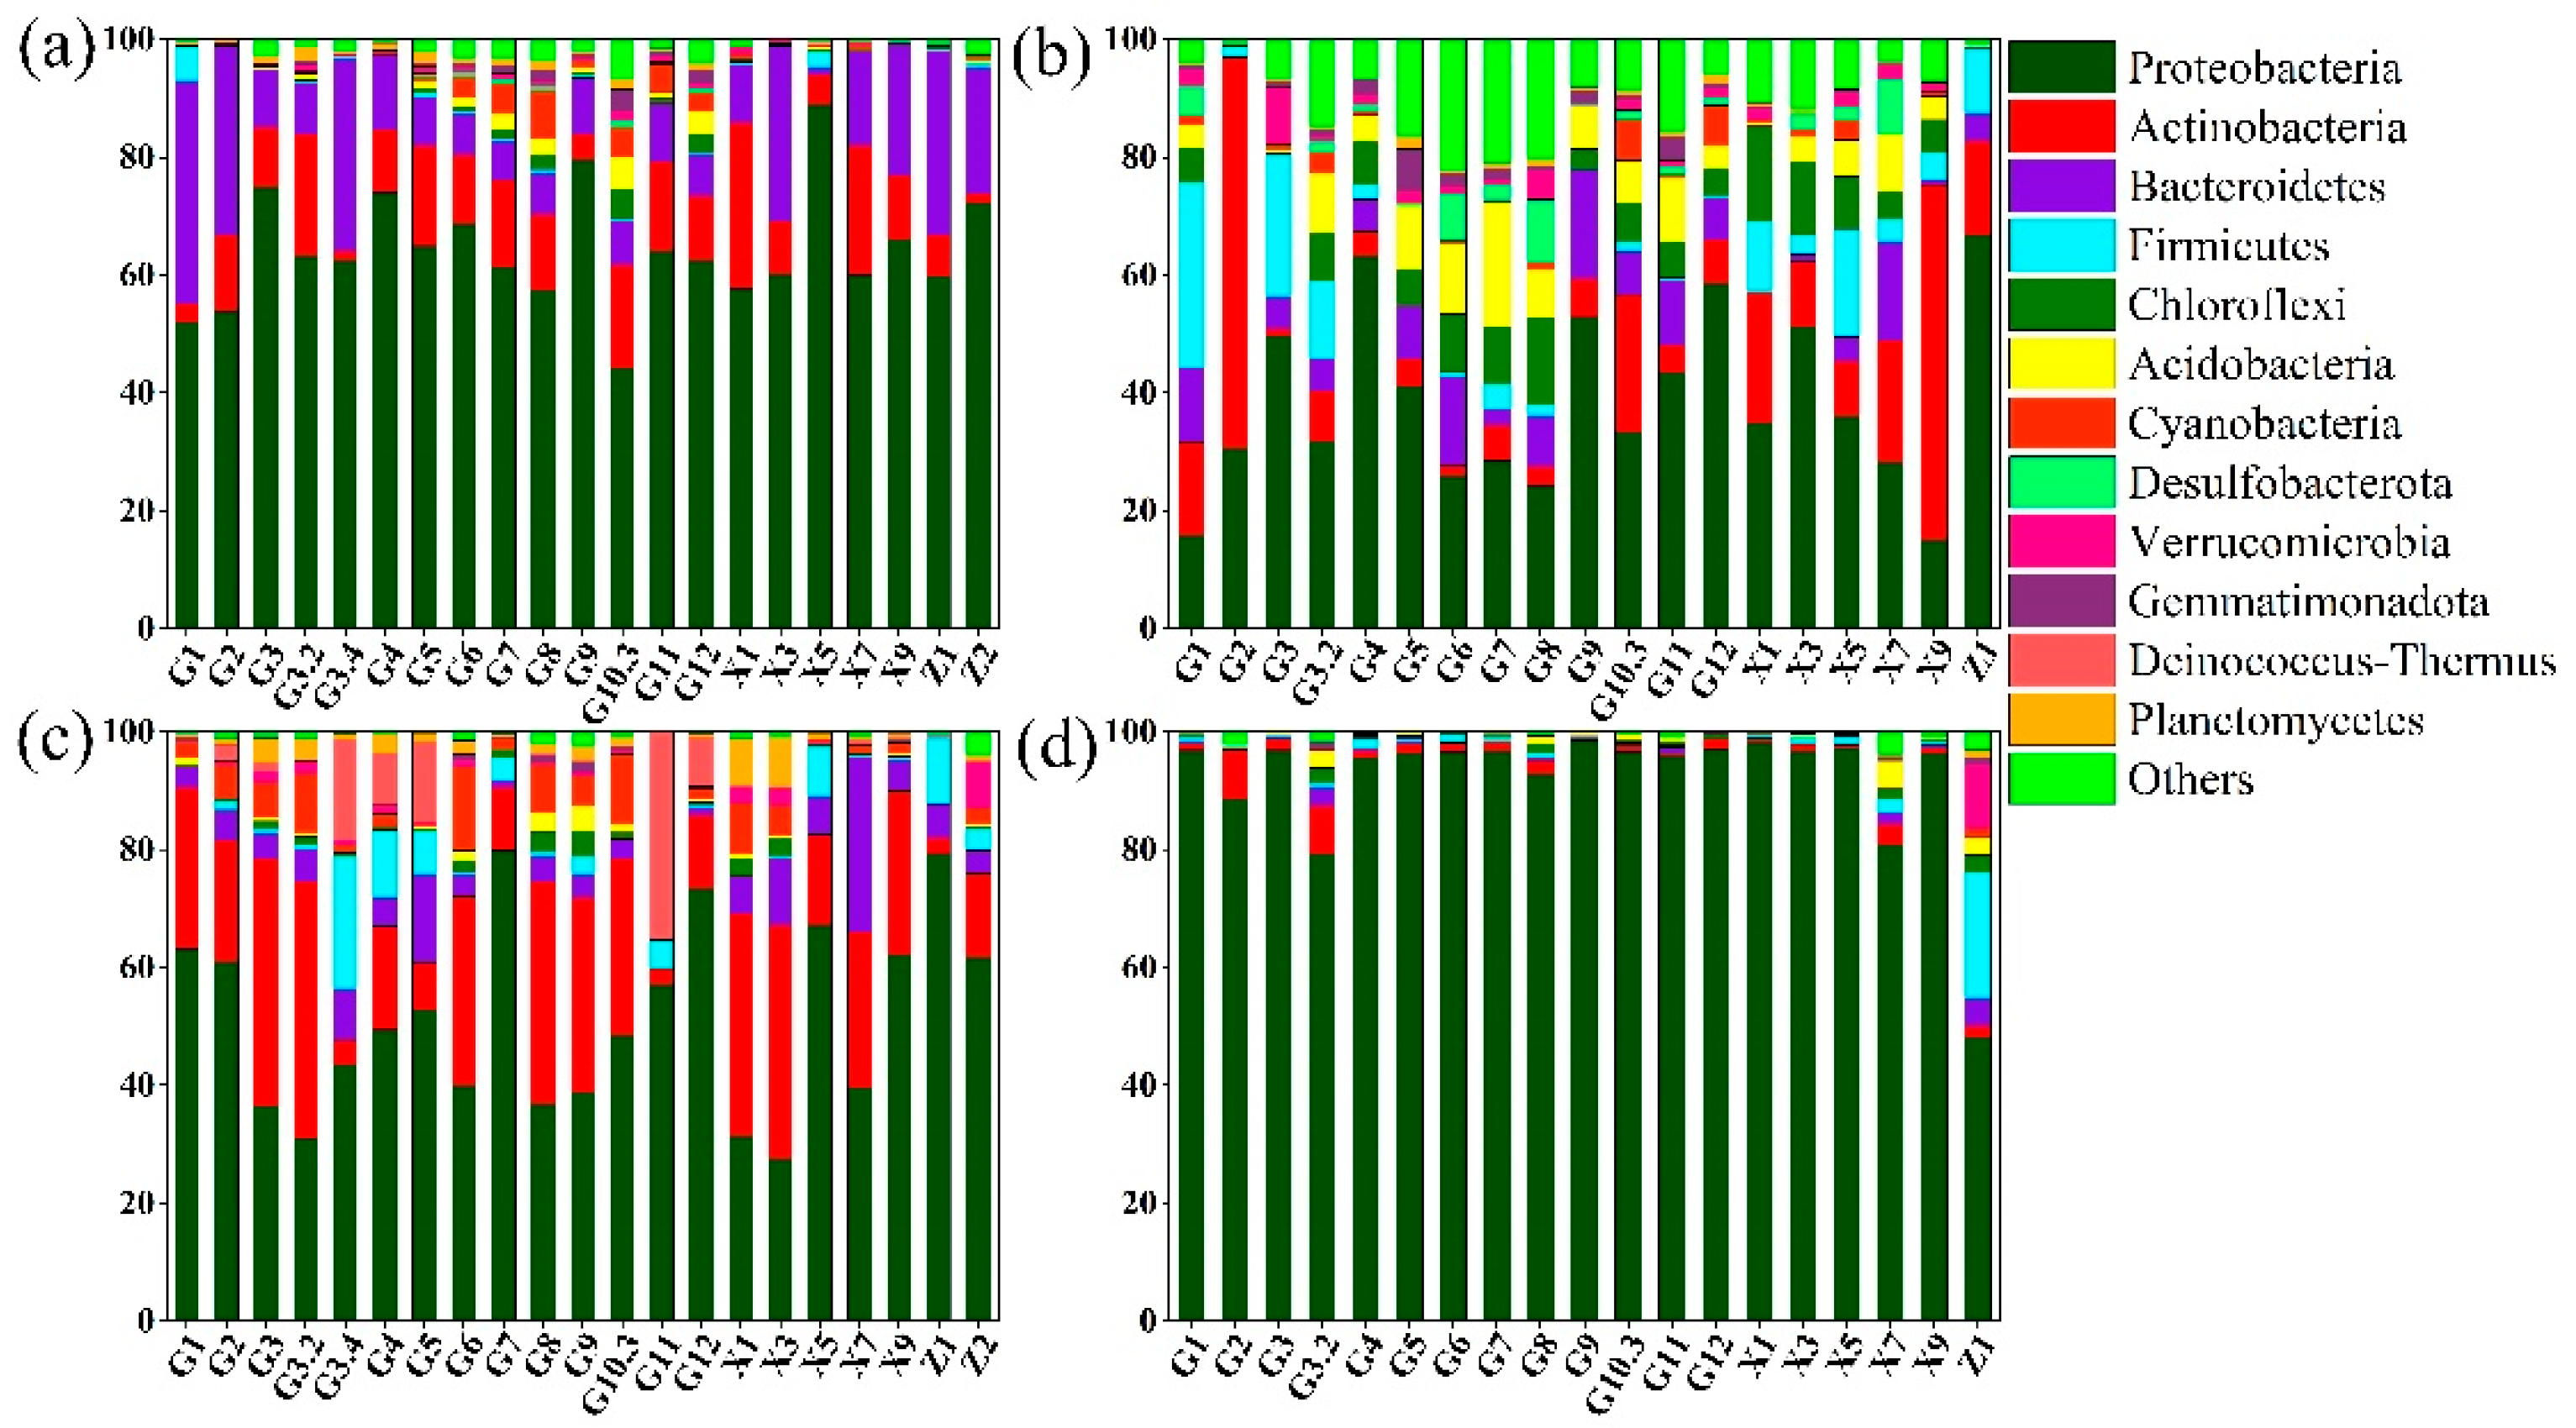
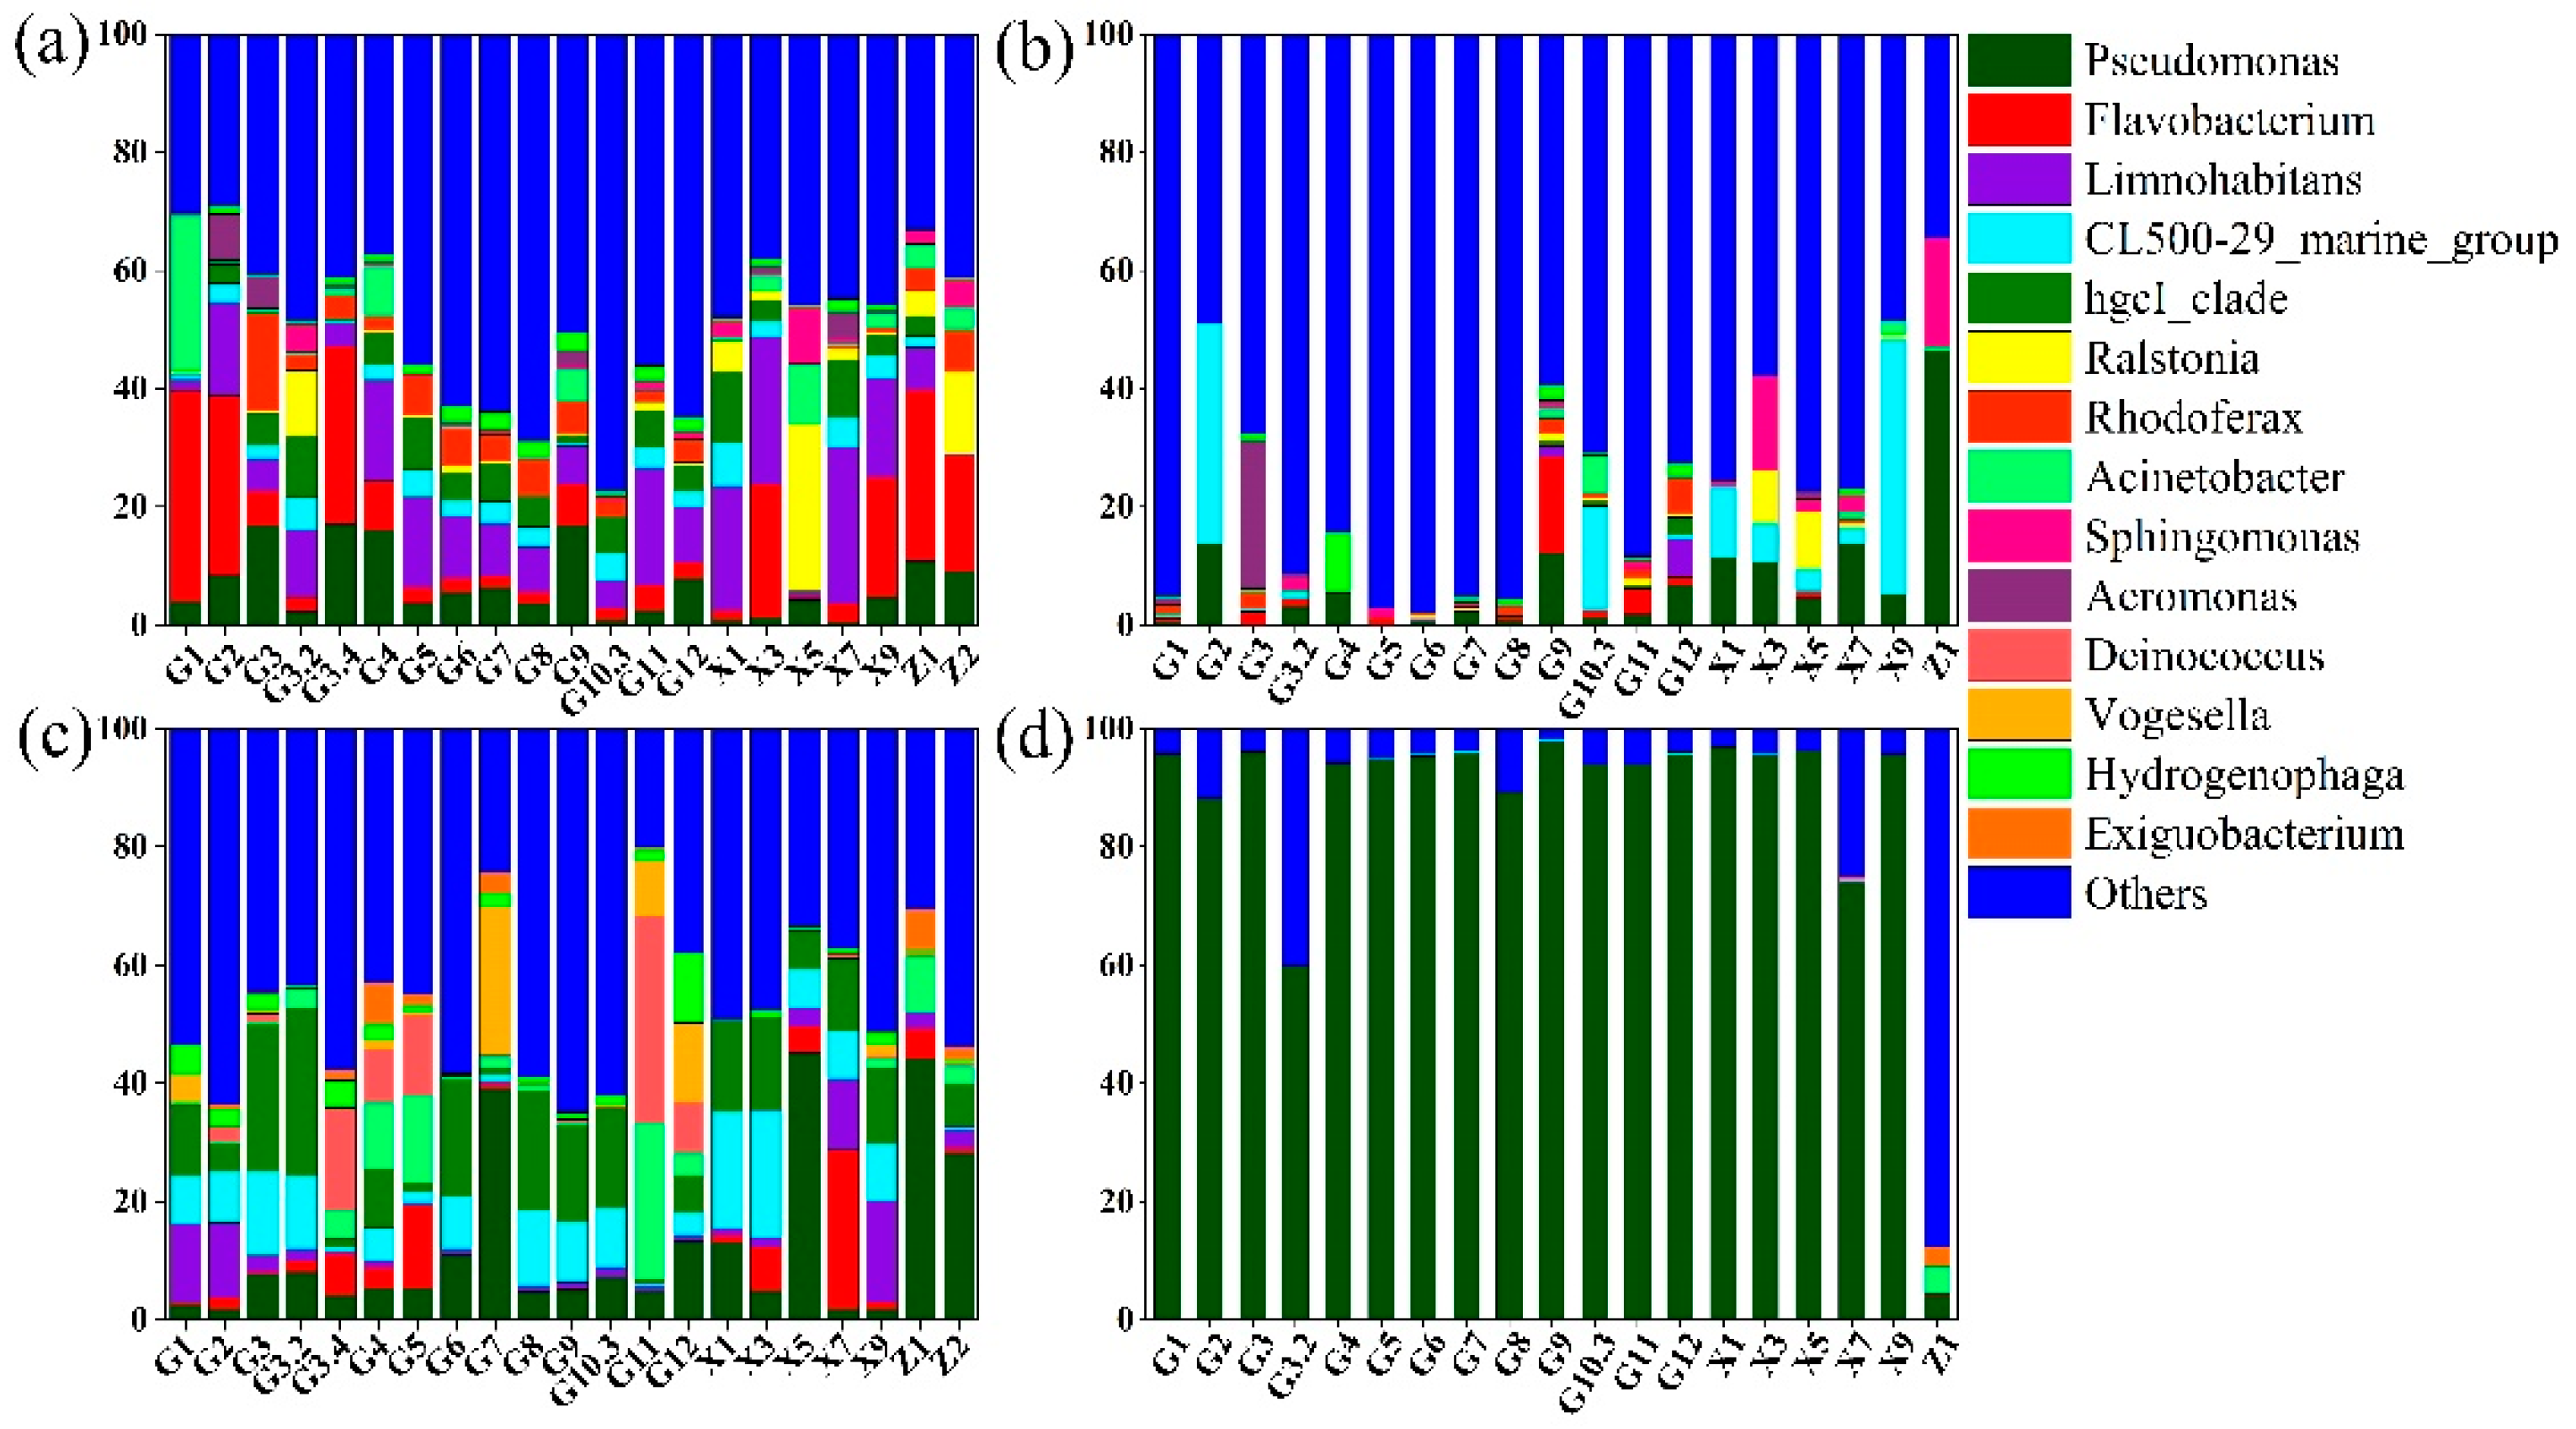
3.2. Microbial Community Structure Pre- and Post-WSR

The microbial communities in the pre- and post-WSR samples were composed at the phylum level, as shown in Figure 2. The dominant phyla (average abundance > 4%) in the surface waters of the middle and lower Yellow River basin pre-WSR were Proteobacteria, Actinobacteria, and Bacteroidetes. These three phyla accounted for 91.56% of the surface water community (Figure 2a). Proteobacteria had the largest proportion with a total of 64.21%, and its proportion in each observation ranged from 44.32% to 89.08%. The dominant phyla (average abundance > 4%) in the pre-WSR sediments were Proteobacteria, Actinobacteria, Bacteroidetes, Firmicutes, Chloroflexi, and Acidobacteria (Figure 2b). These six phyla accounted for 81.71% of the sediment community. Proteobacteria also accounted for the largest proportion, with a total of 38.50%, and its proportion in each observation ranged from 15.01% to 66.64%.
The dominant phyla (average abundance > 4%) in the surface waters of the middle and lower Yellow River basin in the post-WSR samples were Proteobacteria, Actinobacteria, Bacteroidetes, Cyanobacteria, Deinococcus-Thermus, and Firmicutes (Figure 2c). These six phyla accounted for 93.51% of the surface water community. Proteobacteria had the largest proportion with a total of 51.44%, and its proportion in each observation ranged from 27.49% to 79.83%. The dominant phylum (average abundance > 4%) in the post-WSR sediments was Proteobacteria, which accounted for 91.85% of the sediment microbial community, with its percentage ranging from 48.17% to 98.49% at each observation site (Figure 2d).
The genus-level compositions of the communities in the pre- and post-WSR periods are shown in Figure 3. The dominant genera of the bacteria in the surface waters of the middle and lower Yellow River basin in the pre-WSR period (average abundance > 4%) were Pseudomonas, Flavobacterium, Limnohabitans, and hgcI clade, which accounted for 33.97% of the surface water community (Figure 3a). Among them, Limnohabitans accounted for the largest proportion, with a total proportion of 11.20%, and its proportion at each observation site ranged from 0.35% to 26.52%. The dominant genera of bacteria in the pre-WSR sediment (average abundance > 4%) were Pseudomonas and the CL500-29 marine group, of which Pseudomonas accounted for the largest proportion, totalling 7.45% and ranging from 0.25 to 46.51% at each observation site (Figure 3b).
The dominant genera of bacteria (average abundance > 4%) in the surface water of the middle and lower Yellow River basin in the post-WSR period were Pseudomonas, hgcI clade, CL500-29 marine group, Deinococcus, and Acinetobacter (Figure 3c). These five genera accounted for 39.66% of the surface water community. Among them, Pseudomonas accounted for the largest proportion with a total of 12.33%, and its proportion at each observation site ranged from 1.72% to 45.17%. The dominant genus (average abundance > 4%) in the sediments was Pseudomonas, which accounted for 86.90% of the sediment microbial community, with proportions ranging from 41.88% to 97.79% at each observation site (Figure 3d).
The results showed that the surface water in the middle and lower reaches of the Yellow River was richer than the sediment community, and that in the pre- and post-WSR periods, the surface water community was dominated by Proteobacteria, Actinobacteria, Bacteroidetes, and Firmicutes at the phylum level, and the sediment community was dominated by Proteobacteria. Additionally, the community in the surface water was dominated by Pseudomonas, Limnohabitans, and hgcI clade at the genus level, and Pseudomonas dominated in the sediment community. These results are consistent with previous studies of large rivers, possibly from upstream transport or surface runoff [17,26].

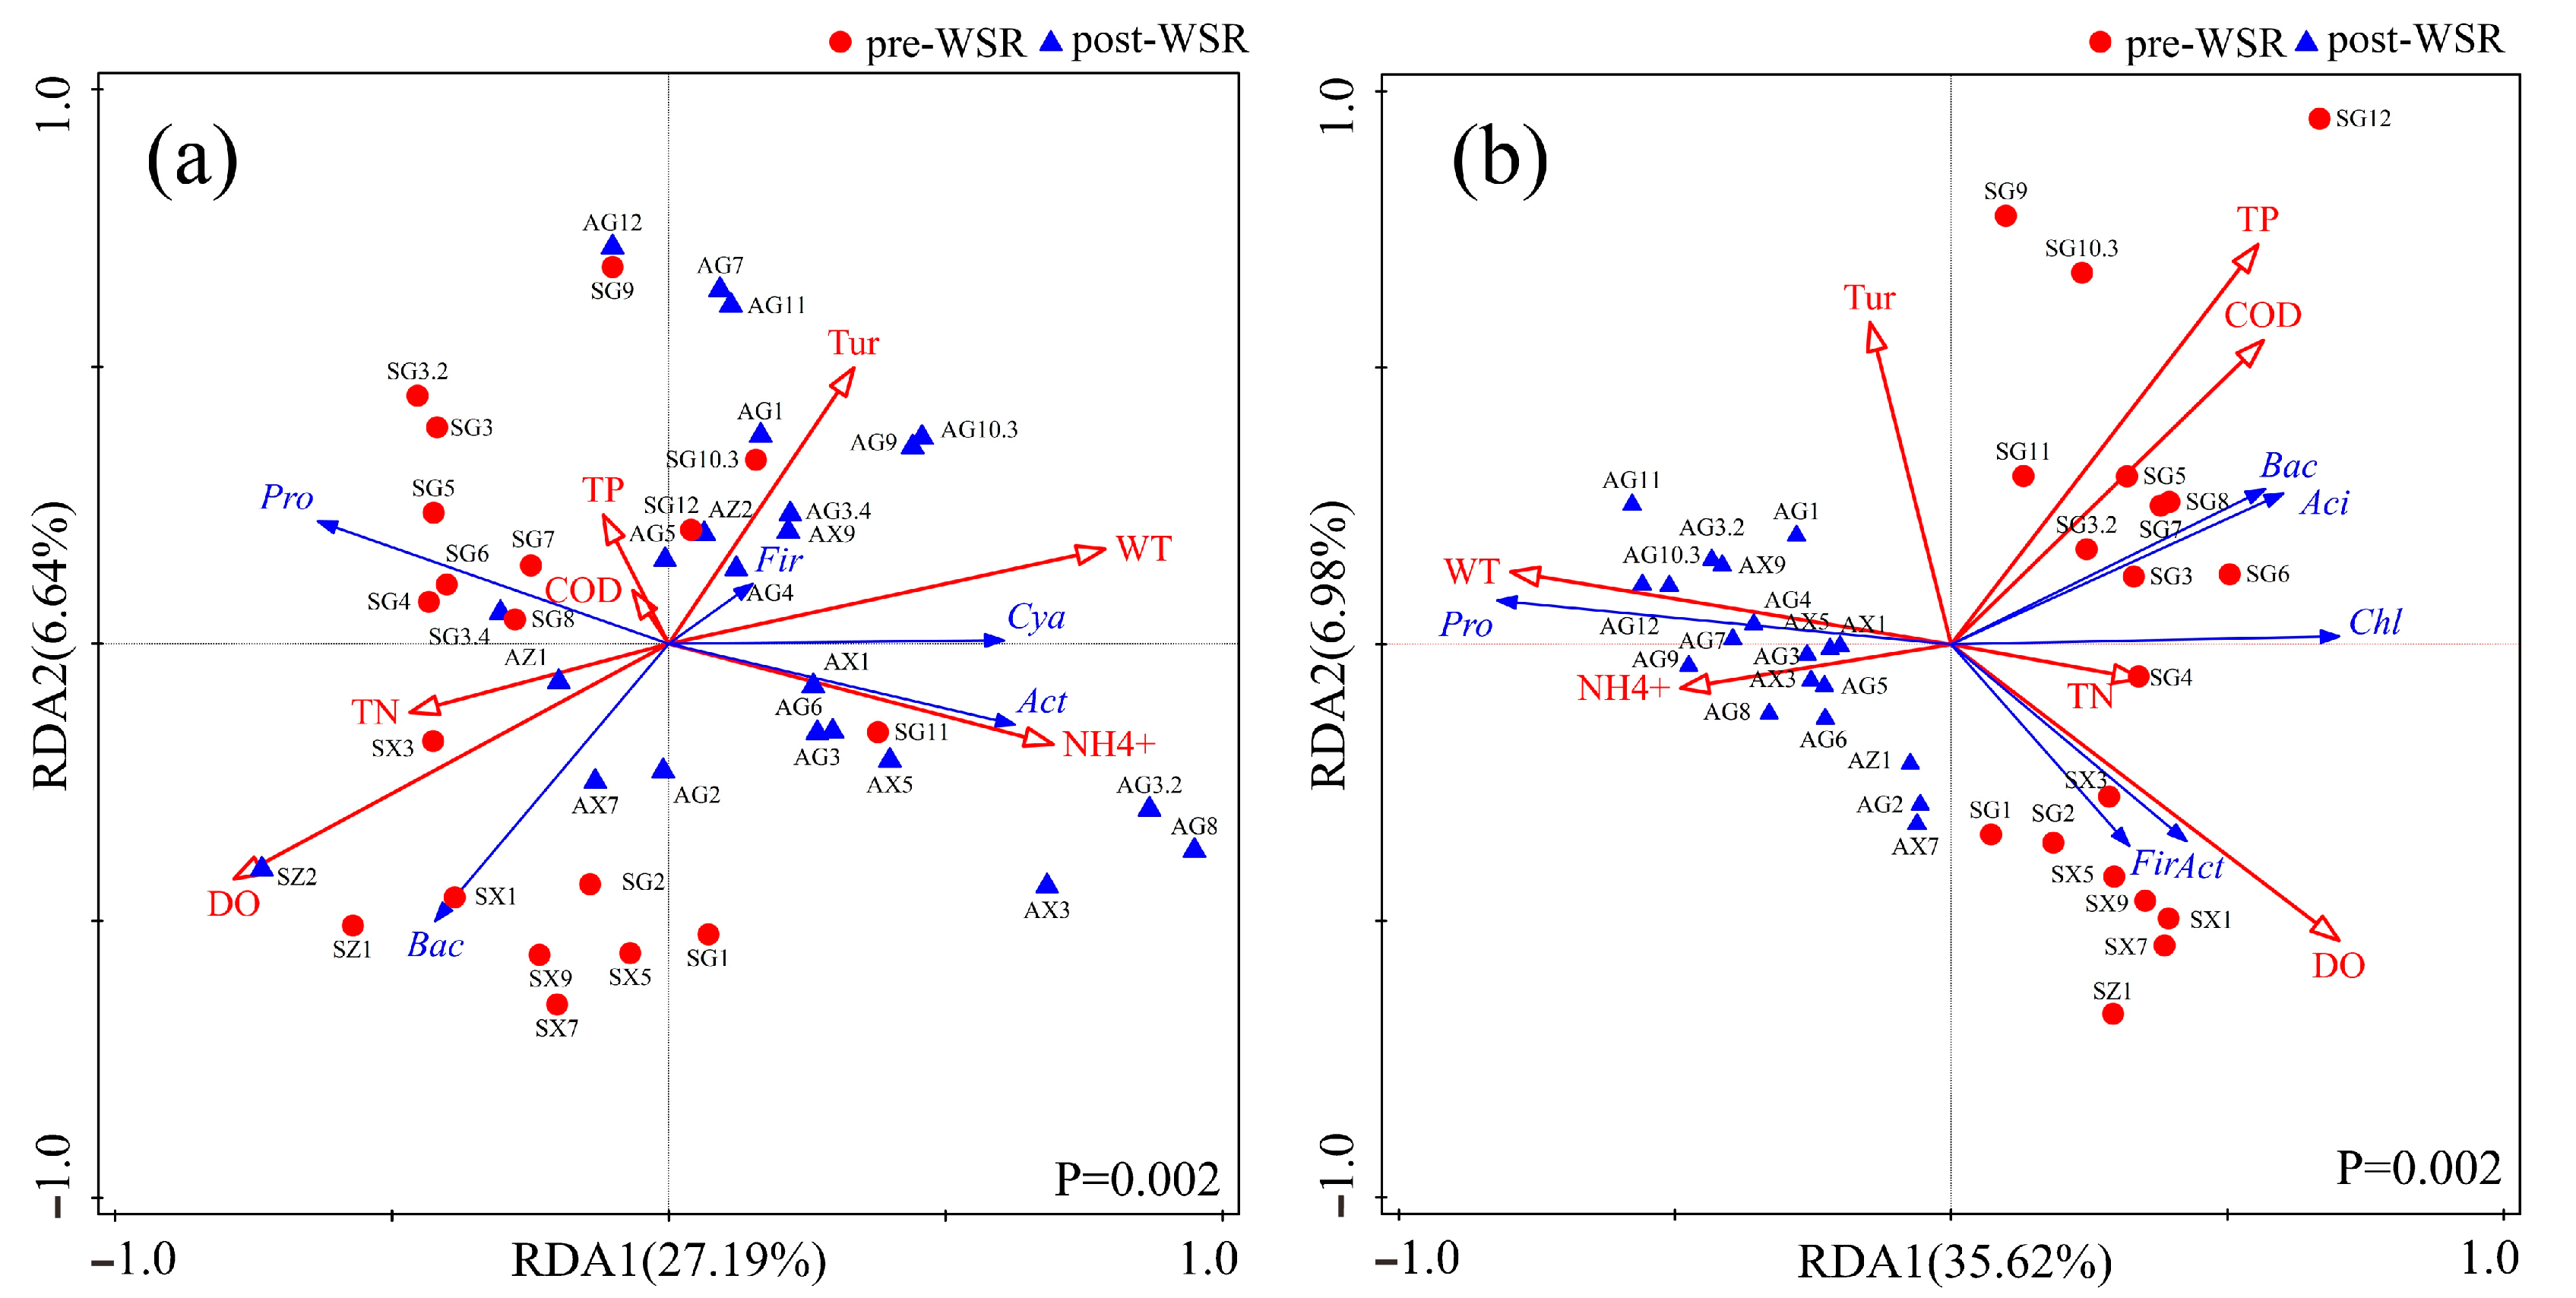
3.3. Correlation Analysis of Water Environmental Factors and Microbial Community Composition in Pre- and Post-WSR Waters

To better identify the spatially and temporally variable relationships between microbial communities and environmental factors, a redundancy analysis (RDA) was performed using community composition at the phylum level and environmental factors. We selected seven representative water environment factors (WT, DO, Tur, TN, TP, NH4+, and CODMn) to analyse their relationship with the dominant bacterial phylum’s response pre- and post-WSR. The RDA results showed that 33.83% (Figure 4a) of the surface water community changes and 42.60% (Figure 4b) of the sediment community changes could be explained. The results showed that the effects of DO (p < 0.01) and NH4+ (p < 0.05) were higher than those of other water environmental factors, and the response of the sediment community to the water environment in the study area showed that the effects of WT, TP, and DO (p < 0.01) were higher than those of other factors on the sediment community.

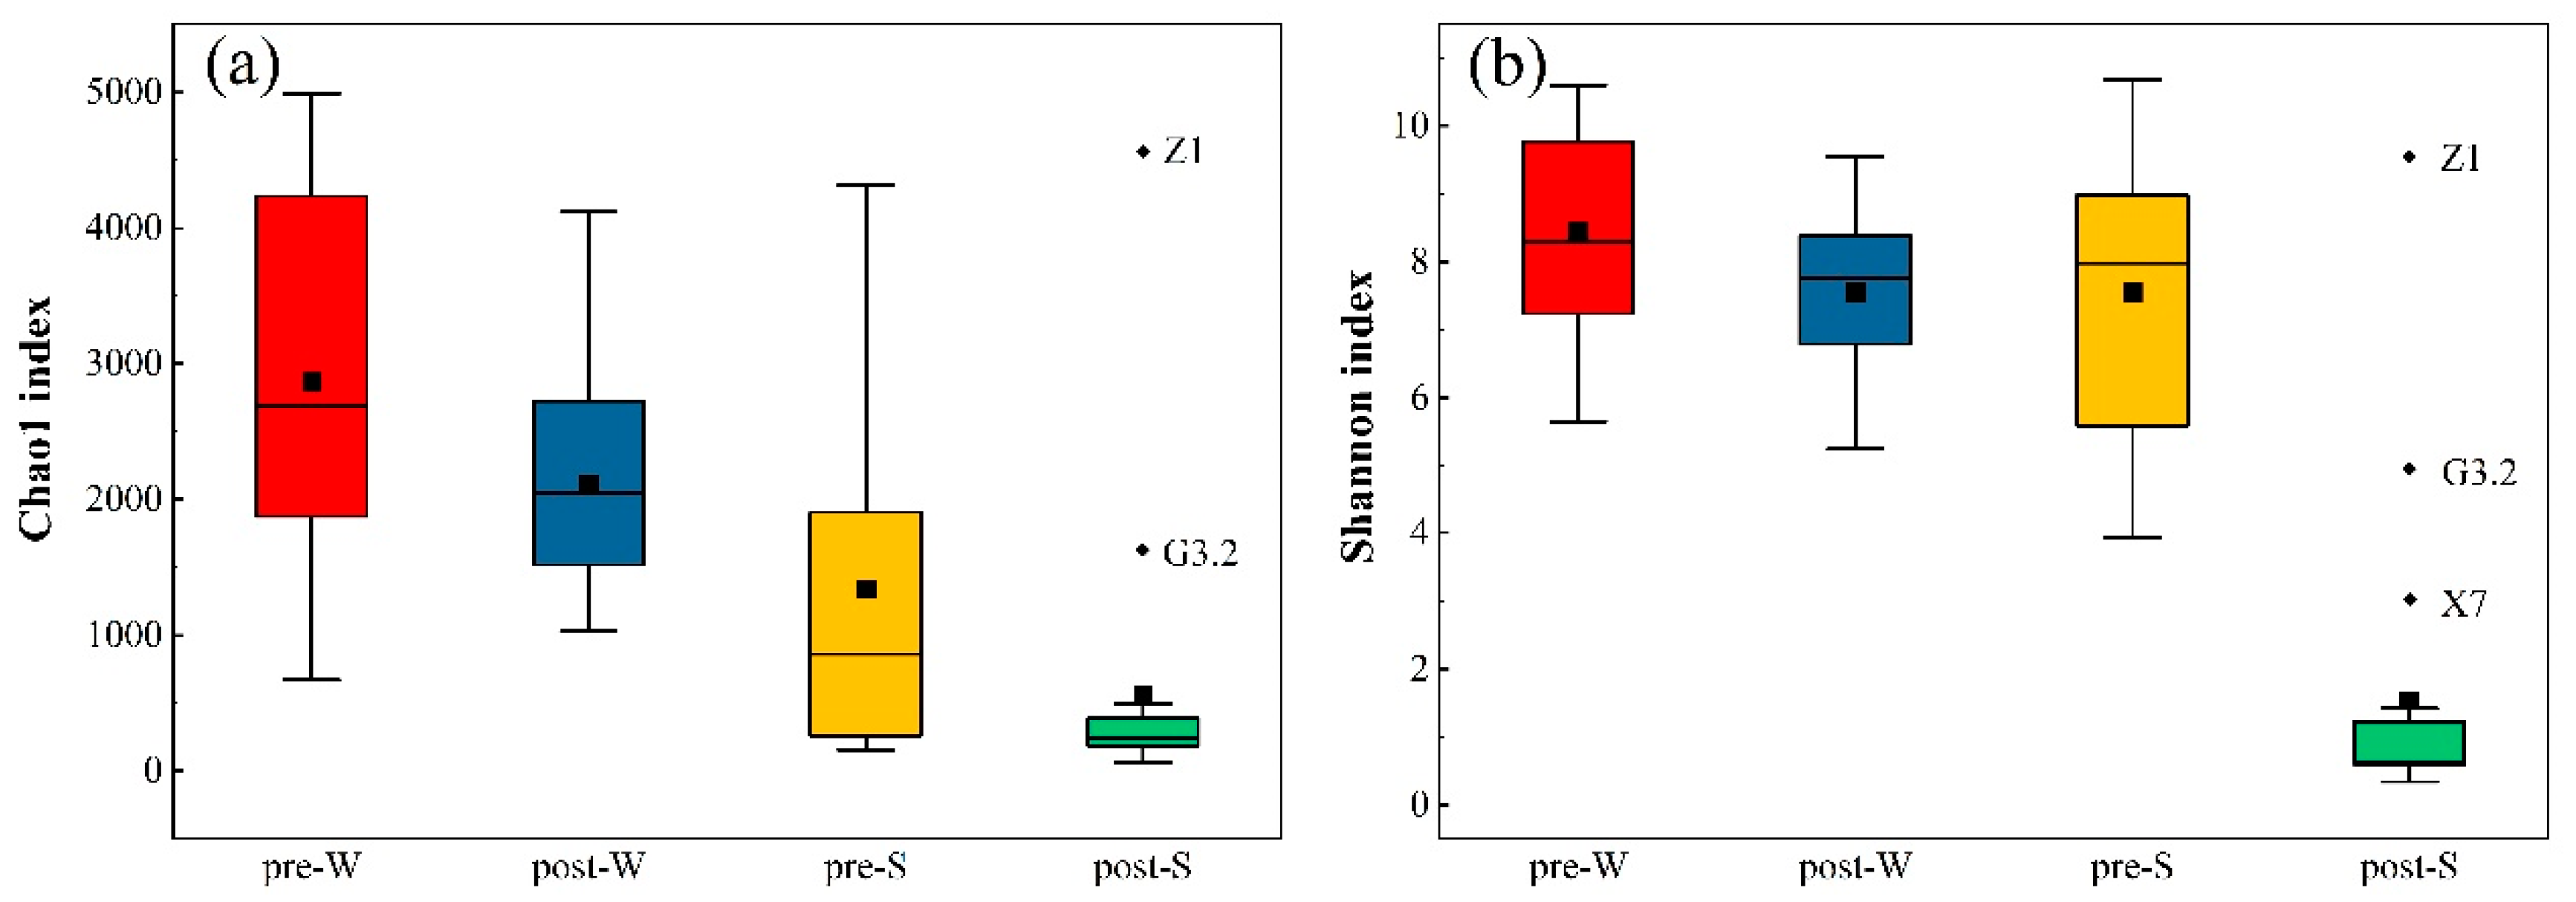
3.4. Microbial Community Diversity Analysis in Surface Water and Sediment in the Pre- and Post-WSR Periods

Using the Chao1 index and the Shannon index, the bacterial diversity was further compared and analysed between various phases of WSR and between observation sites. After WSR, the Chao1 richness indices of the surface water and sediment dropped dramatically by 26.36% and 58.77%, respectively. The Chao1 index of the microbial richness of the surface water was significantly higher (p < 0.05) before WSR than after WSR (Figure 5a). The Chao1 index of sediment microbial abundance was similarly higher before WSR than after WSR, but the difference was not significant. The community’s Shannon diversity index followed the same trend as the richness. After WSR, the Shannon diversity indices of the surface water and sediment decreased by 10.66% and 79.70%, respectively (Figure 5b). The Shannon diversity index of the surface waters was significantly higher before WSR than after WSR (p < 0.05), and the Shannon diversity index of the sediments was also particularly significant before WSR compared to after WSR (p < 0.01). The community diversity at these two sites was substantially better than that at all other sites, and it is noteworthy that the community Chao1 indices of G3.2 and Z1 after WSR were significantly higher than the overall level for this stage. The Shannon diversity indices for G3.2, Z1, and X7 after WSR were significantly higher than the overall level for this stage. Z1 was a tributary section of the Yellow River that was less affected by human-caused factors and WSR, and its ecological environment was significantly better than that of the main stream. As a result, the community structure and diversity index of Z1 were rich, and there was no difference between the two stages.

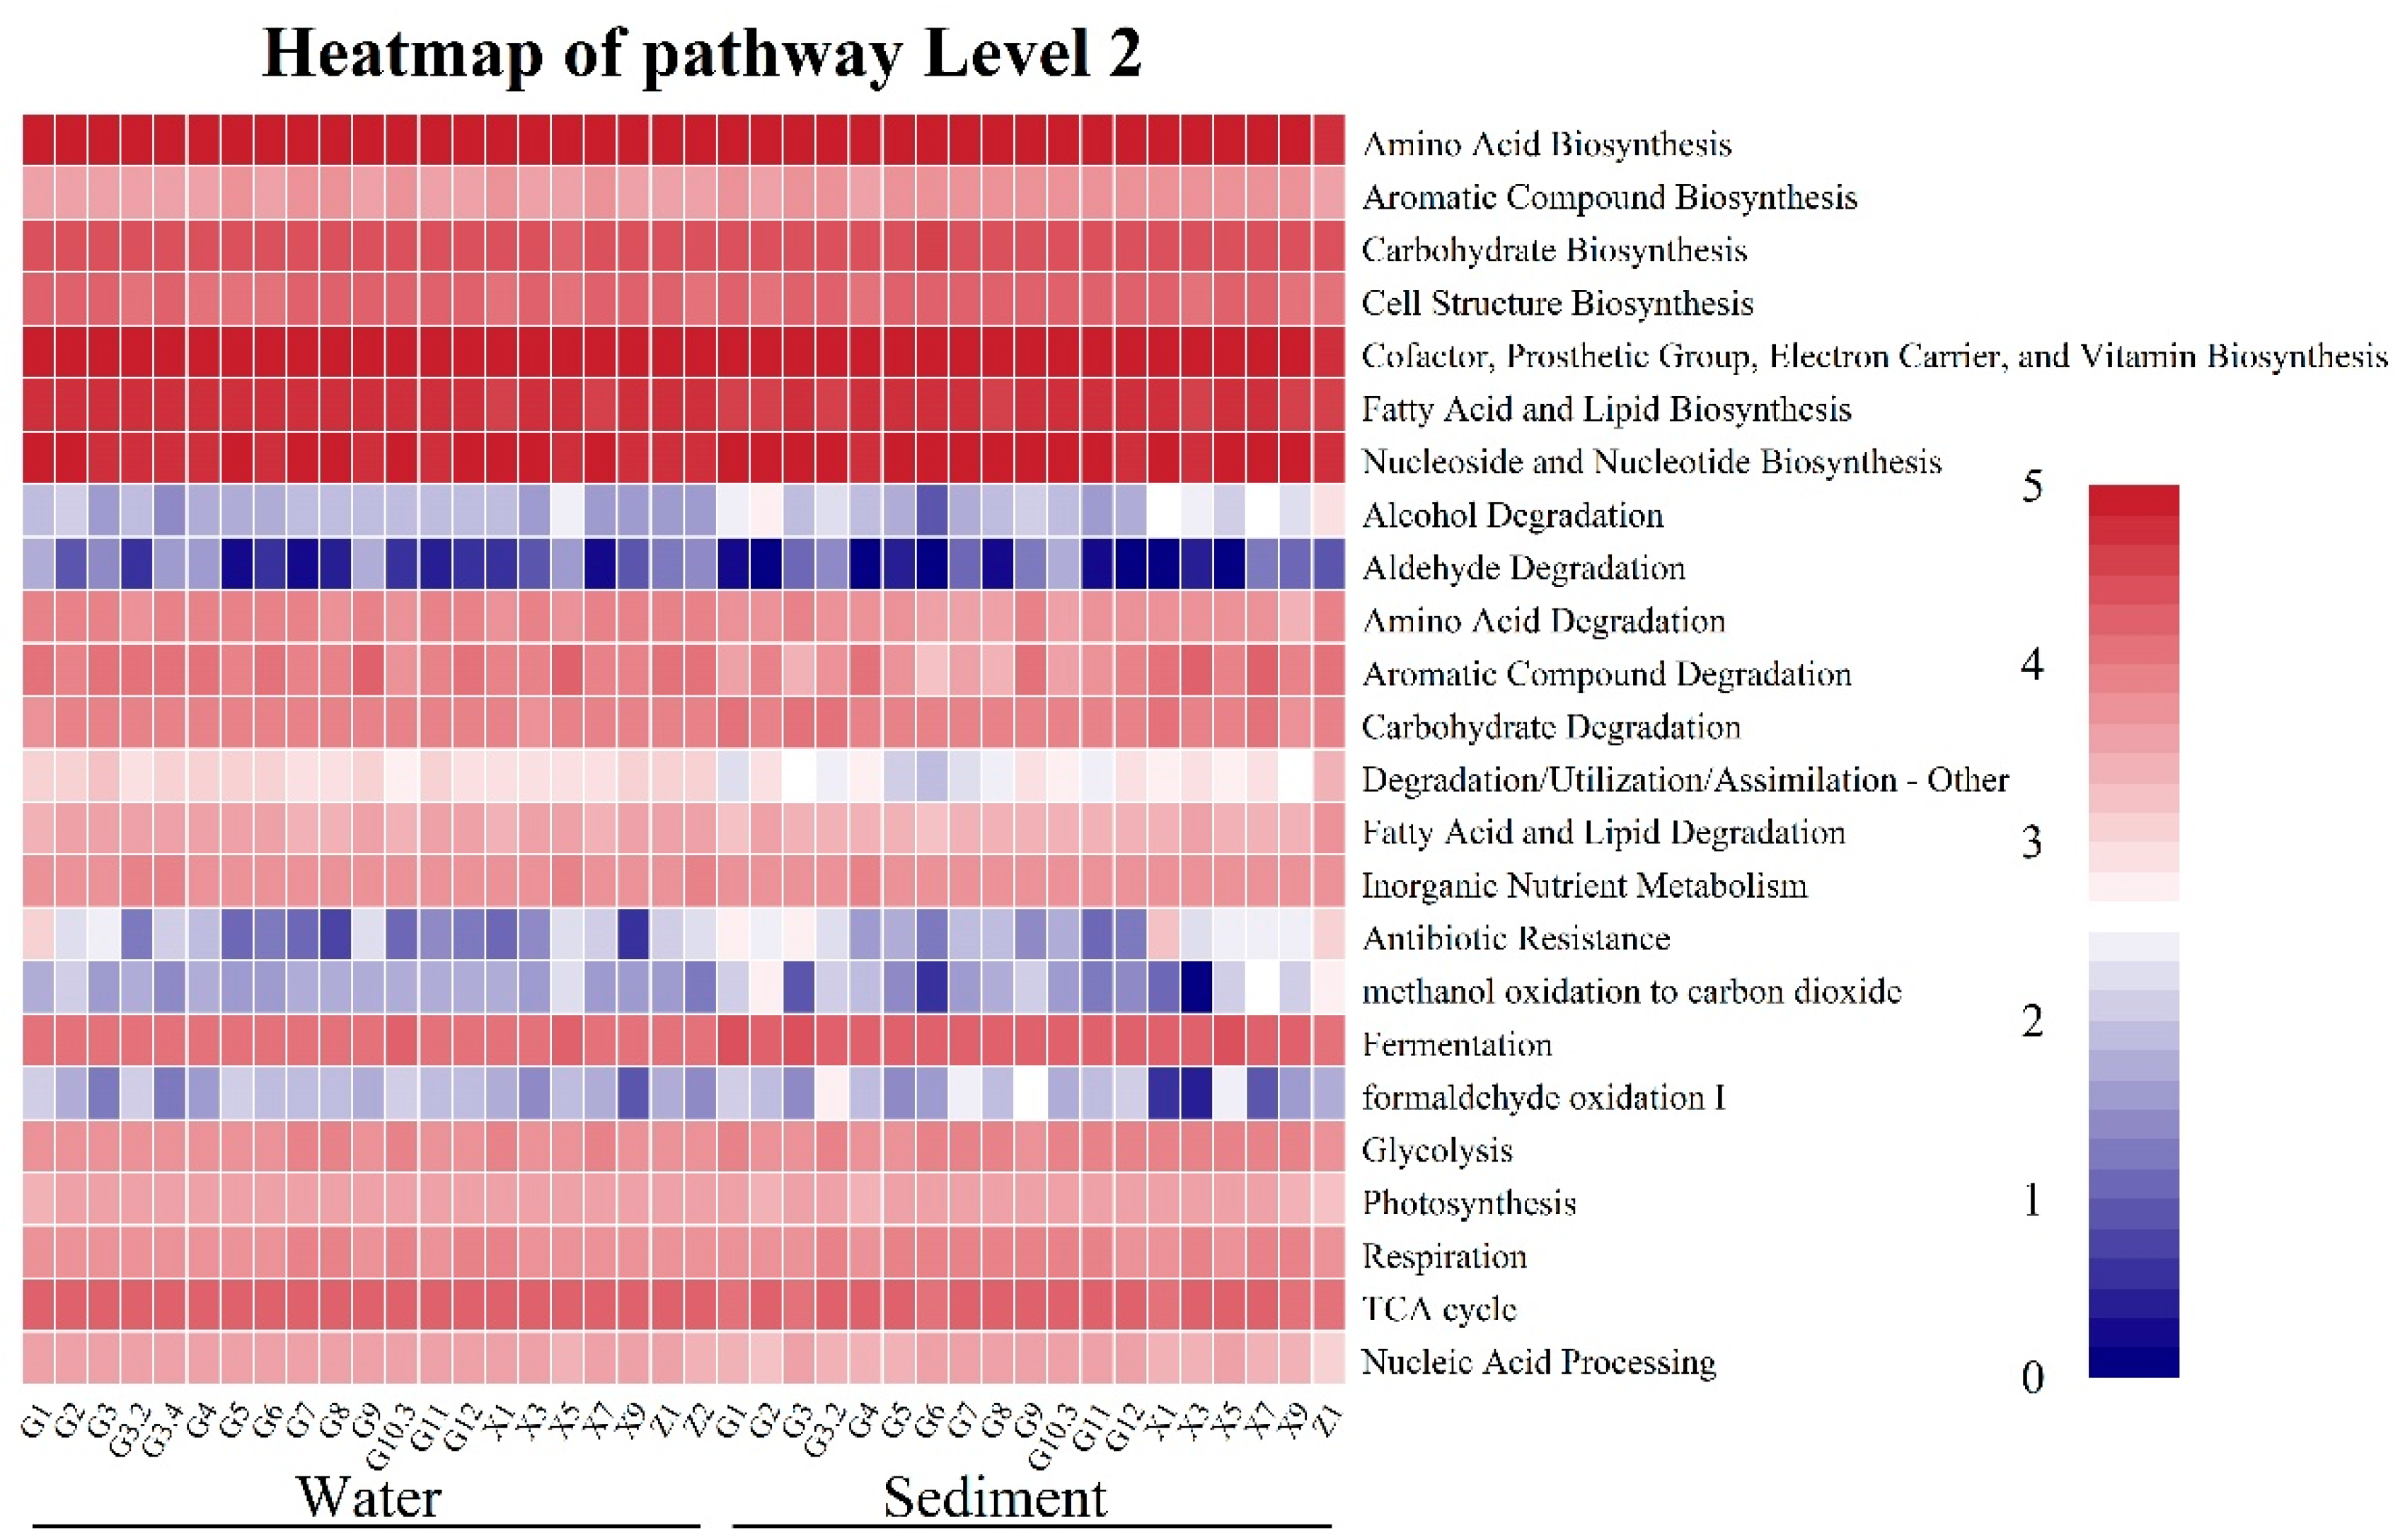
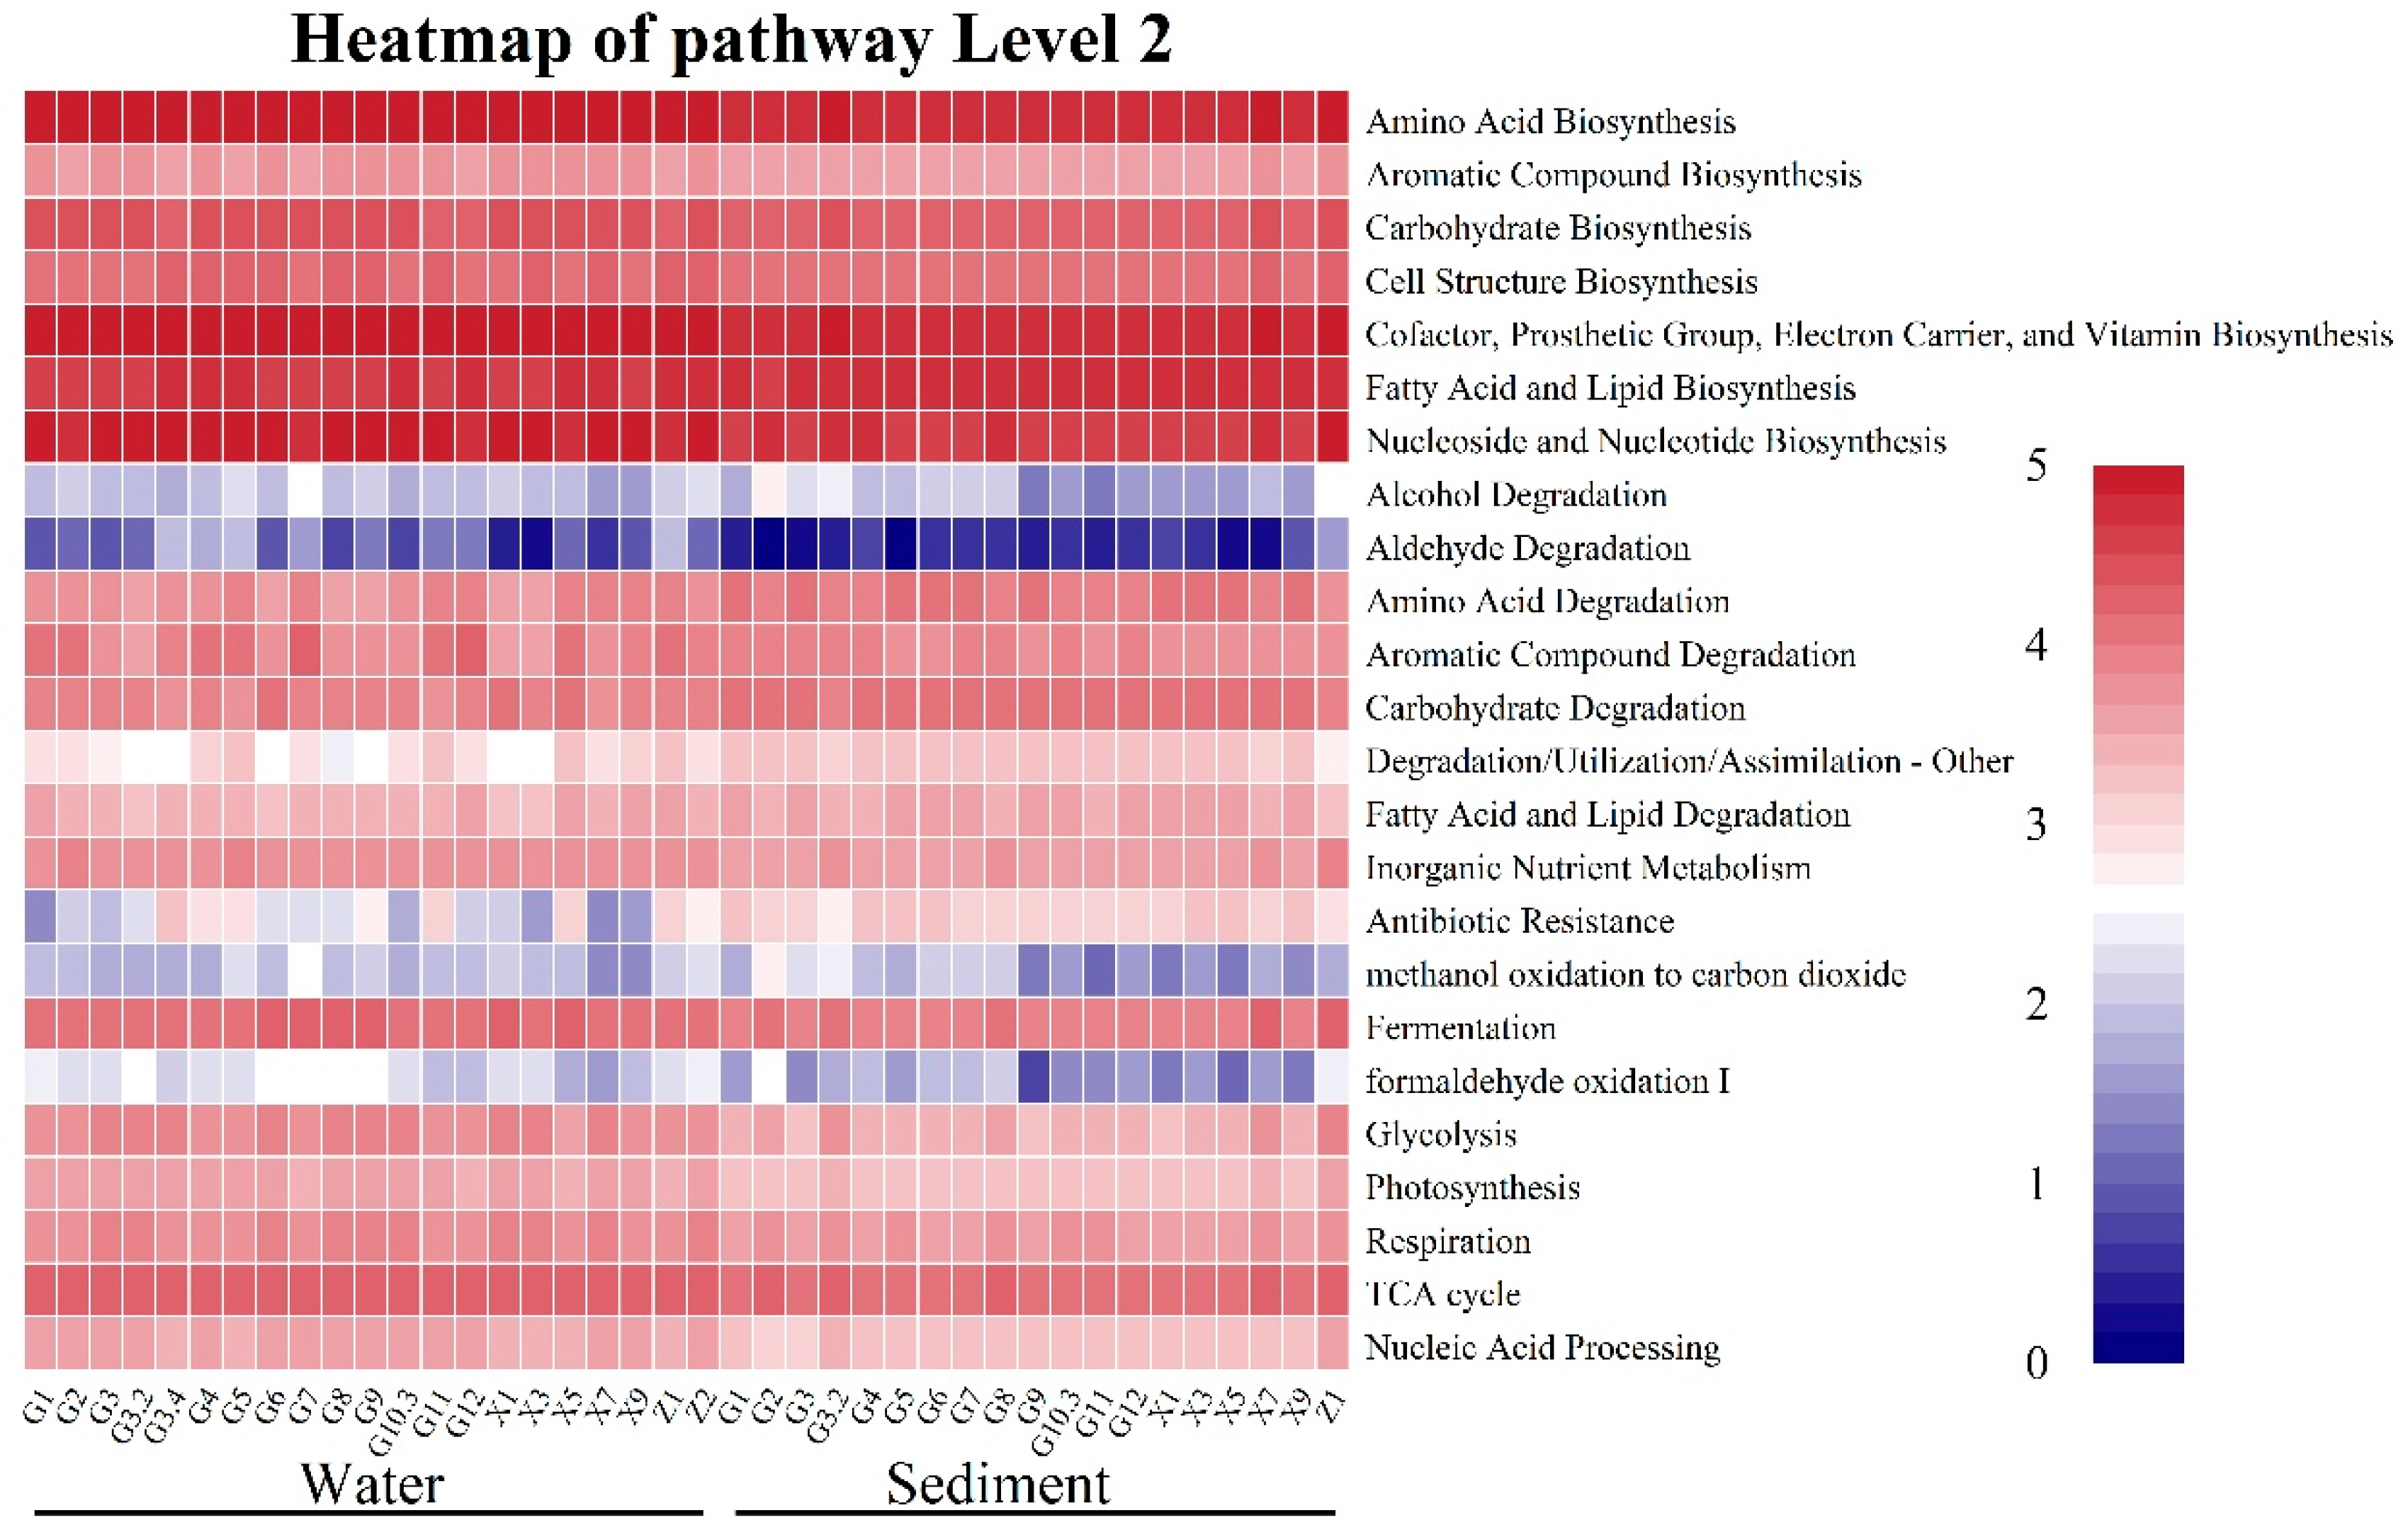
3.5. Functional Prediction of Microbial Functional Groups Under the Effects of WSR

The annotation results from different sequences of impacted surface water and sediment before WSR (Figure 6) obtained a total of 45 microbial metabolic functional groups, and further analyses were carried out on 24 representative functional groups. In general, the functions of the pre-WSR surface water and sediment microorganisms were mostly related to amino acid biosynthesis; cofactor, prosthetic group, electron carrier, and vitamin biosynthesis; fatty acid and lipid biosynthesis; and nucleoside and nucleotide biosynthesis functional groups. The relative abundance of amino acid degradation and aromatic compound degradation functional groups was higher in the surface water before WSR, especially in the G9 and X5 parts, and aldehyde degradation was also more abundant at these two points than at other points. The sedimentary nucleoside and nucleotide biosynthesis, amino acid degradation, and antibiotic resistance functional groups in the sediments were relatively more abundant.
The annotation results of different sequences affecting surface water and sediment after WSR can be found in Figure 7. Basically, the changes in microbial functional groups were consistent in the surface water, and the functions of microbes in the sediment were mostly related to amino acid biosynthesis; cofactor, prosthetic group, electron carrier, and vitamin biosynthesis; fatty acid and lipid biosynthesis; and nucleoside and nucleotide biosynthesis functional groups. However, some functions differed between their pre- and post-WSR effects [18]. The relative abundance of the aldehyde degradation and antibiotic resistance functional groups increased, and the relative abundance of the photosynthesis and response functional groups decreased due to WSR. After WSR, the relative abundance of formaldehyde oxidation I, methanol oxidation to carbon dioxide, antibiotic resistance, aldehyde degradation, photosynthesis, and respiration was higher than that pre-WSR. This is probably because the microbial function was better suited for the growth of algae in the water column at higher temperatures after WSR and increased the activity of the associated microbial enzymes.

4. Discussion

4.1. Differential Characterisation of Surface Water and Sediment Communities Under Shifting Water and Sediment Changes

Bacteria in surface water and sediments are essential in the transformation of nutrients in aquatic ecosystems [27]. Changes in microbial community diversity, abundance, composition, and function are among the primary effects of pollution on surface water bacteria. Bacteria in surface water have high growth rates and good metabolism and are highly responsive to chemical pollution inputs [28]. As the Yellow River flows through the Loess Plateau, the concentration of suspended sediment in the river increases, and as a consequence, it has become the river with the highest concentration of suspended sediment on Earth [29]. When the flow rate reaches a certain threshold, sediment is suspended in the water and becomes a part of the material cycle of aquatic ecosystems [27]. An appropriate increase in sediment particles helps to form a stable microbial community structure [30]. Our results showed that bacteria in surface water in the middle and lower reaches of the Yellow River basin were more active than those in its sediment, and this suggested that microorganisms may play a more important role in nutrient transformation in water ecosystems than in sediment.
The water bodies in the middle and lower reaches of the Yellow River were heavily polluted (Table 1), in which Proteobacteria occupied the highest abundance of microbial communities in both the surface water and sediments. Research has shown that the high abundance of Proteobacteria is related to the high nutrients in the water [31]. In addition, the increased concentration of suspended sediment under the effect of WSR, the high turbidity, and the low light transmittance of the Yellow River water body also affect the growth of photosynthetic bacteria. Accordingly, Cyanobacteria and Chloroflexi, representing photosynthetic bacteria, appeared less frequently in the sediments (Figure 2c,d). At the genus level, Pseudomonas, hgcI clade, CL500-29-marine-group, Deinococcus, and Acinetobacter dominated in the surface water; Pseudomonas was the dominant genus in the sediment; and Pseudomonas in the surface water and sediment occupied a relatively high relative abundance (Figure 3). Some studies have found that the hgcI clade and CL500-29-marine-group were suitable for living in freshwater environments, and were the dominant microbial genera in eutrophic lakes and rivers contaminated with organic matter, nitrogen, and phosphorus [32].
Sediment bacterial diversity showed significant variability (p < 0.05) (Figure 5b), with the Chao1 index and Shannon index being significantly better before WSR than after WSR. This was probably due to the slow flow rate and weak sediment dilution capacity after the effect of WSR [20]. In previous studies, the main factor influencing microbial communities was the temperature difference between different stages of WSR in rivers [33]. Before WSR, the temperature of the sediments was higher than that of the surface water, which benefited the growth of microorganisms. In addition, the degradation of plants and algae that grow after WSR can enhance microbial growth in pre-WSR sediment. Therefore, these bacteria may be involved in organic matter degradation as well as carbon and nitrogen cycling processes, thereby increasing species diversity [34].
In the middle and lower reaches of the Yellow River basin, surface water bacteria were more active than those in the sediments and are essential in the transformation of nutrients in the water ecosystem. Proteobacteria was most abundant in the extensively polluted middle and lower reaches of the Yellow River, which was associated with the high nutrient status of the water. In addition, the high turbidity and low light transmission of the Yellow River after WSR would also influence the proliferation of photosynthetic bacteria in the watershed. Before and after WSR, the diversity of microbial communities in sediments exhibited substantial variation, which might be attributable to slowed water flow and diminished sediment dilution capacity. These microorganisms may be involved in organic matter degradation as well as carbon and nitrogen cycling, thereby enhancing species diversity.

4.2. Response Analysis of the Effects of Environmental Factors on Microbial Communities in the Pre- and Post-WSR Periods

Microbial communities are known to be one of the main decomposers in river ecosystems and are crucial to the carbon, nitrogen, and phosphorus biogeochemical cycles [35]. Microbial community number and community structure are closely related to water quality physicochemical factors, such as light, water temperature, pH, conductivity, and redox potential [36]. In addition, the trophic structure of the water body can crucially affect the growth of the microbial community. Previous research has shown that water temperature greatly affects the structure of microbial communities in rivers [37]. TP was demonstrated to be a significant factor in determining alterations in the microbial community (Figure 4). There was a significant difference in TP content before and after WSR (p < 0.01), resulting in microbial community alterations before and after WSR (Table 1). Phosphorus, a key component of biological metabolism in rivers, is quite sensitive to eutrophication [14]. The effect of WSR caused fine-grained sediment carrying many nutrients to be suspended in the river channel, which led to decreased levels of TN, TP, etc., in the sediments and increased nutrient levels in the waters (increased concentration of NO2 and NH4+) (Table 1).
WSR has not only altered the water and sediment transport characteristics of rivers and downstream streams, as well as the topography and geomorphology of rivers, but has also altered nutrient concentrations and transfer processes via sediment transport and streambed scouring, thereby influencing the downstream microbial community structure and ecological environments [38,39]. To ascertain a more precise correlation analysis between water environmental factors and microbial community composition, RDAs were conducted for surface water and sediment samples separately. The RDA results showed that TP was the primary factor substantially associated with changes in sediment microbial communities during WSR, with dissolved inorganic nitrogen concentration (NH4+) also significantly contributing to changes in microbial community composition (Figure 4b). This suggests that nitrogen is another important factor, which is consistent with previous studies on freshwater rivers [40,41]. In addition, WT and DO were the primary determinants of the microbial structure of freshwater streams (p < 0.01) [37]. As reported in previous studies, DO also contributes to alterations in the total composition of microbial communities [42,43].
In conclusion, the significant difference in TP content before and after WSR caused changes in microbial communities, showing that TP is an essential determinant of microbial community changes in the middle and lower Yellow River basin reaches. Fine-grained sediment was dispersed in the river channel as a result of WSR, resulting in a decrease in the TN and TP content of the sediment and an increase in the nutrient content of the surface water (increased concentration of NO2 and NH4+). The RDA showed that TP and dissolved inorganic nitrogen concentration (NH4+) significantly influenced the microbial community shifts in the sediments.

4.3. Effect of WSR on the Functional Group Compositions of the Microbial Community

Changes in the composition of the microbial functional groups were influenced by alterations in environmental factors in the basin water, which were caused by WSR. According to the results, all functional categories of microbial communities affected by WSR were distinct. Before WSR, the relative abundance of the microbial functional groups was higher in the surface water than in sediments. The KEGG analysis showed that the main functions of microorganisms prior to WSR were biosynthesis, degradation, utilisation, assimilation, generation of precursor metabolite and energy, and macromolecule modification (Figure 6). This was comparable to the primary functions of the microbial communities during typical seasons in other North Chinese rivers [44]. After WSR, the concentration of suspended particulates in the water increased, the water became turbid, and DO decreased, causing detoxification, the glycan pathway, and the metabolic cluster to become the primary functional groups (Figure 7). The nitrogen and phosphorus cycle, WT, DO, salinity, and organic matter were among the environmental parameters influencing the functional distribution of microbial communities in the river [45]. However, sediment was more affected by WSR than surface water, and WSR disrupted the original sediment morphology, being highly disturbed by hydrodynamic factors and organic matter in sediments being suspended in the water, resulting in functional changes in the sediment microbial community (Figure 6 and Figure 7). This suggests that the microbial community adsorbed on sediments is sensitive to disturbances in water flow.
The composition of the microbial community functional groups accurately reflected the microbial responses to environmental changes [46]. According to a functional prediction of the KEGG pathway, the functional group composition of bacteria in rivers was dominated by the biosynthesis of amino acids, aromatics, and carbohydrates, which were closely related to nitrogen and carbon cycling. The abundance of the phosphorus metabolome was low, which was predominantly related to the low content of TP in the rivers (Table 1). Hydrodynamic disturbances influenced the sediment as a result of WSR and caused phosphorus that would otherwise be adsorbed to the sediment to be suspended in the water. Moreover, phosphorus concentrations increased in some reaches, along with the relative abundance of phosphorus-metabolising communities in some of these reaches. In addition, there were other functional groups of inorganic nutrient metabolism, such as the TCA cycle.
Overall, WSR influenced the composition of microbial functional groups, which manifested primarily in altered microbial community functions in surface water and detritus, thereby influencing nutrient transformations in the watershed. Although the annotation results were limited, the evaluation of the overall functional improvements of ecologically healthy microbial communities in rivers remains highly promising.

5. Conclusions

WSR has substantially altered the hydrological processes, sediment transport, channel erosion, and sediment deposition conditions of the middle and lower Yellow River basin. We analysed the influence of WSR on the structural and functional characteristics of the microbial community in the middle and lower reaches of the Yellow River basin by studying the structural characteristics of the microbial community and the response relationships of environmental factors.
Due to the Yellow River’s characteristic of high suspended sediment content, the riverbed sediment was washed away after WSR, which devastated the original ecological environment and led to the resuspension of riverbed sediment in the water. However, water environmental factors such as TN, TP, and CODMn were partially purified after WSR. The microbial community structure of the surface water in the middle and lower reaches of the Yellow River basin was mostly composed of Proteobacteria, Actinobacteria, Bacteroidetes, and Firmicutes. The sediment microbial community composition was dominated by Proteobacteria. The RDA showed that the surface water microbial community was significantly correlated with the water environmental factors DO (p < 0.01) and NH4+ (p < 0.05), whereas the sediment microbial community was significantly correlated with the water environmental factors WT, TP, and DO (p < 0.05).The surface water microbial community’s Chao1 richness index and Shannon diversity were much higher than those of the sediments (163.07% and 75.99%, respectively), as the surface water and sediment’s microbial Chao1 richness indices significantly decreased by 26.36%, and 58.77%, respectively, and the surface water and sediment’s microbial Shannon diversity indices significantly decreased by 10.66% and 79.70%, respectively, after WSR. As a result of the decline in surface water dissolved oxygen following WSR, anaerobic bacteria became the predominant microbial functional group. This difference in microbial functional group composition between the surface water and sediment was likely due to the close relationship between TP and the functional group composition of the microbial community in the sediment. This study may provide fundamental data for future efforts to assess the ecological conditions of the river. Furthermore, future work should consider other anthropogenic factors in the watershed, such as the utilisation of agricultural land and the construction of hydraulic projects for adjustment, as a way to balance the relationship between society and the environment.

Author Contributions

Q.H.: Data curation; formal analysis; investigation; methodology; visualisation; writing—original draft. J.Z.: Conceptualization; funding acquisition; investigation; project administration; resources; supervision; visualisation; writing—review and editing. J.W.: Investigation; writing—review and editing. Q.H.: Investigation; writing—review and editing. C.X.: Funding acquisition; supervision. Z.F.: Funding acquisition; supervision. Y.L., D.L. and H.L.: Investigation. All authors have read and agreed to the published version of the manuscript.

Funding

This research was supported by the National Key Research and Development Plan (No. 2022YFC3204900), the NSFC-DFG Collaborative Research Program of the National Natural Science Foundation of China (No. 52061135104), and the Natural Science Foundation of Shandong Province (No. ZR2021MD017).

Institutional Review Board Statement

Not applicable.

Data Availability Statement

Data will be made available on request.

Conflicts of Interest

The authors declare that they have no known competing financial interests or personal relationships that could have appeared to influence the work reported in this paper.

References

  1. Zhang, K.; Dong, Z.; Guo, L.; Boyer, E.W.; Liu, J.; Chen, J.; Fan, B. Coupled coordination spatiotemporal analyses inform sustainable development and environmental protection for the Yellow River Basin of China. Ecol. Indic. 2023, 151, 110283. [Google Scholar] [CrossRef]
  2. Xia, C.; Pahl-Wostl, C. The Development of Water Allocation Management in The Yellow River Basin. Water Resour. Manag. 2012, 26, 3395–3414. [Google Scholar] [CrossRef]
  3. Wang, Y.; Wu, B.; Shen, G. Adjustment in the main-channel geometry of the lower Yellow River before and after the operation of the Xiaolangdi Reservoir from 1986 to 2015. J. Geogr. Sci. 2019, 74, 2411–2427. [Google Scholar] [CrossRef]
  4. Bai, T.; Ma, P.-P.; Kan, Y.-B.; Huang, Q. Ecological risk assessment based on IHA-RVA in the lower Xiaolangdi reservoir under changed hydrological situation. IOP Conf. Ser. Earth Environ. Sci. 2017, 100, 012214. [Google Scholar] [CrossRef]
  5. Liu, J.; Engel, B.A.; Zhang, G.; Wang, Y.; Wu, Y.; Zhang, M.; Zhang, Z. Hydrological connectivity: One of the driving factors of plant communities in the Yellow River Delta. Ecol. Indic. 2020, 112, 106150. [Google Scholar] [CrossRef]
  6. Padmalal, D.; Maya, K.; Padmalal, D.; Maya, K. Rivers-structure and functions. In Sand Mining: Environmental Impacts and Selected Case Studies; Springer: Dordrecht, The Netherlands, 2014; pp. 9–22. [Google Scholar] [CrossRef]
  7. Xu, N.; Hu, H.; Wang, Y.; Zhang, Z.; Zhang, Q.; Ke, M.; Lu, T.; Penuelas, J.; Qian, H. Geographic patterns of microbial traits of river basins in China. Sci. Total Environ. 2023, 871, 162070. [Google Scholar] [CrossRef]
  8. Ji, B.; Liang, J.; Ma, Y.; Zhu, L.; Liu, Y. Bacterial community and eutrophic index analysis of the East Lake. Environ. Pollut. 2019, 252, 682–688. [Google Scholar] [CrossRef] [PubMed]
  9. Caracciolo, A.B.; Bottoni, P.; Grenni, P. Microcosm studies to evaluate microbial potential to degrade pollutants in soil and water ecosystems. Microchem. J. 2013, 107, 126–130. [Google Scholar] [CrossRef]
  10. Hong, Y.; Yan, P.; Li, M.; Wei, G.; Li, H.; Gao, Z. Molecular Fingerprint and Dominant Environmental Factors of Nitrite-Dependent Anaerobic Methane-Oxidizing Bacteria in Sediments from the Yellow River Estuary, China. PLoS ONE 2015, 10, e137996. [Google Scholar] [CrossRef]
  11. Jin, Z.; Ji, F.-Y.; Xu, X.; Xu, X.-Y.; Chen, Q.-K.; Li, Q. Microbial and metabolic characterization of a denitrifying phosphorus-uptake/side stream phosphorus removal system for treating domestic sewage. Biodegradation 2014, 25, 777–786. [Google Scholar] [CrossRef] [PubMed]
  12. Zhang, M.; Wu, Z.; Sun, Q.; Ding, Y.; Ding, Z.; Sun, L. The spatial and seasonal variations of bacterial community structure and influencing factors in river sediments. J. Environ. Manag. 2019, 248, 109293. [Google Scholar] [CrossRef] [PubMed]
  13. Zhao, M.M.; Chen, Y.-p.; Xue, L.-g.; Fan, T.T.; Emaneghemi, B. Greater health risk in wet season than in dry season in the Yellow River of the Lanzhou region. Sci. Total Environ. 2018, 644, 873–883. [Google Scholar] [CrossRef] [PubMed]
  14. Wang, L.; Zhang, J.; Li, H.; Yang, H.; Peng, C.; Peng, Z.; Lu, L. Shift in the microbial community composition of surface water and sediment along an urban river. Sci. Total Environ. 2018, 627, 600–612. [Google Scholar] [CrossRef]
  15. Gao, F.-Z.; He, L.-Y.; Hu, L.-X.; Chen, J.; Yang, Y.-Y.; Zou, H.-Y.; He, L.-X.; Bai, H.; Liu, Y.-S.; Zhao, J.-L.; et al. Anthropogenic activities and seasonal properties jointly drive the assemblage of bacterial communities in subtropical river basins. Sci. Total Environ. 2022, 806, 151476. [Google Scholar] [CrossRef]
  16. Perkins, T.L.; Clements, K.; Baas, J.H.; Jago, C.F.; Jones, D.L.; Malham, S.K.; McDonald, J.E. Sediment composition influences spatial variation in the abundance of human pathogen indicator bacteria within an estuarine environment. PLoS ONE 2014, 9, e112951. [Google Scholar] [CrossRef] [PubMed]
  17. Xia, N.; Xia, X.; Zhu, B.; Zheng, S.; Zhuang, J. Bacterial diversity and community structure in the sediment of the middle and lower reaches of the Yellow River, the largest turbid river in the world. Aquat. Microb. Ecol. 2013, 71, 43–55. [Google Scholar] [CrossRef]
  18. Song, J.; Yi, Y.; Gao, Y.; Zhou, Y.; Liu, Q. How the flow and sediment pulse influencing the distribution and functional gene composition of bacterial communities? Case study of the lower Yellow River, China. Ecol. Indic. 2022, 145, 109599. [Google Scholar] [CrossRef]
  19. Song, J.; Hou, C.; Liu, Q.; Wu, X.; Wang, Y.; Yi, Y. Spatial and temporal variations in the plankton community because of water and sediment regulation in the lower reaches of Yellow River. J. Clean. Prod. 2020, 261, 120972. [Google Scholar] [CrossRef]
  20. de Oliveira, L.F.; Margis, R. The source of the river as a nursery for microbial diversity. PLoS ONE 2015, 10, e0120608. [Google Scholar] [CrossRef] [PubMed]
  21. Wu, X.; Xi, W.; Ye, W.; Yang, H. Bacterial community composition of a shallow hypertrophic freshwater lake in China, revealed by 16S rRNA gene sequences. FEMS Microbiol. Ecol. 2007, 61, 85–96. [Google Scholar] [CrossRef]
  22. Li, J.; Chen, Q.; Li, Q.; Zhao, C.; Feng, Y. Influence of plants and environmental variables on the diversity of soil microbial communities in the Yellow River Delta Wetland, China. Chemosphere 2021, 274, 129967. [Google Scholar] [CrossRef]
  23. Kondolf, G.M.; Gao, Y.; Annandale, G.W.; Morris, G.L.; Jiang, E.; Zhang, J.; Cao, Y.; Carling, P.; Fu, K.; Guo, Q.; et al. Sustainable sediment management in reservoirs and regulated rivers: Experiences from five continents. Earth’s Future 2014, 2, 256–280. [Google Scholar] [CrossRef]
  24. Lintern, A.; Webb, J.A.; Ryu, D.; Liu, S.; Bende-Michl, U.; Waters, D.; Leahy, P.; Wilson, P.; Western, A.W. Key factors influencing differences in stream water quality across space. WIREs Water 2017, 5, e1260. [Google Scholar] [CrossRef]
  25. Zhao, Q.; Ding, S.; Lu, X.; Liang, G.; Hong, Z.; Lu, M.; Jing, Y. Water-sediment regulation scheme of the Xiaolangdi Dam influences redistribution and accumulation of heavy metals in sediments in the middle and lower reaches of the Yellow River. Catena 2022, 210, 105880. [Google Scholar] [CrossRef]
  26. Lu, L.; Zou, X.; Yang, J.; Xiao, Y.; Wang, Y.; Guo, J.; Li, Z. Biogeography of eukaryotic plankton communities along the upper Yangtze River: The potential impact of cascade dams and reservoirs. J. Hydrol. 2020, 590, 125495. [Google Scholar] [CrossRef]
  27. Feng, L.; Zhang, Z.; Yang, G.; Wu, G.; Yang, Q.; Chen, Q. Microbial communities and sediment nitrogen cycle in a coastal eutrophic lake with salinity and nutrients shifted by seawater intrusion. Environ. Res 2023, 225, 115590. [Google Scholar] [CrossRef] [PubMed]
  28. Sagova-Mareckova, M.; Boenigk, J.; Bouchez, A.; Cermakova, K.; Chonova, T.; Cordier, T.; Eisendle, U.; Elersek, T.; Fazi, S.; Fleituch, T.; et al. Expanding ecological assessment by integrating microorganisms into routine freshwater biomonitoring. Water Res. 2021, 191, 116767. [Google Scholar] [CrossRef] [PubMed]
  29. Wang, H.; Yang, Z.; Saito, Y.; Liu, J.P.; Sun, X.; Wang, Y. Stepwise decreases of the Huanghe (Yellow River) sediment load (1950–2005): Impacts of climate change and human activities. Glob. Planet. Chang. 2007, 57, 331–354. [Google Scholar] [CrossRef]
  30. Fang, H.; Huang, L.; Zhao, H.; Cheng, W.; Chen, Y.; Fazeli, M.; Shang, Q.; Fang, H.; Huang, L.; Zhao, H. Surface Micro-morphology and Adsorption Properties of Sediment Particles. In Mechanics of Bio-Sediment Transport; Springer: Berlin/Heidelberg, Germany, 2020; pp. 1–79. [Google Scholar] [CrossRef]
  31. Chen, B.; Yu, K.; Liao, Z.; Yu, X.; Qin, Z.; Liang, J.; Wang, G.; Wu, Q.; Jiang, L. Microbiome community and complexity indicate environmental gradient acclimatisation and potential microbial interaction of endemic coral holobionts in the South China Sea. Sci. Total Environ. 2021, 765, 142690. [Google Scholar] [CrossRef]
  32. Ruprecht, J.E.; Birrer, S.C.; Dafforn, K.A.; Mitrovic, S.M.; Crane, S.L.; Johnston, E.L.; Wemheuer, F.; Navarro, A.; Harrison, A.J.; Turner, I.L.; et al. Wastewater effluents cause microbial community shifts and change trophic status. Water Res. 2021, 200, 117206. [Google Scholar] [CrossRef] [PubMed]
  33. Su, Z.; Dai, T.; Tang, Y.; Tao, Y.; Huang, B.; Mu, Q.; Wen, D. Sediment bacterial community structures and their predicted functions implied the impacts from natural processes and anthropogenic activities in coastal area. Mar. Pollut. Bull. 2018, 131, 481–495. [Google Scholar] [CrossRef]
  34. Cruaud, P.; Vigneron, A.; Fradette, M.S.; Dorea, C.C.; Culley, A.I.; Rodriguez, M.J.; Charette, S.J. Annual bacterial community cycle in a seasonally ice-covered river reflects environmental and climatic conditions. Limnol. Oceanogr. 2020, 65, S21–S37. [Google Scholar] [CrossRef]
  35. Johansen, J.E.; Binnerup, S.J. Contribution of cytophaga-like bacteria to the potential of turnover of carbon, nitrogen, and phosphorus by bacteria in the rhizosphere of barley (Hordeum vulgare L.). Microb. Ecol. 2002, 43, 298–306. [Google Scholar] [CrossRef]
  36. Yi, Y.; Lin, C.; Wang, W.; Song, J. Habitat and seasonal variations in bacterial community structure and diversity in sediments of a Shallow lake. Ecol. Indic. 2021, 120, 106959. [Google Scholar] [CrossRef]
  37. Lindstrom, E.S.; Kamst-Van Agterveld, M.P.; Zwart, G. Distribution of typical freshwater bacterial groups is associated with pH, temperature, and lake water retention time. Appl. Environ. Microbiol. 2005, 71, 8201–8206. [Google Scholar] [CrossRef] [PubMed]
  38. Hou, C.; Yi, Y.; Song, J.; Zhou, Y. Effect of water-sediment regulation operation on sediment grain size and nutrient content in the lower Yellow River. J. Clean. Prod. 2021, 279, 123533. [Google Scholar] [CrossRef]
  39. Li, X.; Chen, H.; Jiang, X.; Yu, Z.; Yao, Q. Impacts of human activities on nutrient transport in the Yellow River: The role of the Water-Sediment Regulation Scheme. Sci. Total Environ. 2017, 592, 161–170. [Google Scholar] [CrossRef]
  40. Hayden, C.J.; Beman, J.M. Microbial diversity and community structure along a lake elevation gradient in Yosemite National Park, California, USA. Environ. Microbiol. 2016, 18, 1782–1791. [Google Scholar] [CrossRef] [PubMed]
  41. Ibekwe, A.M.; Ma, J.; Murinda, S.E. Bacterial community composition and structure in an Urban River impacted by different pollutant sources. Sci. Total Environ. 2016, 566–567, 1176–1185. [Google Scholar] [CrossRef]
  42. Kirchman, D.; Dittel, A.; Findlay, S.; Fischer, D. Changes in bacterial activity and community structure in response to dissolved organic matter in the Hudson River, New York. Aquat. Microb. Ecol. 2004, 35, 243–257. [Google Scholar] [CrossRef]
  43. Winter, C.; Hein, T.; Kavka, G.; Mach, R.L.; Farnleitner, A.H. Longitudinal changes in the bacterial community composition of the Danube River: A whole-river approach. Appl. Environ. Microbiol. 2007, 73, 421–431. [Google Scholar] [CrossRef] [PubMed]
  44. Cai, Y.; Zhang, X.; Li, G.; Dong, J.; Yang, A.; Wang, G.; Zhou, X. Spatiotemporal distributions and environmental drivers of diversity and community structure of nosZ-type denitrifiers and anammox bacteria in sediments of the Bohai Sea and North Yellow Sea, China. J. Oceanol. Limnol. 2019, 37, 1211–1228. [Google Scholar] [CrossRef]
  45. Lin, Q.; Zhang, Y.; Marrs, R.; Sekar, R.; Luo, X.; Wu, N. Evaluating ecosystem functioning following river restoration: The role of hydromorphology, bacteria, and macroinvertebrates. Sci. Total Environ. 2020, 743, 140583. [Google Scholar] [CrossRef]
  46. Bae, H.S.; Huang, L.; White, J.R.; Wang, J.; DeLaune, R.D.; Ogram, A. Response of microbial populations regulating nutrient biogeochemical cycles to oiling of coastal saltmarshes from the Deepwater Horizon oil spill. Environ. Pollut 2018, 241, 136–147. [Google Scholar] [CrossRef]
Figure 1. Distribution of sampling points in the middle and lower reaches of the Yellow River (a) and Xiaolangdi Reservoir (b). Note: Tributary section including Z1, Z2 (a).
Diversity 17 00041 g001
Figure 2. Bacterial communities in surface water and sediment at phylum level in pre- and post-WSR samples. Note: Pre-WSR surface water (a), pre-WSR sediment (b), post-WSR surface water (c), and post-WSR sediment (d).
Diversity 17 00041 g002
Figure 3. Microbial communities at genus level in surface water and sediment in pre- and post-WSR. Note: Pre-WSR surface water (a), pre-WSR sediment (b), post-WSR surface water (c), and post-WSR sediment (d).
Diversity 17 00041 g003
Figure 4. RDA of microbial community phylum levels in surface water (a) and sediment (b) between pre- and post-WSR samples in the middle and lower reaches of the Yellow River in relation to environmental factors. Note: Pro: Proteobacteria; Act: Actinobacteria; Bac: Bacteroidetes; Fir: Firmicutes; Cya: Cyanobacteria; Chl: Chloroflex; Act: Acidobacteria.
Diversity 17 00041 g004
Figure 5. The α-diversity of surface water and sediments in middle and lower reaches of the Yellow River pre- and post-WSR ((a) Chao1; (b) Shannon. W: Surface water; S: sediment).
Diversity 17 00041 g005
Figure 6. Functional prediction of KEGG pathway Level 2 in pre-WSR microbial communities in the middle and lower reaches of the Yellow River.
Diversity 17 00041 g006
Figure 7. Functional prediction of KEGG pathway Level 2 for the post-WSR microbial communities in the middle and lower reaches of the Yellow River.
Diversity 17 00041 g007
Table 1. Differences in physical and chemical indicators of surface water in middle and lower reaches of the Yellow River in pre- and post-WSR periods.
Environmental FactorWSRFp Values
PrePost
Min–MaxMedianMin–MaxMedian
pH7.87–8.618.378.23–8.608.420.0160.899
WT (°C)10.5–22.517.120.5–25.723.920.3390.000 *
DO (mg/L)7.7–11.19.56.9–10.48.00.0870.769
Tur (NTU)0.5–758.059.57.1–688.0140.60.0380.847
EC (μs/cm)578–630602550–656636.50.0880.768
TSS (g/L)0.001–2.6490.1660.002–3.1820.1470.2860.595
TN (mg/L)4.63–7.076.023.05–8.384.290.1070.745
TP (mg/L)0.25–9.591.840.01–0.800.0851.1280.000 *
NO3 (mg/L)3.60–4.534.011.11–3.472.993.1810.081
NO2 (mg/L)0.04–0.080.060.007–0.0710.0210.4660.498
NH4+ (mg/L)0.01–0.140.030.03–1.100.1519.6300.000 *
PO4 (mg/L)0.002–0.0110.0070.001–0.0320.01211.6310.001 *
CODMn (mg/L)3.98–13.626.042.67–8.983.647.4100.009 *
* Significant at probability level of 0.01.
Table 2. Differences in physical and chemical indicators of XLDR surface water in pre- and post-WSR periods.
Environmental FactorWSRFp Values
PrePost
Min–MaxMedianMin–MaxMedian
pH8.57–8.618.608.41–8.718.654.1350.059
WT (°C)16.7–18.518.021.5–23.522.50.0780.784
DO (mg/L)10–11.110.77.8–10.38.33.9470.064
Tur (NTU)0.1–1.50.45.8–16.17.77.4510.015 *
EC (μs/cm)589–631607596–6506220.6550.430
TSS (g/L)0.001–0.1160.0020.001–0.0090.0014.1610.058
TN (mg/L)4.67–5.734.972.90–3.883.310.5730.460
TP (mg/L)0.35–0.740.450.03–0.130.0614.9010.001 **
NO3 (mg/L)3.30–4.363.662.65–3.233.061.3940.255
NO2 (mg/L)0.036–0.0420.0400.011–0.2880.0207.1250.017 *
NH4+ (mg/L)0.03–0.160.060.06–0.830.1931.8320.000 **
PO4 (mg/L)0.002–0.0070.0020.010–0.0210.0120.5280.478
CODMn (mg/L)4.17–6.515.383.11–4.093.454.0840.060
* Significant at probability level of 0.05; ** Significant at probability level of 0.01.
Disclaimer/Publisher’s Note: The statements, opinions and data contained in all publications are solely those of the individual author(s) and contributor(s) and not of MDPI and/or the editor(s). MDPI and/or the editor(s) disclaim responsibility for any injury to people or property resulting from any ideas, methods, instructions or products referred to in the content.

