Article

Reference Ecosystem Condition-Based Syntaxonomic Study for Ecological Restoration and Protection of Temperate Forests in South Korea

Forest Ecology Division, National Institute of Forest Science, Seoul 02455, Republic of Korea
*
Author to whom correspondence should be addressed.
Diversity 2025, 17(1), 40; https://doi.org/10.3390/d17010040
Submission received: 21 October 2024 / Revised: 10 December 2024 / Accepted: 12 December 2024 / Published: 7 January 2025
(This article belongs to the Section Biodiversity Conservation)

Abstract

:
To identify the reference ecosystem conditions of a damaged forest, we developed a community development scenario using a syntaxonomic approach. To facilitate this choice, we sought to provide a framework based on ecological theory, specifically on the relationship between vegetation and environmental properties. We identified forest composition species in 216 sample plots from Mt. Gariwang, a representative temperate deciduous forest in South Korea, and divided them into 13 species groups, including the Quercus mongolica Fisch.-Fraxinus rhynchophylla Hance community and eight vegetation types. In addition, nine major environmental properties that explain community composition, including elevation, were identified through multivariate analysis. A physiognomy map enabled the identification that the area must be large and the habitat must be continuous to help determine the reference ecosystem. In conclusion, plant–environmental interaction analysis is a valuable tool for identifying reference communities or source locations for seed migration in relation to various habitats. These reference ecosystems provide insights into the restoration of damaged areas and an overview of important considerations for restoring the relationships between biodiversity and ecosystem function.

1. Introduction

Globally, forests cover nearly one-third of the land area and contain more than 80% of terrestrial biodiversity [1]. Over 1.6 billion people’s incomes depend on forests, and sustainable forest management can contribute to the development, production, poverty eradication, and achievement of internationally agreed development goals [1,2]. However, despite strengthening efforts for sustainable forest management and conservation, forests are damaged in several ways such as by landslides, forest fires, and logging [3]. The delay in management due to various factors has exposed the surrounding areas of the damaged site to landslide risks due to eroded soil and rocks. In this regard, interest in and demand for restoration of damaged forest ecosystems are increasing, and appropriate restoration methods are being sought. Among them, methods based on the original state before damage have emerged, one of which is the use of a reference ecosystem.
A reference ecosystem is an ecological environment that must be harmonized with the surrounding ecosystem by reflecting vegetation communities with regional and locational characteristics. Vegetation communities describe vegetation patterns and assembly processes at all temporal and spatial scales. Analyzing these patterns and processes can help form structured vegetation with characteristics similar to those of vegetation communities. These communities are related to the functional composition and ecological niches where environmental properties influence species coexistence [4], and can be combined into environmental gradients that affect plant species [5]. In addition, the structural patterns of communities according to environmental gradients are determined not only by biotic factors but also by their interaction through spatial scales, such as competition [6,7]. Thus, analyzing the species composition patterns of communities has been recognized as a promising means of inferring community mechanisms crucial for an optimal spatial distribution of communities [8,9,10,11,12,13].
The spatial distribution area of the community is determined by topographical and geographical factors depending on the characteristics of each habitat, repeating a mosaic pattern depending on habitat conditions and distinguishing it from adjacent patches of different vegetation types [14,15]. In addition, estimating the relationship between environmental and spatial characteristics is essential from biological and ecological conservation perspectives; therefore, information on the distribution and dynamic changes in plant species along environmental gradients should be identified [16]. For example, the distribution of forest species may change, resulting in the geographic migration of specific vegetation zones, which is a good reference condition for explaining or estimating macroecological patterns, such as the prediction of the migration of geographic ranges [17,18,19,20,21,22]. Therefore, identifying spatial distribution characteristics is required to establish adaptation strategies for plant species considering succession tendencies [23]. To demarcate geographical areas where reference communities can be found, it is necessary to estimate habitat types based on existing habitats or biogeographic maps, which can be facilitated by accessing ecological or historical databases with higher accuracy [24].
Previous studies have compared the ecosystem processes of the restored and reference ecosystems considering the succession stage, comparing species composition and communities, and suggesting variable relationships [25,26,27]. As such, methodology studies can be the basis of a restoration plan; however, there are limited basic data that can be used as a reference ecosystem to restore large-scale damaged land. Therefore, our study aimed to provide a framework for collecting basic data on positive reference communities of species composition, vegetation structure, ecological mechanisms, ecological foundations, and ecological environments, using environmental properties that drive the community. This study targeted Mt. Gariwang, a representative temperate deciduous forest in South Korea, and aimed to (1) develop a syntaxonomic system to classify communities, (2) identify the driving factors that differentiate various communities, and (3) create a current vegetation map that can be displayed visually.

2. Materials and Methods

2.1. Study Area

The study area was distributed across two regions: HaanMi-ri, Daehwa-myeon, and Jangjeon-ri, Jinbu-myeon, Pyeongchang-gun, Gangwon-do, South Korea. Geographically, it is located at 37°25′06.58″–37°30′35.38″ N, 128°27′23.86″–128°33′52.52″ E (Figure 1). It also forms the central part of the Taebaek Mountain Range, with several high peaks, including Mt. Jungwang (1376 m) to the west, Mt. Baekseok (1365 m) to the northwest, Mt. Duta (1391 m) and Mt. Barwang (1459 m) to the northeast, Jung peak (1433 m) and Ha peak (1380 m) to the southeast, Mt. Cheongok (1256 m) and Mt. Nambyeong (1151 m) to the southwest.
The total area was approximately 4055.3 ha, including non-forested land and non-stocked areas. Topographically, it consists of relatively high mountain peaks with an average elevation of approximately 935 m, and long and short valleys. The average slope was approximately 28.4°, which was on the steep side, and there were some slopes close to the cliffs, including large rocks. According to the Korea Institute of Geoscience and Mineral Resources, the geological structure of Mt. Gariwang passes through the Paleozoic (Ordovician–Permian) and Mesozoic (Triassic) eras and is mainly composed of black and gray shale and sandstone.
Due to the hosting of the 2018 Winter Olympics, approximately 78 ha of Mt. Gariwang were damaged due to gondola construction and alpine ski resort development [28]. Before being damaged, Mt. Gariwang was a forest with a high ecological conservation value, and some areas were designated as protected. The government decided to restore the original vegetation after the Olympics, but this was still neglected because of the astronomical costs and lack of consultation with various stakeholders. Therefore, Mt. Gariwang, where the problem had not yet been resolved, was selected as a site to identify the reference ecosystem.

2.2. Climatic Characteristics

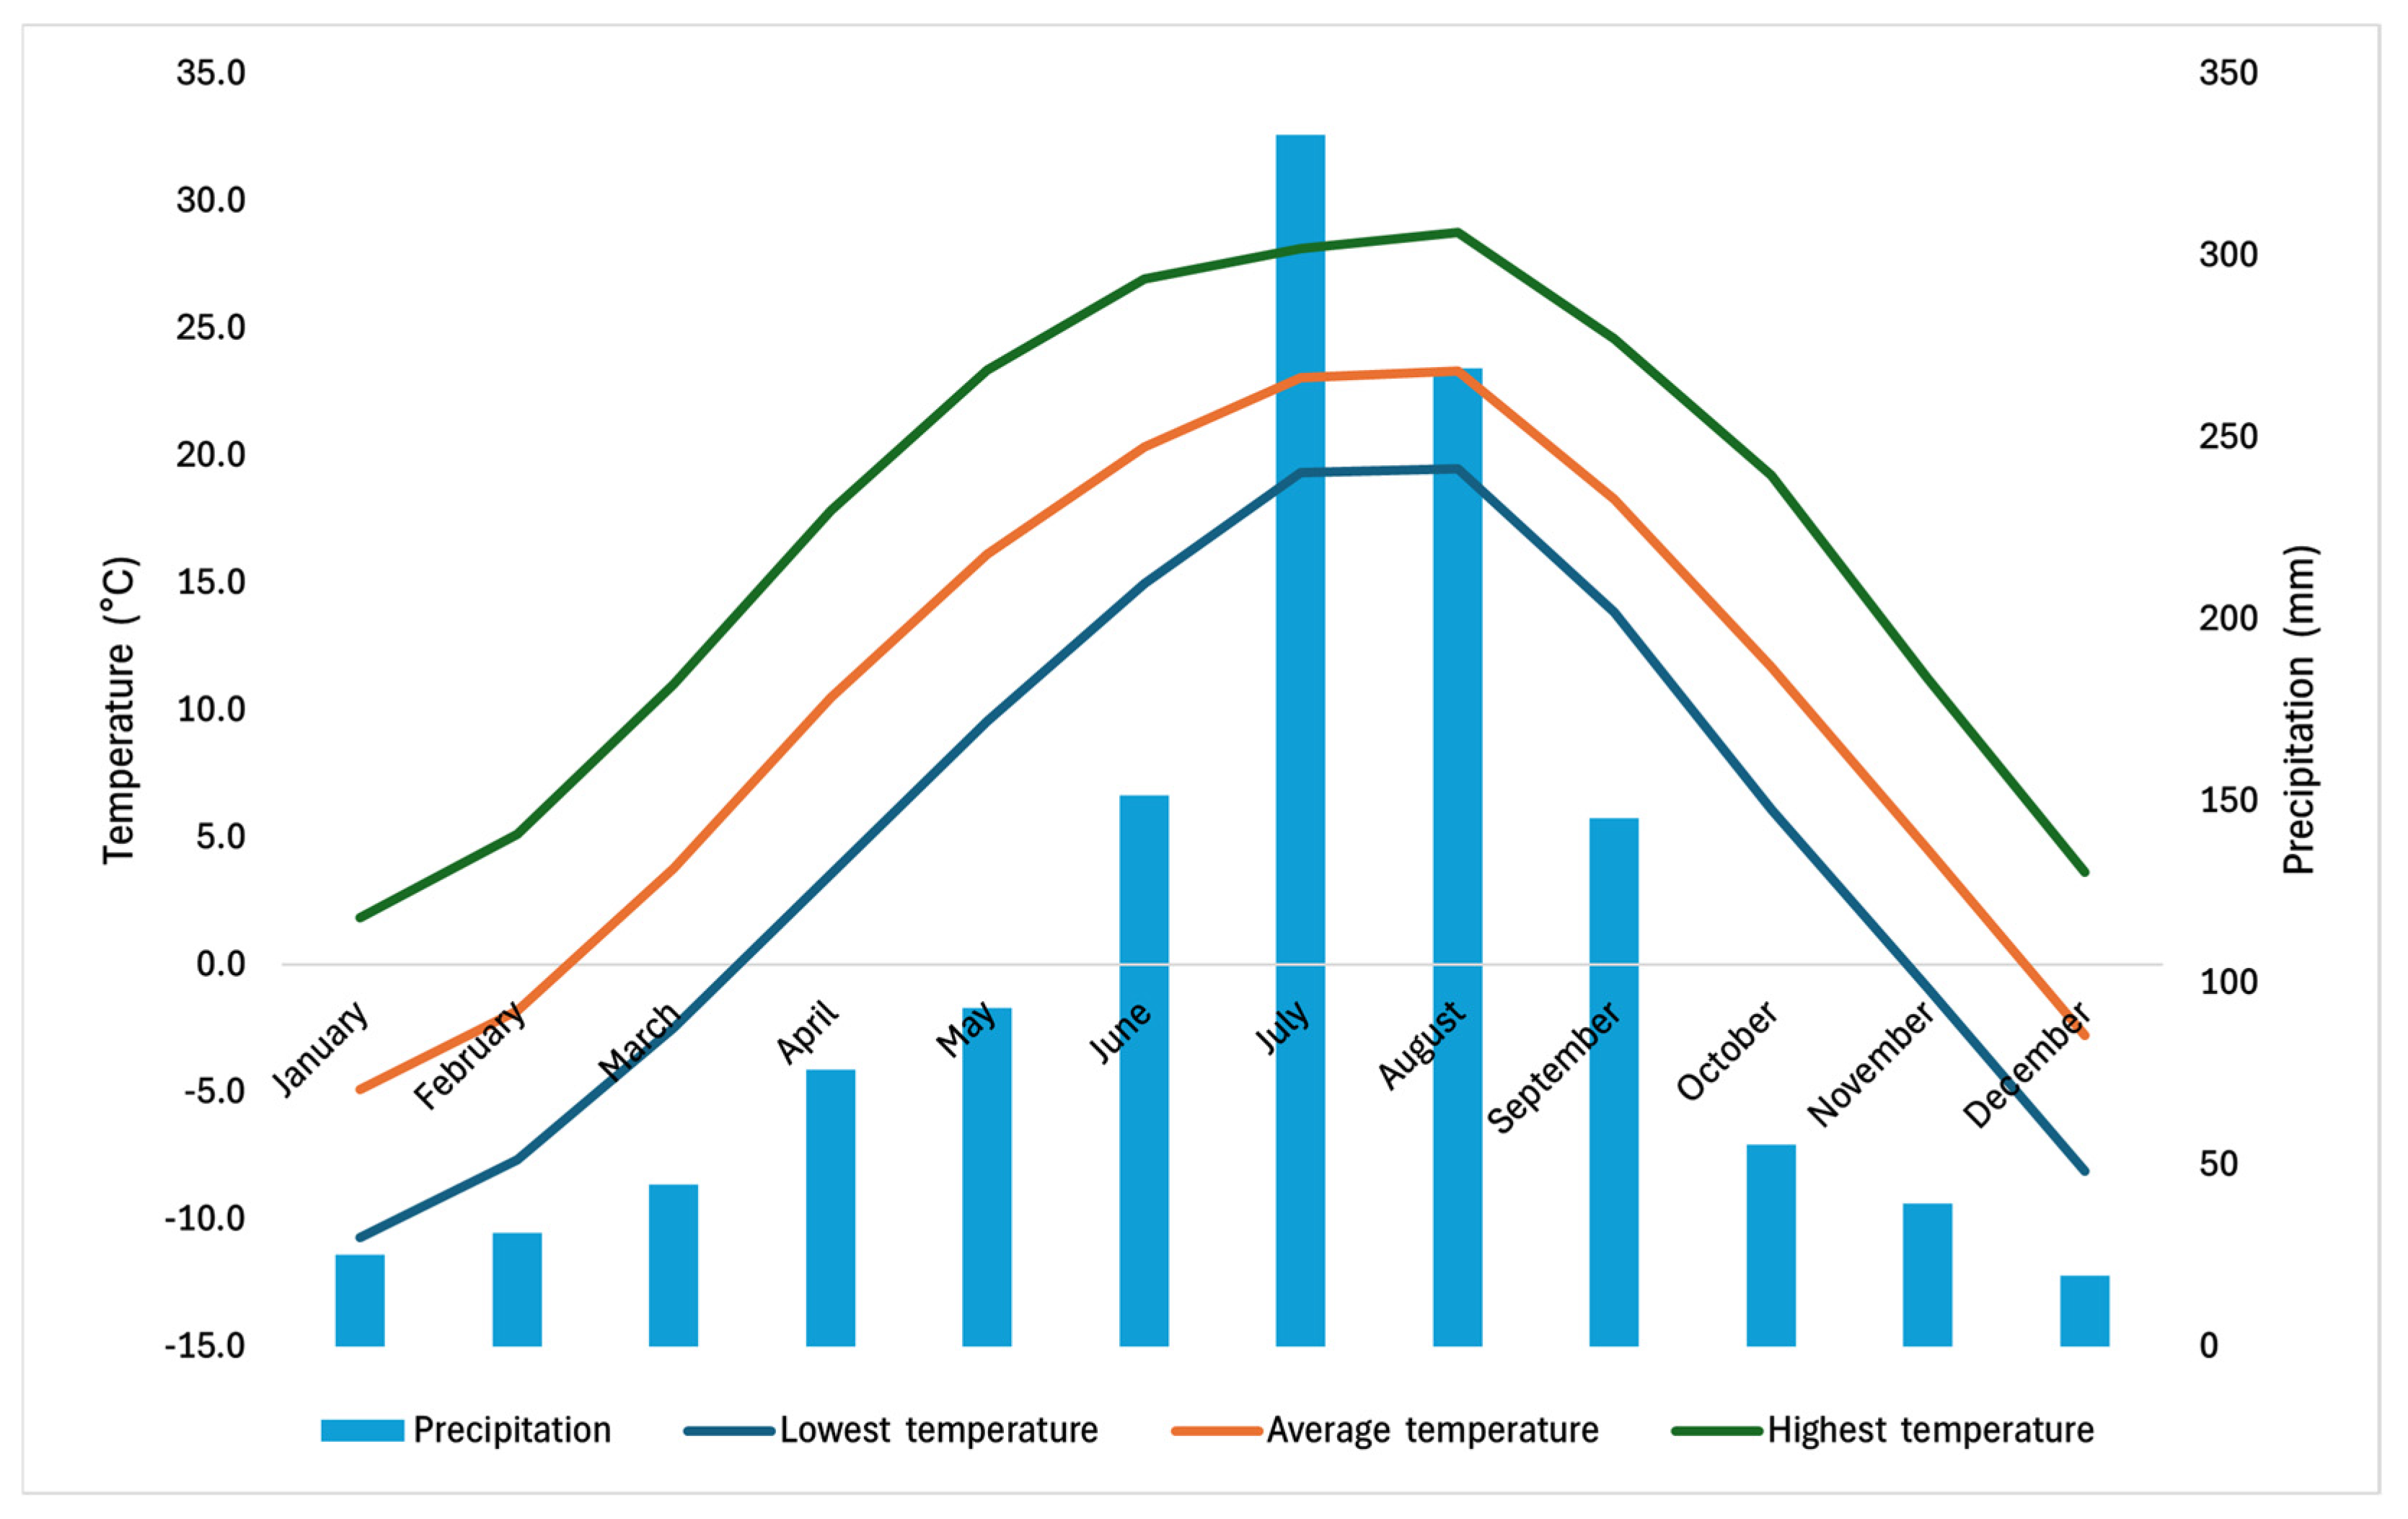
The broad-sense climate of Pyeongchang County is classified according to the Köppen–Geiger climate classification system, which divides it based on temperature range, precipitation, and detailed temperature, exhibiting a humid continental or subarctic climate with a mixture of Dwb (D: continental, w: dry winter, b: warm summer) and Dfb (D: continental, f: without dry season, b: warm summer) [29]. In the narrow-sense climate, the climatological norms for the past 30 years (1991–2020) were represented by meteorological observation equipment installed in Pyeongchang-eup, Pyeongchang-gun, Gangwon-do, South Korea (37.37748° N, 128.39469° E), which is closest to the study site (Figure 2). The average annual temperature measured was 10.2 °C, and the average temperatures in January, the coldest month, and August, the warmest month, were −4.9 and 23.3 °C, respectively. The average wind speed was 1.2 m/s, and the average annual precipitation was 1182.9 mm, with precipitation concentrated in July and August, with 310.0 mm in July and 254.3 mm in August.

2.3. Vegetation Sampling

The survey points were extracted using high-resolution aerial photographs provided by the Korea National Institute of Forest Science, satellite photographs (Resolution 2 m) of several portal sites with different filming periods, and a 1:5000 forest-type map provided by the Korea Forest Service. When extracting the plots, location information such as elevation, slope, aspect, and topography was considered for sampling, and ecological habitats with diverse biological factors were evenly included. In addition, areas that were difficult to distinguish outside the identified areas and those where physiognomics were judged to be different were included. Based on the spatial extent, formation location, and location characteristics of the vegetation communities, 216 plots were installed by appropriately combining sizes of 10 × 10 m. The survey was conducted in June, July, and mid-August, when biodiversity was most abundant in 2019 and 2020.
A vegetation survey was conducted by distinguishing the tree, subtree, shrub, and herb layers, according to the phytosociological method of Z.–M. school [30]. Plant species appearing in each plot were recorded using the dominance rank combining the cover and abundance of species, and the sociality rank based on the degree of separation of species. We also investigated the coordinates, elevation, aspect, slope, rock exposure, litter layer depth, and positional environmental properties. Coordinates and elevation were represented by a GPSMAP® 64s (GARMIN, Olathe, KS, USA), whereas aspect and slope were represented by a TANDEM (SUUNTO, Vantaa, Finland). The measurement of trees in each plot involved identifying species for individuals with a diameter at breast height (DBH) of 2 cm or more, and measuring the DBH using the diameter rule.
The plants were identified using the Colored Flora of Korea [31], Flora of Korea [32], Knowing Right Trees of Korea [33], and Knowing Right Wildflowers of Korea [34]. The scientific names of the plants were compiled based on World Flora Online [35].

2.4. Data and Statistical Analysis

To classify the vegetation type of the community, Hill TWINSPAN (Two-Way INdicator SPecies ANalysis) [36], a quantitative classification technique, was used as the upper vegetation unit. Ellenberg’s tabular comparison method [37], a qualitative classification technique, was used for the middle and lower vegetation units. Based on the vegetation data of the 216 plots for which the survey was completed, the vegetation types were classified by going through several stages of table manipulation from the raw table, and finally creating a differential table, which represents the maximum and minimum ranges of the constancy class and cover.
Vegetation diversity indices were calculated [38,39,40]. Also, Duncan’s post hoc test (p ≤ 0.05) was applied to compare means. The Shannon index represents the species’ relative evenness and was calculated using the following equation:
H = i = 1 S P i × l n P i ,
where (H) is the Shannon index, (Pi) is the proportion of individuals found in the ith species, (ln) is the natural logarithm, and (s) the number of species in the community.
We conducted Canonical Correspondence Analysis (CCA), which is suitable for quantitatively and objectively demonstrating the correlation between community and environmental properties. As for the settings of the analysis method, “Centering and normalizing” and “LC scores” were utilized. Biotic and abiotic factors are environmental properties that influence vegetation. For biotic factors, we utilized basal area, stem density, and forms of dormancy, radicoids, disseminules, and growth [41,42]. For abiotic factors, we used elevation, aspect, slope, rock exposure, and depth of the litter layer. In addition, a biplot was used to overlay arrows that could explain the correlation strength of variables with positive and negative values (cut-off environmental properties R2 = 0.2).
A detailed physiognomic vegetation map was prepared at a scale of 1:5000 based on the dominant species in the upper layer. Initially, we delineated the boundary between the coniferous and deciduous forests and identified plantation areas. We roughly identified the tree species, and then accurately identified them through field surveys. Field surveys were conducted to identify the physiognomy within the target area through various routes, and any differences in the boundaries, areas, and stands that emerged onsite were directly corrected and supplemented. Georeferencing was conducted based on data obtained from field surveys. Satellite photographs from various time periods were placed in a 1:1 ratio, and the parts where the texture changed in the physiognomics were digitized based on elevation, aspect, slope, and topography. The nomenclature of the detailed physiognomic vegetation map was based on the dominant species.
TWINSPAN and CCA analyses were conducted using PCORD ver. 7 (MjM Software Design, Gleneden Beach, OR, USA), whereas diversity index calculations and Duncan’s post hoc tests were conducted using R ver. 4.0.5. (R Core Team, Vienna, Austria) A detailed physiognomic vegetation map was created using ArcMap ver. 10.6.1 (Environmental Systems Research Institute, Redlands, CA, USA) and QGIS ver. 3.16.10 (QGIS Development Team, Hannover, Germany).

3. Results

3.1. Floristic Diversity and Phytogeography

By surveying selected sample plots on Mt. Gariwang, 394 species, 221 genera, and 88 families distributed across four classes and three divisions were identified. A list of identified species, genera, families, classes, and divisions is provided (Supplementary Table S1). Asteraceae was the most common family, with 18 genera represented by 36 species (9.14% of the identified species), followed by Rosaceae with 16 genera represented by 25 species (6.35% of the identified species) and Ranunculaceae with 9 genera represented by 24 species (6.09% of the identified species). Most of the identified families (27 families representing 30.68% of all families) were represented by only one species: Cucurbitaceae, Lauraceae, Magnoliaceae, Paeoniaceae, or Symplocaceae (Figure 3a). In the study area, herbs were the most representative (62%) compared to tree, subtree, and shrub combinations, and perennial herbs accounted for 91% (Figure 3b). In addition, biennial herbs represented only 3%, and seven species were included, including Crepidiastrum chelidoniifolium Pak & Kawano, Cardamine amariformis Nakai, and Torilis japonica DC.

3.2. Vegetation Structure

The forest vegetation in the study area appeared to be a single type of the Quercus mongolica Fisch.-Fraxinus rhynchophylla Hance at the community group level, which was the highest vegetation unit. This typical community group was not accompanied by species-specific identification. The Quercus mongolica Fisch.-Fraxinus rhynchophylla Hance community was divided into Acer pictum var. mono Franch.-Acer pseudosieboldianum Kom. and Lindera obtusiloba Blume-Carex humilis var. nana Ohwi communities. Acer pictum var. mono Franch.-Acer pseudosieboldianum Kom. was divided into the Kalopanax septemlobus Koidz.-Actinidia arguta Miq. and the Tilia amurensis Rupr.-Tripterygium regelii Sprague & Takeda subcommunities, whereas Lindera obtusiloba Blume-Carex humilis var. nana Ohwi was divided into Ampelopsis glandulosa var. heterophylla Momiy.-Artemisia keiskeana Miq. and the Quercus dentata P.Watson-Quercus variabilis Blume subcommunities. The Kalopanax septemlobus Koidz.-Actinidia arguta Miq. subcommunity was further divided into the Cornus controversa Hemsl.-Staphylea bumalda DC. and the Dryopteris crassirhizoma Nakai-Polystichum tripteron C.Presl groups, and the Tilia amurensis Rupr.-Tripterygium regelii Sprague & Takeda subcommunity was further divided into the Ainsliaea acerifolia Sch.Bip.-Pseudostellaria heterophylla Pax and the Sasa borealis Makino & Shibata groups. Finally, the Dryopteris crassirhizoma Nakai-Polystichum tripteron C.Presl group was further divided into the Acer mandshuricum Maxim.-Ulmus laciniata Mayr subgroup, and the Ainsliaea acerifolia Sch.Bip.-Pseudostellaria heterophylla Pax group was further divided into the Calamagrostis arundinacea Roth-Artemisia stolonifera Kom. subgroup, completing the final classification. In summary, the forest vegetation on Mt. Gariwang was divided into eight types under the vegetation unit system: one community group, two communities, four subcommunities, four groups, and two subgroups (Table 1).

3.3. Species Diversity Index

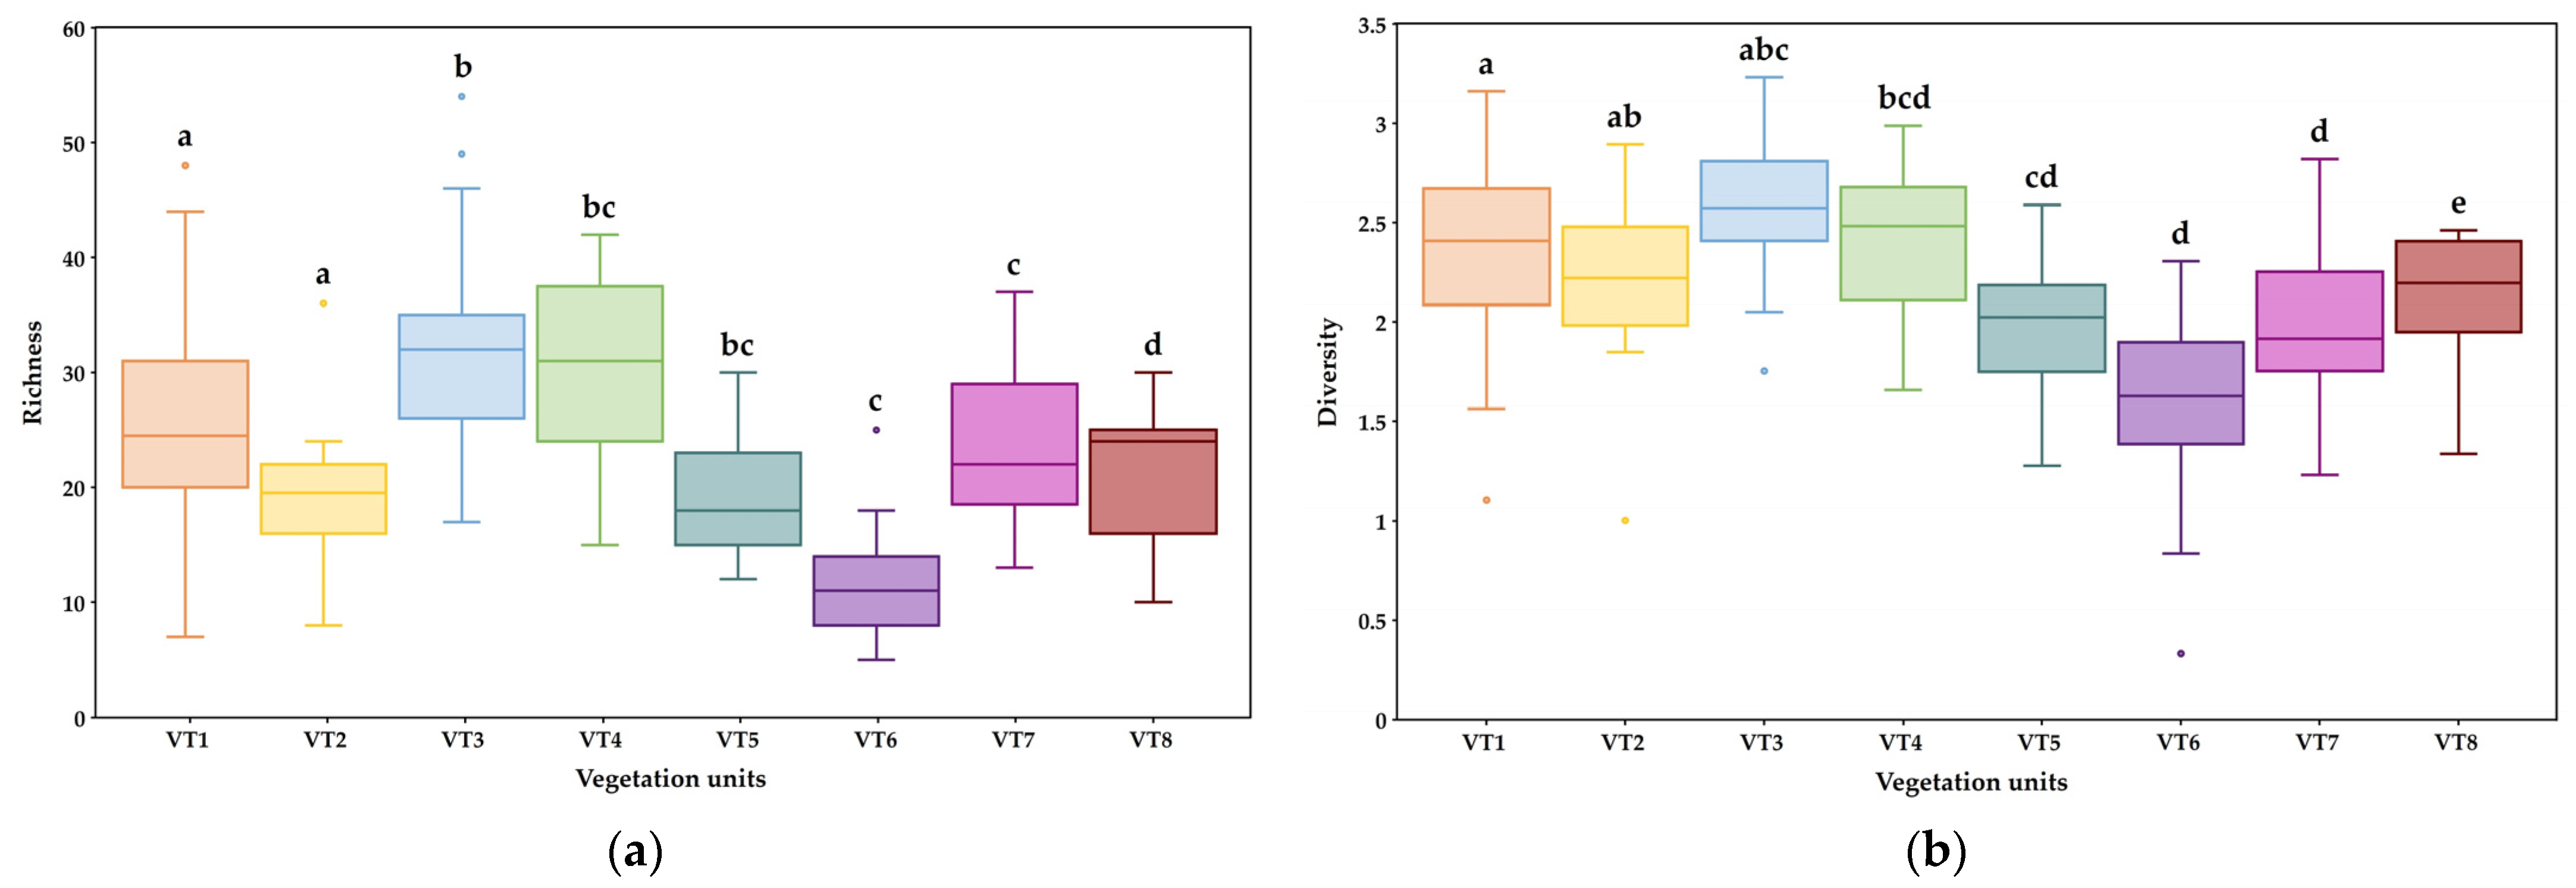
Figure 4 shows the significant differences in species richness and diversity among the eight communities. In VT3, species richness and diversity were the highest at 31.5 and 2.59, respectively, followed sequentially by VT4 (30.0, 2.38) and VT1 (25.1, 2.35). Species richness in VT6 was the lowest at 11.3, whereas higher values were observed in VT5 (19.3) and VT2 (19.4), showing relatively large deviations. Likewise, the species diversity in VT6 was the lowest at 1.58, whereas the highest values, VT5 and VT7, were both at 1.97, showing the same value and indicating deviations. These results show that there were significant differences between the various communities.

3.4. Relationships Between Vegetation and Environment

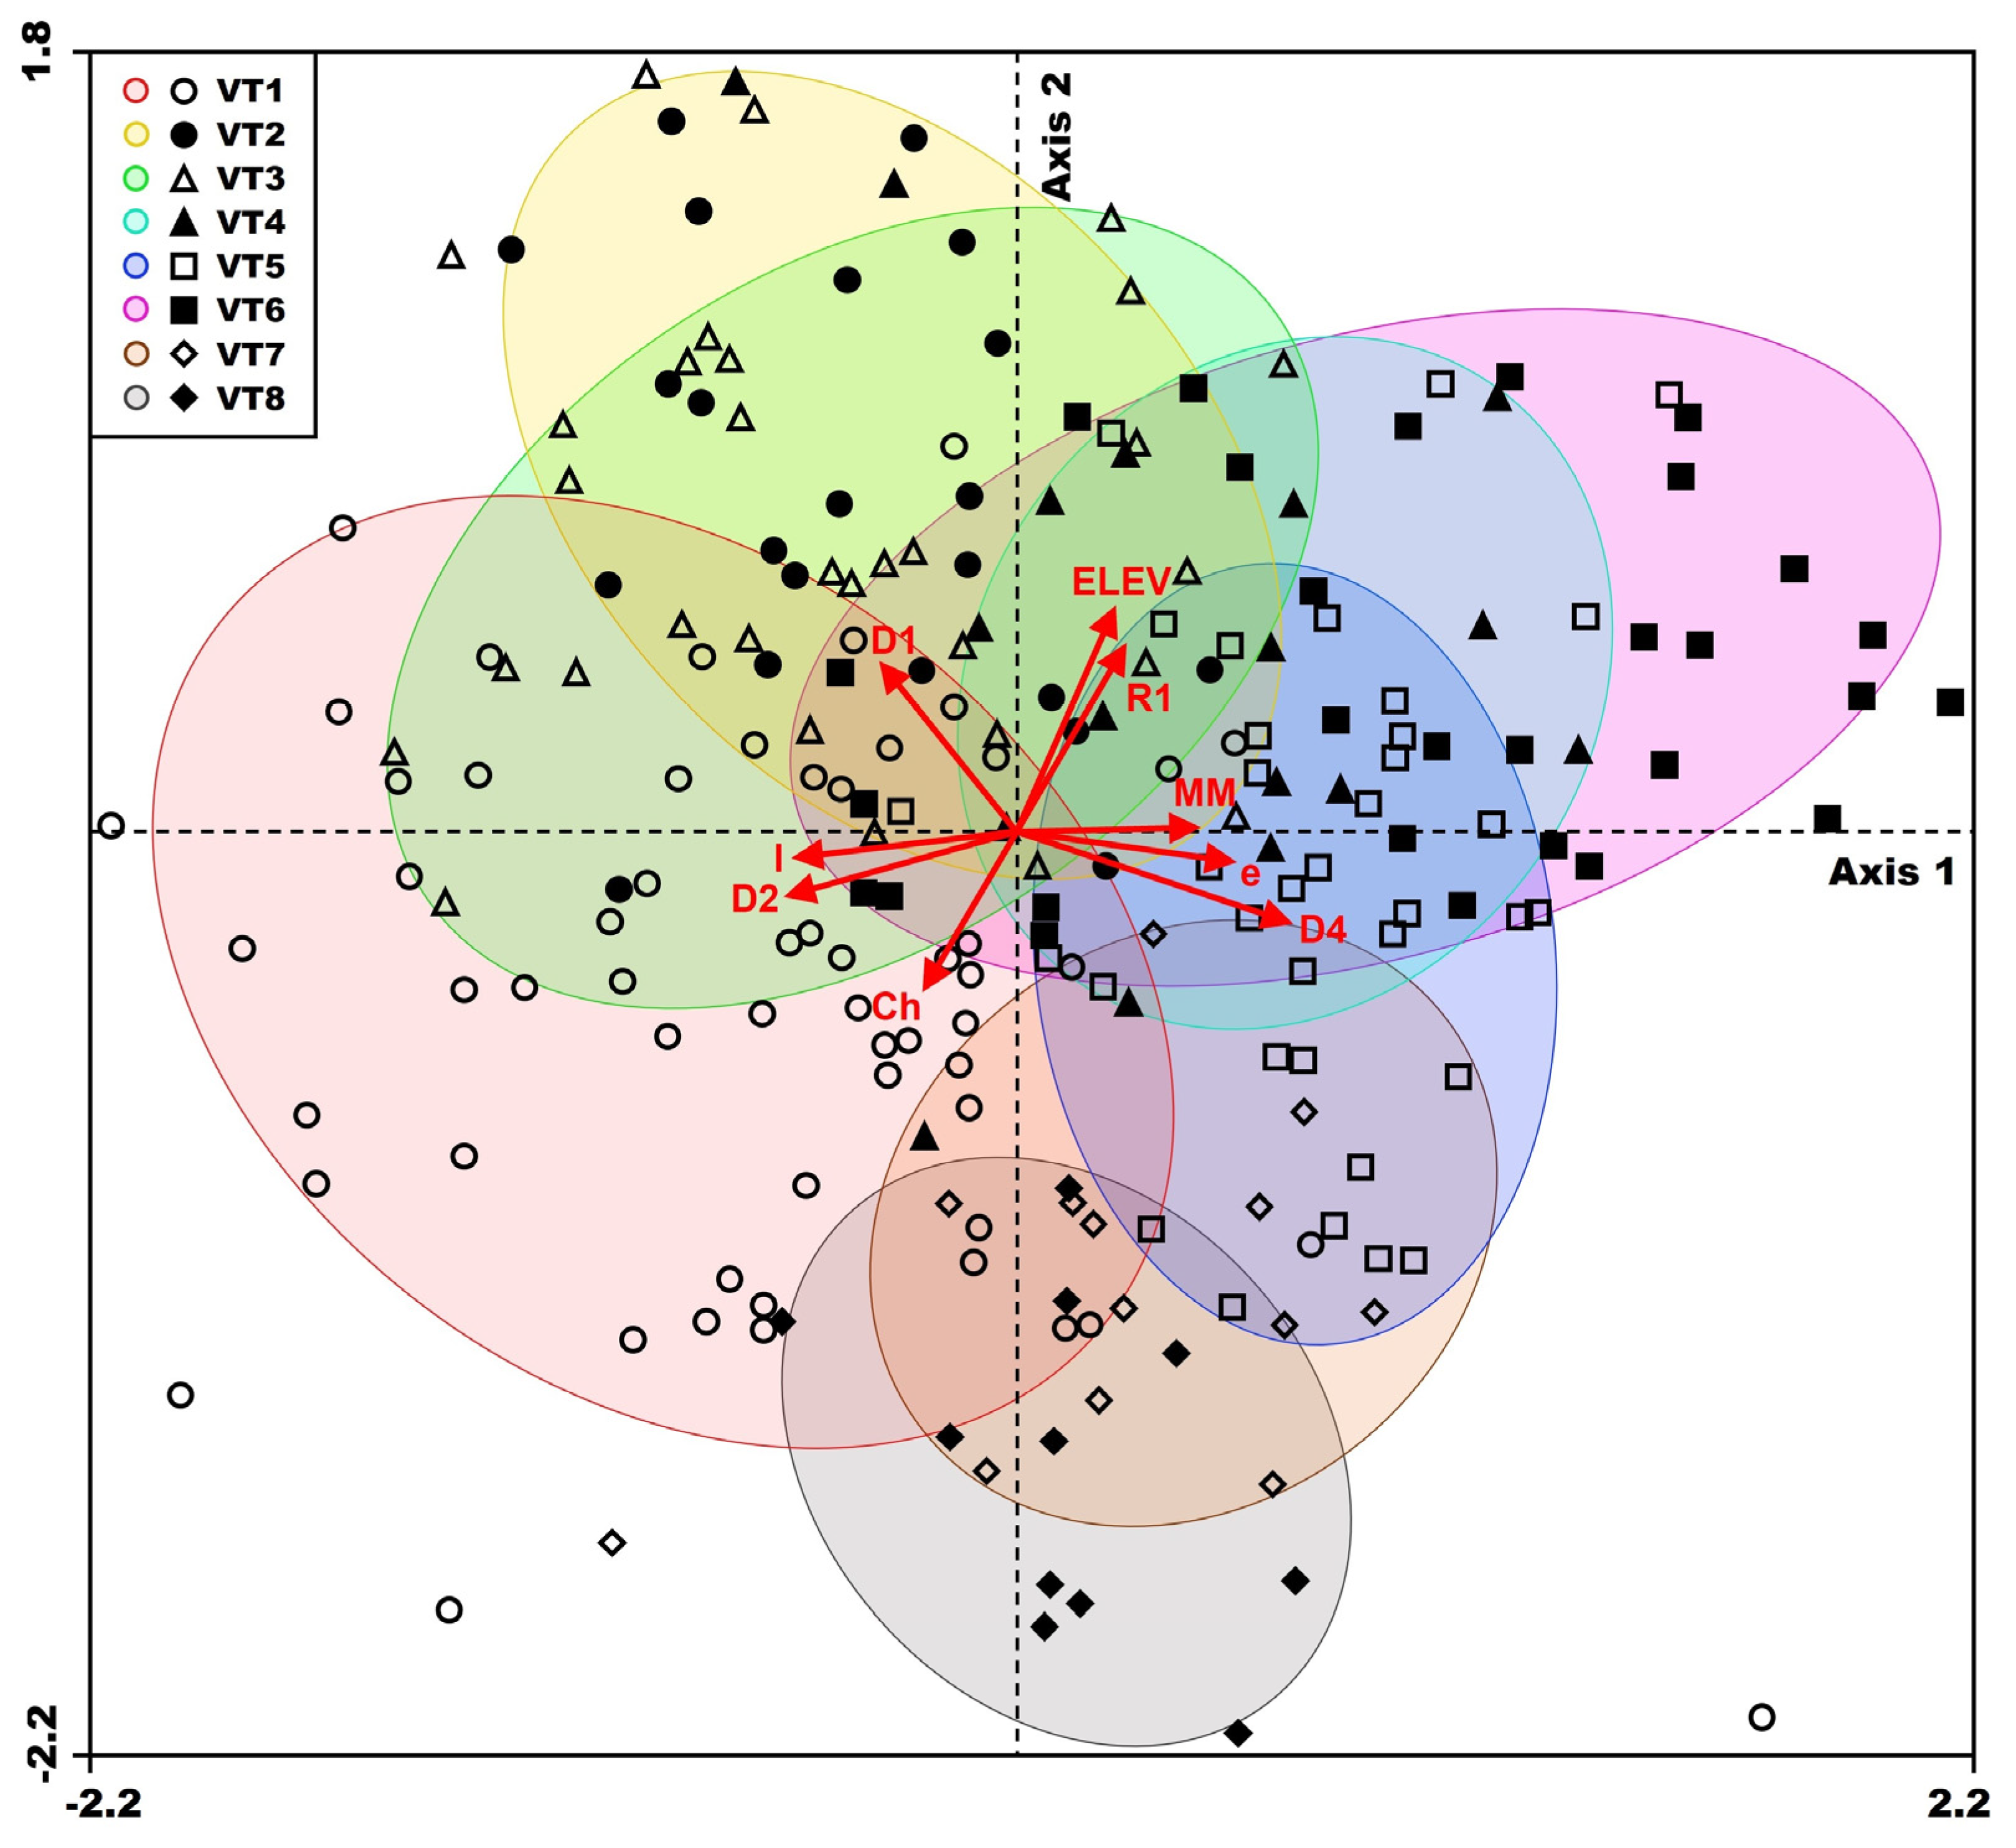
The distribution of the eight clusters created through the TWINSPAN analysis and the results of the CCA ordination using environmental properties are shown on a two-dimensional plane (Figure 5). Species composition patterns for all communities were shown through manual projection of variables on the CCA diagram, and as a result of ordination, the eigenvalues for axes 1 to 3 were 0.478, 0.466, and 0.368, respectively. The first three axes explained 79% of the variance in species–environment relationships, and the first and second axes explained 29 and 28% of the compositional variability of the studied forests, respectively. A positive correlation was found between the first axis and the MM-e-D4 variables, but a negative correlation was found between the l-D2 variables. On the second axis, there was a positive correlation between ELEV-R1-D1 but a negative correlation between Ch. The sampling plots showed a somewhat scattered process, but when grouped by vegetation type, there was a clear aggregation between them. Regarding environmental properties related to vegetation type, VT1 reflected the gradient of l-D2-Ch, whereas VT2 and VT3 reflected the gradient of D1. VT4 and VT6 reflected the gradient of ELEV-R1-MM and VT5 reflected the gradient of MM-e-D4. In contrast, VT7 and VT8 did not show significant relationships with any of the vectors.

3.5. Physiognomic Vegetation Map

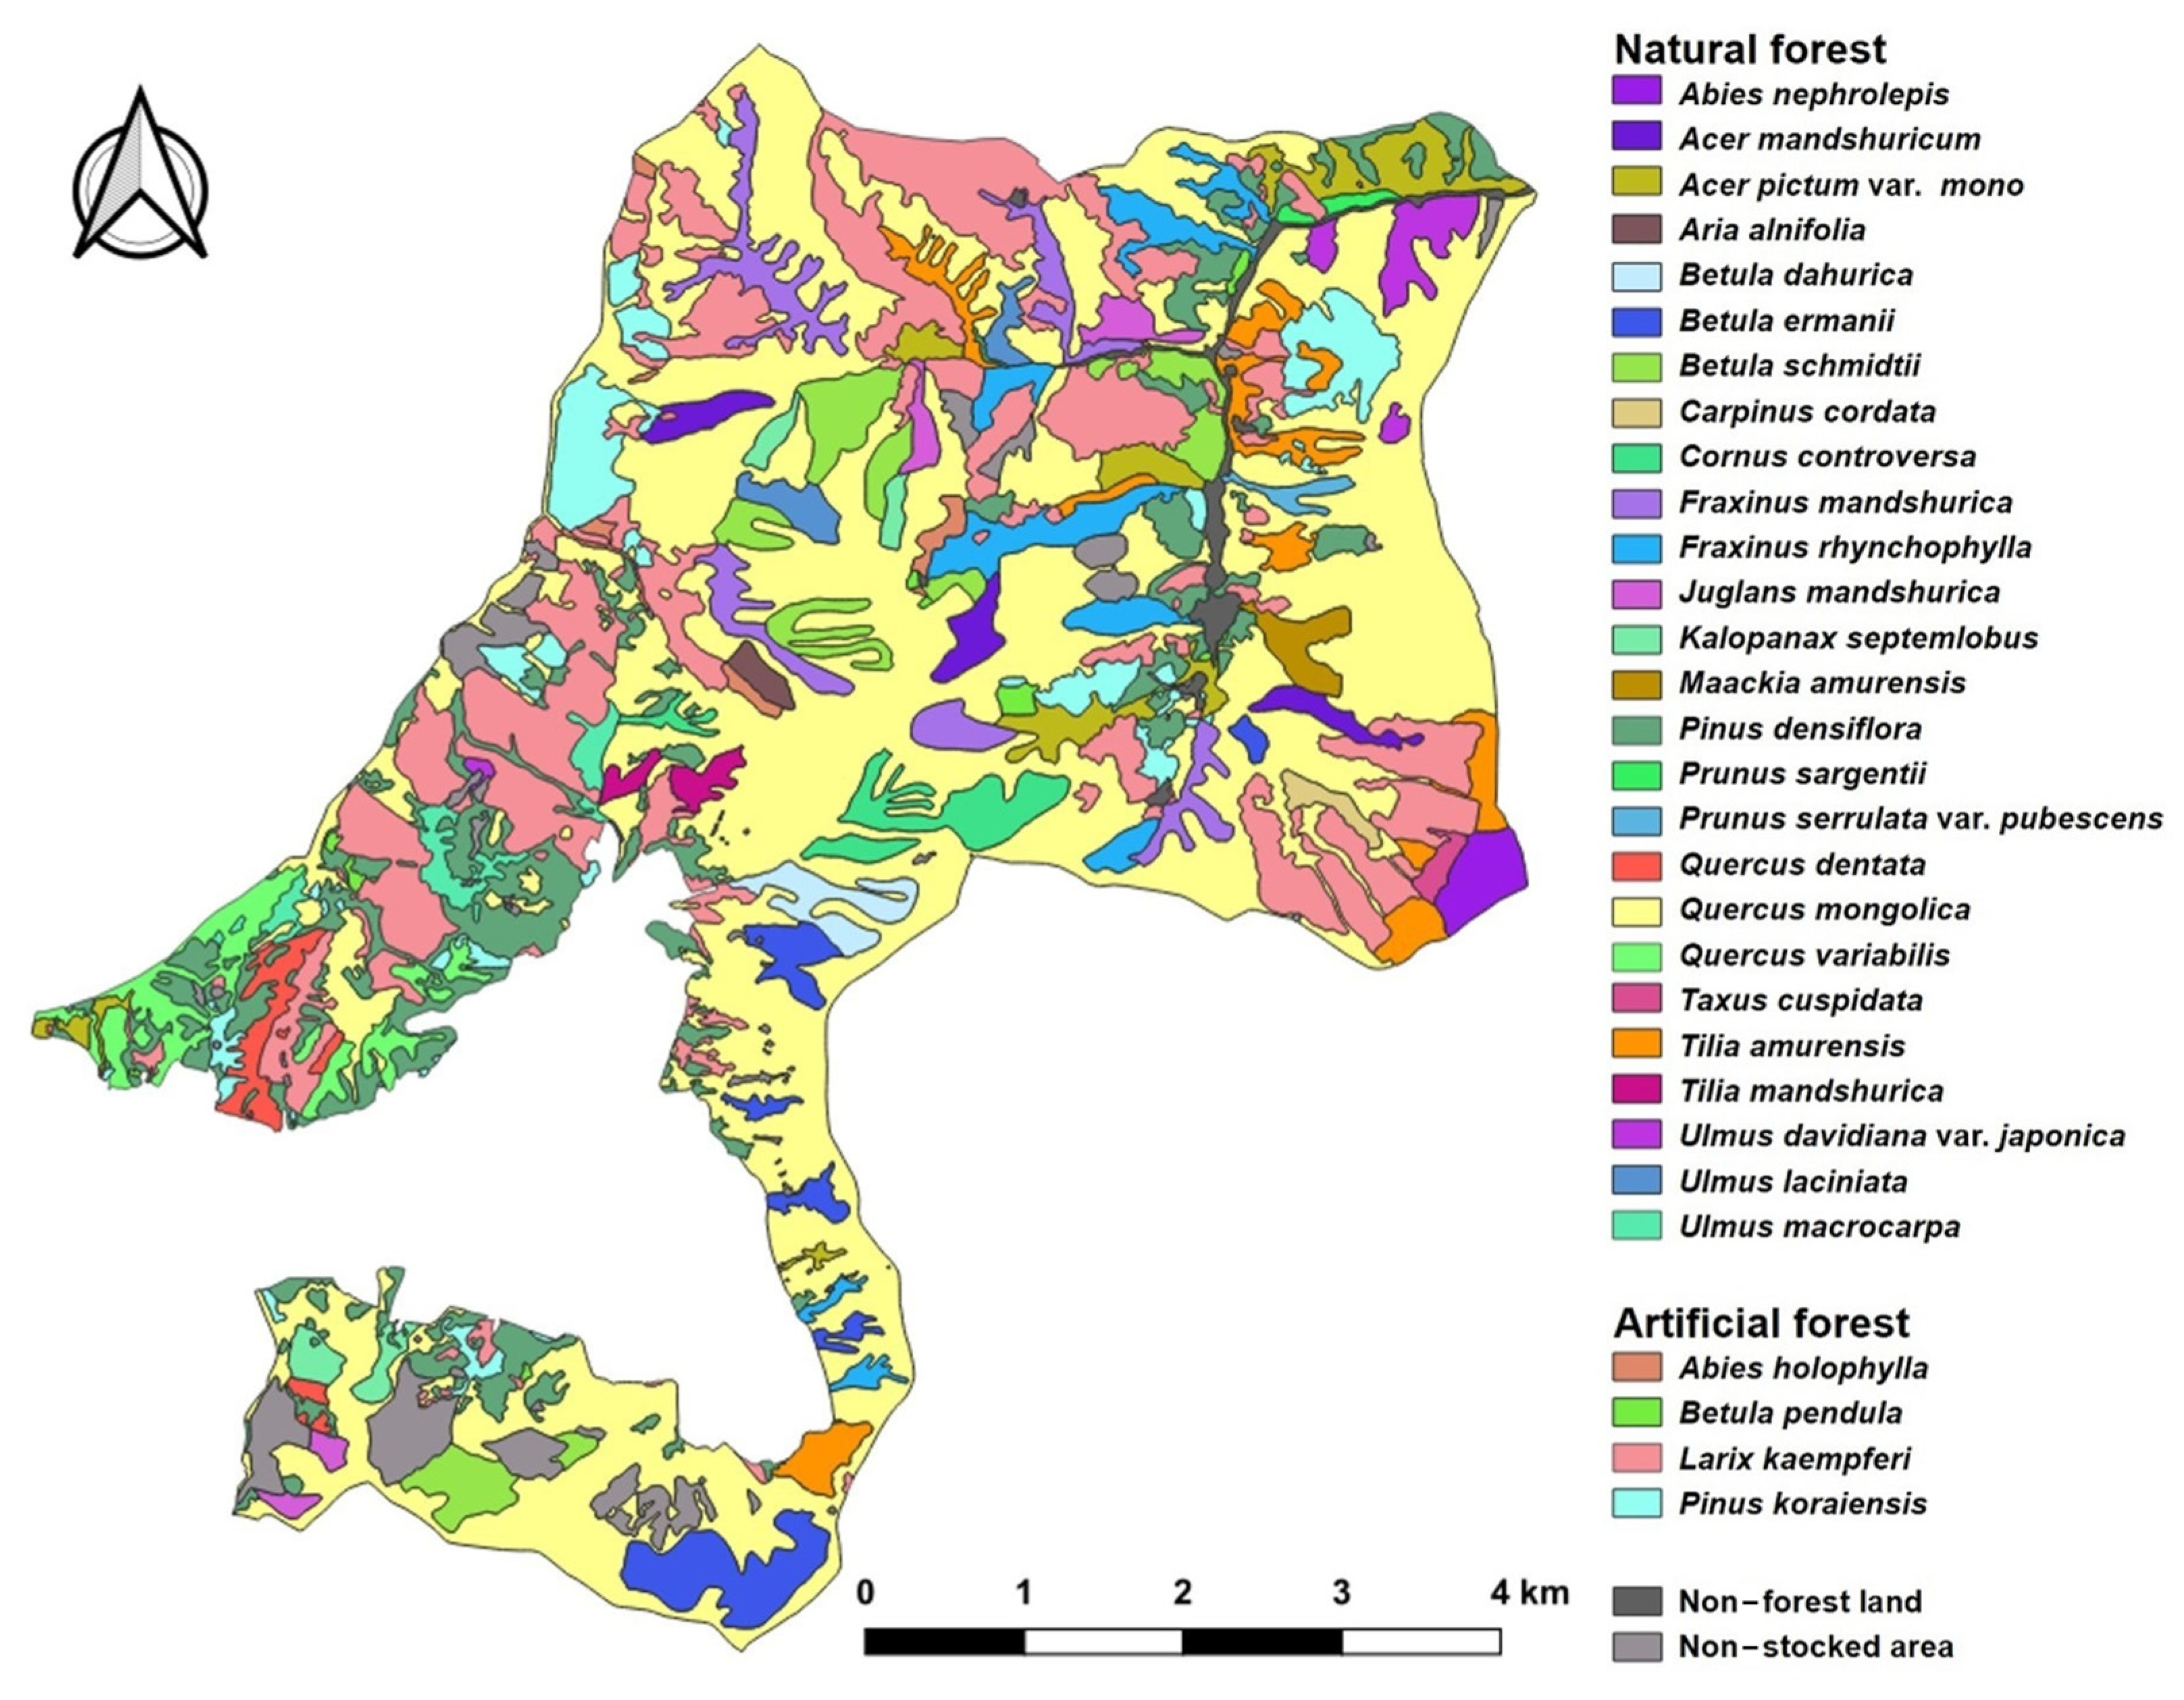
The detailed physiognomic vegetation map was divided into four categories: natural and artificial forests, non-forest land, and non-stocked areas (Table 2). The total area was 4055.28 ha, and the divided origins were 3085.15 ha (76.1%) for natural forest, 804.59 ha (19.8%) for artificial forest, 37.77 ha (0.9%) for non-forest land, and 127.77 ha (4.1%) for non-stocked area. Physiognomic vegetation was divided into 30 types, with 26 natural and 4 artificial forests. The Quercus mongolica Fisch. community was the largest (1739.61 ha, 42.9% of the total), followed by Larix kaempferi Carrière (629.96 ha, 15.5%), and Pinus densiflora Siebold & Zucc. (310.70 ha, 7.7%). In addition, 18 communities had an area ratio of less than 1%. The individual spatial forms (each area with demarcated boundaries) of the physiognomic vegetation types were represented as forest landscape elements (patches). The total number of patches was 481, with 263 natural forests, 144 artificial forests, 10 non-forest lands, and 64 non-stocked areas. The average area of coniferous communities, such as Pinus densiflora Siebold & Zucc., Larix kaempferi Carrière, and Pinus koraiensis Siebold & Zucc., excluding subalpine tree species, such as Abies nephrolepis Maxim., Taxus cuspidate Siebold & Zucc., and Abies holophylla Maxim., was smaller than the number of patches. In contrast, studies on deciduous communities have shown conflicting results. Based on this classification, the distribution and patches of several types of physiognomic vegetation are shown in Figure 6.

4. Discussion

The study site is represented by forest vegetation, and various woody and herbaceous species dominate the large-scale and complex terrain. Overall, the composition of organisms in the study area followed a typical forest flora pattern dominated by Phanerophytes, Chamaephytes, Hemicryptophytes, and Cryptophytes. The same pattern was observed in various forest habitats in different regions of the temperate zone [43,44,45]. In this study, 394 plant species were recorded, of which the major families were Asteraceae and Rosaceae, comprising 36 species from 18 genera and 25 species from 16 genera, respectively. Furthermore, previous studies have reported similar results, indicating that Asteraceae and Rosaceae were dominant [46,47]. In forests where many species are recorded, evolution always occurs at the species level; therefore, a taxonomic group that previously included recent ancestral species of new genera or families is classified as a paraphyletic group. Many plant species are paraphyletic and supported by diverse speciation patterns [48]. A vegetation is defined as a community of plant species that grows in specific locations and maintains its structure and physiognomic characteristics. Environmentally tolerant species form plant communities that show diagnostic flora and structural characteristics representative of the world’s major biomes [49]. Most of these are related to topographical and climatic characteristics that have a significant impact on the existence and distribution of various plant species and life forms [50,51,52]. Syntaxonomically, the plant species appears to belong to the major class Quercetea robori-Petraeae [53]. This indicates that most of the confirmed plant species in the study area have adapted to various environments (alpine areas, variable climate, and rocky or stony terrain) [54].
In the current study, 13 communities and eight vegetation types were identified. The nature and distribution of these communities were closely related to the various environments in the study area. A clear order was observed between the vegetation units and location conditions, which allowed us to determine the leading conditions or factors involved in the establishment of a community. These communities reflect the comprehensive effects of various factors, using the environment as an indicator. That is, distinguishing and systematizing communities involves characterizing the interrelationships among species, the structural and ecological characteristics of population groups, and understanding the interrelationships between communities and the environment [55]. Additionally, the defined vegetation units correspond to the cumulative effects of all environmental properties and represent the link between these processes and the distribution of plant communities [56]. Therefore, because of the characteristics of a cold and dry winter climate (Dwa) and a terrain that is high in the east and low in the west, temperate tree species, such as Quercus mongolica Fisch. and Tilia amurensis Rupr., are still dominant in the vegetation units of the study results. Additionally, many species showing various successive stages of vegetation development, such as Fraxinus rhynchophylla Hance and Acer pseudosieboldianum Kom., have also appeared. The higher the constancy class, the more dominant the species in the target area and the more likely it is to be a species subject to future forest ecosystem management. The highest unit of this study was the Quercus mongolica Fisch.-Fraxinus rhynchophylla Hance community group, which is a major tree species that needs to be managed intensively in the Mount Gariwang ecosystem. In addition, as in previous studies, the results were consistent with the finding that the forest vegetation of South Korea is represented by Quercus mongolica Fisch. community types along with Fraxinus rhynchophylla Hance [57,58]. The precise and harmonized syntaxonomic classification of vegetation communities is generally recognized as a fundamental requirement for the appropriate conservation of endangered and vulnerable natural habitats [59]. These local-scale approaches rely on accurate classification systems, particularly when dealing with the ecology, syntaxonomics, and vegetation composition of natural habitats. More importantly, syntaxonomic studies have provided convincing evidence that the current vegetation status is a natural habitat.
In communities with a high constancy class, richness and diversity were high. This indicates that the area supports a variety of species, resulting in well-functioning ecosystem processes, such as productivity, nutrient cycling, and resilience to threats, and signifies a stable community for plant species habitat [60,61]. However, in communities where richness and diversity are low, competitive ability is emphasized in relation to dominant species, and crucially, its level decreases once deciduous species are established [62]. All the communities described resulted in the establishment of broadleaf species, with species composition and density varying greatly between groups. The observed species richness may be explained by the intermediate disturbance hypothesis described by Connell, who stated that disturbances at an intermediate level maximize species richness [63]. An increase in this parameter is often due to the appearance of early successional, light-demanding, and invasive species, which often replace shade-tolerant forest specialists [64]. This increase is often due to the introduction of species in response to local disturbance [65]. Our study showed the same patterns, as shown in Figure 6, which include artificial and secondary forests, and it can be seen a priori that there were large and small disturbances. Therefore, moderate disturbances, rather than too frequent or infrequent disturbances, will influence the actual pool of forest species over the long term.
Ordination technology is used by ecological flora to expose ecosystems and generate cycles of discovered plant species [66,67]. The current study was conducted based on the factors that affect communities by community unit and major environmental properties. CCA results showed that the communities were mainly associated with dormancy. Fraxinus rhynchophylla Hance, Acer mandshuricum Maxim., and Ulmus laciniata Mayr seeds are light and have wings, making them easily dispersed by wind. However, because oak seeds are heavy and large, they are distributed around the mother tree by gravity, without a special dispersal organ. As a result, the seeds of the oak species were dispersed and established more slowly than the seeds of the former tree species. However, the study area was surrounded by a vast habitat of Quercus mongolica Fisch.; thus, it was easy to recruit seeds (large-scale distance effect), and it was predominantly in a competitive relationship influenced by environmental properties (temperature, humidity, and pH), such as germination, establishment, and growth rate of non-resource factors [68]. In addition, yams, a vine plant, appeared with Kalopanax septemlobus Koidz. and Cornus controversa Hemsl., whose seeds were dispersed by frugivory. Their habitat is located in cool, deep mountains, and frugivores prefer such hidden places; therefore, it appears that they interact with each other. Overall, these were all tree species with erect stems, and ferns such as Dryopteris crassirhizoma Nakai, Pentarhizidium orientale Hayata, Polystichum tripteron C.Presl, and Asplenium incisum Thunb. appeared mainly at high elevations. The results were similar to those of research showing that communities are highly correlated with environmental properties and that the distribution of vegetation is influenced by biological, ecological, and geographical factors [69,70]. Thus, the distribution pattern of growing species according to environmental properties is believed to reflect differences in ecological conditions. Therefore, communities in the succession process can respond sensitively to disturbances and environmental changes. The interrelationship between the upper and lower layers shows interspersion, indicating a gradually simplified and stabilized ecological process.
Vegetation is central to classification and mapping because it represents the most identifiable and representative component of the ecosystem at all levels of detail [71]. Vegetation maps are also important because they inform decisions regarding ecological research, biodiversity conservation, vegetation management and restoration, and national strategies [72,73,74,75,76]. Therefore, it is fundamental to recognize and map ecosystems at a relatively fine scale, such as a physiognomic vegetation map. The current study showed that in natural forests, physiognomic species are continuous over large areas compared with fragmented patches in small areas. In natural forests, dominant species occupy large niches and interact among populations, such as symbiosis, parasitism, and competition with other plant species. Spriville et al. also noted that when classifying and mapping vegetation, the population structure of the entire plant composition is more stable than that of a single constituent species [77]. To maintain the ecological stability of forest vegetation, appropriate management measures are required to ensure the ecological connectivity of fragmented patches. Additionally, because the study area was large, many field trips were required to identify the current plant species. Nevertheless, there is a need to continuously create and update ecological databases that will greatly assist in designing necessary conservation plans for the study sites.

5. Conclusions

Despite the growing importance of biological resources, there is an increasing need to conserve existing vegetation and restore damaged areas closer to the original stand through minimal management. Mt. Gariwang, which represents temperate deciduous forests rich in biodiversity, has most of its native vegetation destroyed owing to continuous anthropogenic interference. However, the succession process is currently taking on the appearance of a natural forest centered on oaks.
Our study identified and described the environmental properties affecting species composition and eight different vegetation types, classified them into 13 major communities, and mapped the resulting physiognomic vegetation. These communities are physiologically, biologically, and geographically distinct from each other, and classifying communities with an emphasis on existing vegetation can be a basis for planning the restoration and management of damaged forests. Additionally, a vegetation map was displayed for various patches to clarify the spatial distribution, which can provide essential information for strategic forest management planning decisions.
Asteraceae and Rosaceae in the study area are plant species that are rapidly introduced during the developmental stages in the damaged area. They also have a variety of uses in the forest, serving as a refuge for wild animals and as an aid for frugivory. This family level analysis can be meaningful as a key indicator of the role groups that should be invested in first. Subsequently, in the process of succession (to return to the original vegetation), the damaged area begins to grow various shrub and subtree species to develop into a forest dominated by certain species. Quercus mongolica Fisch., which facilitates seed recruitment, will ultimately develop. This will serve as an appropriate basis for determining reference ecosystems as we refer to plant synecological studies to develop restoration plans. The implications of this basis itself will be useful to policymakers, volunteer groups, and other key funding and support groups in their exploration of the value of restoration.
To meet current assumptions about setting up reference ecosystems, it must be considered that forest areas should be large, habitats should be continuous, and species turnover should be free. Basic community classification is one of the approaches that can solve overall problems or provide alternatives in the ecosystem and clear insights to quickly and effectively estimate reference conditions. However, because the study area is large, there is a limitation that many field surveys are required to confirm current plant species. Additionally, further research on edaphic factors is highly recommended, as there are no potential interactions resulting from the physical and chemical soil properties. Moreover, our site has not investigated non-plant communities such as microbiota, pests, and pathogens that could contribute to the overall genetic diversity of the ecosystem. When discussing diversity, we cannot overlook the forest as a holobiont community and genetic diversity as a hologenome, so further research is recommended. In conclusion, in future restoration plans, the results of this study can help quantitatively evaluate the degree of restoration of damaged forest ecosystems and suggest that the degree of restoration can be expressed as a quantitative indicator. In addition, when restoring, planting dominant species first to quickly follow the reference ecological group or establishing a restoration plan based on baseline data will lead to more successful restoration.

Supplementary Materials

The following supporting information can be downloaded at: https://www.mdpi.com/article/10.3390/d17010040/s1, Table S1: List of all plant species identified in the study area and their divisions, classes, families, genera, and species.

Author Contributions

Conceptualization, investigation, analysis, visualization, writing, and original draft preparation, M.K.; supervision, curation, and editing, N.K.; review, N.K., A.R.K., K.L. and S.J.Y. All authors have read and agreed to the published version of the manuscript.

Funding

This research was funded by the National Institute of Forest Science (grant number: FE0100-2016-09-2020), and partly granted by the National Institute of Forest Science (management number: 22-00-51).

Institutional Review Board Statement

Not applicable.

Data Availability Statement

The data presented in this study are available upon request from the corresponding author. The data are not publicly available due to privacy concerns.

Conflicts of Interest

The authors declare no conflicts of interest.

References

  1. Aerts, R.; Honnay, O. Forest restoration, biodiversity and ecosystem functioning. BMC Ecol. 2011, 11, 29. [Google Scholar] [CrossRef] [PubMed]
  2. Hahn, W.A.; Knoke, T. Sustainable development and sustainable forestry: Analogies, differences, and the role of flexibility. Eur. J. For. Res. 2010, 129, 787–801. [Google Scholar] [CrossRef]
  3. Butchart, S.H.M.; Walpole, M.; Collen, B.; Strien, A.V.; Scharlemann, J.P.W.; Almond, R.E.A.; Baillie, J.E.M.; Bomhard, B.; Brown, C.; Bruno, J.; et al. Global Biodiversity: Indicators of Recent Declines. Science 2010, 328, 1164–1168. [Google Scholar] [CrossRef]
  4. Fortunel, C.; Lasky, J.R.; Uriarte, M.; Valencia, R.; Wright, S.J.; Garwood, N.C.; Kraft, N.J.B. Topography and neighborhood crowding can interact to shape species growth and distribution in a diverse Amazonian forest. Ecology 2018, 99, 2272–2283. [Google Scholar] [CrossRef] [PubMed]
  5. Yao, L.; Ding, Y.; Xu, H.; Deng, F.; Yao, L.; Ai, X.; Zang, R. Patterns of diversity change for forest vegetation across different climatic regions—A compound habitat gradient analysis approach. Glob. Ecol. Conserv. 2020, 23, e01106. [Google Scholar] [CrossRef]
  6. Gaston, K.J. Global patterns in biodiversity. Nature 2000, 405, 220–227. [Google Scholar] [CrossRef]
  7. Roslin, T.; Hardwick, B.; Novotny, V.; Petry, W.K.; Andrew, N.R.; Asmus, A.; Barrio, I.C.; Basset, Y.; Boesing, A.L.; Bonebrake, T.C.; et al. Higher predation risk for insect prey at low latitudes and elevations. Science 2017, 356, 742–744. [Google Scholar] [CrossRef] [PubMed]
  8. Chapman, J.I.; McEwan, R.W. The Role of Environmental Filtering in Structuring Appalachian Tree Communities: Topographic Influences on Functional Diversity Are Mediated through Soil Characteristics. Forests 2018, 9, 19. [Google Scholar] [CrossRef]
  9. Herben, T.; Goldberg, D.E. Community assembly by limiting similarity vs. competitive hierarchies: Testing the consequences of dispersion of individual traits. J. Ecol. 2014, 102, 156–166. [Google Scholar] [CrossRef]
  10. Leps, J.; de Bello, F.; Lavorel, S.; Berman, S. Quantifying and interpreting functional diversity of natural communities: Practical considerations matter. Preslia 2006, 78, 481–501. [Google Scholar]
  11. Mason, N.W.H.; de Bello, F.; Mouillot, D.; Pavoine, S.; Dray, S. A guide for using functional diversity indices to reveal changes in assembly processes along ecological gradients. J. Veg. Sci. 2013, 24, 794–806. [Google Scholar] [CrossRef]
  12. Mcgill, B.J.; Enquist, B.J.; Weiher, E.; Westoby, M. Rebuilding community ecology from functional traits. Trends Ecol. Evol. 2006, 21, 178–185. [Google Scholar] [CrossRef] [PubMed]
  13. Spasojevic, M.J.; Suding, K.N. Inferring community assembly mechanisms from functional diversity patterns: The importance of multiple assembly processes. J. Ecol. 2012, 100, 652–661. [Google Scholar] [CrossRef]
  14. Pott, R. Plant Biosystems—An International Journal Dealing with All Aspects of Plant Biology; Taylor & Francis: Oxfordshire, UK, 2011; pp. 9–18. [Google Scholar]
  15. Krebs, C.J. Ecology: The Experimental Analysis of Distribution and Abundance, 3rd ed.; Harper & Row: New York, NY, USA, 1985. [Google Scholar]
  16. Franklin, J. Mapping Species Distributions: Spatial Inference and Prediction; Cambridge University Press: Cambridge, UK, 2010. [Google Scholar]
  17. Fitzpatrick, M.C.; Gove, A.D.; Sanders, N.J.; Dunn, R.R. Climate change, plant migration, and range collapse in a global biodiversity hotspot: The Banksia (Proteaceae) of Western Australia. Glob. Change Biol. 2008, 14, 1337–1352. [Google Scholar] [CrossRef]
  18. Lawler, J.J.; Shafer, S.L.; White, D.; Kareiva, P.; Maurer, E.P.; Blaustein, A.R.; Bartlein, P.J. Projected climate-induced faunal change in the Western Hemisphere. Ecology 2009, 90, 588–597. [Google Scholar] [CrossRef] [PubMed]
  19. Mateo, R.G.; Felicísimo, Á.M.; Pottier, J.; Guisan, A.; Muñoz, J. Do Stacked Species Distribution Models Reflect Altitudinal Diversity Patterns? PLoS ONE 2012, 7, e32586. [Google Scholar] [CrossRef]
  20. Pottier, J.; Dubuis, A.; Pellissier, L.; Maiorano, L.; Rossier, L.; Randin, C.F.; Vittoz, P.; Guisan, A. The accuracy of plant assemblage prediction from species distribution models varies along environmental gradients. Glob. Ecol. Biogeogr. 2013, 22, 52–63. [Google Scholar] [CrossRef]
  21. Svenning, J.C.; Fitzpatrick, M.C.; Normand, S.; Graham, C.H.; Pearman, P.B.; Iverson, L.R.; Skov, F. Geography, topography, and history affect realized-to-potential tree species richness patterns in Europe. Ecography 2010, 33, 1070–1080. [Google Scholar] [CrossRef]
  22. Thuiller, W.; Lavorel, S.; Araújo, M.B.; Sykes, M.T.; Prentice, I.C. Climate change threats to plant diversity in Europe. Proc. Natl. Acad. Sci. USA 2005, 102, 8245–8250. [Google Scholar] [CrossRef]
  23. Kumar, P. Assessment of impact of climate change on Rhododendrons in Sikkim Himalayas using Maxent modelling: Limitations and challenges. Biodivers. Conserv. 2012, 21, 1251–1266. [Google Scholar] [CrossRef]
  24. Alard, D.; Poudevigne, I. Biodiversity in changing landscapes: From species or patch assemblages to system organisation. In Application of Geographic Information Systems and Remote Sensing in River Studies; Leuven, R.S.E.W., Poudevigne, I., Teeuw, R.M., Eds.; Backhuys: Leiden, NL, USA, 2002; pp. 9–24. [Google Scholar]
  25. Sasaki, T.; Ishii, H.; Morimoto, Y. Evaluating restoration success of a 40-year-old urban forest in reference to mature natural forest. Urban For. Urban Green. 2018, 32, 123–132. [Google Scholar] [CrossRef]
  26. Ruiz-Jaen, M.C.; Aide, T.M. Restoration Success: How Is It Being Measured? Restor. Ecol. 2005, 13, 569–577. [Google Scholar] [CrossRef]
  27. Fengler, F.H.; Bressane, A.; Carvalho, M.M.; Longo, R.M.; de Medeiros, G.A.; de Melo, W.J.; Jakovac, C.C.; Ribeiro, A.I. Forest restoration assessment in Brazilian Amazonia: A new clustering-based methodology considering the reference ecosystem. Ecol. Eng. 2017, 108, 93–99. [Google Scholar] [CrossRef]
  28. Jeon, D.U.; Chon, J.H. System Thinking in the Resilience of the Ecosystem and Ecotourism of Mt. Gariwang Based on the Controversy around the Venue Construction for PyeongChang 2018 Olympic. Korean Syst. Dyn. Rev. 2014, 15, 61–79. [Google Scholar]
  29. Peel, M.C.; Finlayson, B.L.; McMahon, T.A. Updated world map of the Köppen-Geiger climate classification. Hydrol. Earth Syst. Sci. 2007, 11, 1633–1644. [Google Scholar] [CrossRef]
  30. Braun−Blanquet, J. Plant Sociology: The Study of Plant Communities; McGraw−Hill: New York, NY, USA, 1932. [Google Scholar]
  31. Lee, T.B. Coloured Flora of Korea; HyangMoonSa: Seoul, Republic of Korea, 2003. [Google Scholar]
  32. Lee, Y.N. Flora of Korea; KyoHakSa: Seoul, Republic of Korea, 2006. [Google Scholar]
  33. Lee, D.H. Knowing Right Trees of Korea; EBeeLak: Seoul, Republic of Korea, 2014.
  34. Lee, D.H. Knowing Right Wildflowers of Korea; EBeeLak: Seoul, Republic of Korea, 2016.
  35. The World Flora Online. Available online: https://www.worldfloraonline.org/ (accessed on 18 October 2023).
  36. Hill, M.O. Twinspan: A Fortran Program for Arranging Multivariate Data in an Ordered Two-Way Table by Classification of the Individuals and Attributes; Cornell University Section of Ecology and Systematics: New York, NY, USA, 1979.
  37. Ellenberg, H. Grundlagen der Vegetationsgliederung. I. Teil Aufgaben und Methoden der Vegetationskunde. In Einführung in die Phytologie; Walter, H., Ed.; Eugen Ulmer: Stuttgart, Germany, 1956; pp. 1–136. [Google Scholar]
  38. Pielou, E.C. Ecological Diversity; John Wiley & Sons: New York, NY, USA, 1975. [Google Scholar]
  39. Magurran, A.E. Ecological Diversity and Its Measurement; Princeton University Press: Princeton, NJ, USA, 1988. [Google Scholar]
  40. Magurran, A.E. Measuring Biological Diversity; John Wiley & Sons: New York, NY, USA, 2003. [Google Scholar]
  41. Raunkiaer, C. The Life Forms of Plants and Statistical Plant Geography; Oxford University Press: Oxford, UK, 1934. [Google Scholar]
  42. Numata, M. Illustrated Plant Ecology; Ashakura Book Company: Tokyo, Japan, 1970; pp. 33–43. [Google Scholar]
  43. Kim, M.S.; Cho, H.J.; Kim, J.S.; Bae, K.H.; Chun, J.H. The Classification of Forest Vegetation Types and Species Composition in the Sector between Danmoknyeong and Guryongnyeong of Baekdudaegan. Korean J. Environ. Ecol. 2018, 32, 176–184. [Google Scholar] [CrossRef]
  44. Song, J.H.; Kwon, J.N.; Yun, C.W. Forest Vegetation Structure in Maruguem(the Ridge Line) Area of Dakmokryeong to Daetjae, the Baekdudaegan. Korean J. Environ. Ecol. 2019, 33, 28–51. [Google Scholar] [CrossRef]
  45. Cheon, K.I.; Byun, J.G.; Jung, S.C.; Sung, J.H. Community Structure of Quercus mongolica Stand in Hyangrobong Area, Baekdudaegan. J. Agric. Life Sci. 2014, 48, 1–13. [Google Scholar] [CrossRef]
  46. Haq, F.; Ahmad, H.; Alam, M.; Ahmad, I.; Ullah, R. Species diversity of vascular plants of Nandiar Valley Western Himalaya, Pakistan. Pak. J. Bot. 2010, 42, 213–229. [Google Scholar]
  47. Faisal, S.; Haq, F.; Iqbal, Z. Statistical analysis for the classification and ordination of the vegetation of Chour valley. A multivariate approach. Acta Ecol. Sin. 2022, 42, 446–452. [Google Scholar] [CrossRef]
  48. Rieseberg, L.H.; Brouillet, L. Are many plant species paraphyletic? Taxon 1994, 43, 21–23. [Google Scholar] [CrossRef]
  49. Archibold, O.W. Ecology of World Vegetation; Chapman & Hall: London, UK, 1995. [Google Scholar]
  50. El-Sheikh, M.A.; Al-Shehri, M.A.; Alfarhan, A.H.; Alatar, A.A.; Rajakrishnan, R.; Al-Rowaily, S.L. Threatened Prunus arabica in an ancient volcanic protected area of Saudi Arabia: Floristic diversity and plant associations. Saudi J. Biol. Sci. 2019, 26, 325–333. [Google Scholar] [CrossRef] [PubMed]
  51. Alatar, A.A.; El-Sheikh, M.A.R.; Thomas, J.; Hegazy, A.K.; El Adawy, H.A. Vegetation, Floristic Diversity, and Size-Classes of Acacia gerrardii in an Arid Wadi Ecosystem. Arid. Land Res. Manag. 2015, 29, 335–359. [Google Scholar] [CrossRef]
  52. El-Sheikh, M.A. Population structure of woody plants in the arid cloud forests of Dhofar, southern Oman. Acta Bot. Croat. 2013, 72, 97–111. [Google Scholar] [CrossRef]
  53. Song, J.S. A Comparative Phytosociological Study of Cool Temperate Forests (Quercus forest and Fagus forest) in Korea and Germany. Korean J. Ecol. 1999, 22, 219–225. [Google Scholar]
  54. Stupar, V.; Brujić, J.; Škvorc, Ž.; Črni, A. Vegetation types of thermophilous deciduous forests (Quercetea pubescentis) in the Western Balkans. Phytocoenologia 2016, 46, 49–68. [Google Scholar] [CrossRef]
  55. Egerton, F.N. Ecological Studies and Observations Before 1900; Taylor, B.J., White, T.J., Eds.; University of Oklahoma Press: Norman, OK, USA, 1976; pp. 311–351. [Google Scholar]
  56. Baroni, C.; Armiraglio, S.; Gentili, R.; Carton, A. Landform–vegetation units for investigating the dynamics and geomorphologic evolution of alpine composite debris cones (Valle dell’Avio, Adamello Group, Italy). Geomorphology 2007, 84, 59–79. [Google Scholar] [CrossRef]
  57. Choo, G.C.; Kim, G.T.; Kim, J.O. Studies on the Structure of Forest Community at the Ridge from Gittaebong to Cheongoksan. Korean J. Environ. Ecol. 2002, 15, 354–360. [Google Scholar]
  58. Jeong, B.K.; Oh, C.H. Analysis on the Community Structure of Quercus mongolica Fisch. ex Ledeb. in the Baekdudaegan Mountains by Elevation—Between Hyangnobong and Gitdaebaggybong. Korean J. Environ. Ecol. 2013, 27, 449–461. [Google Scholar]
  59. De Cáceres, M.; Chytrý, M.; Agrillo, E.; Attorre, F.; Botta-Dukát, Z.; Capelo, J.; Czúcz, B.; Dengler, J.; Ewald, J.; Faber-Langendoen, D.; et al. A comparative framework for broad-scale plot-based vegetation classification. Appl. Veg. Sci. 2015, 18, 543–560. [Google Scholar] [CrossRef]
  60. Lasco, R.D.; Delfino, R.J.P.; Espaldon, M.L.O. Agroforestry systems: Helping smallholders adapt to climate risks while mitigating climate change. Wiley Interdiscip. Rev. Clim. Chang. 2014, 5, 825–833. [Google Scholar] [CrossRef]
  61. Oliver, T.H.; Heard, M.S.; Isaac, N.J.B.; Roy, D.B.; Procter, D.; Eigenbrod, F.; Freckleton, R.; Hector, A.; Orme, C.D.L.; Petchey, O.L.; et al. Biodiversity and Resilience of Ecosystem Functions. Trends Ecol. Evol. 2015, 30, 673–684. [Google Scholar] [CrossRef] [PubMed]
  62. Fanfarillo, E.; Zangari, G.; Küzmič, F.; Fiaschi, T.; Bonari, G.; Angiolini, C. Summer roadside vegetation dominated by Sorghum halepense in peninsular Italy: Survey and classification. Rend. Lincei Sci. Fis. Nat. 2022, 33, 93–104. [Google Scholar] [CrossRef]
  63. Connell, J.H. Diversity in Tropical Rain Forests and Coral Reefs. Science 1978, 199, 1302–1310. [Google Scholar] [CrossRef] [PubMed]
  64. Catford, J.A.; Daehler, C.C.; Murphy, H.T.; Sheppard, A.W.; Hardesty, B.D.; Westcott, D.A.; Rejmánek, M.; Bellingham, P.J.; Pergl, J.; Horvitz, C.C.; et al. The intermediate disturbance hypothesis and plant invasions: Implications for species richness and management. Perspect. Plant Ecol. Evol. Syst. 2012, 14, 231–241. [Google Scholar] [CrossRef]
  65. Boch, S.; Prati, D.; Müller, J.; Socher, S.; Baumbach, H.; Buscot, F.; Gockel, S.; Hemp, A.; Hessenmöller, D.; Kalko, E.K.V.; et al. High plant species richness indicates management-related disturbances rather than the conservation status of forests. Basic Appl. Ecol. 2013, 14, 496–505. [Google Scholar] [CrossRef]
  66. Gauch, H.G. Multivariate Analysis in Community Ecology; Cambridge University Press: Cambridge, UK, 1982. [Google Scholar]
  67. Saima, S.; Dasti, A.A.; Hussain, F.; Wazir, S.M.; Malik, S.A. Floristic compositions along an 18-km long transect in Ayubia National Park district Abbottabad, Pakistan. Pak. J. Bot. 2009, 41, 2115–2127. [Google Scholar]
  68. Xia, K.; Daws, M.I.; Peng, L.L. Climate drives patterns of seed traits in Quercus species across China. New Phytol. 2022, 234, 1628–1638. [Google Scholar] [CrossRef] [PubMed]
  69. Acharya, B.K.; Chettri, B.; Vijayan, L. Distribution pattern of trees along an elevation gradient of Eastern Himalaya, India. Acta Oecol. 2011, 37, 329–336. [Google Scholar] [CrossRef]
  70. Souza, A.A.; Galvão, L.S.; Santos, J.R. Relationships between Hyperion-derived vegetation indices, biophysical parameters, and elevation data in a Brazilian savannah environment. Remote Sens. Lett. 2010, 1, 55–64. [Google Scholar] [CrossRef]
  71. Blasi, C.; Capotorti, G.; Copiz, R.; Guida, D.; Mollo, B.; Smiraglia, D.; Zavattero, L. Classification and mapping of the ecoregions of Italy. Plant Biosyst. 2014, 148, 1255–1345. [Google Scholar] [CrossRef]
  72. Gaston, K.J.; Blackburn, T.M.; Goldewijk, K.K. Habitat conversion and global avian biodiversity loss. Proc. R. Soc. B Biol. Sci. 2003, 270, 1293–1300. [Google Scholar] [CrossRef]
  73. Guo, Y.; Schöb, C.; Ma, W.; Mohammat, A.; Liu, H.; Yu, S.; Jiang, Y.; Schmid, B.; Tang, Z. Increasing water availability and facilitation weaken biodiversity–biomass relationships in shrublands. Ecology 2019, 100, e02624. [Google Scholar] [CrossRef]
  74. Lai, L.; Huang, X.; Yang, H.; Chuai, X.; Zhang, M.; Zhong, T.; Chen, Z.; Chen, Y.; Wang, X.; Thompson, J.R. Carbon emissions from land-use change and management in China between 1990 and 2010. Sci. Adv. 2016, 2, e1601063. [Google Scholar] [CrossRef] [PubMed]
  75. Lenihan, J.M.; Drapek, R.; Bachelet, D.; Neilson, R.P. Climate change effects on vegetation distribution, carbon, and fire in California. Ecol. Appl. 2003, 13, 1667–1681. [Google Scholar] [CrossRef]
  76. Tang, X.; Zhao, X.; Bai, Y.; Tang, Z.; Wang, W.; Zhao, Y.; Wan, H.; Xie, Z.; Shi, X.; Wu, B.; et al. Carbon pools in China’s terrestrial ecosystems: New estimates based on an intensive field survey. Proc. Natl. Acad. Sci. USA 2018, 115, 4021–4026. [Google Scholar] [CrossRef]
  77. Spribille, T.; Stroh, H.G.; Triepke, F.J. Are habitat types compatible with floristically-derived associations? J. Veg. Sci. 2001, 12, 791–796. [Google Scholar] [CrossRef]
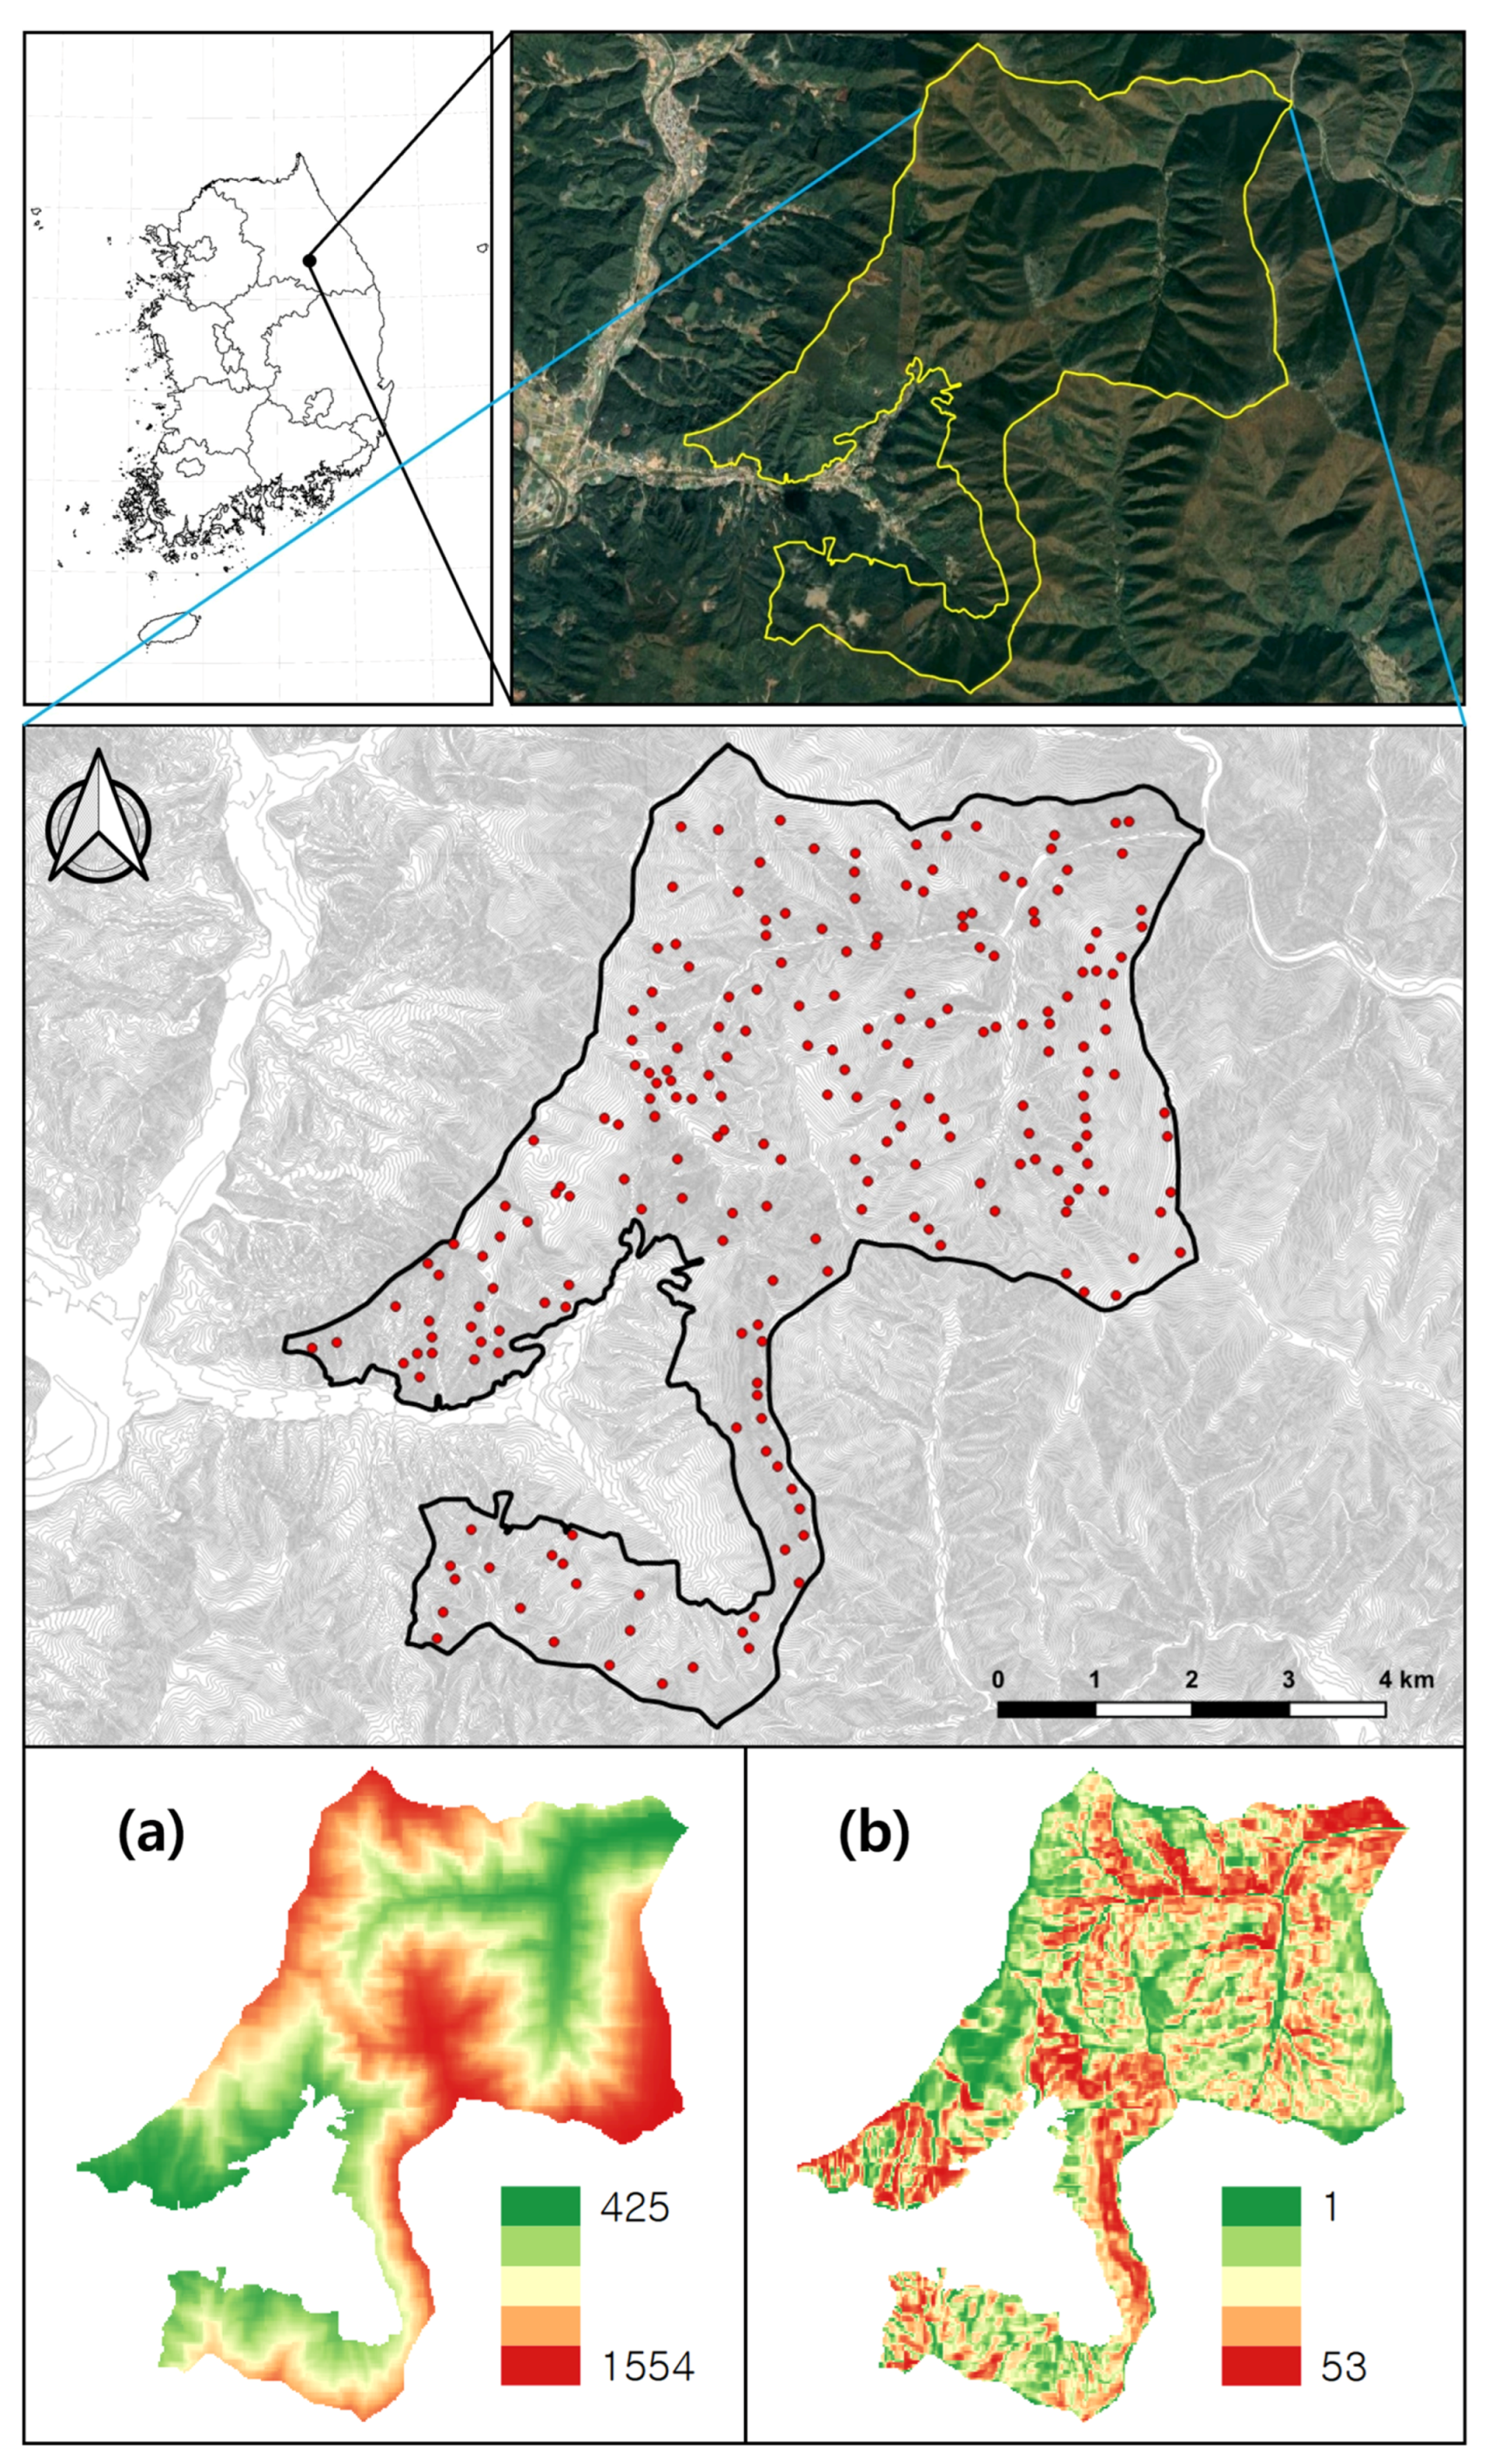
Figure 1. Geographical location map of South Korea focused on the study area (yellow boundary), showing the selected sampling stands (red dots), along with raster image information of elevation (a) and slope (b).
Diversity 17 00040 g001
Figure 2. Monthly temperature and precipitation data for the study area over the last 30 years (1991–2020).
Diversity 17 00040 g002
Figure 3. Floristic diversity in the 216 selected sampling stands on Mt. Gariwang is shown as the number of identified plant species and their families (a), and the life forms of these species (b).
Diversity 17 00040 g003
Figure 4. Summary box-and-whisker plots of forest composition, species richness (a), and diversity (b) indices. The center line of each box represents the median, the box boundaries represent the lower (25%) and upper (75%) quartiles, and the range of values. Points outside the boundary represent outliers. Each letter is marked with Duncan’s post hoc test.
Diversity 17 00040 g004
Figure 5. Canonical correspondence analysis (CCA) of 216 samples. CCA ordination diagram related to environmental properties. VT 1–8 represents clustered communities. Colorful ovals and achromatic color symbols appear differently depending on the VT. Biplot represents the ordination according to the environmental properties of the cluster, and the most important variables identified are passively projected onto the ordination plane. Ch: chamaephyte, MM: megaphanerophyte, D1: disseminated widely by wind or water, D2: disseminated attaching with or eaten by animals and man, D4: having no special modification for dissemination, R1: widest extent of rhizomatous growth, e: erect form, l: liane form, ELEV: elevation.
Diversity 17 00040 g005
Figure 6. A detailed physiognomic vegetation map of the study area.
Diversity 17 00040 g006
Table 1. The classification of species groups and vegetation types following forest vegetation classification. The left side of each letter represents the constancy class, and the lower-right subscripts represent the maximum and minimum values of the recorded cover.
Vegetation unitsA
ab
IIIIIIIV
iiiiiiiv
12
Vegetation typesVT1VT2VT3VT4VT5VT6VT7VT8
Total number of species2581262211611459611087
Average number of species (/100 m2)22.517.514.010.624.130.211.812.6
Number of plots5822311735291311
--Species group 1_Character and differential species of Quercus mongolica-Fraxinus rhynchophylla community group
Quercus mongolicaIII5rII5rIII5rV54V51V5rV5+
Fraxinus rhynchophyllaV5rIII4rIV4rIII2rIII2rIII2rV3rV3+
--Species group 2_Character and differential species of Acer pictum var. mono-Acer pseudosieboldianum community
Acer pictum var. monoIII5rV2rIV5rIV2rII1rIII2rII2+II3r
Acer pseudosieboldianumII3+III3+III3+IV3+IV4+III4+I2r
Schisandra chinensisIV4+IV2rIV3rIII1+II++I3r
--Species group 3_Character and differential species of Kalopanax septemlobus-Actinidia arguta subcommunity
Kalopanax septemlobusIII1rI5rII4r II3rI2rIIrr
Actinidia argutaIII3rIII3rI2+ I++I++I++
Morus bombycisIII3rII3+II1r I1r(r)11 I++
--Species group 4_Character and differential species of Cornus controversa-Staphylea bumalda group
Cornus controversaII3rI11III3rI22I11I1rI++
Staphylea bumaldaIII3rI2rI1r (r)++I++Irr
Rubus pungensII4+ I+rI33I++(r)++I32I++
Aralia elataII3r(r)++(r)++Irr(r)++ I1+
--Species group 5_Character and differential species of Dryopteris crassirhizoma-Polystichum tripteron group
Dryopteris crassirhizomaII3+V4+III3+II11I1+
Polystichum tripteron(r)++IV2rII1rI1rI+rIrr
Philadelphus schrenkiiII3+IV3rII2rII+r I11
Deutzia glabrataI2+II4+III3+I1r
Magnolia sieboldiiI1+III4rII2+I++II2+II3+
--Species group 6_Character and differential species of Acer mandshuricum-Ulmus laciniata subgroup
Acer mandshuricumI+rI21III5+I++ I+r
Ulmus laciniataI++II4rIII3rIrr
Sambucus kamtschaticaII1r(r)++III1rI+r(r)++
Prunus padusI+r(r)++III2+I1r(r)++I++
--Species group 7_Character and differential species of Tilia amurensis-Tripterygium regelii subcommunity
Tilia amurensisI4+II5+II5rII1rIII3rI1+I++
Tripterygium regeliiII3+(r)22II1+IV3+IV3rIII2rI++
Symplocos sawafutagiII1r(r)++I++III3+IV2rII1+II1+
--Species group 8_Character and differential species of Sasa borealis group
Sasa borealis(r)rrI32I+rI3+I51V5+
--Species group 9_Character and differential species of Ainsliaea acerifolia-Pseudostellaria heterophylla group
Ainsliaea acerifolia(r)++(r)33II2+IV4+III4+
Pseudostellaria heterophyllaI2+I++III2+IV2+II+r
Carex siderostictaI1+ I2+III2+III1rI++IV1r
Stephanandra incisaII3r(r)++I2+II2+III3rI1+
Athyrium yokoscenseII1rI1+II++III1+II1+I1rIrr
--Species group 10_Character and differential species of Calamagrostis arundinacea-Artemisia stolonifera subgroup
Calamagrostis arundinaceaI+r(r)rrI2+IV3+I2+I1+I++I++
Artemisia stoloniferaII++ II++IV1+I++(r)++I+r
Angelica decursivaI+rI+rII+rIV+rI++ Irr
Isodon excisusII3r III3+III4+I2rI+rI11I++
--Species group 11_Character and differential species of Lindera obtusiloba-Carex humilis var. nana community
Lindera obtusilobaIV4rIII3rII2+I++IV4rIV3rV5+IV3+
Carex humilis var. nana(r)++ I++I1+I2rII1rV2rV3+
Lespedeza bicolorI+r I1rIrrIV3+IV1+
--Species group 12_Character and differential species of Ampelopsis glandulosa var. heterophylla-Artemisia keiskeana subcommunity
Ampelopsis glandulosa var. heterophyllaII1rI1+I+rIII+rII+r(r)++IV1+II++
Artemisia keiskeanaI+r (r)++ I+r(r)11III1+II++
Lonicera praeflorensII1rI++(r)++I++I+r III++I++
Lonicera subsessilisI1+I++I3+I+rII+rI1+III2+I21
--Species group 13_Character and differential species of Quercus dentata-Quercus variabilis subcommunity
Quercus dentata(r)2r II5+V51
Quercus variabilis II5rV51
Dioscorea quinquelobaI+r I++I++ (r)++ IV++
Spiraea chinensis(r)11 IV1+
Companions omitted (351 spp.)
Table 2. Characteristics of spatial distribution and patches by physiognomic vegetation types in the study area.
OriginPhysiognomy
Vegetation Type
Community
Spatial DistributionPatch
Area
(ha)
Ratio
(%)
Number
(Trees)
Average
Area
(ha)
Natural
forest
Abies nephrolepis23.260.6123.26
Acer mandshuricum38.510.9312.84
Acer pictum var. mono88.182.299.80
Aria alnifolia7.860.217.86
Betula dahurica26.800.7126.80
Betula ermanii85.222.1614.20
Betula schmidtii112.682.81110.24
Carpinus cordata9.340.219.34
Cornus controversa50.731.3316.91
Fraxinus mandshurica101.202.5520.24
Fraxinus rhynchophylla95.032.3811.88
Juglans mandshurica28.130.747.03
Kalopanax septemlobus27.710.746.93
Maackia amurensis18.360.5118.36
Pinus densiflora310.707.71102.82
Prunus sargentii5.810.122.91
Prunus serrulate var. pubescens7.800.217.80
Quercus dentata30.900.856.18
Quercus mongolica1739.6142.95233.45
Quercus variabilis69.841.7116.35
Taxus cuspidata6.980.216.98
Tilia amurensis98.752.4109.87
Tilia mandshurica14.880.427.44
Ulmus davidiana var. japonica32.610.848.15
Ulmus laciniata21.610.5210.80
Ulmus macrocarpa32.640.856.53
Subtotal3085.1576.126311.73
Artificial
forest
Abies holophylla16.610.472.37
Betula pendula10.990.3120.92
Larix kaempferi629.9615.5867.33
Pinus koraiensis147.033.6393.77
Subtotal804.5919.81445.59
Non-forest land37.770.9103.78
Non-stocked area127.773.2642.00
Subtotal165.544.1742.24
Total4055.28100.04818.43
Disclaimer/Publisher’s Note: The statements, opinions and data contained in all publications are solely those of the individual author(s) and contributor(s) and not of MDPI and/or the editor(s). MDPI and/or the editor(s) disclaim responsibility for any injury to people or property resulting from any ideas, methods, instructions or products referred to in the content.