Article

Seventies Rule for the Establishment of Non-Native Marine Species

by
Stan Coppis
1,2 and
Arjan Gittenberger
1,3,*
1
GiMaRIS, Rijksstraatweg 75, 2171 AK Sassenheim, The Netherlands
2
Marine Animal Ecology, Wageningen University, P.O. Box 338, 6700 AH Wageningen, The Netherlands
3
Naturalis Biodiversity Center, Darwinweg 2, 2333 CR Leiden, The Netherlands
*
Author to whom correspondence should be addressed.
Diversity 2025, 17(1), 18; https://doi.org/10.3390/d17010018
Submission received: 30 October 2024 / Revised: 17 December 2024 / Accepted: 23 December 2024 / Published: 27 December 2024
(This article belongs to the Section Marine Diversity)

Abstract

:
Invasive non-native marine species have significant and far-reaching impacts on ecosystems, recreation, human health, and various industries worldwide. To mitigate this, it is crucial to be able to predict the likelihood of the establishment of non-native species. To that end, we reviewed twenty-two published lists of non-native species from the NE Atlantic and Mediterranean, plus five from other seas and oceans. From 1991 to 2020, 76% of the newly detected species in the NE Atlantic and Mediterranean, on average per region, became established. Similar rates were found for the Baltic Sea, New Zealand, South Africa, and Brazil, respectively: 77%, 73%, 73%, and 67%. A rate of 100% was reported for the Black Sea, however. While percentages fluctuate across regions, they do not significantly seem to differ over time within regions. Where available, using historical data is therefore recommended, taking into account regional circumstances. As a preliminary indicator, we propose the Seventies Rule for predicting the establishment success of newly detected species in the NE Atlantic and Mediterranean. With only five datasets from other areas in our studies, global applicability remains to be demonstrated. Policymakers, managers, and researchers can use our findings to predict establishment and decide on actions for invasive non-native marine species.

1. Introduction

Non-native marine species have an impact on various systems globally, including native biodiversity, human health, and industrial and economic activities [1,2,3,4,5]. Species may be introduced to foreign regions through transportation pathways, such as shipping or aquaculture. After introduction, some species enter a lag time phase during which individuals establish themselves, often on artificial substrates [6]. The length of this lag phase and the species’ local persistence depend on various ecological and biological variables. Even if some specimens of a non-native species are able to settle on a floating dock, reproductive success and subsequent proliferation are not assured. They vary per species and depend on environmental constraints, like low winter temperatures that may kill them, and biological limitations. If, for example, only one gender is present, reproduction may be impossible. Furthermore, susceptibility to indigenous pathogens and predators, coupled with a paucity of appropriate settlement habitats proximate to the initial settlement site, may constrain their proliferation and spread. For those non-native species that do survive and establish, these factors probably also influenced the duration of their lag lime. Considering this, if a new species is discovered, management may, in selected cases, focus on making the environment less suitable for their survival, proliferation, and further spread. More broadly, this could be conducted pre-emptively to prevent initial settlement. Actions may include removing or cleaning suitable habitats, such as floating docks, where organisms have settled, especially if alternative establishment habitats are unavailable nearby. Although challenging, successfully managing marine non-native species during their lag phase is achievable, as evidenced by, for example, the local eradication of Terebrasabella heterouncinata [7], Perna perna [8], and Undaria pinnatifida [9,10]. These examples show that within the lag time, species may still be eradicated in specific cases, while eradication becomes virtually impossible later on, when they start to establish and spread themselves more widely in natural environments. Different definitions of establishment are in use [11] but it is generally assumed that establishment refers to a species’ capacity to adapt, reproduce, and survive in the midst of local abiotic fluctuations [12,13,14], forming a self-sustaining population. When established, some non-native marine species can spread rapidly because of the relatively high connectivity between marine systems and the often-high dispersal capacities and reproduction rates of especially invasive marine species. Consequently, managing the spread and impact of such species becomes increasingly challenging after establishment [1,13].
When deciding to handle a newly discovered non-native species, one must weigh the urgency of acting quickly during the invasion lag time phase against the possibility that the species may not survive and establish itself anyway. In the latter case, doing nothing is the more cost-effective option.
To predict the potential establishment of such a species, the Tens Rule Theory developed in the 1990s [15,16,17,18] is often cited. This popularised rule of thumb is commonly used in management policies and assumes that 10% of introduced non-native species will become established and, subsequently, 10% of those will turn invasive. Although this theory was based on terrestrial plants in the United Kingdom, it is frequently used and assumed applicable to other environments as well [18].
The general applicability of this rule for marine non-native species seems unlikely, however, as much higher establishment rates have been reported for marine regions. In the Mediterranean Sea, for example, around 76% of all detected non-native marine species [14], and 70% of the non-native crustaceans [19], managed to establish themselves. For British brackish and marine waters, it has been reported that 64% of the non-native species established themselves [20].
These records led the present study to question whether a broader pattern or rule, akin to the Tens Rule, can be found for predicting the establishment chances of newly detected non-native marine species. While our focus was on studying publications with lists of newly detected non-native marine species between 1991 and 2020 in the Northeastern Atlantic and Mediterranean seas, we also compared datasets from other time periods and other seas worldwide. Based on our preliminary studies, we anticipated that establishment percentages would far exceed the expectations of the Tens Rule.

2. Materials and Methods

2.1. Data Collection

Using 27 published lists of non-native species from different marine regions across the globe, we assessed and compared establishment percentages [11,14,21,22,23,24,25,26,27,28,29,30,31,32,33]. To be more accurate, we determined the percentage of non-native marine species that were recorded in a region or sea, which eventually managed to establish themselves. While this percentage is commonly referred to as the rate of established introduced species, we recognize that this is inaccurate as many introductions may remain unnoticed.
For our calculations, we focused on datasets and publications that provided information on species establishment inferred from evidence of a self-sustaining population. Across datasets, it was unclear what exactly constitutes sufficient evidence of establishment and exact definitions slightly differed. Regardless, we assumed that such evidence always involved multiple sightings of a species over multiple years. For each of the 27 datasets, Table S1 details why the species were considered established or not established in our analyses. Tables S2 and S3 list, for each of the datasets, which species were considered established and not established, respectively. Hereby, in general, we considered species established if they were labeled as established, naturalized, or invasive, or if they were given a similar status indicating establishment. The establishment of the non-native marine species listed in a study conducted in the Netherlands [21] and a study in the Republic of Ireland [22] was evaluated using the supplementary literature and datasets by searching for any mention of species establishment. Additionally, proof of the species being observed multiple times in the same geographic location in different years was also assumed to indicate establishment. For the species list of the Netherlands [21], the following supplementary sources were used: a report on marine non-native species inventories in the Wadden Sea [34], a general publication on the non-native marine and estuarine species of the Netherlands [35], the Dutch Species Register and the corresponding literature found therein (https://www.nederlandsesoorten.nl/, accessed on 10 October 2024), and specific species-focused articles on Barentsia ramosa [36], Polydora websteri [37], Pseudodiaptomus marinus [38], and Polysiphonia morrowii [39]. For the species list of the Republic of Ireland [22], two supplementary datasets were used to assess the establishment of non-native species, viz., a study on non-native species and aquaculture [40] and the National Biodiversity Data Centre (https://biodiversityireland.ie/, accessed on 4 October 2024).
More in-depth analyses were carried out on 16 datasets that included species newly detected between 1991 and 2020 in the NE Atlantic and Mediterranean. These species lists can be found in Tables S4 and S5. If a dataset permitted the analysis of distinct seas, this was conducted, for example, for Spain, where [24] allowed for the separate analysis of the Bay of Biscay, Macaronesia, and the Mediterranean.
In order to maintain comparability between datasets, the Taxon Match tool from the World Register of Marine Species [41] was used to check and revise species nomenclature. Additionally, to ensure consistency and comparability, certain species groups were excluded, in all 27 datasets, from the analyses. This was mainly based on the assessment that these taxa were not or at least unequally represented and scored across the datasets.
Across the 27 datasets, 1959 distinct marine non-native species were included. Aiming for dataset consistency, the categories of species described below were removed from all 27 datasets prior to calculating establishment percentages. See Tables S2 and S3 detailing, per species, whether they were excluded and why. After removing these species, the dataset used to compute establishment percentages still contained 1275 species. The following categories of species were excluded:
  • Non-native species that expanded their range without human assistance, also known as range expanders. It turned out that no species needed to be excluded solely because they were range expanders. Those that were excluded were excluded because they were also considered cryptogenic or of unknown origin (see below);
  • Species of which no settled individuals or colonies were observed on artificial structures, like pilings or docks, or “settled” in a natural environment. Thus, organisms that were recorded solely from hull fouling communities, in their pelagic larval stages, or washed ashore on beaches were excluded. Of the 27 datasets, only the New Zealand dataset contained these species. A total of 86 species were omitted as they were only recorded from vessel hulls in that dataset;
  • Species with an unknown origin and/or those considered to be cryptogenic. Approximately 4% of the species (86 out of 1959) across the 27 datasets were excluded;
  • Species that prefer to establish themselves in waters with salinities < 5 ppt. Approximately 2% of the species (34 out of 1959) across the 27 datasets were excluded due solely to their preference for low-salinity environments (<5 ppt). In many of the datasets, these species (e.g., the Quagga mussel Dreissena bugensis) were already excluded. To ensure consistency, they were removed from all datasets prior to calculating establishment percentages;
  • Microorganisms (<2 mm), including planktonic species and pathogens like bacteria, viruses, and fungi. Approximately 10% of the species (202 out of 1959) across the 27 datasets were excluded. The inclusion of these species varied considerably across the datasets. For example, six datasets did not contain any planktonic species while four datasets only had one planktonic species recorded and one Mediterranean dataset had sixty-four planktonic species included. To ensure consistency across datasets, all these species were excluded;
  • Endo-parasites. Just 8 of the 1959 species reported across the 27 datasets were excluded as they were endo-parasites. To maintain consistency, endo-parasites were omitted because they were not considered for inclusion in most datasets;
  • Vascular plants. Just 9 of the 1959 species reported across the 27 datasets were excluded as they concerned vascular plants. To maintain consistency, vascular plants were omitted because they were not considered for inclusion in most datasets;
  • Fish. This was mainly implemented to eliminate bias in the establishment percentages assessed for the Mediterranean Seas. The Suez Canal greatly impacts this region as an introduction pathway that resulted in relatively higher numbers of reported non-native fish species than any other geographical area, where much lower numbers of non-native marine fish are introduced and establish themselves. Of the total 130 non-native fish species that were reported as established across the 27 datasets, 110 were reported from the Mediterranean, 15 from the Atlantic regions, and only 5 additional ones from other seas (Table S2). Regarding the 190 fish species that were reported in at least one of the datasets as non-established, 126 concerned records in the Mediterranean, 41 in Atlantic regions, and only 23 from elsewhere (Table S2). Because the Suez Canal provides a unique type of introduction pathway for fish in the Mediterranean only, unlike any pathway close by other seas included in our analyses, all 275 fish species were excluded across the 27 datasets. Since most of these fish came through the Suez Canal, including them would have strongly biased the calculations.

2.2. Calculations and Statistical Analyses

For all 27 datasets the establishment percentage of marine species per region was calculated based on the total number of species that was recorded in that region and the number that was established, i.e., Establishment % = 100% × # established species/# recorded species. The more in-depth analyses described below were performed on the 16 datasets that met the criteria outlined in the previous paragraph.
To determine if the calculated establishment percentages exhibit a random distribution between a minimum and a maximum percentage or a normal distribution around a mean value, the Shapiro–Wilk test of normality was employed. When a normal distribution was confirmed, the mean establishment rate and its standard deviation (σ) were calculated. To test to what degree such establishment rates remain similar over time within regions, Chi-X2 tests (p < 0.05) were used comparing the most recent three decades, i.e., 1991–2000, 2001–2010, and 2011–2020. This test was only conducted for datasets with relatively large numbers of species, i.e., in which at least 5 non-natives were expected to have established themselves in each decade [42,43,44].
To determine whether establishment percentages in different seas are to a certain degree connected to similarities in established non-native species, a Permutational MANOVA (PERMANOVA) was conducted on established non-native species “communities”. This was completed for three areas, which were subjectively chosen considering the temperate to subtropical climate range from the Northeastern Atlantic to the Eastern Mediterranean. These analyses, and the ones described hereafter, were all conducted in PRIMER-e (v. 6, Albany, New Zealand) [45], using default settings based on the established species compositions in the 16 datasets. To assess the relative similarities in these compositions within and between the three areas, a Similarity Percentage analysis (SIMPER) was conducted. After testing for significant differences between species compositions in the three areas with the PERMANOVA analysis, a Sørensen resemblance matrix analysis was conducted. The results were then used for the CAP analysis (Canonical Analysis of Principal coordinates) to assess to what degree the three areas each have their own unique established non-native species [46]. To illustrate which species occurrences correlated with a Pearson correlation coefficient of >0.8 with the CAP-analysis graph, the overlay vector function was used. It shows which established non-native marine species can be seen as most typical (and possibly unique) for each of the three areas.

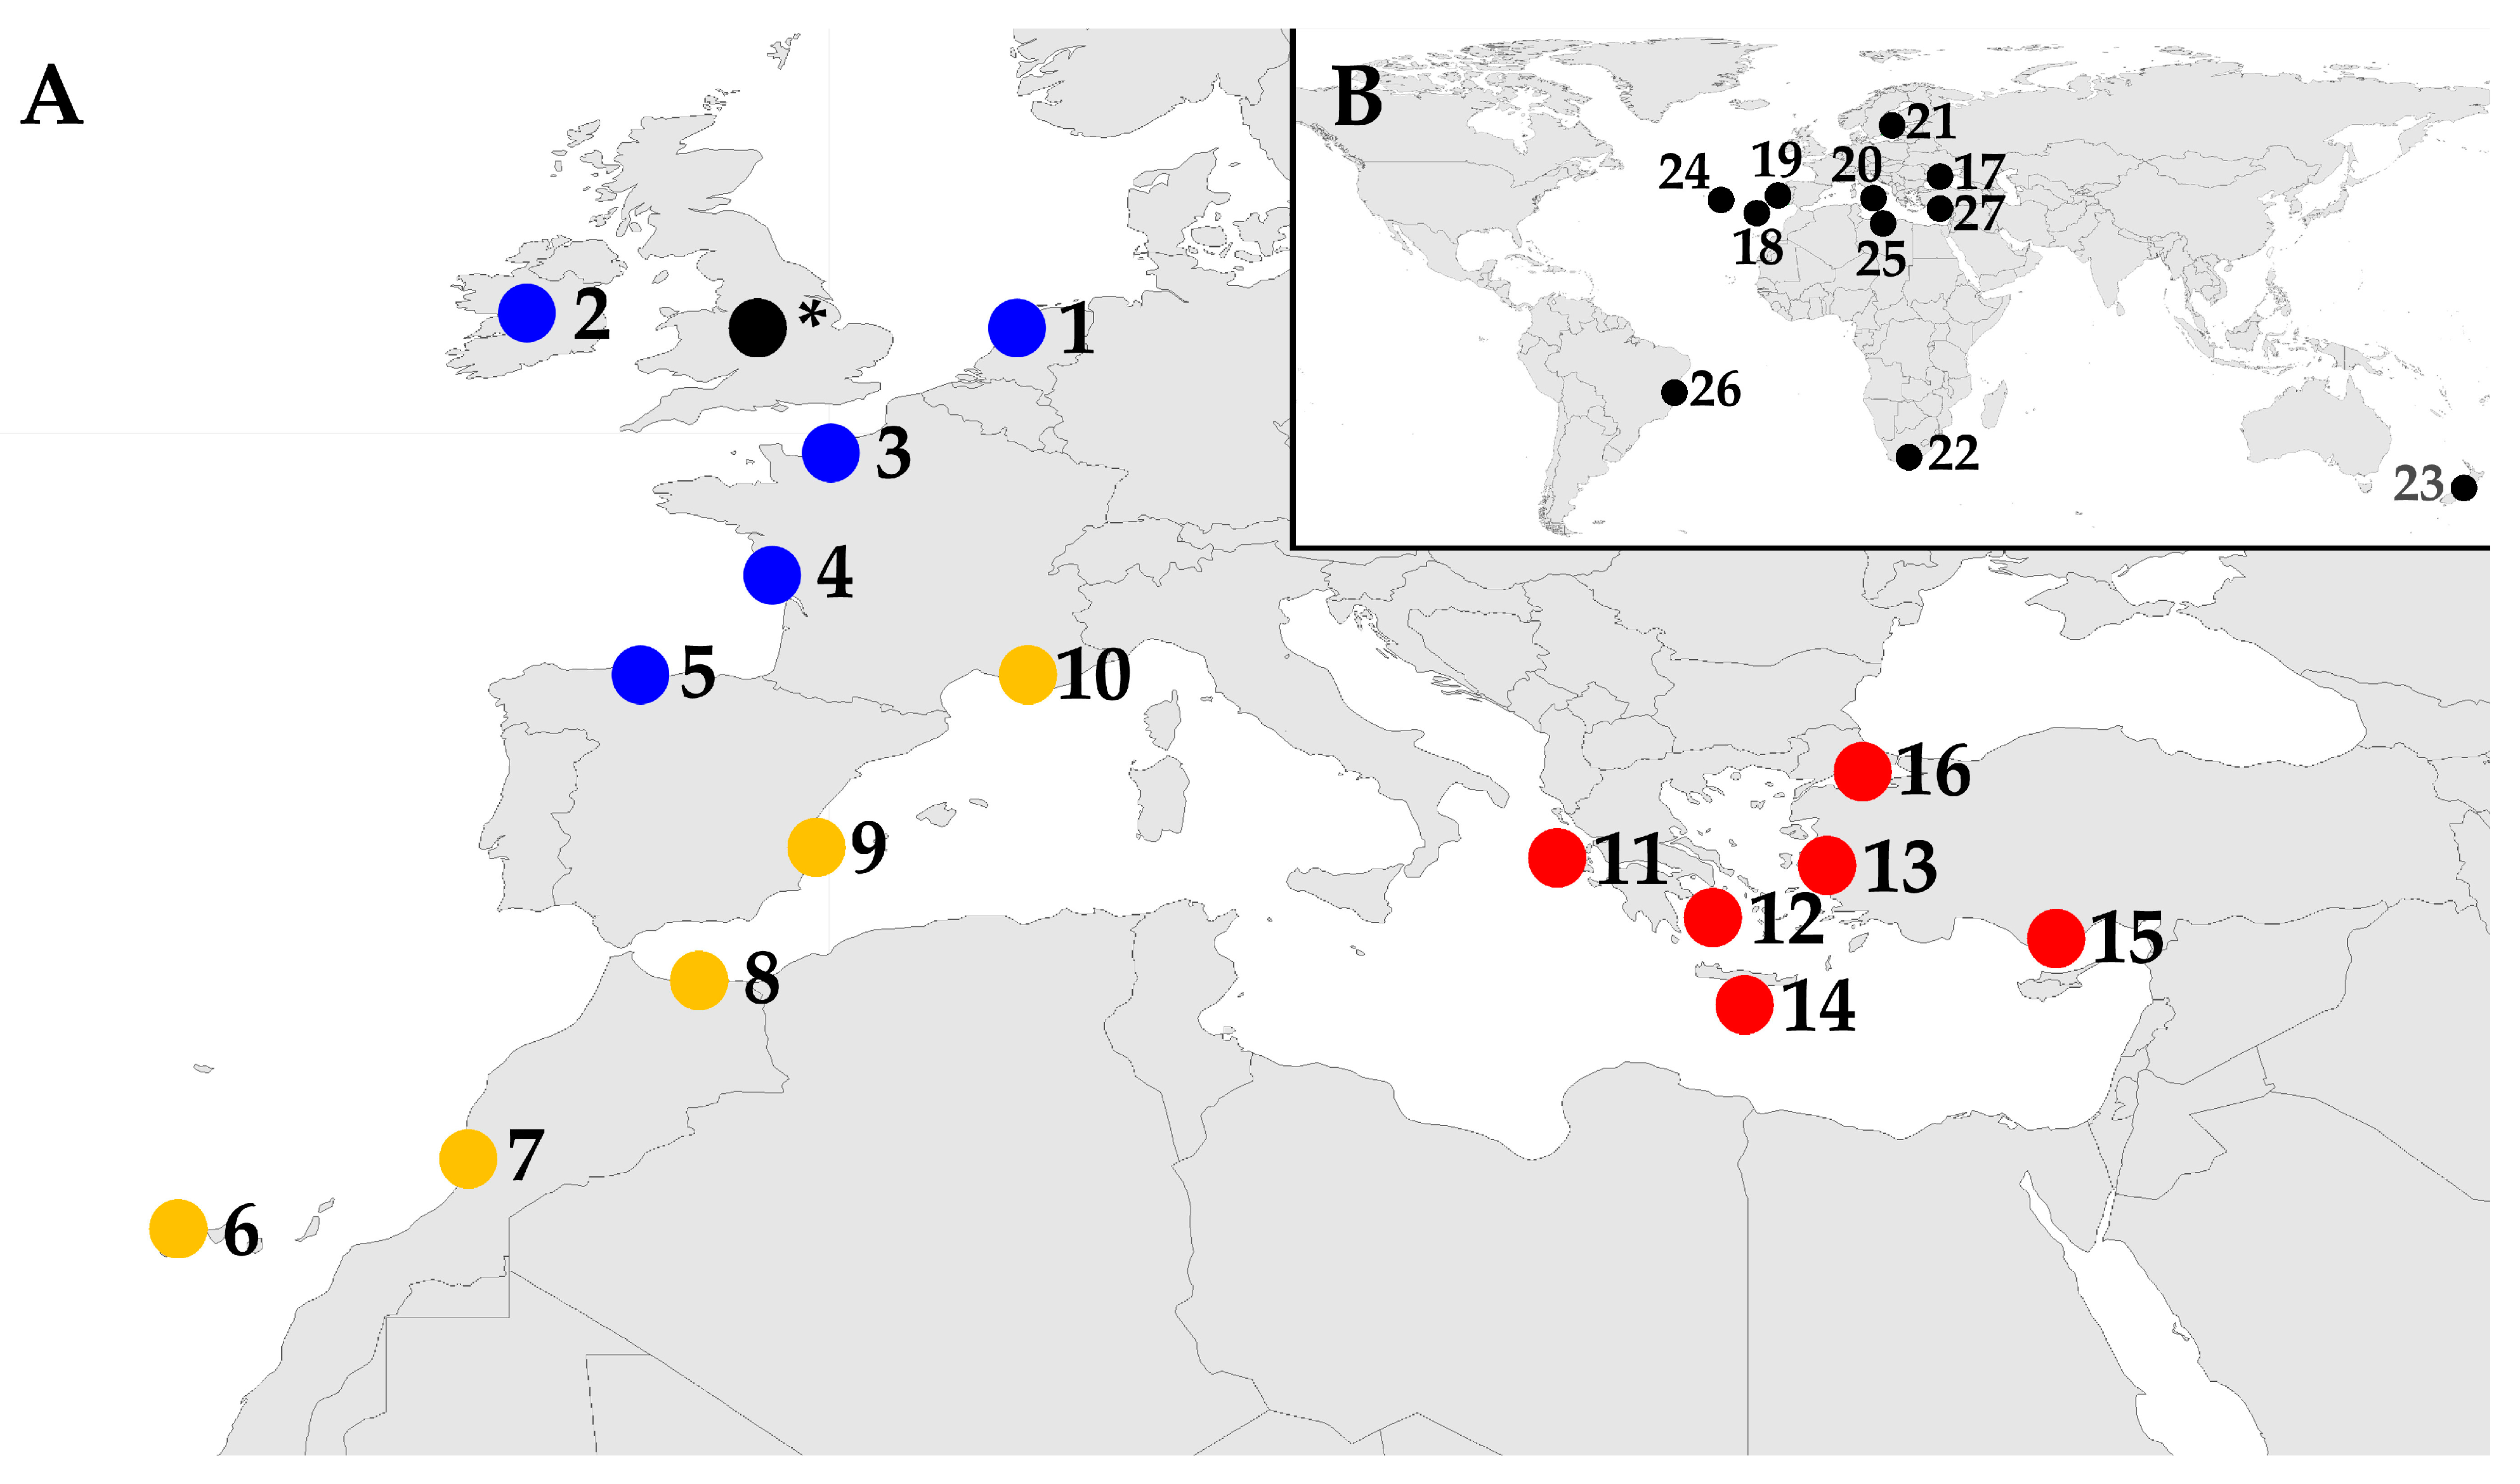
2.3. Geographical Distribution of the Regions Included in the Analyses

Species lists from 16 regions from the Northeastern Atlantic to the Mediterranean Sea were used for the more in-depth analyses (Figure 1A; Tables S4 and S5). They are subjectively grouped in Figure 1A for further analyses into three areas based on their temperate to subtropical climate, i.e., NE Atlantic, E Atlantic and W Mediterranean, and E Mediterranean. An additional 11 lists, which did not match the criteria set for the in-depth analyses, were only used for comparing establishment percentages. These included datasets from the same areas but also five additional ones from across the world (Figure 1B).

3. Results and Discussion

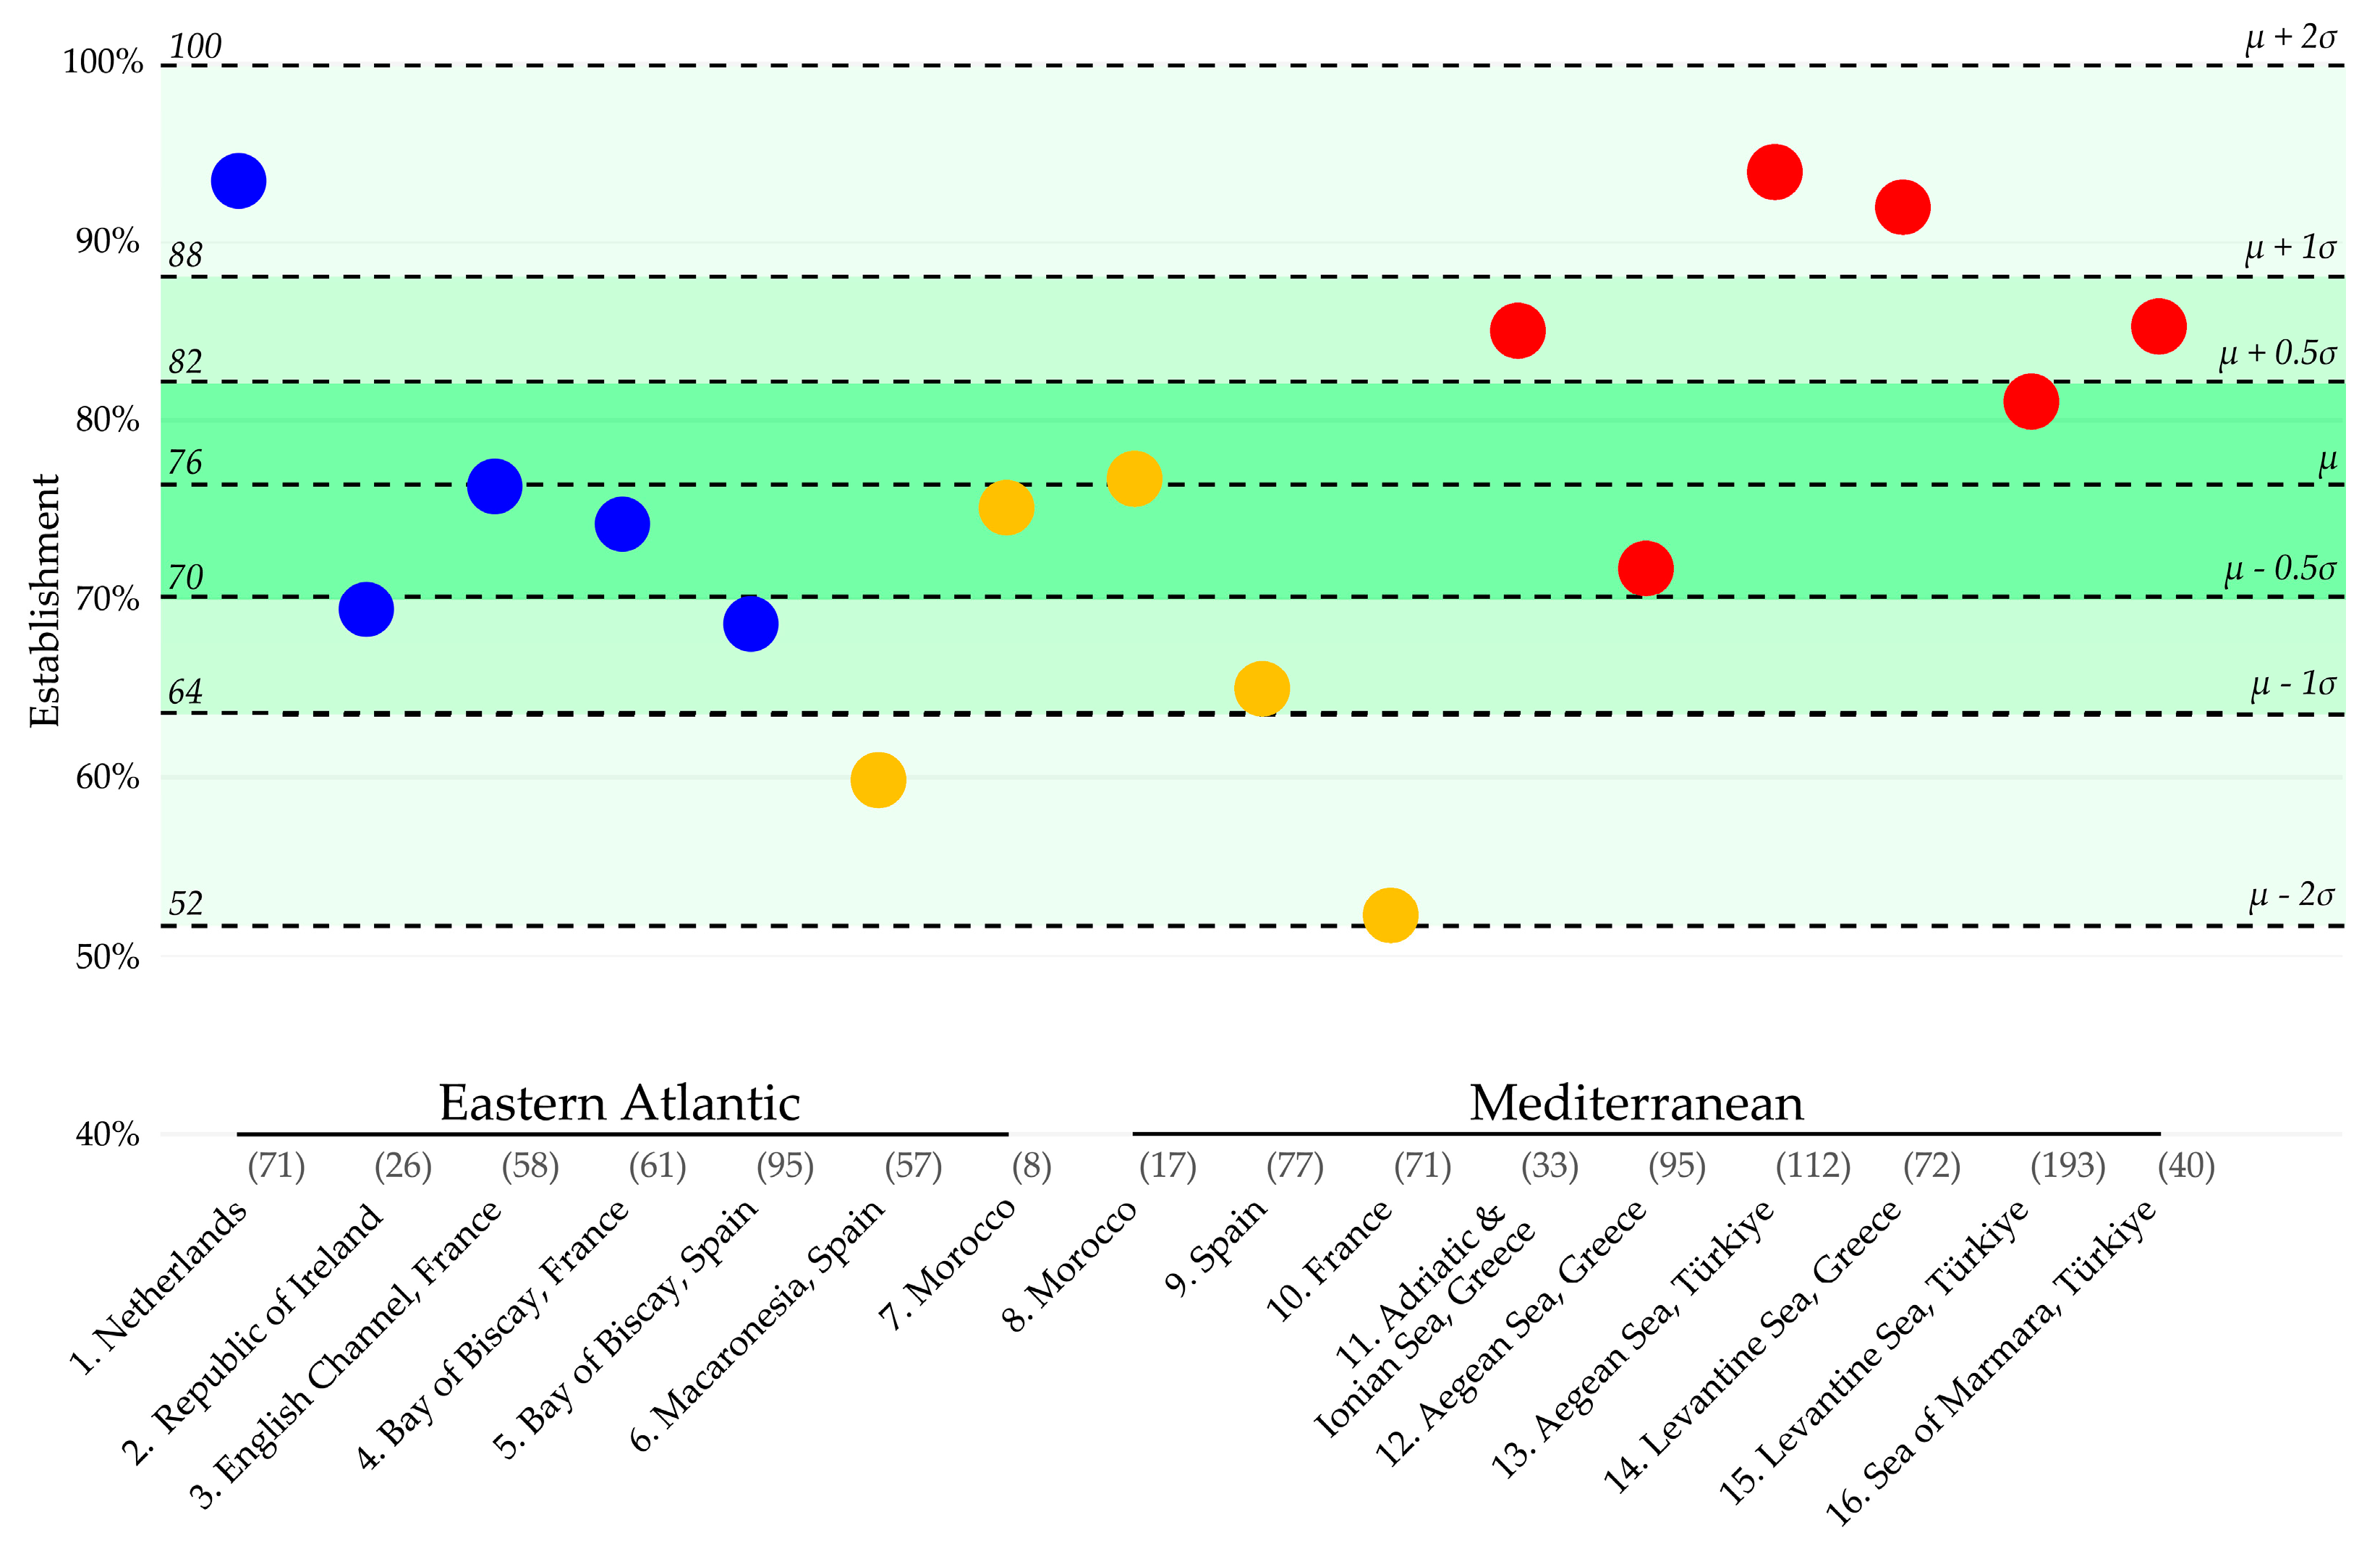
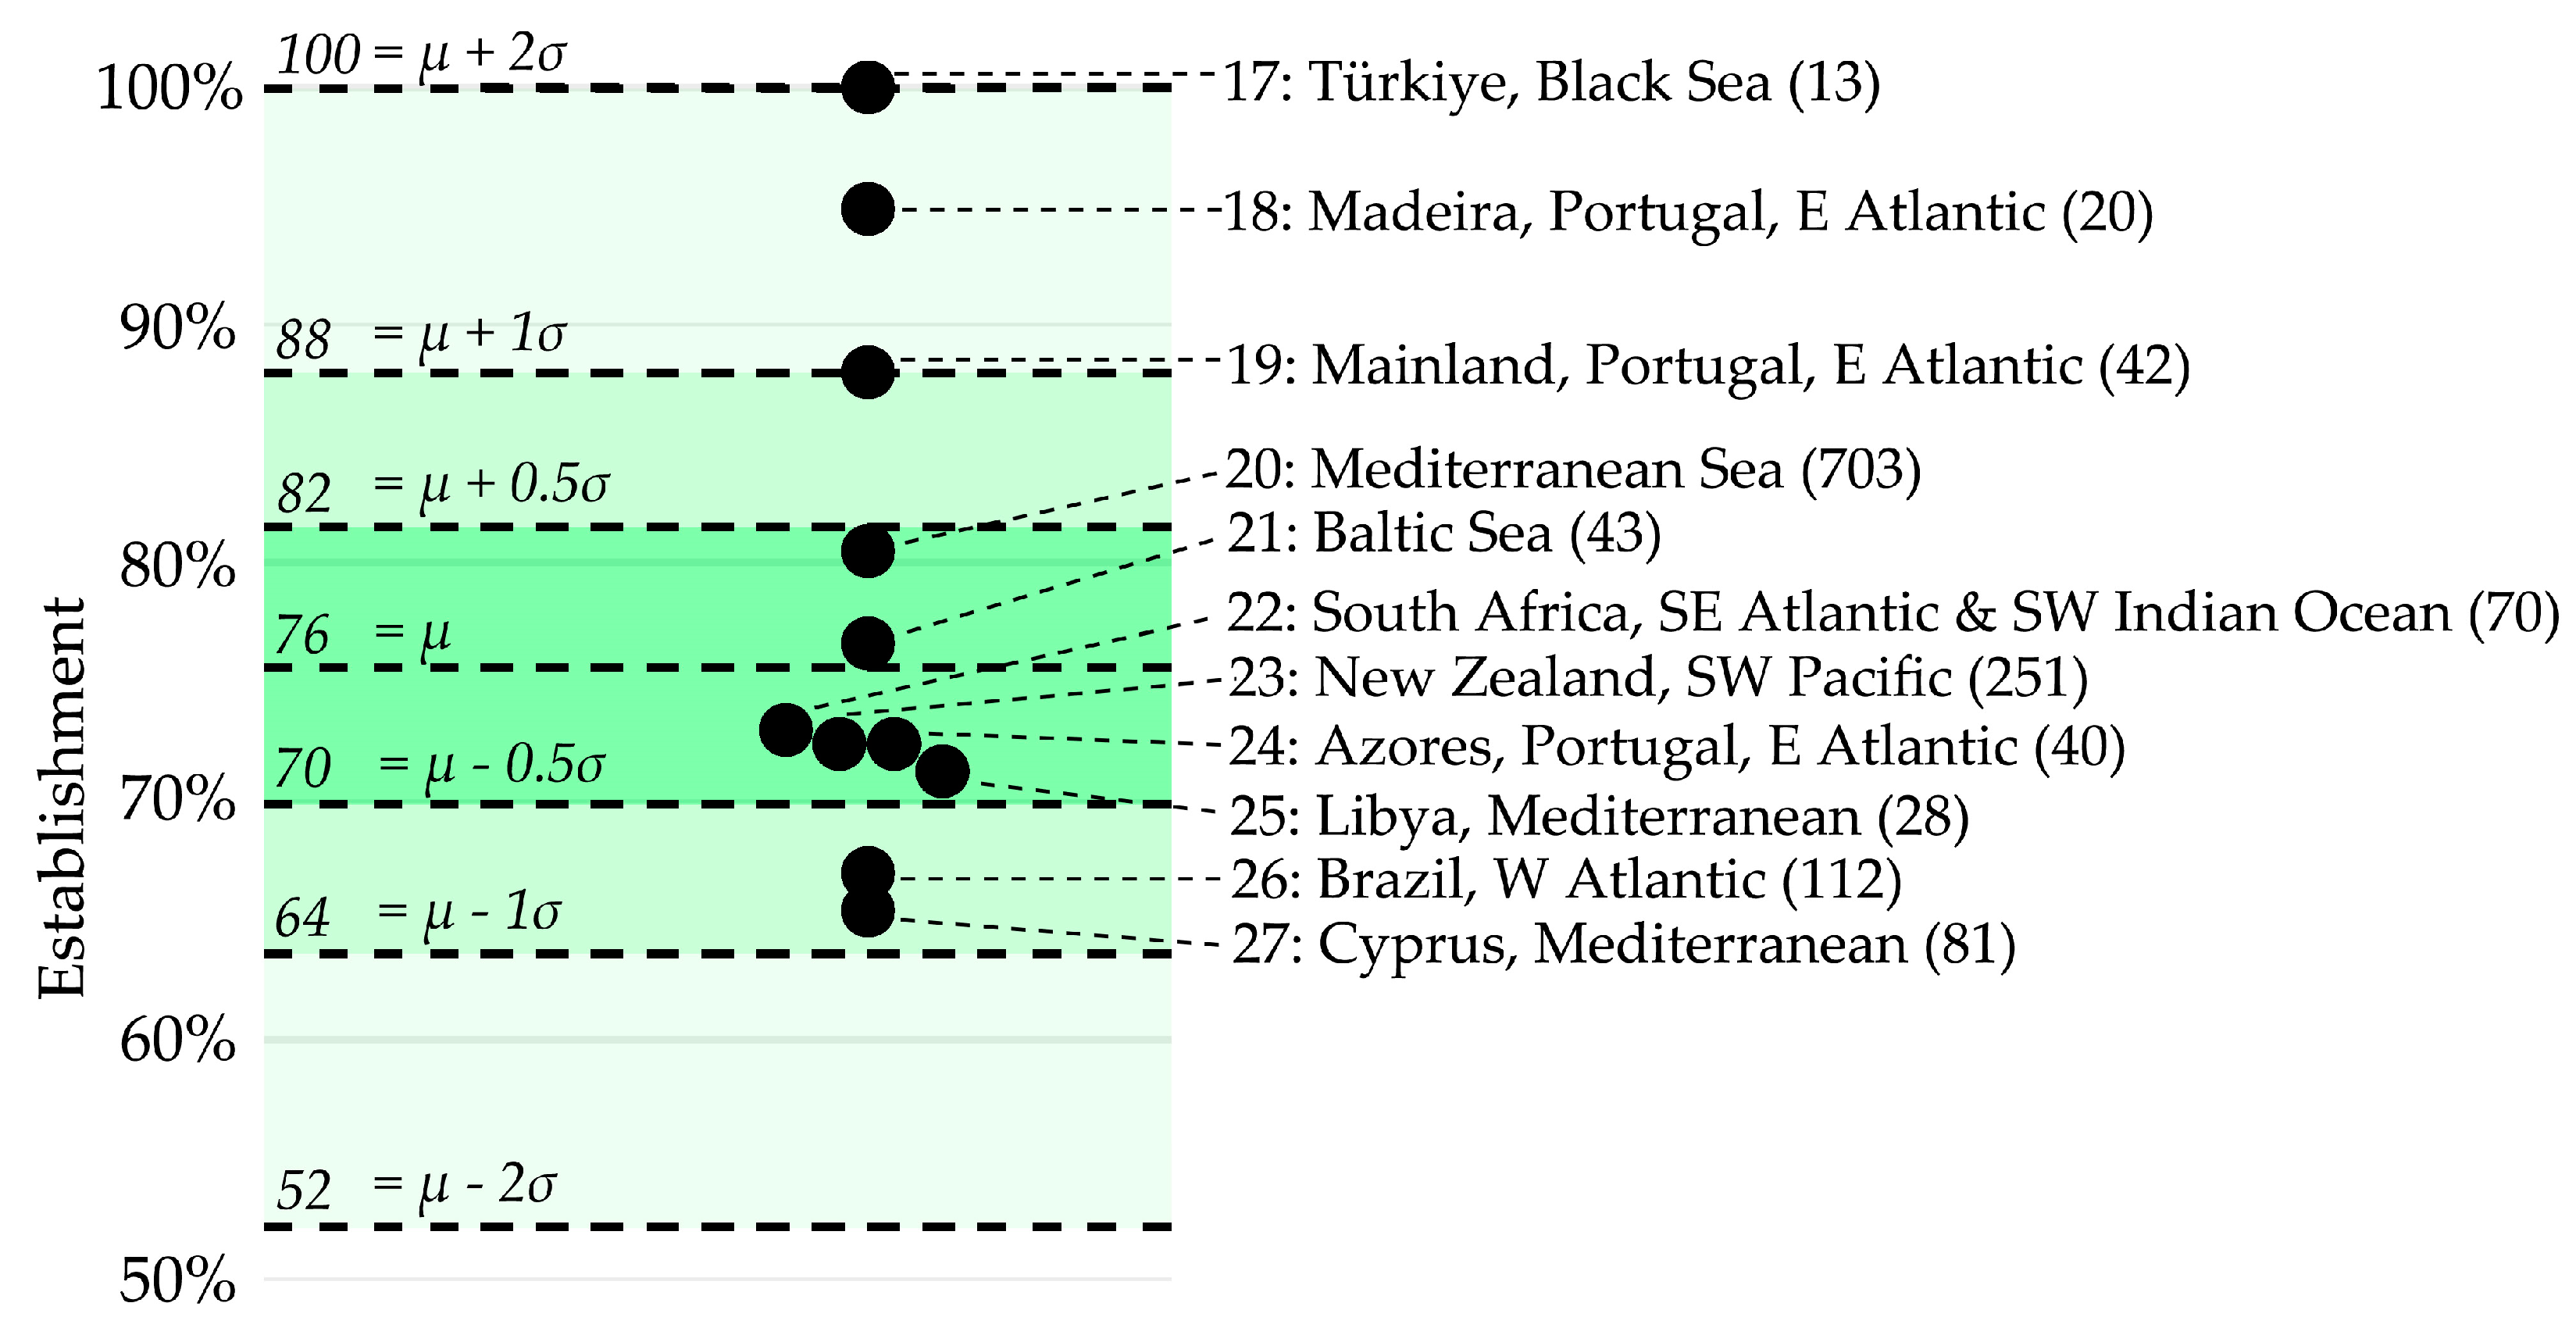
3.1. Region-Specific Establishment Rates of Non-Native Marine Species

Table S6 includes the number of species recorded and established in 27 regions worldwide (Figure 1). This table also includes the calculated establishment percentages, which are illustrated in Figure 2 and Figure 3.
Figure 2 highlights the 16 regions in the NE Atlantic or Mediterranean for which datasets were found that documented all newly recorded non-native marine species over the past three decades, i.e., from 1991 to 2020. These establishment percentages ranged from 52.1% to 93.8%. In between these minimum and maximum values, the percentages followed a normal distribution (Shapiro–Wilk, p = 0.928) (Figure 2). On average, 76.0% (n = 16; σ = 11.8%) of the species that were recorded as new in a region managed to establish themselves. Although most establishment percentages were found to be within one standard deviation of this average, there were five outliers that had larger deviations (Figure 2). Two of the most extreme outliers concern the Netherlands, with a relatively high establishment percentage of 93.0%, and the Mediterranean coast of France, with the lowest establishment percentage, i.e., 52.1% (Figure 2 and Table S6).
The Netherlands’ high establishment rate may partially be attributed to the abundance of available marine habitats, which increases the likelihood of newcomers successfully establishing themselves. These habitats can be found in various locations, including the salinity gradients in the ports of Amsterdam and Rotterdam, the wetlands of the Dutch Wadden Sea, and the estuaries in the Dutch Delta, where the Grevelingen, a marine lake, is also located. The relatively high rate of establishment may also be attributed, in some part, to the diligent monitoring efforts, which reduce the likelihood of overlooking any establishments. In the Netherlands, the Marine Alien Species Detection Network is dedicated to monitoring establishment hotspots seasonally, with more intensive surveys conducted annually or once every 3–4 years [21].
In countries like France, where establishment percentages are notably lower, there exists no ongoing comprehensive monitoring program that consistently revisits potential areas for species to establish [23]. This may, to some degree, explain the lowest establishment percentage in our study, i.e., 52.1% along the Mediterranean coast of France (Region 10 in Table 1). Additionally, this low rate can be attributed to how easily non-native species from the temperate NE Atlantic and the subtropical Eastern Mediterranean areas can be introduced there. This can, for example, happen up to a certain degree through natural distribution or with the help of recreational shipping from either direction [23,33]. However, these species coming from neighboring areas may face difficulties in adapting and thriving in the region due to water temperatures that can be either too hot or too cold for them to establish.
The shrimp Penaeus aztecus, for example, is typically found established in the Eastern Mediterranean (Figure 4), where it was first reported in 2010 and has quickly become invasive and abundant. So far, the species has only been recorded as far west as a French port 60 miles from Marseille, where it appears not to have established itself. This might be for the same reason this species was not found north of Ancona in the Mediterranean [48], due to the shallow depths and the climate, specifically the winter bottom sea temperatures as low as 10 °C at 30 m. While the shrimp P. aztecus may find the waters of the Mediterranean French coast too cold, the non-native bryozoan Tricellaria inopinata could find them too warm. Unlike P. aztecus, T. inopinata is commonly and widely found in the NE Atlantic (Figure 4) [49]. The species, while recorded multiple times in the Western Mediterranean and along the French coast, appears not to become established there. This bryozoan species may be experiencing mortality or reproductive issues due to warmer waters.
The inability of some non-native species coming from neighboring areas to establish themselves, because of waters that are too warm or cold, may explain the low establishment rates observed in regions that lie in between the temperate NE Atlantic and the sub-tropical E Mediterranean (Figure 2). This is also supported by the average establishment rates of 76%, 66%, and 85% in, respectively, the temperate NE Atlantic area, the “in between” E Atlantic and W Mediterranean area, and the subtropical E Mediterranean area (Table 1). The unsuitability of the central area’s environment, including the French Mediterranean region, for many non-native species that have established in the nearby temperate and subtropical areas is further supported by the low similarity in established species “compositions” with those areas of 10.2%% and 9.5%, respectively (Table 2).
Given the significant variations between regions in the minimum and maximum establishment percentages within each area (Table 1), it is recommendable to use region-specific data rather than relying on data for areas with a specific climate when making predictions about establishment probabilities, e.g., in risk assessments. Regarding regional establishment probability, settling habitat, environment (e.g., salinity), and climate suitability are probably key factors. In NE Atlantic temperate waters, for example, larvae from organisms on the hull of a vessel coming from the Mediterranean, might settle on a floating dock during summer. Their ability to subsequently form a self-sustaining population probably hinges on surviving the winter temperatures and having sufficiently warm summers to reproduce. Additionally, their establishment chances and further spread may depend on the availability of nearby substrata that are suitable for settlement. Ports and marinas in the Netherlands can illustrate this. They generally feature floating docks but the muddy bottoms in these areas tend to be oxygen-deprived, making them inhospitable for most of the species that are fouling these floating docks. Regular cleaning of the docks, coupled with a lack of suitable settlement areas in and outside ports and marinas, could hereby decrease the likelihood of non-native fouling species establishing themselves. Where this is concerned, one could contemplate whether or not it is advisable to build artificial reefs in or near these ports to improve biodiversity, as is completed, for example, in the Port of Rotterdam (see e.g., https://reefy.nl/science/, accessed on 24 December 2024). Such reefs would probably raise the chances of non-native species establishment.

3.2. Region-Specific Establishment Rate Variation over Time

As discussed in the preceding paragraphs, it is generally recommended to rely on regional historical data concerning establishment percentages in order to forecast the establishment rates of newly discovered non-native marine species. When analyzing historical data, one might raise doubts about the extent to which establishment percentages in regions remain consistent over time, however. To assess consistency over time, Chi-X2 tests were conducted using the datasets of six regions, two in each of the main areas studied. They concern the French and Spanish NE Atlantic coasts, the French and Spanish W Mediterranean coasts, and the Greek and Turkish E Mediterranean waters (Figure 1 and Table S9). These regions were selected as a relatively high number of non-native species had established themselves there over the last three decades. Consequently, it was predicted for each of these regions that at least five newly detected non-native species would establish themselves in each of the last three decades, i.e., in 1991–2000, 2001–2010, and 2011–2020. We hereby followed the rule of thumb that the minimum expected values should be at least 5 before the probabilities associated with the Chi-square statistic can be considered accurate (42–44). The exact Chi-X2 test data and results are presented in Supplementary Material Table S9. No significant differences were found between any of the decades within the regions. This indicates that historical data on establishment percentages can be used within regions to predict future establishment chances of newly discovered species. Here, older datasets may sometimes be more reliable than recent ones, considering the potential underscoring of established species in the most recent decade because of time lags in the reporting of biological invasions [50]. The establishment of certain recently detected species may not be reported yet. In the present study, this may be the case in the dataset of the Spanish Atlantic coast region. The establishment rate in this dataset was noticeably lower in the most recent decade compared to the previous two. Although this difference was not significant according to the Chi-X2 tests, it is noted that the P-value was only very slightly above 0.05 (Table S8).

3.3. Seventies Rule for the Establishment of Non-Native Marine Species

Regardless of the differences between regions, in all 27 datasets, the establishment percentages were above 50% (Figure 2 and Figure 3). It is worth mentioning that marine non-native species in the Baltic Sea, New Zealand, South Africa, and Brazil successfully established themselves, with percentages of 77%, 73%, 73%, and 67%, respectively (Figure 3), and that these rates are very similar to the average of 76.0% that was found for the 16 regions in the NE Atlantic and Mediterranean (Figure 2).
Of course, some outliers should also be considered, like the Black Sea and Madeira, where (almost) every detected non-native species has seemingly successfully established itself (Figure 3). The role of geographical isolation in invasion ecology and establishment chances is well-documented [51]. Such isolated ecosystems are generally threatened more by non-natives than open systems. In this context, it is worth considering that the Black Sea has minimal connectivity to the Mediterranean and that Madeira encompasses a selected number of islands that are geographically distant from the African shore.
Still keeping such outliers in mind, the multitude of regions (Figure 2 and Figure 3) indicates that in the absence of more specific regional data, one can rely on the Seventies Rule, which we here propose for predicting the establishment chances of newly detected non-native marine species in the NE Atlantic and Mediterranean. With only five datasets from other areas in our studies, the global applicability of this rule remains to be demonstrated. Following the Seventies Rule, one can assume with a 76% probability that newly detected non-native marine species will establish themselves.
The Seventies Rule aligns with other studies, such as that of Zenetos et al. [14], which reported a 76% success rate of non-native species introduced to the Mediterranean Sea over 230 years. However, it strongly contradicts the Tens Rule Theory, once based on non-native terrestrial plants in the UK and proposing an establishment rate of approximately 10% (5–20% range, as later defined by the authors [15,16,17,18,52]). These differences appear to be primarily associated with the fact that invasion dynamics in marine systems follow different patterns and principles compared to invasions in freshwater environments and invasions on land. Regarding terrestrial invasion dynamics, the Tens Rule’s broad applicability is already questionable, given that it is based on one geographical region (the UK) only and focuses solely on plants. Where freshwater environments are concerned, the 63% establishment rate recorded for non-native freshwater species in Europe [53] is already much closer to the 76% here found for marine species.
While the Seventies Rule will be generally reliable as an indicator for predicting establishment chances of newly detected marine non-native species in the NE Atlantic and Mediterranean, regional circumstances and data should be taken into account whenever possible as they allow for local deviations.

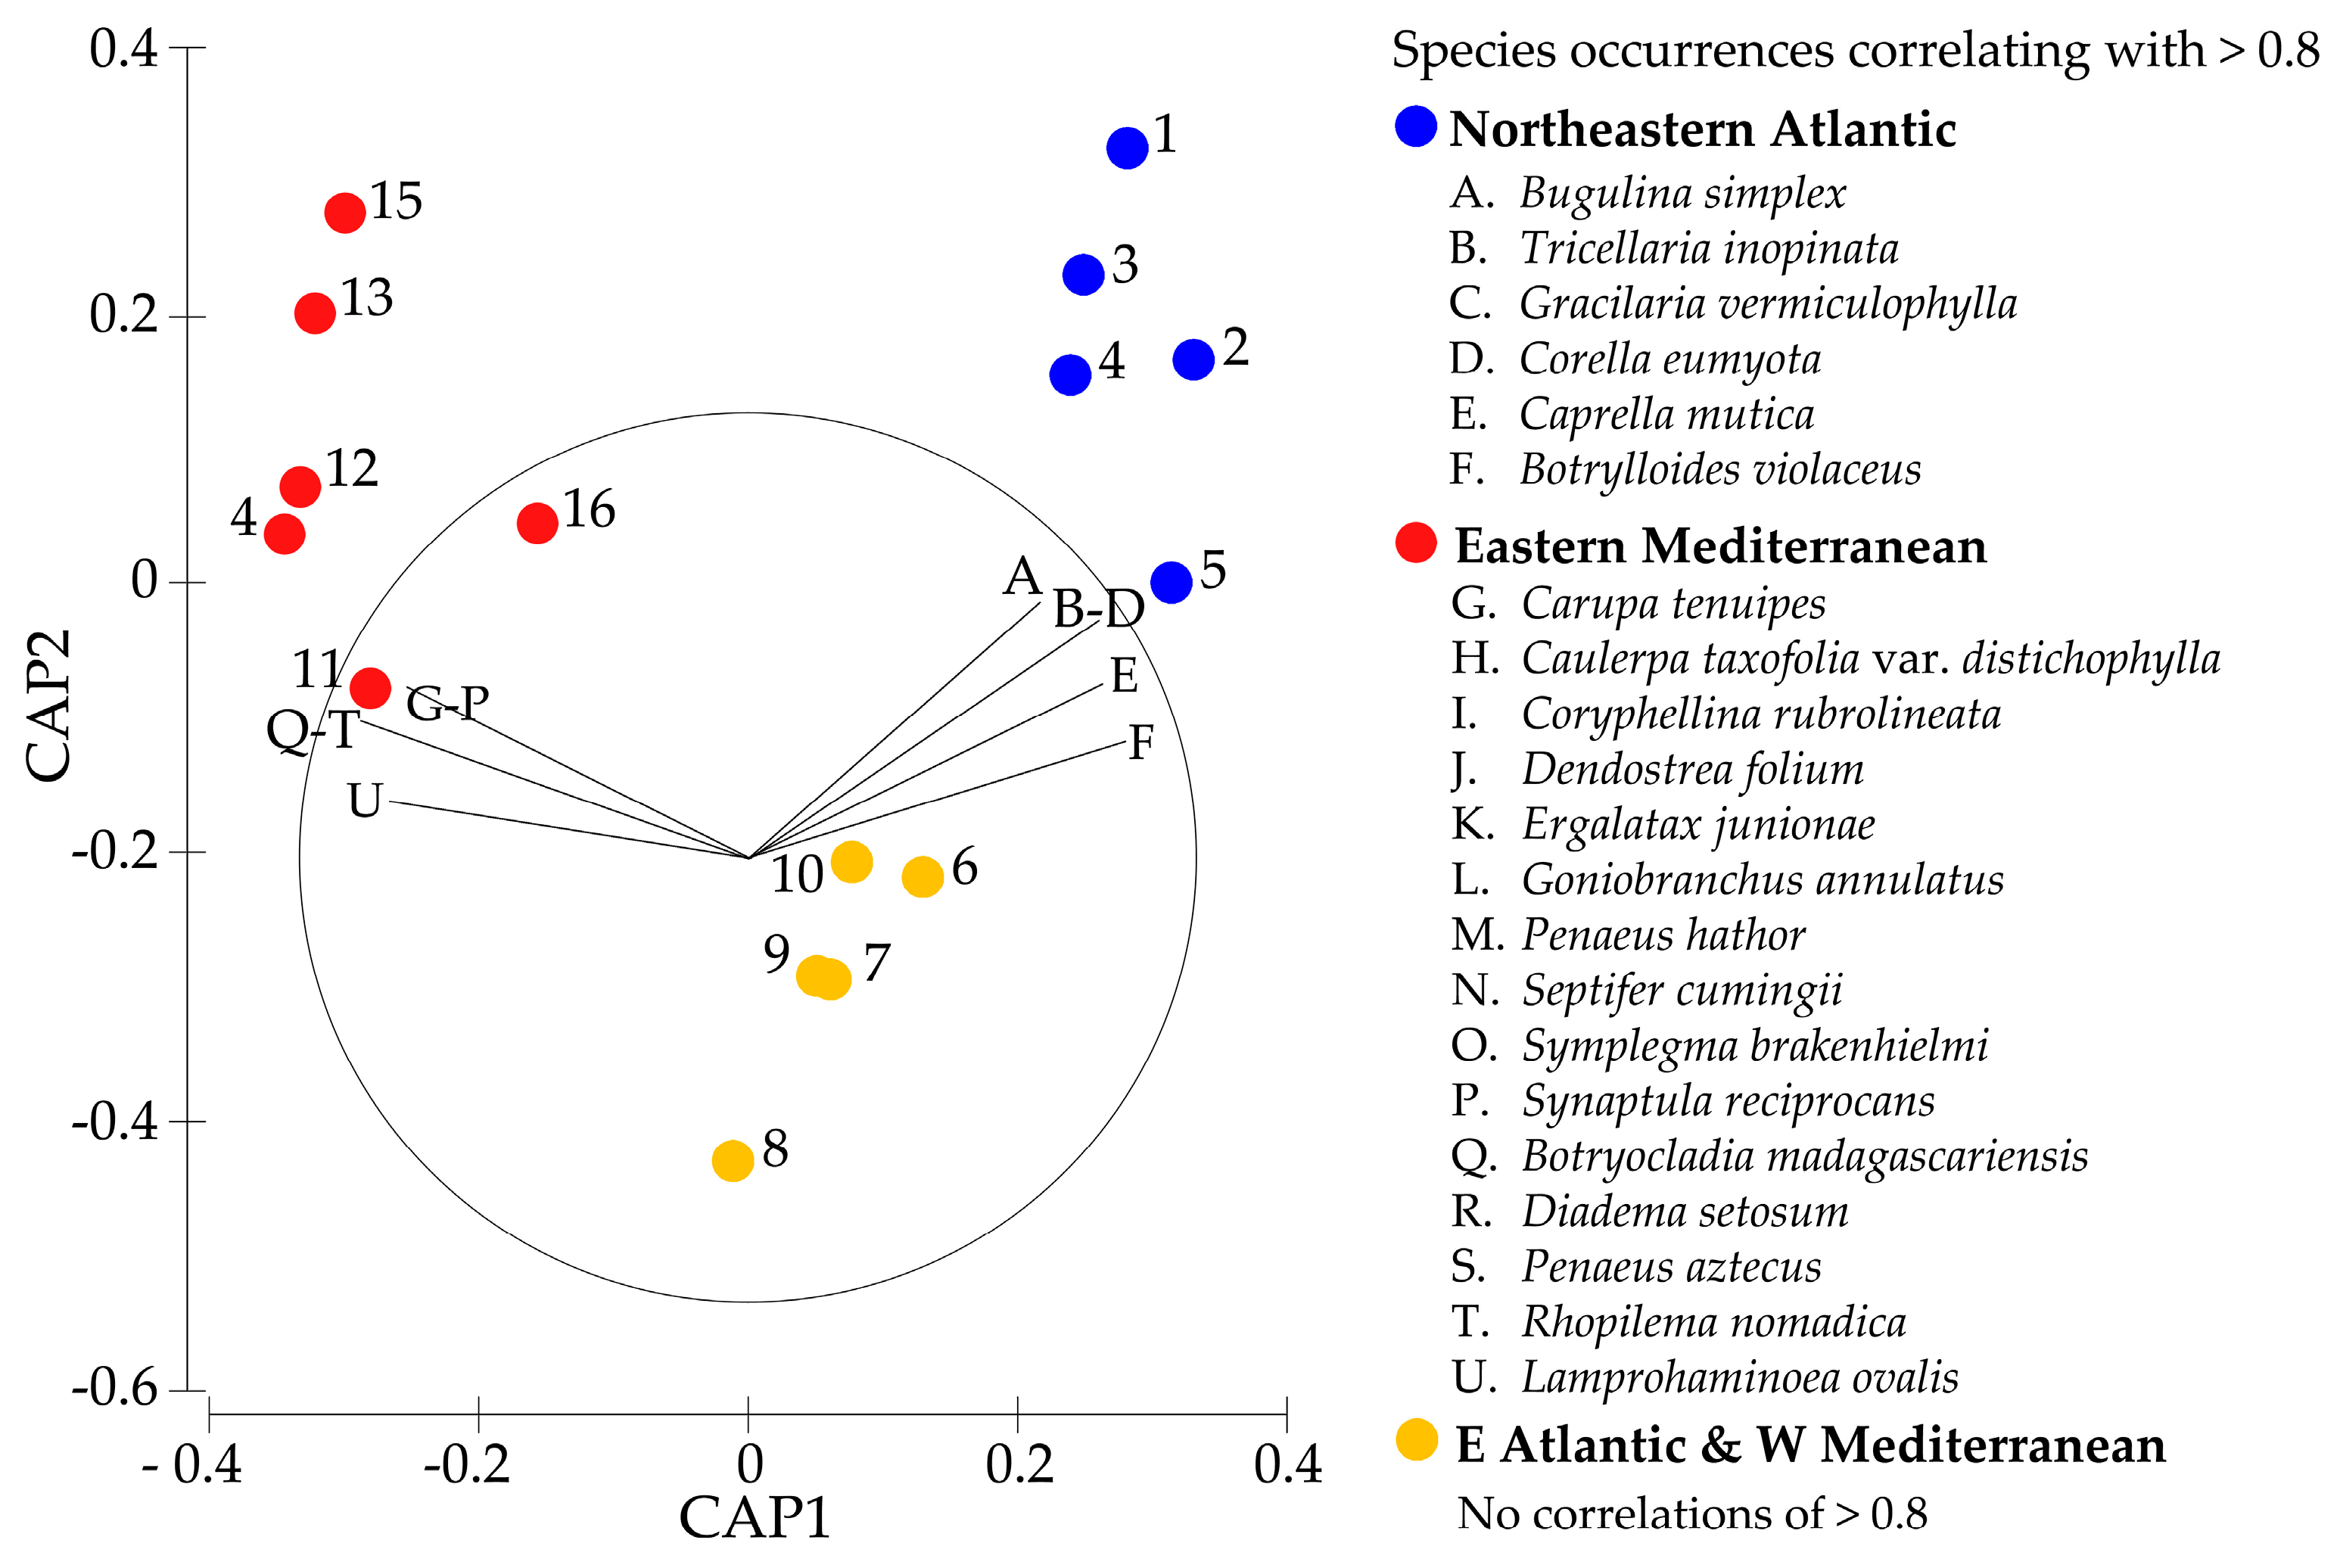
3.4. Similarities Between Established Non-Native Marine Species Across Climate Zones

In order to better understand the Seventies Rule and the underlying biological principles, the present study aimed to explore the potential link between specific non-native marine species and the similarities in establishment percentages found across the seas. According to Table 2, there is limited evidence to suggest that specific established non-native species “communities” as a whole play a significant role in these similarities as only 16 to 34% of the established species matched between regions within areas and similarities between areas ranged only from 4 to 10%. These low similarity percentages were calculated within a SIMPER analysis in PRIMER-e. This was conducted based on a datafile including species lists of the 16 studies that were selected for the more in-depth analyses. The file included 403 established non-native marine species and the regions in which they were recorded as new between 1991 and 2020 across the NE Atlantic and Mediterranean (Table S7).
Conducting a Permutational MANOVA (PERMANOVA) in PRIMER-e, it could be concluded that these three areas, chosen for their temperate to subtropical climate, differed significantly from each other in terms of the individual non-native species that were established there (Pseudo-F = 3.785; P(perm) = 0.001). The more detailed results of this analysis, including the PERMANOVA design and model used, can be found in Table S9.
To assess more in detail to what degree each area included its own unique combination of established species, a CAP was conducted in PRIMER-e (Figure 4). It is worth mentioning that regions in close geographical proximity tend to be more similar in terms of the non-native species that are established there and are, therefore, also clustering closer together in the CAP graph. For example, the W Mediterranean French and Spanish species lists lie closer together than the rest of the E Atlantic regions within the same area. This suggests that there are patterns of species establishment both within and across areas, which may be used to predict establishments.
The presence of these patterns is also supported by the “leave-one-out” approach within the CAP. This is completed by repeating an analysis in which a “CAP-model” is made based on the similarities between regions within each of the areas. Every time the analysis is automatically repeated, one region is left out (until all regions have been left out once). Subsequently, the program predicts to what area the region that was left out belongs based on the model. In the present study, the CAP analyses were able to correctly assign the area to 16 out of the 16 regions, based on the established species present.
The overlay vector function was used to determine if specific species occurrences are correlated (for >0.8) with the CAP graph (Figure 4) in order to evaluate whether differences between the areas can be attributed to a specific set of species that was first recorded within the regions concerned between 1991 and 2020. Correlations of >0.8 were found for six non-native species that apparently typically establish themselves in the NE Atlantic, as well as fifteen non-native species typically found established in the Eastern Mediterranean (Figure 4). There were no such species that typically establish themselves in the “E Atlantic & W Mediterranean” area, which is situated between the NE Atlantic and the E Mediterranean (Figure 1). The absence of established species exclusive to that area is likely due to its central geographic location between the other two regions.
Although our similarity studies uncovered intriguing patterns, they could not confirm the hypothesis that the resemblances in establishment percentages of non-native species across regions are linked to specific species. The analyses show instead that non-native marine species establishment rates are rather consistent across regions, irrespective of the specific non-native species present in these regions.

4. Conclusions

The widely used Tens Rule [15,16,17,18], which assumes the establishment of 10% of introduced non-native species, is proven highly inaccurate for marine species in our studies focused on 27 marine regions worldwide. Our analyses lead us to propose the Seventies Rule instead. It states that there is a 76% chance that newly detected, non-native marine species will successfully establish themselves. This establishment rate of 76% was based on the average establishment of 76.0% per region of non-native species in 16 regions across the NE Atlantic and Mediterranean in the 1991–2020 period. While applicable to the NE Atlantic and Mediterranean, its global applicability remains to be demonstrated as only five datasets from other waters were studied. In four of these, very similar percentages were scored. Based on datasets from the Baltic Sea, New Zealand, South Africa, and Brazil, establishment percentages were calculated as 77%, 73%, 73%, and 67%, respectively. A rate of 100% was reported for the Black Sea, however. This shows that one should exercise caution regarding significant deviations from the rule within the NE Atlantic and Mediterranean as well, with establishment rates ranging from slightly above 50% to 100%. Geographically isolated regions, like the Black Sea and Madeira, as well as regions with diverse marine habitats, like the Netherlands, showed higher percentages of, respectively, 100%, 95%, and 93%. Conversely, regions that lie centrally in between areas with distinct climates, such as the temperate NE Atlantic and subtropical E Mediterranean, often had lower establishment rates in our studies (Figure 2). Although various non-native species may find their way from both the Atlantic and the E Mediterranean to, for example, the French Mediterranean coast, e.g., by hull fouling, this does not lead to higher establishment rates. For some species, the waters will be too cold and, for others, too warm to establish themselves.
We expect the reasons behind regional differences in establishment rates to remain mostly unclear as there are insufficient data for accurate hypothesis testing. In any case, it is important to use historical regional data when predicting establishment chances, possibly while keeping the Seventies Rule in mind. This is supported by the fact that establishment percentages in the most recent three decades did not significantly differ from each other within the six regions that allowed for testing this with a Chi-X2 analysis. It should be mentioned, though, that certain regions show a decrease in the percentage of established species in the past ten years, potentially due to a delay in publishing records that validate the establishment of relatively newly discovered non-native species.
In addition to this publication lag, research efforts can also regionally impact the calculated establishment percentages. For instance, consistent monitoring of specific areas within the Marine Alien Species Detection Network in the Netherlands is likely to have increased the species establishment percentage in this region. Assuming this to be true, the Seventies Rule could actually be an underestimation of establishment percentages in regions with limited monitoring. Identifying such potential trends, partly based on historical data, enhances the effectiveness of management efforts, thus aiding in the prevention of associated impacts [54,55].
In conclusion, the Seventies Rule can be used to predict the establishment chances of newly detected marine non-native species in the NE Atlantic and Mediterranean but regional circumstances and historical data should always be considered.

Supplementary Materials

The following supporting information can be downloaded at: https://www.mdpi.com/article/10.3390/d17010018/s1: Supplementary_Data_70sRule (Excel file) including Tables S1–S9 as tabs. References cited [11,14,21,22,23,24,25,26,27,28,31,32,33,55,56,57,58,59,60], correspond with those in the References below; Table S1: Selected regions and related definitions of establishment statuses; Table S2: All established non-native marine species in all regions, containing the reason for in- or exclusion; Table S3: All non-established non-native marine species in all regions, containing the reason for in- or exclusion; Table S4: All established non-native marine species (first recorded between 1991 and 2020) in the regions that were included in the in-depth analyses, containing the reason for in- or exclusion; Table S5: All non-established non-native marine species (first recorded between 1991 and 2020) in the regions that were included in the in-depth analyses, containing the reason for in- or exclusion; Table S6: The establishment numbers and percentages on which Figure 2 and Figure 3 are based; Table S7: The file used for the Primer-e analyses (CAP (Figure 4) and PERMANOVA); Table S8: The Chi-X2 analyses and p-values for testing significance between decades; Table S9: The design and results of the PERMANOVA analysis.

Author Contributions

Both Conceptualization, S.C. and A.G.; methodology, S.C. and A.G.; formal analysis, S.C.; writing—original draft preparation, S.C. and A.G.; writing—review and editing, S.C. and A.G.; visualization, S.C. and A.G.; supervision, A.G. All authors have read and agreed to the published version of the manuscript.

Funding

This research received no external funding.

Institutional Review Board Statement

Not applicable.

Data Availability Statement

The data used in this study are included in the article/Supplementary Material. Further inquiries can be directed to the corresponding author.

Acknowledgments

We are very thankful for the help of Edmund Gittenberger, for critically looking through the last version of the manuscript texts; Marjolein Rensing, for helping us prepare the figures; and Helena Keeler Pérez, for her critical view of the manuscript and its figures and tables.

Conflicts of Interest

The authors declare no conflicts of interest.

References

  1. Katsanevakis, S.; Olenin, S.; Puntila-Dodd, R.; Rilov, G.; Stæhr, P.A.U.; Teixeira, H.; Tsirintanis, K.; Birchenough, S.N.R.; Jakobsen, H.H.; Knudsen, S.W.; et al. Marine Invasive Alien Species in Europe: 9 Years after the IAS Regulation. Front. Mar. Sci. 2023, 10, 1271755. [Google Scholar] [CrossRef]
  2. Katsanevakis, S.; Wallentinus, I.; Zenetos, A.; Leppäkoski, E.; Çinar, M.; Oztürk, B.; Grabowski, M.; Golani, D.; Cardoso, A. Impacts of Invasive Alien Marine Species on Ecosystem Services and Biodiversity: A Pan-European Review. Aquat. Invasions 2014, 9, 391–423. [Google Scholar] [CrossRef]
  3. Grosholz, E. Ecological and Evolutionary Consequences of Coastal Invasions. Trends Ecol. Evol. 2002, 17, 22–27. [Google Scholar] [CrossRef]
  4. Blackburn, T.M.; Essl, F.; Evans, T.; Hulme, P.E.; Jeschke, J.M.; Kühn, I.; Kumschick, S.; Marková, Z.; Mrugała, A.; Nentwig, W.; et al. A Unified Classification of Alien Species Based on the Magnitude of Their Environmental Impacts. PLoS Biol. 2014, 12, e1001850. [Google Scholar] [CrossRef]
  5. Coppis, S.; Gittenberger, A. Climate Zone Related Establishment Chances of Marine Alien Species. In Proceedings of the Programs and Abstracts 22nd International Conference on Aquatic Invasive Species, Oostend, Belgium, 18–22 April 2022; p. 33. [Google Scholar]
  6. Crooks, J.A. Lag Times and Exotic Species: The Ecology and Management of Biological invasions in Slow-Motion11. Écoscience 2005, 12, 316–329. [Google Scholar] [CrossRef]
  7. Culver, C.; Kuris, A. The Apparent Eradication of a Locally Established Introduced Marine Pest. Biol. Invasions 2000, 2, 245–253. [Google Scholar] [CrossRef]
  8. Hopkins, G.; Forrest, B.; Jiang, W.; Garner, J. Successful eradication of a non-indigenous marine bivalve from a subtidal soft-sediment environment. J. Appl. Ecol. 2011, 48, 424–431. [Google Scholar] [CrossRef]
  9. Wotton, D.; O’Brien, C.; Stuart, M.; Fergus, D. Eradication success down under: Heat treatment of a sunken trawler to kill the invasive seaweed Undaria pinnatifida. Mar. Pollut. Bull. 2004, 49, 844–849. [Google Scholar] [CrossRef]
  10. Keeler-May, G. Early-detection and rapid response to a novel wakame (Undaria pinnatifida) incursion in Broad Bay, Rakiura/Stewart Island. In Proceedings of the Programs and Abstracts 22nd International Conference on Aquatic Invasive Species, Oostend, Belgium, 18–22 April 2022; ICAIS: Oostend, Belgium, 2022; p. 64. [Google Scholar]
  11. Robinson, T.B.; Alexander, M.E.; Simon, C.A.; Griffiths, C.L.; Peters, K.; Sibanda, S.; Miza, S.; Groenewald, B.; Majiedt, P.; Sink, K.J. Lost in Translation? Standardising the Terminology Used in Marine Invasion Biology and Updating South African Alien Species Lists. Afr. J. Mar. Sci. 2016, 38, 129–140. [Google Scholar] [CrossRef]
  12. Kolar, C.S.; Lodge, D.M. Progress in Invasion Biology: Predicting Invaders. Trends Ecol. Evol. 2001, 16, 199–204. [Google Scholar] [CrossRef]
  13. Giakoumi, S.; Katsanevakis, S.; Albano, P.G.; Azzurro, E.; Cardoso, A.C.; Cebrian, E.; Deidun, A.; Edelist, D.; Francour, P.; Jimenez, C.; et al. Management Priorities for Marine Invasive Species. Sci. Total Environ. 2019, 688, 976–982. [Google Scholar] [CrossRef] [PubMed]
  14. Zenetos, A.; Albano, P.; López, E.; Stern, N.; Tsiamis, K.; Galanidi, M. Established Non-Indigenous Species Increased by 40% in 11 Years in the Mediterranean Sea. Mediterr. Mar. Sci. 2022, 23, 196–212. [Google Scholar] [CrossRef]
  15. Williamson, M. Invaders, Weeds and the Risk from Genetically Manipulated Organisms. Experientia 1993, 49, 219–224. [Google Scholar] [CrossRef]
  16. Williamson, M.; Fitter, A. The Varying Success of Invaders. Ecology 1996, 77, 1661–1666. [Google Scholar] [CrossRef]
  17. Williamson, M.H.; Brown, K.C.; Holdgate, M.W.; Kornberg, H.; Southwood, R.; Mollison, D. The Analysis and Modelling of British Invasions [and Discussion]. Philos. Trans. R. Soc. Lond. B Biol. Sci. 1986, 314, 505–522. [Google Scholar]
  18. Jeschke, J.M.; Pyšek, P. Tens Rule. In Invasion Biology: Hypotheses and Evidence; Jeschke, J.M., Heger, T., Eds.; CABI: Oxfordshire, UK, 2018. [Google Scholar]
  19. Galil, B.S. The Alien Crustaceans in the Mediterranean Sea: An Historical Review. In the Wrong Place—Alien Marine Crustaceans: Distribution, Biology and Impacts; Galil, B.S., Clark, P.F., Carlton, J.T., Eds.; Springer: Dordrecht, The Netherlands, 2011; pp. 377–401. ISBN 978-94-007-0591-3. [Google Scholar]
  20. Minchin, D.; Cottier-Cook, E.; Clark, P. Alien Species in British Brackish and Marine Waters. Aquat. Invasions 2013, 8, 3–19. [Google Scholar] [CrossRef]
  21. Gittenberger, A.; Rensing, M.; Faasse, M.; van Walraven, L.; Smolders, S.; Perez, H.; Gittenberger, E. Non-Indigenous Species Dynamics in Time and Space within the Coastal Waters of The Netherlands. Diversity 2023, 15, 719. [Google Scholar] [CrossRef]
  22. Gittenberger, A.; Mirimin, L.; Boyd, J.; O’Beirn, F.; Devine, G.; O’Brien, M.; Rensing, M.; O’Dwyer, K.; Gittenberger, E. Marine Non-Indigenous Species Dynamics in Time and Space within the Coastal Waters of the Republic of Ireland. Diversity 2023, 15, 1019. [Google Scholar] [CrossRef]
  23. Massé, C.; Viard, F.; Humbert, S.; Antajan, E.; Auby, I.; Bachelet, G.; Bernard, G.; Bouchet, V.M.P.; Burel, T.; Dauvin, J.-C.; et al. An Overview of Marine Non-Indigenous Species Found in Three Contrasting Biogeographic Metropolitan French Regions: Insights on Distribution, Origins and Pathways of Introduction. Diversity 2023, 15, 161. [Google Scholar] [CrossRef]
  24. Png-Gonzalez, L.; Comas-González, R.; Calvo-Manazza, M.; Follana-Berná, G.; Ballesteros, E.; Díaz-Tapia, P.; Falcón, J.M.; García Raso, J.E.; Gofas, S.; González-Porto, M.; et al. Updating the National Baseline of Non-Indigenous Species in Spanish Marine Waters. Diversity 2023, 15, 630. [Google Scholar] [CrossRef]
  25. Mghili, B.; Lamine, I.; Rami Laamraoui, M.; Aksissou, M.; Galanidi, M. Updating the National List of Marine Alien Species in Morocco. Mediterr. Mar. Sci. 2024, 25, 231–249. [Google Scholar] [CrossRef]
  26. Zenetos, A.; Karachle, P.; Corsini-Foka, M.; Gerovasileiou, V.; SimbouraI, N.; Xentidis, N.J.; Tsiamis, K. Is the Trend in New Introductions of Marine Non-Indigenous Species a Reliable Criterion for Assessing Good Environmental Status? Τhe Case Study of Greece. Mediterr. Mar. Sci. 2020, 21, 775–793. [Google Scholar] [CrossRef]
  27. Çinar, M.E.; Bilecenoğlu, M.; Yokeş, M.B.; Öztürk, B.; Taşkin, E.; Bakir, K.; Doğan, A.; Açik, Ş. Current Status (as of End of 2020) of Marine Alien Species in Turkey. PLoS ONE 2021, 16, e0251086. [Google Scholar] [CrossRef]
  28. Chainho, P.; Fernandes, A.; Amorim, A.; Ávila, S.P.; Canning-Clode, J.; Castro, J.J.; Costa, A.C.; Costa, J.L.; Cruz, T.; Gollasch, S.; et al. Non-Indigenous Species in Portuguese Coastal Areas, Coastal Lagoons, Estuaries and Islands. Estuar. Coast. Shelf Sci. 2015, 167, 199–211. [Google Scholar] [CrossRef]
  29. Ojaveer, H.; Olenin, S.; Narščius, A.; Florin, A.-B.; Ezhova, E.; Gollasch, S.; Jensen, K.R.; Lehtiniemi, M.; Minchin, D.; Normant-Saremba, M.; et al. Dynamics of Biological Invasions and Pathways over Time: A Case Study of a Temperate Coastal Sea. Biol. Invasions 2017, 19, 799–813. [Google Scholar] [CrossRef]
  30. Marine Non-Indigenous Species: Data to 2022. Version: 27 March 2024. Available online: https://www.stats.govt.nz/indicators/marine-non-indigenous-species-data-to-2022/ (accessed on 10 October 2024).
  31. Bazairi, H.; Sghaier, Y.R.; Benamer, I.; Langar, H.; Pergent, G.; Bouras, E.; Verlaque, M.; Soussi, J.B.; Zenetos, A. Alien Marine Species of Libya: First Inventory and New Records in El-Kouf National Park (Cyrenaica) and the Neighbouring Areas. Mediterr. Mar. Sci. 2013, 14, 451–462. [Google Scholar] [CrossRef]
  32. Teixeira, L.M.P.; Creed, J.C. A Decade on: An Updated Assessment of the Status of Marine Non-Indigenous Species in Brazil. Aquat. Invasions 2020, 15, 30–43. [Google Scholar] [CrossRef]
  33. Katsanevakis, S.; Tsiamis, K.; Ioannou, G.; Michailidis, N.; Zenetos, A. Inventory of Alien Marine Species of Cyprus (2009). Mediterr. Mar. Sci. 2009, 10, 109–134. [Google Scholar] [CrossRef]
  34. Gittenberger, A.; van der Veer, H.W.; Philippart, C.J.M.; van der Hoorn, B.; D’Hont, A.; Wesdorp, K.H.; Schrieken, N.; Klunder, L.; Kleine-Schaars, L.; Holthuijsen, S.; et al. Native and Non-Native Species of the Dutch Wadden Sea in 2018; Commissioned by Office for Risk Assessment and Research, The Netherlands Food and Customer Product Safety Authority of the Ministry of Agriculture, Nature and Food Quality; GiMaRIS: Sassenheim, The Netherlands, 2019; GiMaRIS report 2019_09; pp. 1–124. [Google Scholar]
  35. Wolff, W.J. Non-Indigenous Marine and Estuarine Species in The Netherlands. Zool. Meded. 2005, 79, 1–116. [Google Scholar]
  36. Faasse, M.A. Faunistisch Overzicht van de Nederlandse Kelkwormen (Entoprocta). Ned. Faun. Meded. 2006, 24, 7–11. [Google Scholar]
  37. Waser, A.M.; Lackschewitz, D.; Knol, J.; Reise, K.; Wegner, K.M.; Thieltges, D.W. Spread of the Invasive Shell-Boring Annelid Polydora websteri (Polychaeta, Spionidae) into Naturalised Oyster Reefs in the European Wadden Sea. Mar. Biodivers. 2020, 50, 63. [Google Scholar] [CrossRef]
  38. Jha, U.; Jetter, A.; Lindley, J.A.; Postel, L.; Wootton, M. Extension of Distribution of Pseudodiaptomus marinus, an Introduced Copepod, in the North Sea. Mar. Biodivers. Rec. 2013, 6, e53. [Google Scholar] [CrossRef]
  39. Stegenga, H.; Mol, I.; Prud’homme an Reine, W.F.; Lokhorst, G.M. Checklist of the Marine Algae of the Netherlands. Gorteria Dutch Bot. Arch. 1997, 4, 1–60. [Google Scholar]
  40. Devine, G.; Gaffney, J.; Gittenberger, A.; Rensing, M. Alien Species and Aquaculture. A Summary of Work to Support the Aquaculture Sector in Understanding, Preventing and Managing IAS Risks; BIM: Dublin, Ireland, 2023. [Google Scholar]
  41. WoRMS Editorial Board World Register of Marine Species. Available online: https://www.marinespecies.org (accessed on 9 December 2024).
  42. Cochran, W.G. Some methods of strengthening the common x2 tests. Biometrics 1954, 10, 417–451. [Google Scholar] [CrossRef]
  43. Fisher, R.A. Statistical Methods for Research Workers, 13th ed.; Hafner: New York, NY, USA, 1958. [Google Scholar]
  44. Camilli, G.; Hopkins, K. Applicability of the Chi-Square to 2 × 2 Contingency Tables with Small Expected Cell Frequencies. Psychol. Bull. 1978, 85, 163–167. [Google Scholar] [CrossRef]
  45. Clarke, K.R.; Gorley, R.N. PRIMER v6: User Manual/Tutorial (Plymouth Routines in Multivariate Ecological Research); PRIMER-E: Plymouth, UK, 2006; 192p. [Google Scholar]
  46. Anderson, M.J.; Willis, T.J. Canonical analysis of principal coordinates: A useful method of constrained ordination for ecology. Ecology 2003, 84, 511–525. [Google Scholar] [CrossRef]
  47. Wickham, H. Ggplot2: Elegant Graphics for Data Analysis; Springer: New York, NY, USA, 2016. [Google Scholar]
  48. Froglia, C.; Scanu, M. Notes on the Spreading of Penaeus aztecus Ives 1891 (Decapoda, Penaeidae) in the Mediterranean Sea and on Its Repeated Misidentifications in the Region. Biology 2023, 12, 793. [Google Scholar] [CrossRef] [PubMed]
  49. Cook, E.J.; Stehlíková, J.; Beveridge, C.M.; Burrows, M.T.; De Blauwe, H.; Faasse, M. Distribution of the invasive bryozoan Tricellaria inopinata in Scotland and a review of its European expansion. Aquat. Invasions 2013, 8, 281–288. [Google Scholar] [CrossRef]
  50. Zenetos, A.; Gratsia, E.; Cardoso, A.-C.; Tsiamis, K. Time Lags in Reporting of Biological Invasions: The Case of Mediterranean Sea. Mediterr. Mar. Sci. 2019, 20, 469–475. [Google Scholar] [CrossRef]
  51. Etheringron, T.R. Geographical isolation and invasion ecology. Prog. Phys. Geogr. 2015, 39, 1–14. [Google Scholar] [CrossRef]
  52. Jeschke, J.; Gómez Aparicio, L.; Haider, S.; Heger, T.; Lortie, C.; Pyšek, P.; Strayer, D. Support for Major Hypotheses in Invasion Biology Is Uneven and Declining. NeoBiota 2014, 14, 1–20. [Google Scholar] [CrossRef]
  53. García-Berthou, E.; Alcaraz, C.; Pou-Rovira, Q.; Zamora, L.; Coenders, G.; Feo, C. Introduction pathways and establishment rates of invasive aquatic species in Europe. Can. J. Fish. Aquat. Sci. 2005, 62, 453–463. [Google Scholar] [CrossRef]
  54. Tsiamis, K.; Palialexis, A.; Stefanova, K.; Gladan, Ž.N.; Skejić, S.; Despalatović, M.; Cvitković, I.; Dragičević, B.; Dulčić, J.; Vidjak, O.; et al. Non-Indigenous Species Refined National Baseline Inventories: A Synthesis in the Context of the European Union’s Marine Strategy Framework Directive. Mar. Pollut. Bull. 2019, 145, 429–435. [Google Scholar] [CrossRef]
  55. Ojaveer, H.; Galil, B.S.; Carlton, J.T.; Alleway, H.; Goulletquer, P.; Lehtiniemi, M.; Marchini, A.; Miller, W.; Occhipinti-Ambrogi, A.; Peharda, M.; et al. Historical Baselines in Marine Bioinvasions: Implications for Policy and Management. PLoS ONE 2018, 13, e0202383. [Google Scholar] [CrossRef] [PubMed]
  56. Tsiamis, K.; Palialexis, A.; Connor, D.; Antoniadis, S.; Bartilotti, C.; Bartolo, G.A.; Berggreen, U.C.; Boschetti, S.; Buschbaum, C.; Canning-Clode, J.; et al. Marine Strategy Framework Directive, Descriptor 2, Non-Indigenous Species: Delivering Solid Recommendations for Setting Threshold Values for Non-Indigenous Species Pressure on European Seas; Publications Office of the European Union: Luxembourg, 2021; p. 36. [Google Scholar]
  57. Zenetos, A.; Çinar, M.; Crocetta, F.; Golani, D.; Rosso, A.; Servello, G.; Shenkar, N.; Turon, X.; Verlaque, M. Uncertainties and validation of alien species catalogues: The Mediterranean as an example. Estuar. Coast Shelf Sci. 2017, 191, 171–187. [Google Scholar] [CrossRef]
  58. Tsiamis, K.; Zenetos, A.; Deriu, I.; Gervasini, E.; Cardoso, A. The native distribution range of the European marine non-indigenous species. Aquatic Invasions 2018, 13, 187–198. [Google Scholar] [CrossRef]
  59. Carlton, J.T. Biological invasions and cryptogenic species. Ecology 1996, 77, 1653–1655. [Google Scholar] [CrossRef]
  60. Zenetos, A.; Corsini-Foka, M.; Crocetta, F.; Gerovasileiou, V.; Karachle, V.; Simboura, M.; Tsiamis, K.; Pancucci-Papadopoulou, M. Deep cleaning of alien and cryptogenic species records in the Greek Seas (2018 update). Manag. Biol. Invasions 2018, 9, 209–226. [Google Scholar] [CrossRef]
Figure 1. Regions from which non-native marine species lists were used in the present study, modified from the R package ggplot2 [47]. (A) Regions used for the in-depth analyses, grouped into three areas: Blue, Northeastern Atlantic; Yellow, Eastern Atlantic and Western Mediterranean; Red, Eastern Mediterranean. These regions consist of (1) the Netherlands [21]; (2) the Republic of Ireland [22]; (3) and (4) France, the Channel Coast, and the Bay of Biscay [23]; (5) and (6) Spain, the Bay of Biscay, and Macaronesia [24]; (7) and (8) Morocco, Atlantic, and the Mediterranean [25]; (9) Spain and the Mediterranean [24]; (10) France and the Mediterranean [23]; (11), (12), and (14) Greece, the Adriatic and Ionian Seas, the Aegean Sea, and the Levantine Sea [26]; (13), (15), and (16) Türkiye, the Aegean Sea, the Levantine Sea, and the Sea of Marmara [27]. The black circle * represents the terrestrial plants in the UK, which were used for setting the Tens Rule Theory [15,16,17,18]. (B) Regions which did not meet the criteria for the in-depth analyses and were only used for calculating establishment percentages. They are numbered by decreasing establishment percentage (see Section 3.1): (17) Türkiye and the Black Sea [27]; (18) Madeira [28]; (19) Portugal [28]; (20) the Mediterranean Sea [14]; (21) the Baltic Sea [29]; (22) South Africa [11]; (23) New Zealand [30]; (24) Azores [28]; (25) Libya [31]; (26) Brazil [32]; and (27) Cyprus [33].
Diversity 17 00018 g001
Figure 2. Non-native marine species establishment percentages of 16 geographic regions in the Eastern Atlantic and the Mediterranean. The location names, numbers, and colors of the dots correspond to the groups in Figure 1. The average establishment percentage and standard deviation ranges are highlighted in green. The number of non-native species recorded in each region is displayed in brackets behind the location names. This graph is based on the data and calculations in Table S6.
Diversity 17 00018 g002
Figure 3. Non-native marine species establishment percentages spanning 11 geographic locations globally. They were not included in Figure 2 as they did not meet the criteria set in the present study for the in-depth analyses. The numbers before the location names correspond to those in Figure 1. The number of non-native species recorded is displayed in brackets behind the location names. The average establishment percentage and standard deviation ranges, which are highlighted in green, were copied from the in-depth analysis in Figure 2 to aid in comparisons. This graph is based on the numbers and calculations in Table S6.
Diversity 17 00018 g003
Figure 4. Canonical Analysis of Principal coordinates (CAP) based on the Sørensen distances between established species assemblages found in sixteen regions, subjectively grouped into three areas, i.e., the NE Atlantic (blue), E Atlantic and W Mediterranean (yellow), and E Mediterranean (red). These areas, along with the corresponding region numbers next to the dots, match those in Figure 1. The overlaid vector function of PRIMER-e was used to illustrate correlating species occurrences with a Pearson correlation coefficient of >0.8. The species representing the capital letters are clarified on the right, below the area they appear to be related to. The length of the vector line reflects the strength of the correlation, with the circle representing the maximum correlation of 1.
Diversity 17 00018 g004
Table 1. Establishment percentage of newly recorded non-native marine species in the three groups between 1991 and 2020 (calculations displayed in Table S6). The minimum, average, and maximum establishment percentages are displayed per group, together with the regions, as in Figure 1.
GroupMinimumAverageMaximum
NE Atlantic (Regions 1–5)68.4% (Region 5)76.1%93.0% (Region 1)
E Atlantic and W Mediterranean (Regions 6–10)52.1% (Region 10)65.6%76.5% (Region 8)
E Mediterranean (Regions 11–16)71.6% (Region 12)84.6%93.8% (Region 13)
Table 2. The similarity of species assemblages within (cells with grey background) and between groups is shown in percentages, based on SIMPER analysis in PRIMER-e (Table S7). The groups consist of the (pre)determined grouping of regions in Figure 1.
SIMPER Analysis ResultsNE AtlanticE Atlantic and W Med.E. Mediterranean
Northeastern Atlantic34.5%10.3%4.3%
E Atlantic and W Mediterranean10.3%16.6%9.9%
Eastern Mediterranean4.3%9.9%28.9%
Disclaimer/Publisher’s Note: The statements, opinions and data contained in all publications are solely those of the individual author(s) and contributor(s) and not of MDPI and/or the editor(s). MDPI and/or the editor(s) disclaim responsibility for any injury to people or property resulting from any ideas, methods, instructions or products referred to in the content.

