Article

DNA Metabarcoding Analysis of Arthropod Diversity in Dust from the Natural History Museum, Vienna

1
Natural History Museum Vienna, 1. Zoology, Burgring 7, 1010 Vienna, Austria
2
Institute of Zoology, University of Natural Resources and Life Sciences, Gregor-Mendel-Straße 33, 1180 Vienna, Austria
3
Natural History Museum Vienna, Central Research Laboratories, Burgring 7, 1010 Vienna, Austria
4
Rathgen Research Laboratory, Staatliche Museen zu Berlin, Stiftung Preußischer Kulturbesitz, Schloßstraße 1A, 14059 Berlin, Germany
5
Department of Marine Environment and Engineering, National Sun Yat-sen University, Kaohsiung 804, Taiwan
6
School of Environmental Sciences, University of East Anglia, Norwich NR4 7TJ, UK
*
Author to whom correspondence should be addressed.
Diversity 2024, 16(8), 476; https://doi.org/10.3390/d16080476
Submission received: 11 July 2024 / Revised: 25 July 2024 / Accepted: 30 July 2024 / Published: 6 August 2024
(This article belongs to the Special Issue DNA Barcodes for Evolution and Biodiversity—2nd Edition)

Abstract

:
This paper introduces a new method for identifying museum pests through the analysis of DNA present in settled dust. Traditionally, the identification of pests in cultural institutions such as museums and depositories has relied on insect trapping (monitoring). They give good results but need time (minimum spring until summer of one year for a complete survey) and face challenges related to the identification of small, rare, or damaged species. Our study presents a non-invasive approach that utilizes metabarcoding analysis of dust samples to identify pests and other arthropods at the species level. We collected dust samples with a handheld vacuum cleaner in summer 2023 from the six different floors of the Natural History Museum in Vienna and compared the results with the insect monitoring. We found over 359 different species of arthropods in the museum and could show how the diversity increases with the elevation of the building floor. This method could be used for rapid and cost-effective screening of pests before monitoring. But the interpretation of results is sometimes difficult (for Lepismatidae, for example), and it cannot replace a continuous monitoring of pests with traps. This investigation might present the highest indoor animal biodiversity ever found in a single building.

1. Introduction

Urban ecology mostly focuses on outdoor natural and semi-natural environments: parks, forests, grasslands, or other habitats are investigated in cities for their flora and fauna (for example, birds, butterflies, spiders, beetles) [1,2,3,4,5,6,7,8,9,10,11,12,13]. Especially for invasive species, colonisation of new habitats and survival in polluted environments in large cities are of interest (see [14] for a good overview of topics). However, fewer studies investigate the indoor fauna in buildings, and little is known about the biodiversity and how the species interact (but see the studies [15,16,17,18,19]). Pests that attack food, households, materials, and museums are more often studied, but they are usually limited to a few species per building. The intricate interplay of insect species, including pests [20,21], arthropods, fungi, bacteria, some vertebrates, and humans in buildings is understudied and hence not very well understood. Indoor environments serve as dynamic biotopes where various biological entities coexist [1,15,17,18,19,22]. What are the drivers for indoor biodiversity in cities, and how do the species of arthropods interact, evolve, and change over time? Answering these questions might also help to better understand pest populations in buildings like museums.
Buildings housing cultural and natural heritage collections (museums, libraries, historic houses, etc.) are of special interest, as here objects need to be protected from damage by pests and are stored for generations. Humans regularly come to visit these large museums or have their workspace there. Museum pests are often monitored as a part of preventive conservation (and an Integrated Pests Management or IPM program) to protect valuable collections from damage by insects such as carpet beetles, webbing clothes moths, or silverfish [23,24,25,26,27,28,29,30]. Pest monitoring data are collected in many museums in Europe, US, Canada, Japan, Australia, etc., but often not related to other species occurring in the building or result in an academic publication. Most of these museum pests feed either on keratin, animal wool, fur, feathers, cellulose, taxidermy specimens, plant material, or wood. These materials are susceptible to deterioration when infested by beetles, moths, and silverfish [24]. Especially in natural history museums, these pests can severely damage collections of mammals, birds, insects, and herbaria. The most common pest species in Europe probably are Tineola bisselliella, Anthrenus verbasci, Attagenus smirnovi, Stegobium paniceum, Lepisma saccharinum, and Ctenolepisma longicaudatum, but large comparative studies are rare (but see [30,31] and the EH database: https://www.whatseatingyourcollection.com/ accessed 29 July 2024). These insects usually have three main sources of food in heritage buildings: (i) museum objects made of organic materials, (ii) dead insects, and (iii) organic dust.
Dust can be an important food source for pests [32] and accumulates in every building. It consists of organic and inorganic compounds [33,34,35] and is often a result of human activity. A large part of the dust can be human hair, human skin cells, and textile fibers, as well as dead insects, fungi spores, and dead organic matter coming from the building and its surroundings [36,37,38,39]. The presence of insects in dust has been documented in numerous studies [15,40,41,42,43,44,45]. The ubiquitous presence of dust mites, silverfish, booklice, carpet beetles, other small beetles and insects, and various arachnids in dust is attributed to their ability to navigate and establish small micro-habitats, notably gaps within indoor spaces [41]. These are the same places where dust accumulates, and the arthropods play diverse roles in ecological processes [19]. The composition of insect communities in dust varies across different settings, influenced by factors such as indoor climate, building design, and human activities [15]. Dust serves as a reservoir and food source for various insect pests that can compromise the integrity of museum collections [25]. Monitoring and understanding the presence of pests in dust are fundamental for the development of integrated pest management strategies aimed at preserving artifacts and specimens.
The presence of DNA in dust within buildings has become a subject of increasing interest [42,43,44,45]. Understanding the composition of organisms in dust is crucial for implementing effective conservation strategies. Advances in molecular biological techniques [46,47] have enabled the detection and analysis of DNA in environmental samples, including soil [48], other terrestrial samples [49,50,51,52] or dust [42,43,53]. The presence of DNA in dust has implications not only for understanding the arthropod diversity in a building but also for bacteria, fungi, archaea, and viruses in indoor environments [43,53,54]. The use of high-throughput sequencing technologies has enabled the identification of different taxa and the exploration of diversity in indoor and natural environments [16,54]. Insects contribute to the genetic diversity of indoor dust through the deposition of their exoskeletons and feces [53]. Additionally, the gut microbiota of insects or the gut content of predators may influence the composition and diversity of dust (microbial and fauna) [54]. Modern DNA analysis has the big advantage that pooled samples can be analysed cost-effectively and reveals numerous species present in a sample of soil or dust [11,55,56,57,58,59,60,61,62,63,64,65,66,67,68,69,70,71,72,73,74]; see also the review by Ruppert et al. [75] on these methods. The integration of entomological studies with molecular techniques has facilitated a comprehensive understanding of the presence and dynamics of insects and DNA in different environments [50,51,52]. Molecular approaches, such as polymerase chain reaction (PCR) and high-throughput sequencing, provide tools for DNA analysis, enabling the identification of arthropod communities at the taxonomic and functional levels [54,55]. Comparative online databases for species identification via DNA metabarcoding are available and increasing on a daily basis. However, its use in the study of museum pests is still very limited [76].
In response to the imperative need for continuous monitoring, insect traps have become indispensable tools for museum professionals. These traps, strategically placed within exhibition galleries, storage areas, and other critical locations, enable the systematic collection and identification of insect pests and other arthropods [77,78,79,80,81,82,83]. The use of sticky blunder traps, pheromone traps, and sometimes UV light traps enhance the efficacy of monitoring programs, allowing for the detection of emerging threats. Other entomological surveys involve the use of vacuum sampling and hand collection to identify species [15,39,84,85]. Identifying and quantifying arthropods is done under the microscope. Continuous surveillance through insect traps provides a non-invasive and efficient method to detect and monitor the presence of pests, enabling early intervention to prevent potential threats. However, insect identification can be difficult, especially from sticky traps where animals are often damaged by the glue, and the results need to be interpreted correctly.
The monitoring of insect pests has emerged as a pivotal component of integrated pest management strategies in museum settings. However, the complete fauna of these indoor environments and other cultural institutions are not well studied. Understanding the drivers for the diversity and abundance of arthropods in museums is fundamental for devising targeted interventions that safeguard the longevity of heritage collections. This paper aims to contribute to the existing body of knowledge by investigating the diversity of fauna and museum pests of the Natural History Museum in Vienna. We tested a new sampling method for arthropods, insects, and pests in a museum and wanted to see how DNA analysis of dust samples could be used to assess the species richness of arthropods and specifically of museum pests in a large museum building. We hypothesise that the dust samples contain the same species as those found on the insect monitoring traps and that this method gives a rapid assessment of the species present in a building.

2. Materials and Methods

2.1. Study Site

The study was conducted at the Natural History Museum in Vienna, Austria (Figure 1). The museum has multiple floors (six: attic to the ground floor and basement) with large exhibition rooms (two floors) and a diverse collection of spaces, libraries, offices, studios, laboratories, and kitchens (see Table 1). Overall, this provides a rich environment for the study of insects and arthropods in a single historic building. Not all 900 rooms were investigated, but we examined all exhibition spaces and many relevant storage rooms housing valuable collections that can be damaged by insect pests. In the museum, insect pest monitoring with traps has been in place for many years, and the pest fauna is well known (a large analysis of the pest development over time and in relation to the indoor climate is still ongoing and will be published in the future).

2.2. Dust Sampling to Collect DNA Within

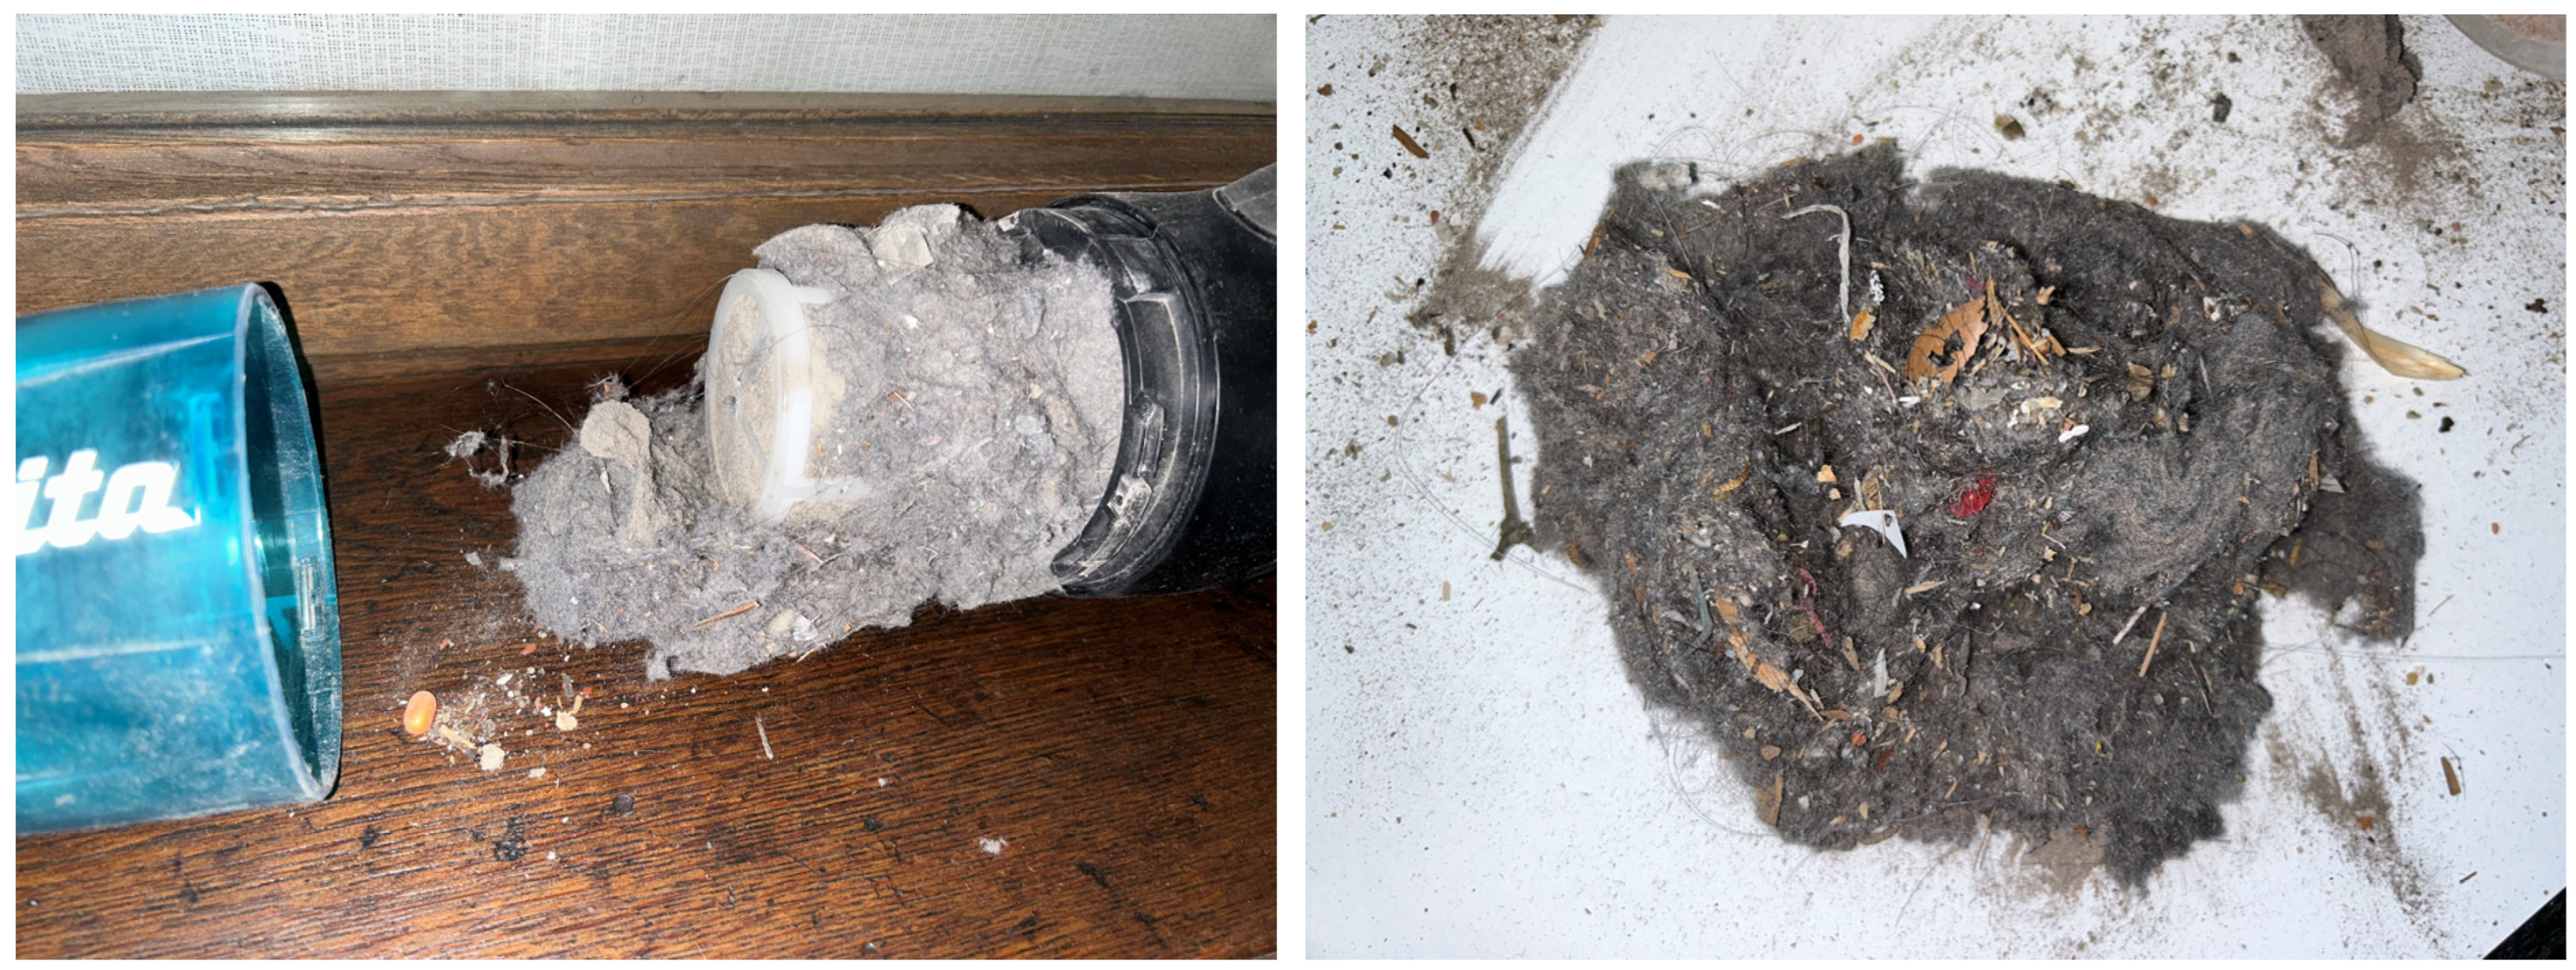
We selected a number of rooms on each floor to compare the different floors of this large building. Dust samples were taken in September 2023 with a handheld Makita DCL180 vacuum cleaner (type: LXT; Figure 2). We vacuumed the corner of the floor along the walls and on window sills. See Table 1 for the total length of vacuumed walls and the total room area sampled on each floor. The dust samples for each floor were pooled, weighed, and separated for (i) the DNA analysis (95%) and (ii) a chemical analysis (5%) with a scanning electron microscope at the Natural History Museum in Vienna (type: JEOL JSM-6610LV with an energy dispersive X-rey detector by the company BRUKER) for their main elemental composition on the surface of the dust samples. A large percentage of the volume of the dust was textile fibres and human hair. The dust samples were transferred to new plastic bags and sent to the lab for further DNA processing (see below). In addition to the six floors, we also sampled the rooms of the entomology department, which has a collection of millions of dry insect specimens. We did not mix these samples with the other floors, as there seemed to be a high risk of contamination with DNA from the collection.

2.3. Insect Trapping to Collect DNA Within

Standard sticky blunder traps (type Catchmaster) and pheromone traps for webbing clothes moths Tineola bisselliella (type Finicon) were strategically placed on all floors across various locations and rooms within the museum (and a few also on window sills). Traps were evenly distributed to ensure representativeness across different floors, accounting for variations in collections, room use, temperature, humidity, visitor numbers, and open windows.
The monitoring period used here for the analysis extended over 6 months from February 2023 until September 2023 (the dust samples were taken during the same week the insect traps were collected and replaced with new traps). Insects captured in the sticky traps were identified to the lowest possible taxonomic level using a handheld lens or a stereo microscope and identification keys [86,87]. We only present the pooled number of each pest species for each floor.
The dust analysis revealed (i) a total species richness for each floor, (ii) species richness of pests, and (iii) a quantitative measure resulting from the total DNA of each species. Dust samples were compared to trapping from each floor. We tried to pool all arthropod species from the traps to extract their DNA: one specimen of each different type of animal (pests, other insects, and other arthropods, such as spiders) was carefully removed from the traps (Figure 3) with fine tweezers and a pooled in alcohol sample (97%) for each floor and then sent for DNA analysis (trap samples). We try to collect as many morphospecies as possible for each floor. The whole individual was collected for small beetles, spiders, booklice, springtails, mosquitoes, and flies, and only body parts, such as legs, were collected for large beetles or spiders.
The dust samples were compared with the trap samples for (i) the total species richness for each floor, (ii) the species richness of pests, and (iii) a quantitative measure resulting from the total DNA of each species.
In a third analysis, we compared the pests found in the dust with the traps and the monitoring results from the conventional morphological identification as a reference for the pest richness and species composition for each floor.

2.4. DNA Analysis

Preservative ethanol (97%) of the ethanol sample (A) was removed by drying for at least 6 h at 65 °C. The dry samples were then homogenised with stainless steel beads. DNA was extracted from the dust (D) and alcohol (A) samples using a commercially available DNA extraction kit (Qiagen DNEasy Tissue Plate Kits) following a protocol customised by AIM. Initial PCR reactions were performed using the MyTaqTM Plant-PCR Kit (Bioline GmbH, Luckenwalde, Germany) with Illumina-ready fusion primers derived from the primer pair of Leray et al., 2013 [88]. (dgHCO 5′-GGWACWGGWTGAACWGTWTAYCCYCC-3′ mlCOIntF 5′-TAAACTTCAGGGTGACCAAARAAYCA-3′).
High-Throughput Sequencing: Amplification success and fragment lengths were determined by gel electrophoresis in a 1% TAE gel using GelRed (Genaxxon bioscience GmbH, Ulm, Germany). The amplified DNA served as input for the downstream index PCR. The Illumina Nextera XT indices (Illumina Inc., San Diego, CA, USA) were ligated to the samples in a second PCR reaction using the same annealing temperature as in the first PCR reaction but with only seven cycles. The ligation success was confirmed by gel electrophoresis. DNA concentrations were measured with a Fluorsokan plate reader (LifeTechnologies, Carlsbad, CA, USA) using the Qubit fluorometer dsHS chemicals (LifeTechnologies, Carlsbad, CA, USA) and the samples were combined into pools containing equimolar concentrations of 100 ng each. Library pools were cleaned and size selected using NGS magnetic beads (MagSi-NGSPrep Plus, Magtivio) for downstream sequencing. The Qubit fluorometer (Life Technologies) and bioanalyzer (Agilent Technologies) were used to analyse the final library regarding DNA concentration and amplicon size. High-Throughput Sequencing (HTS) was performed on an Illumina MiSeq using v3 chemistry (2 × 300 bp, 600 cycles, maximum 25 million paired-end reads).
Paired-end reads were merged using the -fastq_mergepairs of the USEARCH suite v11.0.667_i86linux324 with the following parameters: -fastq_maxdiffs 99, -fastq_pctid 75, fastq_trunctail 0. Adapter sequences were removed using CUTADAPT K5 (default parameters). All sequences that did not contain the corresponding adapter sequences were filtered out in this step using the --discard-untrimmed parameter. The remaining preprocessing steps (quality filtering, dereplication, chimera filtering, and clustering) were performed using the VSEARCH suite v2.9.16. Quality filtering was performed using the VSEARCH utility --fastq_filter (parameters: --fastq_maxee 1, --minlen 300). The sequences were dereplicated using --derep_fulllength (parameters: --sizeout, --relabel Uniq), first at the sample level (output: all.derep.uc) and then at the combined data set level after all sample files became one large FASTA file (all. fasta), which was also filtered for singletons (parameters: --minuniquesize 2, --sizein, --sizeout, --fasta_width 0; result file: all.derep.fasta). Before chimera filtering, a pre-clustering step (at 98% identity) was performed using the --cluster_size VSEARCH utility with the Centroids algorithm (parameters: --id 0.98, --strand plus, --sizein, --sizeout, --fasta_width 0, --centroids; input: all.derep.fasta; outputs: all.preclustered.uc, all.preclustered.fasta). Chimeric sequences were then detected and filtered out from the resulting file using the VSEARCH --uchime_denovo option (parameters: --sizein, --sizeout, --fasta_width 0, --nonchimeras; input: all.preclustered.fasta; output: all .denovo.nonchimeras.fasta). The remaining sequences were then clustered into OTUs with 97% identity using --cluster_size (parameters: see below). A custom Perl script was used to extract all non-chimeric non-singleton sequences from the dereplicated dataset (inputs: all.derep.fasta, all.preclustered.uc, all.denovo .nonchimeras. fasta; output: all.nonchimeras.derep.fasta), and then all non-chimeras non-singletons from each sample (inputs: all.fasta, all.derep.uc, all.nonchimeras.derep.fasta; output: all.nonchimeras.fasta) to create the OTU table. The Perl script was used to recover all quality and chimera-filtered sequences from each sample, including singletons and sequences that had been removed during the two rounds of dereplication. The resulting file (all.nonchimeras.fasta) was then used to map the reads to the OTUs to create the OTU table (parameters: --cluster size all.nonchimeras.fasta, --id 0.97, --strand plus, --sizein, --sizeout, --fasta_width 0, --uc, --relabel OTU, --centroids otus.fasta, --otutabout otu_table.txt).

2.5. Species Reduction

Various steps were taken to minimize the risk of false positive results. In the first step, entries that accounted for <0.01% of the total number of reads in the sample were eliminated from the OTU table. The DNA barcoding-based species identification was carried out by blasting the OTUs against two reference databases, according to the method described in Morinière et al. [89] using Geneious (v.10.2.5—Biomatters, Auckland, New Zealand) (parameters: program: Megablast; maximum hits: 1; scoring (match mismatch): 1–2; gap cost (open extend): linear; max E-value: 10; word size: 28; max target seqs 100): (i) a custom local database based on data from GenBank (local copy of the NCBI nucleotide database, downloaded from http://ftp.ncbi.nlm.nih.gov/blast/db/ [90]), and (ii) a custom local database based on BOLD 7.8 data (downloaded from www.boldsystems.org [91]), including the taxonomy and BIN-Information. The resulting csv files contained the OTU ID, BOLD Process ID, Barcode Index Number—Classification (BIN), Hit %ID value (percent overlap similarity (identical base pairs) of an OTU query sequence (with its closest counterpart in the database), the Grade% ID value (combination of query coverage, E-value and identity values for each hit with weights of 0.25 and 0.5, respectively, allowing the longest and most identity hits to be determined), the length of the top BLAST hit sequence as well as phylum, class, order, family, genus, and species taxonomic information for each OTU. As an additional control measure in addition to BLAST, OTUs were classified into taxa using the naive Bayesian classifier from the Ribosomal Database Project (RDP) trained on a cleaned COI dataset of arthropods and chordates (plus outgroups; see [92]). To reduce the risk of false-positive results, the combined results table was then filtered, excluding those read counts in the OTU table that were <0.01% of the total number of reads in the sample. Additionally, OTUs were removed from the results that were based on negative control samples (i.e., H.) when the total number of reads in the negative controls was >20% of the total number of reads in the OTU. The OTUs were also annotated with taxonomic information from NCBI (downloaded from https://ftp.ncbi.nlm.nih.gov/pub/taxonomy/ [93]), followed by establishing a taxonomic consensus between BOLD, NCBI, and RDP. Interactive Krona diagrams were created from the taxonomic information using KronaTools v1.3. Details of the bioinformatic pipeline can be found (Figure 1 and Figure 2) in the supplementary part of Uhler et al., 2021 [94]. In a final step OTUs with read counts below 10 were eliminated, as well as OTUs with a hit length below 250 bp.

3. Results

3.1. Total Species Richness

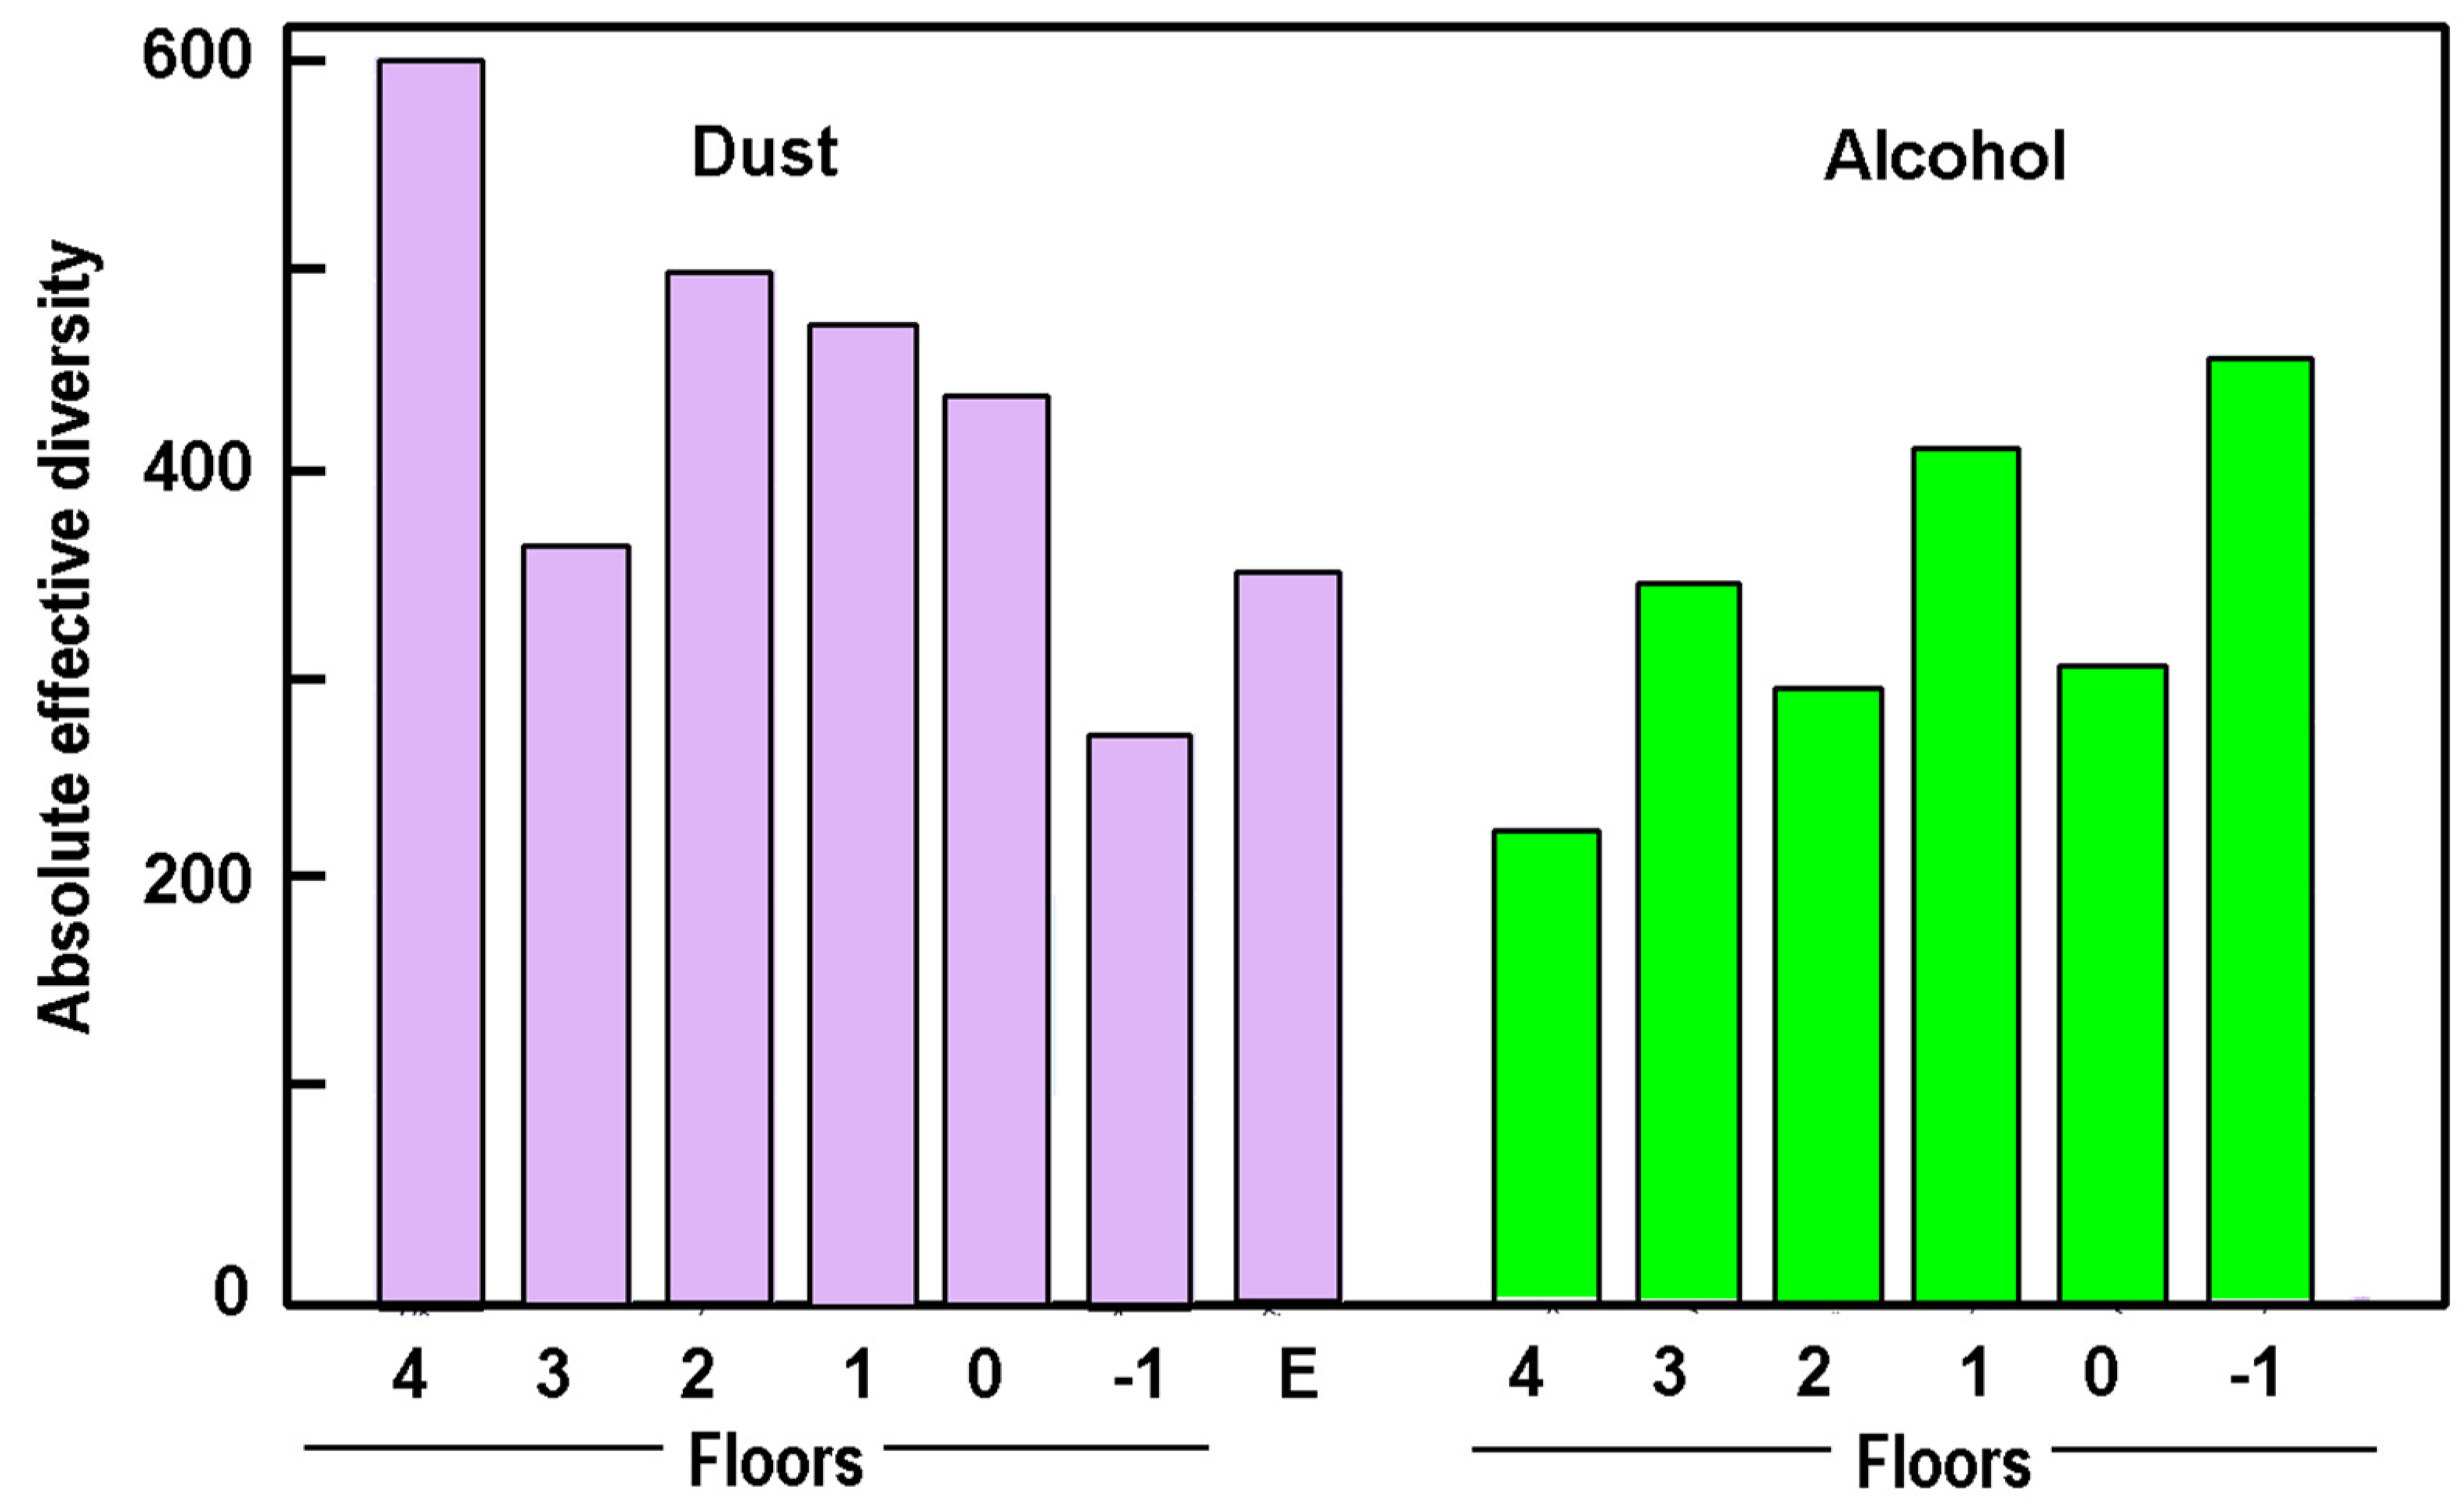
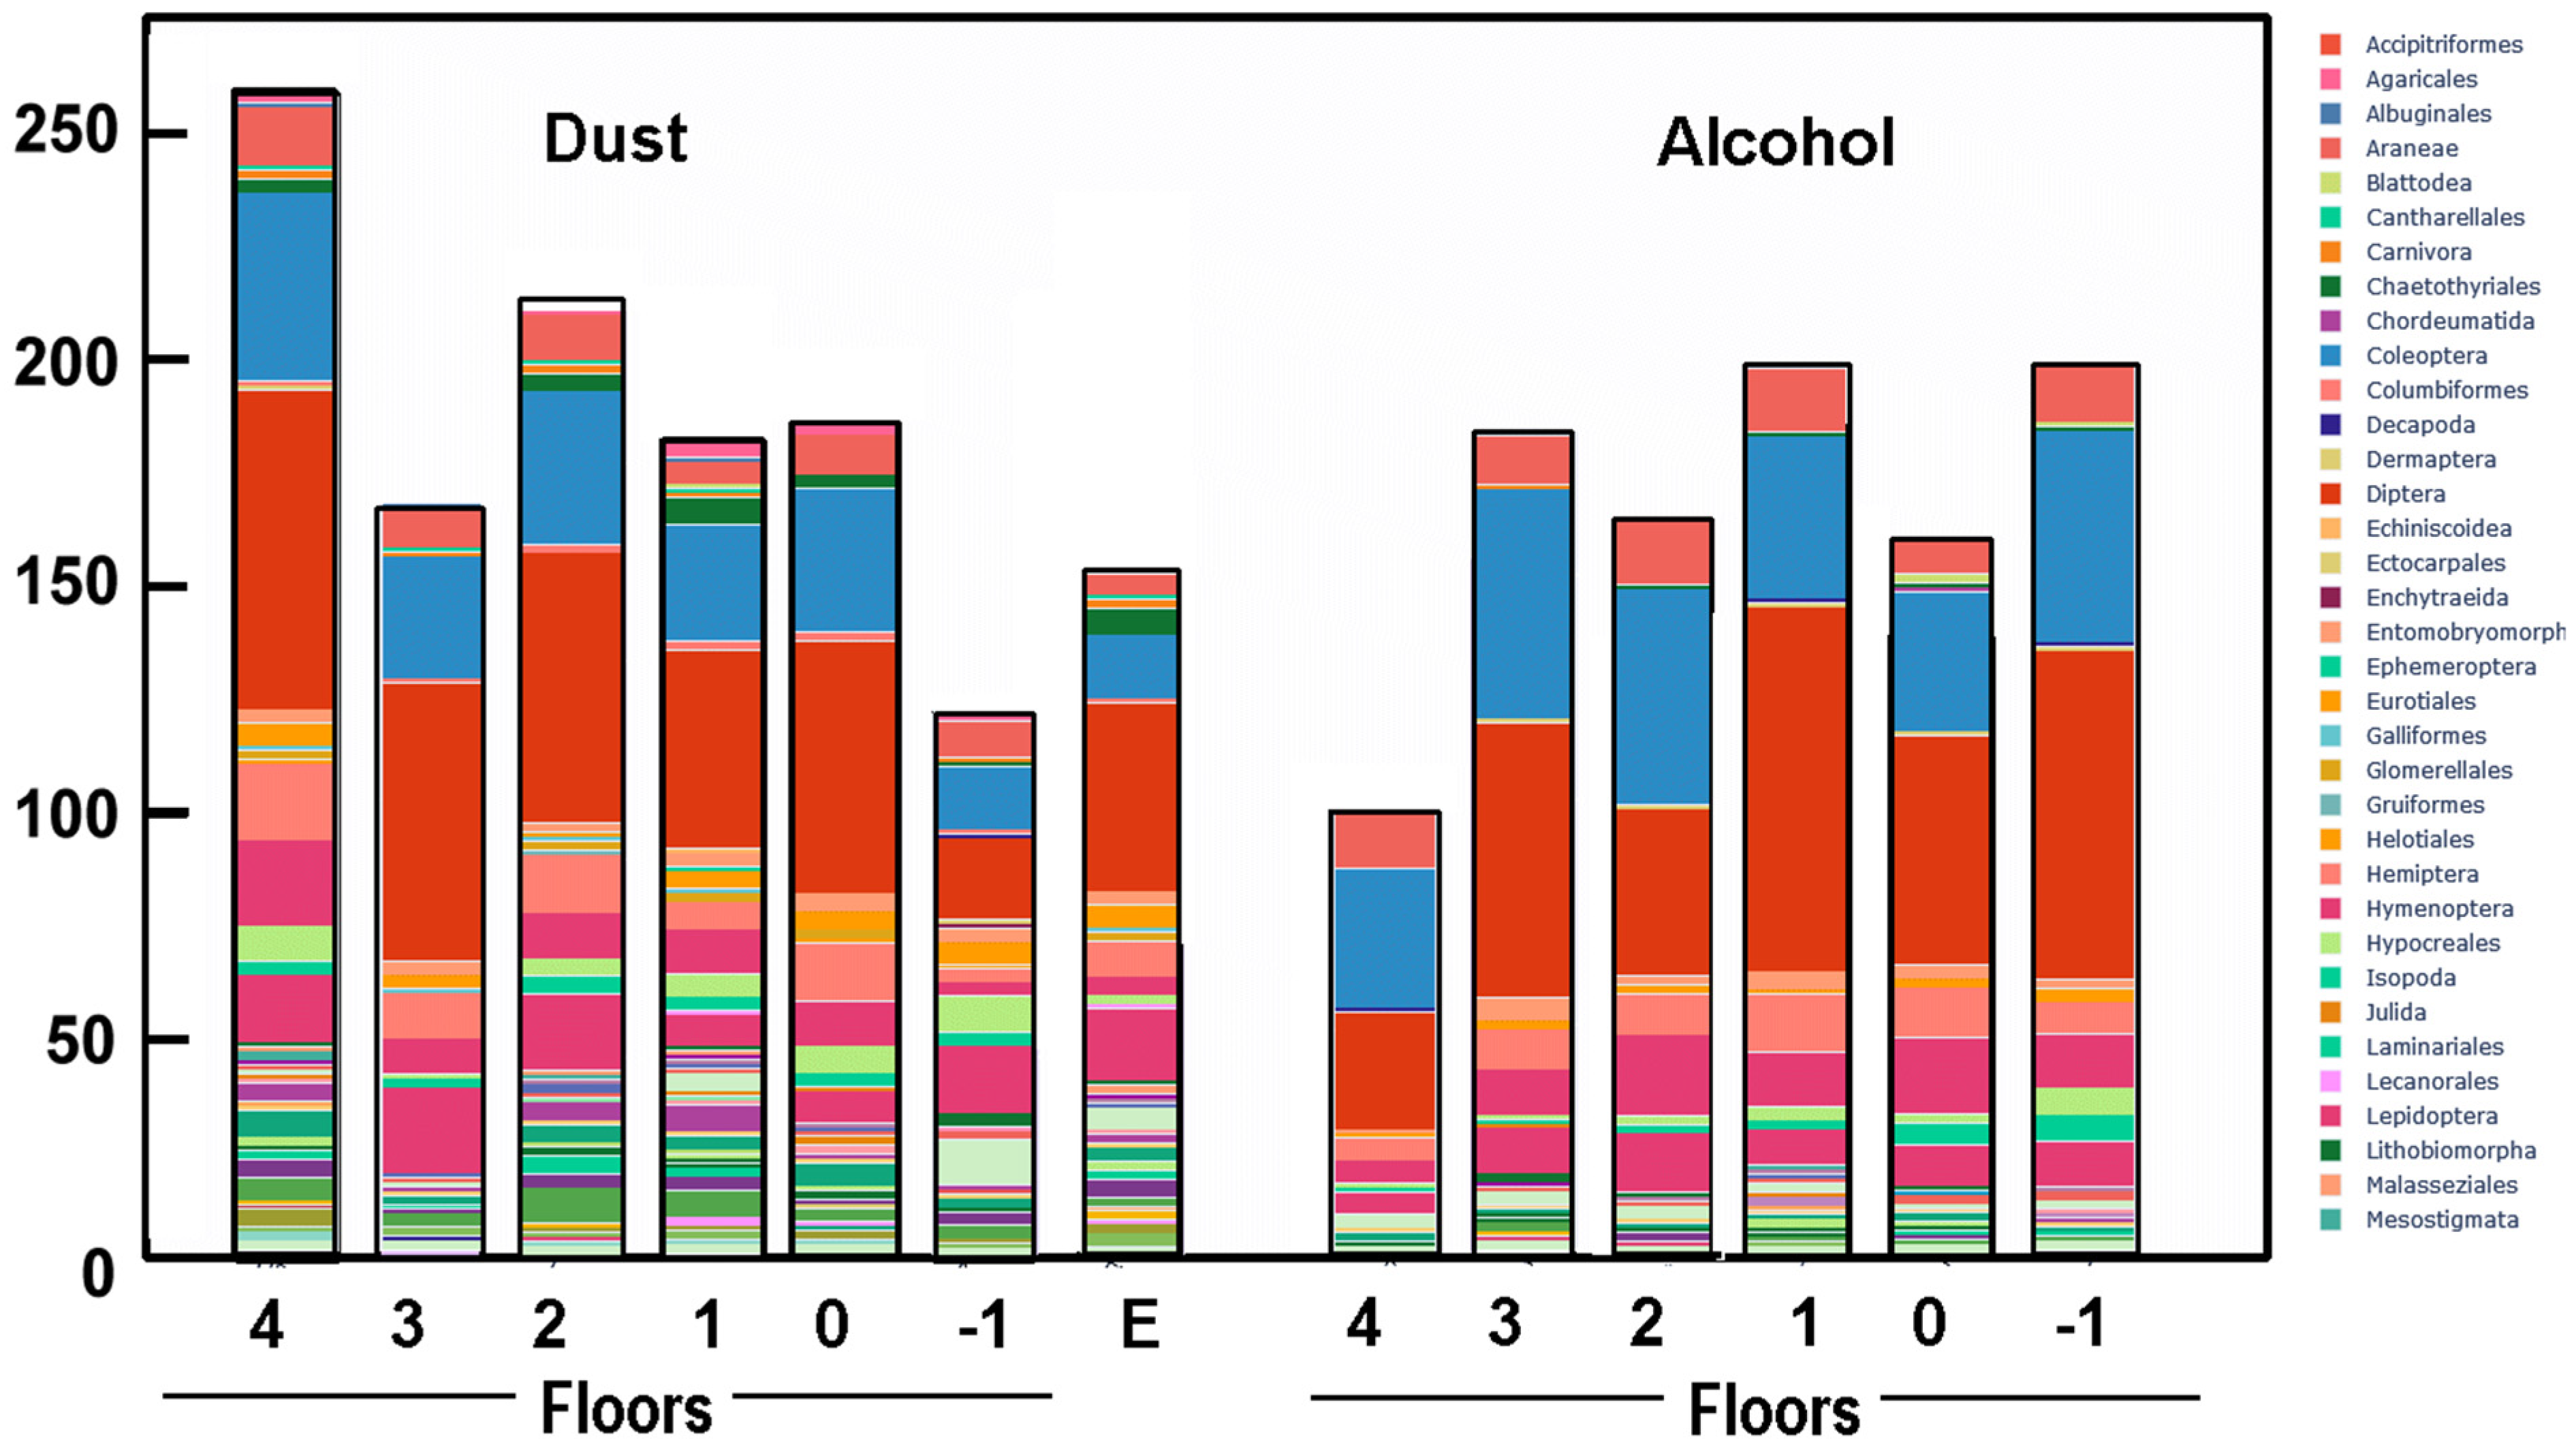
The initial output of all DNA samples revealed an overall Absolute Effective Diversity (AED) of over 700 taxa across all floors in both sample types, with DNA from the dust and from alcohol extracts. The diversity in the dust samples is higher than in the alcohol extracts, with the exception of the cellar (Figure 4 and Figure 5). After reducing the species (see Material and Methods), 359 different arthropod taxa were identified and used for further analysis (i.e., not including mammals, birds, fish, reptiles, and other animals also detected). In later analysis, we used species richness and entropy only (i.e., H = Σpiln(pi), where pi is the proportion of the i-th species in relation to the total). In the final species list (Table S1), most taxa were identified to the species level and only a few to the genus or family level. There is a large overlap of the species identified with the BOLD and the BIN database and most show the same species identification in both databases. In total 279 species were found in the dust samples and 305 in the trap samples (see Supplementary Material Table S1 for the complete list of species and their occurrence across the floors). For some species, more than one species name was listed; all the names are included in Table S1.
The most characteristic arthropod species found in the study (with the highest DNA reads in the samples) were Armadillidium vulgare, Bradysia tilicola, Clogmia albipunctata, Corythucha ciliata, Culicoides grisescens, Dorypteryx domestica, Drosophila melanogaster, Harmonia quadripunctata, Harpalus rufipes, Lasius sp., Leucostoma sp., Macropelopia nebulosa, Mesapamea sp., Musca domestica, Noctua sp., Proctophyllodes locustellae, Steatoda grossa, Tapinoma sp., Tipula cf. oleracea and Vespula germanica. Also, the species Calliphora sp., Dasyhelea flavifrons, Drosophila mercatorum, Parammoecius gibbus, Steatoda triangulosa, Willowsia buski, Willowsia nigromaculata, and the harvestman Opilio parietinus were found present in terms of large amounts of DNA.

3.2. Species Richness in the Dust Samples and Trap Extracts

The species richness varies across each floor (Table 2). In the dust samples, the highest species richness was found in the attic (F4) and the lowest in the basement (F1). The entropy in the dust is highest in the attic and lowest on the first floor. A reverse pattern was found in the trap extracts, with the highest species richness in the basement and the lowest in the attic. The entropy of the trap samples is highest on the second floor and lowest on the ground floor (F0). On five out of six floors, the species richness is higher in the trap samples, and on four out of six floors, the entropy is higher. The species overlap between dust and trap samples ranges between 35 and 81 species. The species richness did not seem to be related to the type of collection or room use. Most notably, the entomological collection showed a low species richness in the dust and a median value among the entropy determined for various floors. Also, no exotic species that might have originated from the collection were found in the samples of the entomology.
We found a clear relationship between the species richness of arthropods and the weight of the dust samples (Kendal τ = −0.14; p ~ 0.75; n = 7), but the number of samples is very small. Additionally, this was not surprising as the weight was strongly influenced by variations in components such as small stones, a large proportion of fibres (Figure 4), insect parts, human hair, and dander.
Table 2 shows that a high percentage of the total DNA in the dust is from Homo sapiens on Floor 1 to 3 but much lower on Floors 0 and −1. The percentage of human DNA in the dust from the basement is very low, as this area is also less frequented by staff and not at all by visitors. Exhibition rooms with public access are on Floors 1 and 2. Here, windows are frequently opened for ventilation (almost daily throughout the entire year). Floor 2 had the highest level of human DNA, but Floor 1 was more modest, so it is difficult to argue that the exhibition rooms are distinctive in terms of human DNA. On other floors (0, 2–4), museum staff work on a daily basis, and external visitors visit the collections and libraries. The highest percentage of human DNA was found in the dust of the entomology collection, with 62%. This is surprising as these areas are cleaned as regularly as other library and collections spaces; also, the staff activity is not high here.
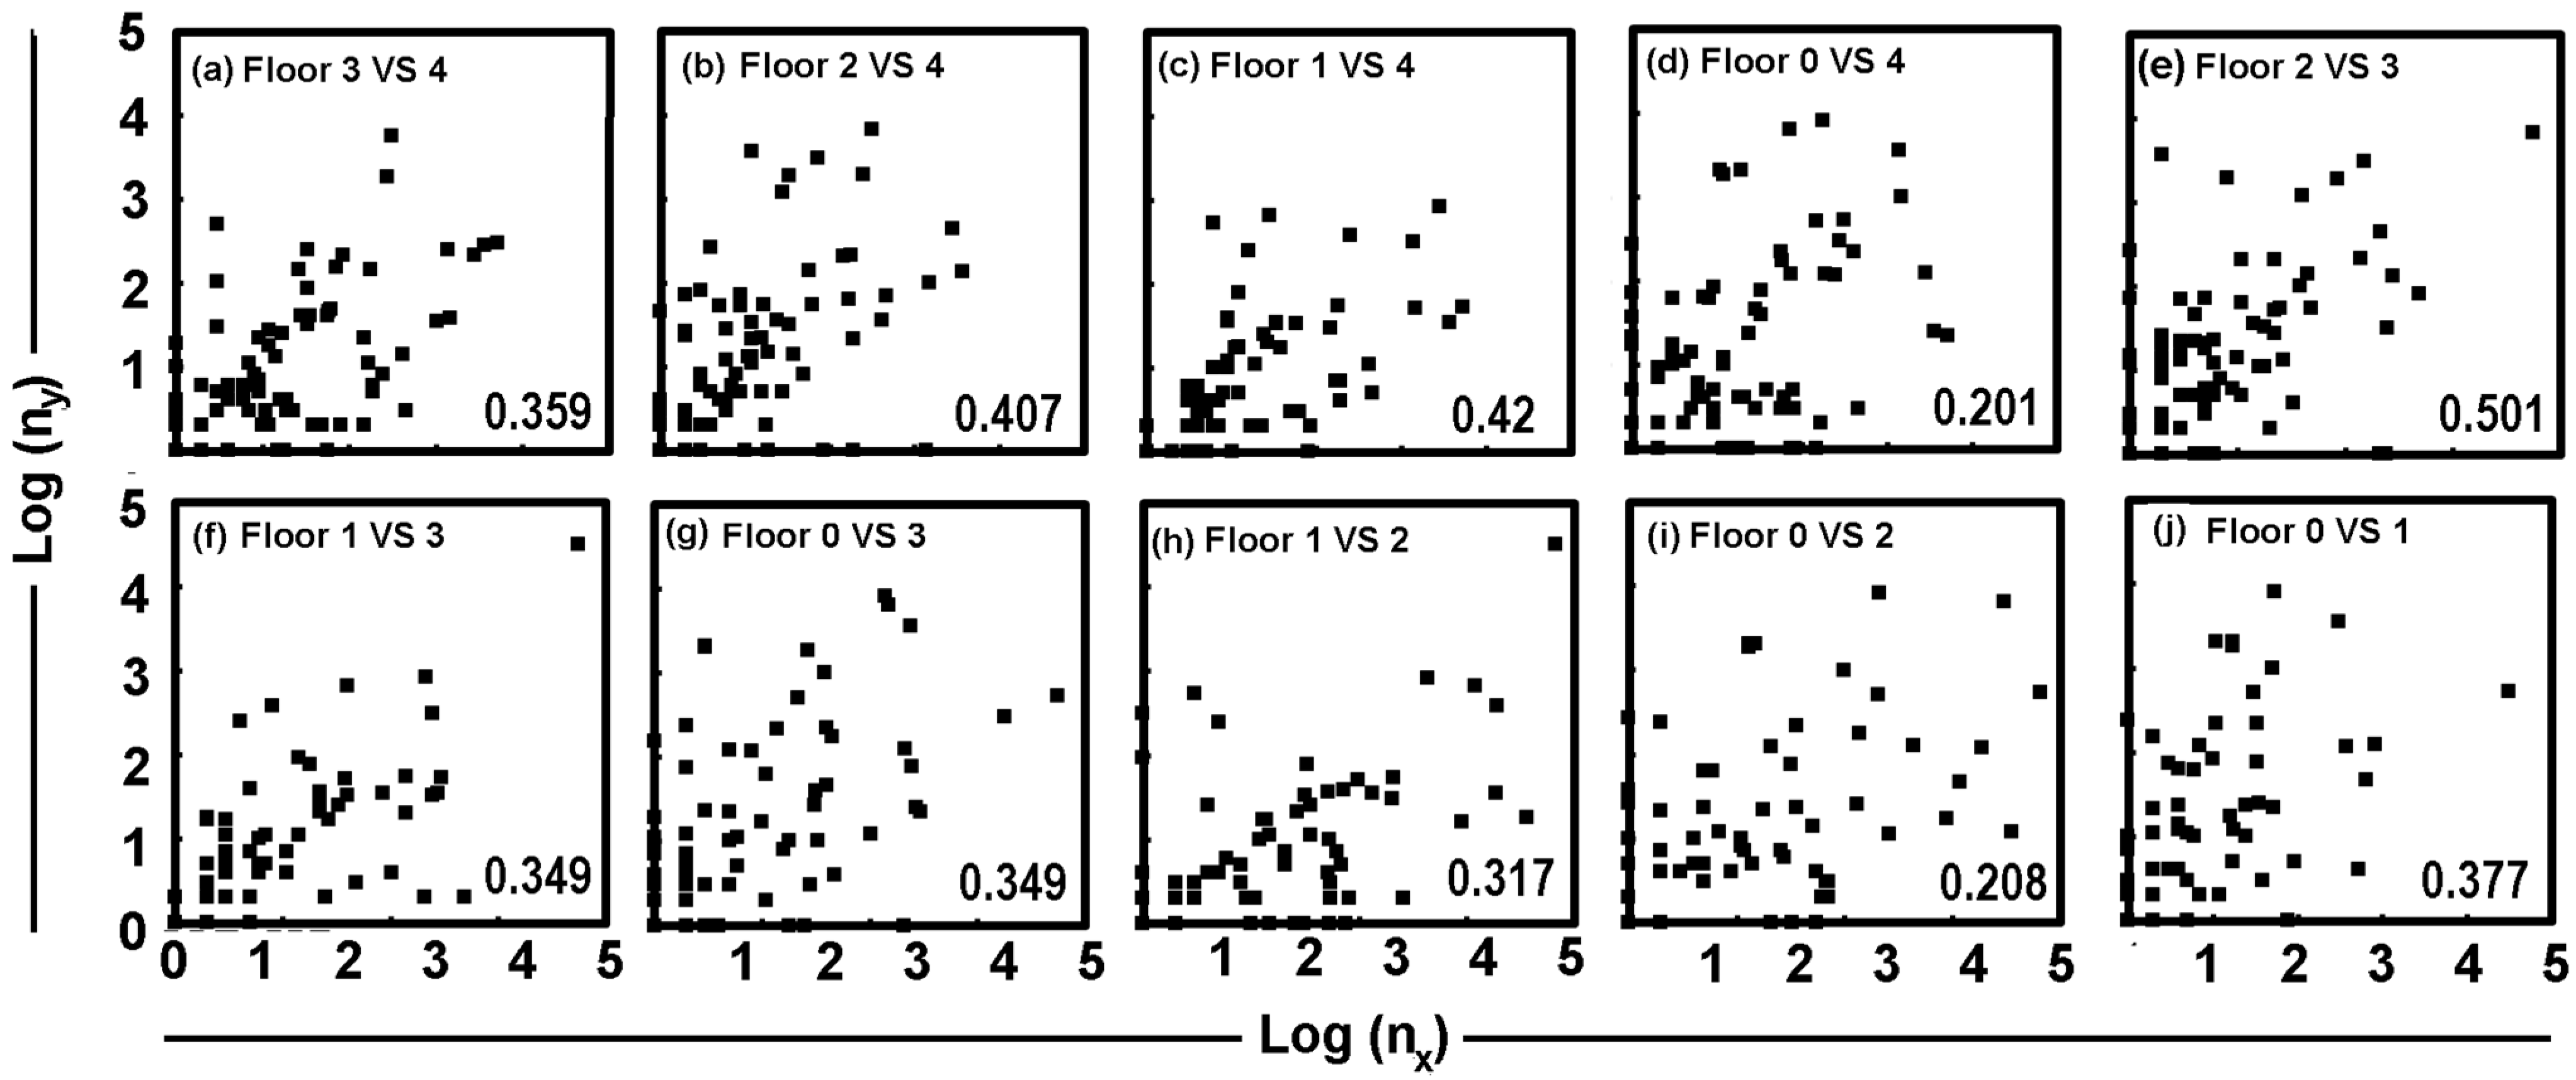
In Figure 6, we see the correlation of the amount of DNA in the dust for a given species between different floors across the museum for species with DNA found on both floors. The best correlation was found between Floor 2 and Floor 3 (τ = 0.501; both exhibition areas), between Floor 2 and the attic Floor 4 (τ = 0.407) and also the ground floor (F0) and Floor 4 (τ = 0.42). The lowest correlation was between the ground floor and the attic (τ = 0.31). All correlations are positive, showing a strong relationship between the presence of different species among the different floors.

3.3. Arthropod Species Assemblage

The dominant arthropod taxa (related to the amount of DNA found) in the dust were Attagenus smirnovi, Harpalus rufipes, Calliphora sp., Chorthippus sp., Dolycoris sp., Ctenolepisma calvum, Dermestes mustelinus and Stegobium paniceum and in the trap DNA Fannia canicularis, Ctenolepisma calvum, Ctenolepisma longicaudatum, Attagenus smirnovi, Dermestes mustelinus, Forficula auricularia, Dermestes maculatus, Amara apricaria and Opilio parietinus (see Supplementary Material; Figures S1–S6). The results show that the floors have quite different species composition, with some species occurring on almost all floors, and many rare species are only found on a few floors and in low numbers. Because the building and the floors were not replicated, we could not statistically analyse the data. See Supplementary Material (Table S1) for the results of DNA sample analysis. The trap DNA had a high species richness, which might be partly secondary DNA in the gut of predators and detritivores.

3.4. Museum Pests in the Dust Samples

Insect pests that could be a threat to the collections stored and exhibited were found on all floors of the museum. There were 26 species of pests in the museum (across all floors and both sampling methods), with three species of moths (Lepidoptera), three species of silverfish (Lepismatidae), 16 species of beetles, and four species of booklice (see Table S1). As the booklice are the least relevant pests to the collection, we did not include them in further analyses of species richness across the floors. In the dust, only Attagenus smirnovi was found in a high proportion of the material. In the alcohol extracts from traps Attagenus smirnovi, Dermestes maculatus and Dermestes cf. mustelinus, Ctenolepisma calvum and Ctenolepisma longocaudatum were all found with relatively high DNA quantities. Tineola bisselliella and Anthrenus verbasci were found in rather low proportions in both sample types.
Two pest species were found on all six floors in the dust samples: Dermestes cf. mustelinus and Ctenolepisma calvum. Attagenus smirnovi, Reesa vespulae, Stegobium paniceum, and Thylodrias contractus were found on five floors across the museum. Tineola bisselliella was not found to be very common in the dust, which is in contradiction to the monitoring, as it has been one of the most abundant pest species over recent years in this museum (see Table 3 below). Attagenus smirnovi, Reesa vespulae, and Thylodrias contractus are three carpet beetles that threaten many collections in the building, including dry insect specimens, fur, feathers, stuffed animals, and textiles. Stegobium paniceum is found on the traps only in low amounts, although it is an insect that threatens historic books in the libraries or herbaria material, for example.
The DNA from three species of moths was found: Tineola bisselliella, Monopis crocicapitella and Plodia interpunctella. The first two can feed on organic-rich dust, while the last is a common food pest, but often also found in the Finicon pheromone traps, probably because of contamination of different pheromones on these traps.
We found DNA from a total of nine species of Dermestidae: Anthrenus verbasci, Attagenus smirnovi, Attagenus brunneus, Attagenus unicolor, Dermestes lardarius, Dermestes maculatus, Dermestes cf. mustelinus, Thylodrias contractus and Reesa vespulae. Besides Tineola bisselliella, these are the most relevant pests feeding on dry insect specimens, taxidermy objects, and collections of fur and feathers.
The DNA from the ghost silverfish Ctenolepisma calvum was present in large amounts in both the dust and traps. Additionally, DNA from the grey silverfish Ctenolepisma longicaudatum is abundant, but only in the basement. This is also the area where this species is found in the traps. Lepisma saccharinum (common silverfish) were found with lower amounts of DNA but were present on all floors and with both methods of sampling.

3.5. Species Richness of Pests across the Floors

The species richness varies across the floors (Table 3), with the highest species richness in the dust samples from Floor 4 (attic) and the lowest from the basement. This is in contradiction with the trap extracts, where the higher diversity of pests was found in the basement (17 species) and the lowest in Floor 1 and 3 (14 species). In the trap samples, the species richness is quite similar (between 14 and 17). The entomology rooms had a rather low species richness (9) in the dust.
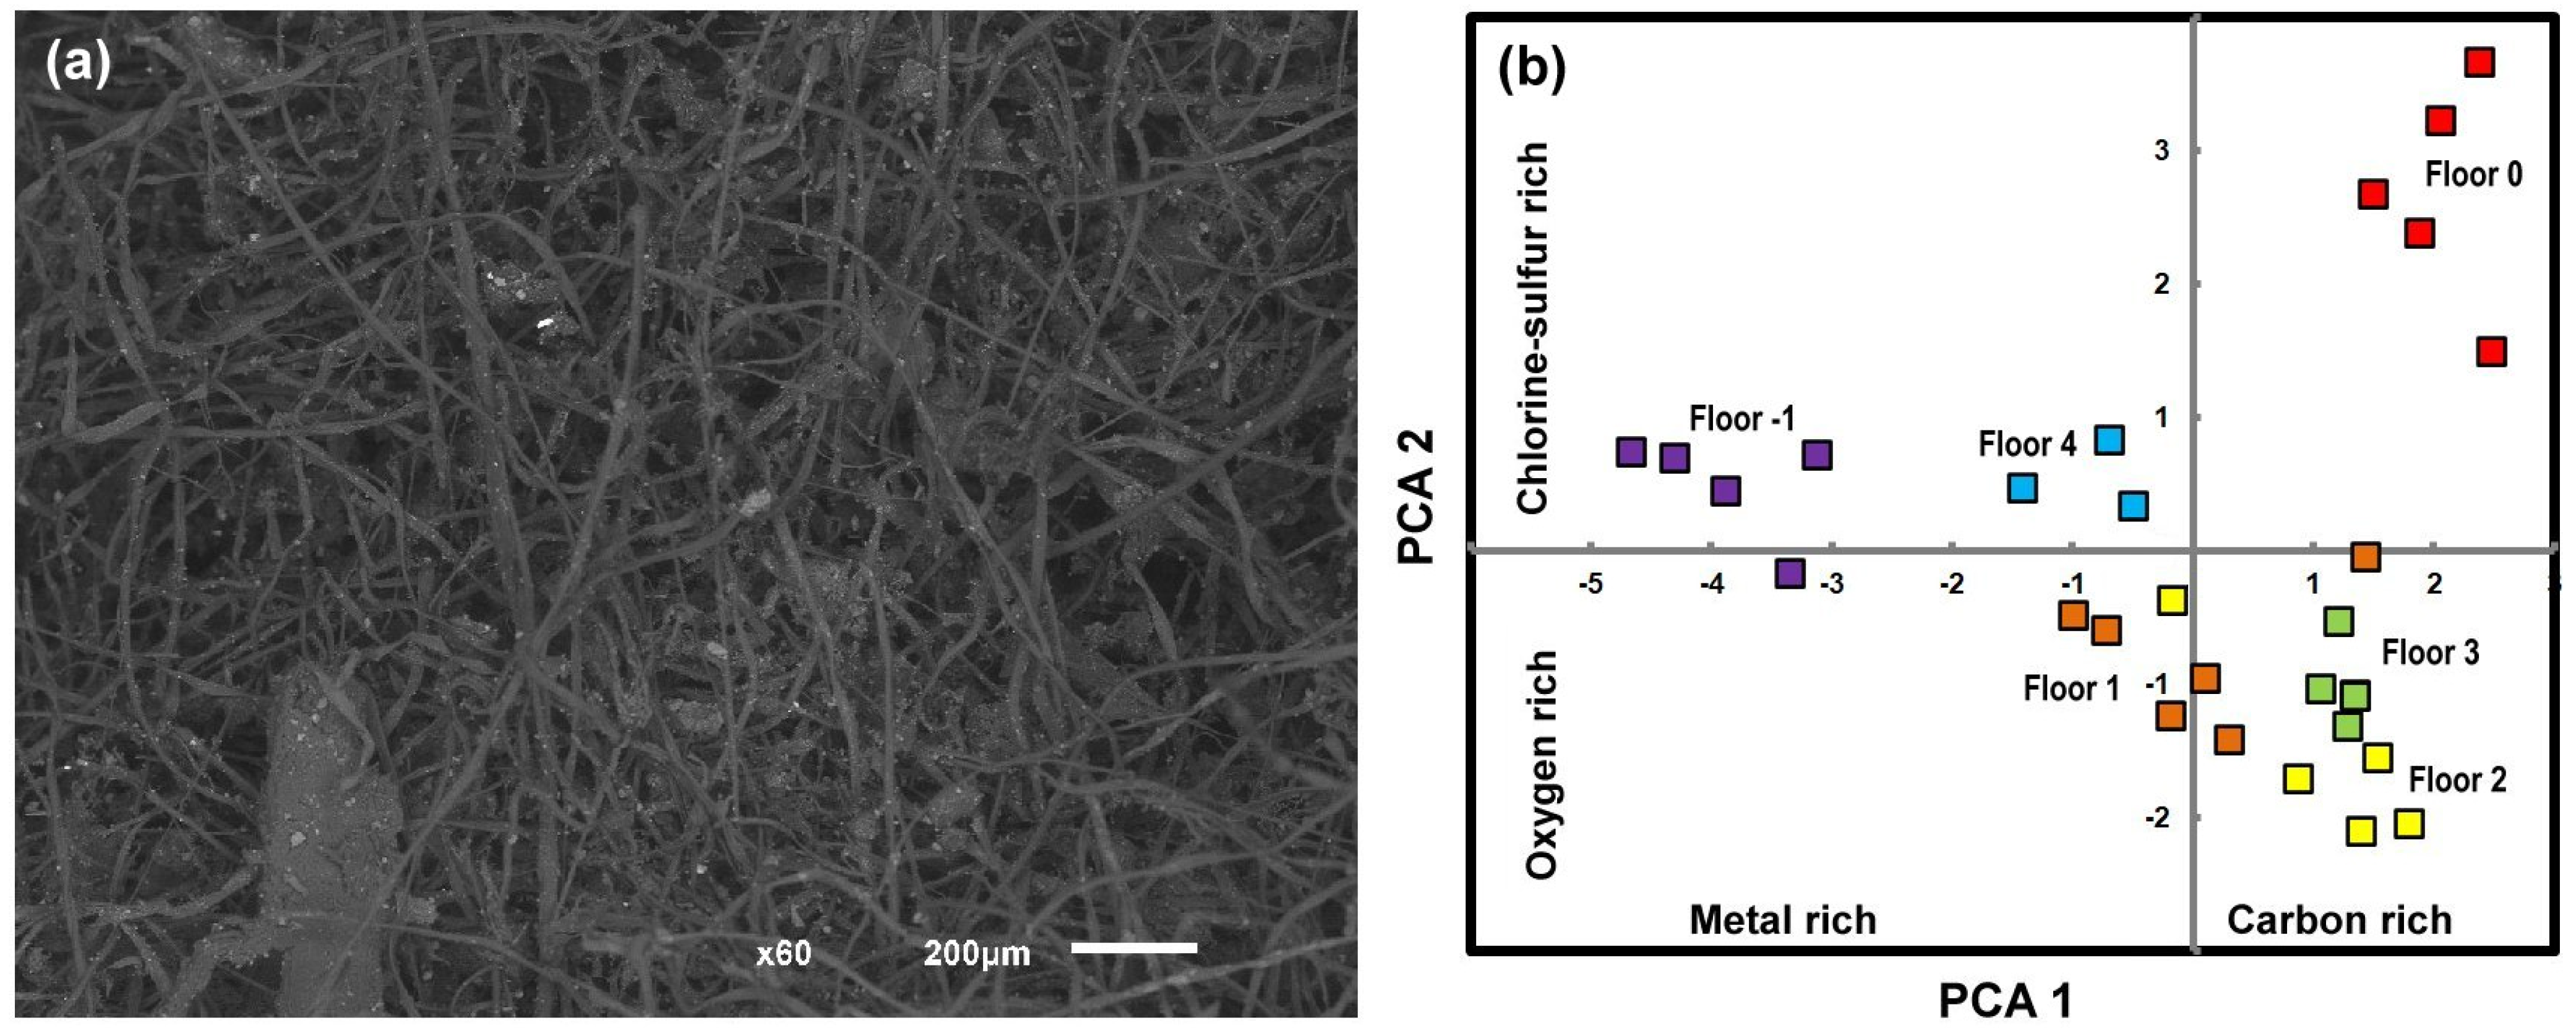
As organic-rich dust is a potential food source for many of the pest species, we photographed (via scanning electron microscopy) a subsample from each floor and analysed these for elemental composition. In Figure 7a, a typical dust sample (Floor 1) shows it to be mainly textile fibres. Few human hairs or insect parts were detected under the scanning electron microscope. In the analysis of elemental composition (see Figure 7b), we can see that the floors can be quite distinct, with the five sub-samples clustering together. Carbon, which dominates the samples, is likely to be from the fibres. The basement (violet) and the ground floor (red) are clearly differentiated from other floors and are rich in metallic elements, most notably calcium, probably from plaster. The ground floor (i.e., Floor 0) is high in chlorine and sulfur, possible sources being chloride and sulfate, which are road salts brought in by visitors.

3.6. Comparison of Pest DNA and Insect Monitoring

The conventional monitoring of insects, pests, and arthropods in the Natural History Museum revealed a diverse assemblage across all sampled locations, but many arthropods on the traps are not identified at the species level. Therefore, the species richness is much lower when compared to the trap analysis of the DNA. However, the pests are identified to the species level in the traps, allowing for a good comparison of the results of both methods: DNA analysis of dust and traps and monitoring.
A total of 1691 individual pest insects (19 different species, not counting the larvae or the booklice) were captured during the six-month study period (Table 4). The most dominant species in the traps were the webbing clothes moth Tineola bisselliella (542 individuals) and the brown carpet beetle Attagenus smirnovi (229), not including its larvae (the 116 Attagenus larvae were not identified, but belong to three undifferentiated species). Tineola bisselliella is the most abundant pest on the traps in the museum, but numbers vary over the years. This is also one of the most relevant pests for taxidermy objects, fur, and feathers, but they can also feed on dust and human hair. Further, Thylodrias contractus and Ctenolepisma calvum are trapped in high numbers. Plodia interpunctalla was found on Floors 1, 0, and −1. Monopis crocicapitella is a moth that was only trapped in the basement.
Out of the nine species of Dermestidae found in the DNA samples, Anthrenus verbasci, Attagenus smirnovi, Attagenus brunneus, Attagenus unicolor, Dermestes maculatus, Reesa vespulae, and Thylodrias contractus are also known from the insect monitoring. Dermestes lardarius, Dermestes cf. mustelinus, Trogoderma angustum and Trogoderma granarium, were not found in the traps. Anthrenus olgae and Anthrenus caucasicus occur in the museum in low numbers on the traps but were not detected in the DNA analysis (their DNA sequences/barcodes are missing in BOLD database).
Stegobium paniceum, Lasioderma serricorne, and Ptinus cf. sexpunctatus (all Ptinidae) were detected in the DNA samples and are also known from the monitoring. Few (1–2) Lasioderma serricorne are caught in the traps each year. Lasioderma serricorne and Stegobium paniceum both damage historic books (the museum has libraries with valuable and old books) and the herbaria collection. However, neither is present as an active infestation. Ptinus cf. sexpunctatus was identified in the DNA samples, and the monitoring collected. For Ptinus fur, we are not sure if there is a problem with the identification of the species within the database (both species are present in the BOLD database). The two species of wood-boring beetles, Gastrallus laevigatus, and Lyctus cavicollis found in the DNA have never been trapped in the museum.
Compared to the DNA analysis, where only three species of silverfish (Lepismatidae) were found, four species are known from the insect monitoring. The four-lined silverfish Ctenolepisma lineatum is found year to year—for example, in the mammal collection on Floor 3—and is easily identified with its longitudinal stripes. However, this species was not detected in the DNA in the dust or trap samples. The ghost silverfish Ctenolepisma calvum is the dominant silverfish species and is mainly found on the ground floor. Additionally, the grey silverfish Ctenolepisma longicaudatum is abundant, but it is almost only found in the basement. Lepisma saccharinum is found mainly in the basement and ground floor; further up, it is in very low numbers.
Booklice are mainly found on the traps in the basement; most other areas of the museum are too dry. Booklice species caught in the traps are not at present identified to the species level.

3.7. Non Arthropods Species Found in the DNA Samples

We found a few non-arthropod species in the DNA: Most of the DNA from mammals in the dust samples is human DNA, probably from hair and skin (Table 2). Besides Homo sapiens, other mammals were detected: Canis lupus (dog), Cricetus cricetus (European hamster), Apodemus sylvaticus (wood mouse), Bos sp. (probably cattle), Sus scrofa (wild boar), Cercopithecus neglectus (De Brazza’s monkey) and Capra aegagrus (wild goat). The canine DNA may come from staff pets, which are sometimes brought to the museum. The other materials are more likely to be environmental DNA from the collection. Interestingly the two abundant and common rodents in cities, the house mouse Mus musculus and rat Rattus norvegicus, were not detected in any of the samples, not even in the museum basement.
Avian DNA from species such as Columba livia (pigeon), Aquila heliaca (eastern imperial eagle), Gallus sp. (possible species: Gallus gallus; chicken), a falcon (Falco biarmicus, Falco cherrug or Falco rusticolus) and Corvus cornix (hooded crow) were also detected. The eastern imperial eagle DNA is probably from collection material. The falcon is found in cities, usually the common kestrel (Falco tinnunculus). Chicken might come from food, while the pigeon and the hooded crow might come from urban habitats and breeding areas outside the museum building.
The unexpected find of a Lumbricidae species (earthworm, Clitellata), a Polychaeta, Anguilla anguilla and Maurolicus sp. (both fish) and Emys orbicularis (a reptile), two species of Gastropoda (including Doto coronata) and Helgicirrha cari (Hydrozoa) are probably results of environmental contamination of DNA by these organisms. We are not sure how the DNA from the collection objects enters the dust or trap samples.

4. Discussion

The indoor biodiversity of arthropods found in this single museum is much higher than might be expected. Some of the pests identified threaten the collection in the NHM, which includes millions of taxidermy objects with feathers, fur, dried insects, or herbarium specimens. Over 359 species were found in this single building with a footprint of almost 12,000 m2 (including the thick walls). Comparisons with other indoor habitats in Vienna are not readily available. We assume that most natural or semi-natural habitats need a much higher sampling effort to collect this number of Arthropod species from a similar area. The original output of the DNA analysis resulted in an even higher diversity, but we decided to be more conservative and reduced the species list. The species not included when found in only very small amounts of DNA, and sometimes the identification was not to species or a genera level. In domestic interiors in the US, Madden et al. [16] found over 600 different genera in 700 homes where dust was collected by citizen scientists. They found home characteristics, including the presence of basements, home occupants, and surrounding land use, were the best parameters to predict arthropod diversity. In parallel, and also in the US, Bertone et al. [15] investigated with traditional sampling and morphological identification methods 50 homes and identified as many as 211 morphospecies per house. They also found many species of true flies (Diptera), spiders (Aranea), beetles (Coleoptera), and wasps (Hymenoptera). A large fraction of the arthropods found came from the surrounding landscape. Each building seemed unique, dependent on age, materials, past use, cleaning, and indoor climate. These results, in combination with our study, suggest a large proportion of the species seem to originate from the surrounding urban landscape. However, diversity was much higher in our study, probably because we sampled a very large and historic building and also used the new method of DNA analysis of dust and trap materials with identification to species level.
We are not sure why so many species were found in the attic, as the windows are closed here, and there is even cooling in the storage of the archive and herbaria collections. Compared to the attic, the basement had a low diversity in the dust: Here, few people work, no visitors come, and there are no open windows. Additionally, the dust seems different with high calcium concentrations and might not be so rich in organic material as food for museum pests.
Our results show that (i) a single building can have high diversity, (ii) the species richness and composition vary across the floors, (iii) many species are found on multiple floors, (iv) museum pests are found in high numbers, and (v) the species found suggested that they are a combination of externally derived individuals and those living permanently indoors. The significance of these results across multiple buildings needs to be investigated in the future. A weakness of this new method is that DNA analysis can’t give a timeline to the occurrence of pest species (as dust accumulates over long time periods) compared to trap monitoring, which seems most relevant to IPM.

4.1. Species in DNA Dust and Trapped Samples

The results from the DNA in the dust samples cannot determine whether the DNA arises from living individuals or old remnants. If dead animals or the DNA is not damaged by UV light or chemicals, it can stay present in cracks and other spaces in the building. We assume that we have a combination of mainly recently living animals and some that might be old material. The percentage of each cannot be determined. This problem might be solved, for example, with a Berlese-Tullgren extractor to collect only the living organisms (see [95] for a simple description). Soil ecologists have the same problem when analysing soil samples, as here it is also not clear whether the DNA is from living or dead animals. This is a disadvantage of analysing DNA samples, as we are mostly interested in living animals (both in soil ecology and also in our museum study). Some species are likely to enter the building through gaps, open doors, or windows: Harpalus rufipes is a common ground beetle that enters the building on lower floors in the summer. They come from external green spaces in search of prey. They can fly but usually walk while hunting. Further, Lasius sp. (ant), Musca domestica (cluster fly), Vespula germanica (wasp), Apis mellifera (bee), Culex modestus, Aedes sp. (both mosquitos), and Ectobius vittiventris (amber wood cockroach) regularly enter through open windows, especially in exhibition areas, so they are regularly trapped in the museum. The exhibition rooms are ventilated on a daily basis via open windows, so flying insects (e.g., cluster flies or mosquitoes) can enter the building this way. A further option is the passive dispersal of insects with wind and aerial currents [96,97,98] or the dispersal of spiders with ballooning [99]. How often these phenomena are taking place within cities is not well studied.
We also detected Opilio parietinus, a harvestman (Opiliones) species, which used to be widespread in Austria until the 1960s. It has not been found for many years [100,101,102], and was thought to be missing or extinct. Nevertheless, it was detected in the DNA samples, so it may represent a resident population on the walls of the museum. An investigation to search for adults was started and will confirm this finding with sequences of standard DNA barcodes of specimens vouchered in the scientific collection.
Some of the Diptera come from fruit (Drosophila spp.) and flower plants (Sciaridae) within the building; they are common pests and nuisance animals in fruit shops, homes, and offices. Their DNA might get aggregated by predators like spiders [103] or detritivores (e.g., carpet beetles), so it can spread through the building.
The large number of species detected in the DNA in the traps might result from a collection of living animals actively walking in the building in search of food and also prey, where the DNA was collected from the gut of the predators of the traps [104]. We are quite sure that both predators and prey are living organisms and originate both inside and outside the building. Most of these species are probably not reproducing in the museum.
The ghost silverfish Ctenolepisma calvum is mainly trapped as part of the monitoring on the ground floor, the four-lined silverfish Ctenolepisma lineatum on Floor 3 and the grey silverfish Ctenolepisma longicaudatum is found in larger numbers in the basement. Lepisma saccharinum is not very common in the building, probably due to the dry indoor climate. This group of insects (Lepismatidae) especially shows the dependence on data quality in BOLD and other DNA databases. We can only identify a species correctly with a DNA metabarcoding approach if (i) the species is present in the database and (ii) the higher proportion of specimens in the database is correctly identified. Especially for Lepismatidae the data seems very chaotic, with many falsely identified animals. This problem was also discussed in the recently published review by Molero-Baltanás et al. [105]. We know that four different species are found on the traps, and they can easily be separated with some identification training, but Ctenolepisma lineatum was not detected by the DNA samples. In the future, the databases need to be curated, with corrections of false identifications and the addition of correctly identified specimens. The group of Lepismatidae is especially relevant for museums, as they include important paper-damaging pests such as the grey silverfish Ctenolepisma longicaudatum, and two new species were introduced in the last years (see [106,107,108,109,110,111,112,113,114,115]). Also, cryptic species might add to this problem of false identification, as maybe some species are actually a group of species that cannot be morphologically separated [116].
Anthrenus olgae and Anthrenus caucasicus were not detected, and even though they are known from the museum, both are missing in the BOLD database. Also, the pest species Ptinus cf. sexpunctatus (or P. fur), Trogoderma granarium, Trogoderma angustum, and Dermestes cf. mustelinus were discovered in the DNA samples, but are not found in the museum traps, even though the Dermestidae are >15 mm and easily detected. This indicates that data quality in the databases might be problematic in Dermestidae, as already shown for Lepismatidae. Dermestes maculatus was found in the DNA samples, and with one individual in the monitoring, this is a unique species as the museum uses its larvae to skeletonise bones for the vertebrate collection. Thus, it was not surprising to find DNA from these beetles, which are kept in the ground floor taxidermy workshop (thousands of live animals, but they need a high temperature and cannot survive the museum climate for a long time). In the past, the species Dermestes ater was used for the same purpose but was not detected by our DNA metabarcoding approach. Also, Dermestes lardarius is known as a museum pest in Vienna and Austria but not in this museum. Other species often found in museums in Austria as Anthrenus museorum, Anthrenus fuscus, Attagenus pellio, Gibbium psylloides, Niptus hololeucus, Anobium punctatum, and Tinea pellionella were not found in the DNA samples but are present in BOLD ([91], see also [117,118,119,120,121]; a paper on the diversity of pests in Austrian museums is in preparation). Since DNA barcodes are present for all species, the reason for their absence has to be further studied.
Dermestidae (carpet beetles), Lepidoptera (moths), and Lepismatidae (silverfish) species are scavengers of dust, dead insects, skin cells, and human hair, readily available in large public buildings. Dead insects, such as Musca domestica and Harpalus rufipes contribute to the food availability for the larvae of Attagenus sp., Anthrenus sp., Reesa vespulae, and Thylodrias contractus. Booklice in the Natural History Museum (not identified to species level), but four species were present in the DNA dust: Ectopsocus californicus, Lachesilla pedicularia, Dorypteryx domestica and Dorypteryx longipennis. These species are all known from other heritage buildings [122,123].
Other arthropods (non-pests) live entirely indoors, so do not depend on outside populations. These include predators such as spiders (Arachnida) and centipedes (Chilopoda), or detritivores (e.g., millipedes [Diplopoda] and isopods [Isopoda]) that are frequently found in buildings and on sticky traps. Some species, while regularly trapped in buildings, were not detected via DNA: for example, Porcellio spinicornis, Cylindroiulus caeruleocinctus, Pollenia rudis, and Leptoglossus occidentalis are often found in buildings in Europe where they tend to hibernate.
The DNA of the house mouse Mus musculus or brown rat Rattus norvegicus was not detected in the samples. These species are known to enter the building from time to time, and in Vienna, these rodent pests are fairly common. We have no clear explanation for their absence, but probably not the right locations were sampled (vacuumed) in the basement, although their excrement, hair, or other remains can be found.
Overall, we were unable to find a clear relationship between the species richness of all arthropods and the species richness of the pests, nor did floor level, open windows, floor type, collection type, or human activity have any obvious influence on the diversity of the two groups. Many species are found on multiple floors, and many other species are rare. A possible explanation may be the low number of replicates. In an upcoming study, we will analyse the DNA of arthropods and pests in the dust of over 20 buildings; this will help us interpret these results.

4.2. Usefulness of DNA Samples

Collecting dust and analysing the DNA of arthropods and museum pests is a new sampling method for museum IPM. We show that a large number of species can be detected. Vacuuming dust samples in a museum is simple, and sending them to a laboratory for processing has also become cost-effective: about 170 Euros for a pooled bulk sample. The result is a list of species with a certain relation to their abundance or size of the individuals. Screening insect pest species in a museum with a pooled dust sample from one room, one floor, or the whole building could give initial insight (before monitoring) into the range of species present, with the number of reads giving rough information on abundance.
Many important pests could be identified. Compared to traditional monitoring with traps or visual inspection of objects, DNA sampling is less labour intensive. For the identification of insects, including pests, a good insect specimen, a good microscope, the correct identification keys, time, and an expert or trained scientist are needed. In most museum monitoring campaigns, only the insect pests that are relevant to the collection management are identified to the species level, and the other animals only to the group level. Correct identification of pests is essential to see if wood-boring pests, textile pests (e.g., moths), beetles, or paper-damaging insects such as silverfish are present. It also shows if new species are introduced. Often, preventive conservators are responsible for the task of monitoring and identification, and they might be trained in the identification of the most important museum pests, but rare and novel species easily get overlooked or misidentified. This new method could help with the identification of pests, but the database needs to be improved. As a second important result, we also get a better insight into the urban diversity of arthropods that live inside buildings.
It is worth considering the advantages and disadvantages of the technique:
  • Advantages of DNA analysis of dust samples
    • Cheap sampling method and requires just a few samples
    • Simple to collect, no specific training needed to take the samples
    • Not only pest species are identified to the species level but also a broad list of arthropods
  • Disadvantages of DNA analysis of dust samples:
    • Not sure if the animals found were alive or already long dead
    • Not sure how many individuals were collected
    • The number of reads gives only a rough estimate on species abundance
    • Get a long list of species, but many of them are not relevant to IPM
    • Reference database is incomplete; this is also true for many pest species.
    • Active infestations of objects mean visual inspection remains necessary
    • Hard to compare results over time (months, years)
    • Problem with contamination of non-target DNA

5. Conclusions

The coexistence of insects and their DNA in indoor dust presents a new area of research that spans the disciplines of entomology and molecular biology. As our understanding of the dynamics of these components in indoor environments grows, so does the potential for implementing targeted strategies for indoor environmental management and the preservation of cultural artefacts. While the existing literature provides valuable insights into the presence and dynamics of insects and DNA in indoor dust, there are notable gaps. These gaps represent opportunities for advancing our understanding of this complex ecological system and implementing targeted conservation strategies. In conclusion, exploring the intricate relationship between insects, DNA, fungi, and pests in dust within indoor environments, especially in cultural institutions, is essential for the development of effective conservation strategies.

Supplementary Materials

The following supporting information can be downloaded at https://www.mdpi.com/article/10.3390/d16080476/s1, Supplement Figures S1–S6: Communities of the most common arthropods in the dust and alcohol samples. Supplement Table S1: Species list of all 359 arthropods detected with the DNA samples (dust and traps).

Author Contributions

Conceptualization, P.Q., P.B. and N.S.; methodology, P.Q. and N.S.; formal analysis, P.Q. and P.B.; investigation, P.Q.; resources, P.Q.; writing—original draft preparation, P.Q. and P.B.; writing—review and editing, P.Q., P.B., N.S. and B.L.; visualisation, P.B. and P.Q.; project administration, P.Q.; funding acquisition, P.Q. All authors have read and agreed to the published version of the manuscript.

Funding

This research was funded by the Austrian Academy of Science, grant number: Heritage_2020-043_Modeling-Museum, and by the “Friends of the Natural History Museum”, Vienna.

Institutional Review Board Statement

Not applicable.

Informed Consent Statement

Not applicable.

Data Availability Statement

Data can be obtained from the authors for further analysis.

Conflicts of Interest

The authors declare no conflict of interest.

References

  1. Sattler, T.; Obrist, M.K.; Duelli, P.; Moretti, M. Urban arthropod communities: Added value or just a blend of surrounding biodiversity? Landsc. Urban Plan. 2011, 103, 347–361. [Google Scholar] [CrossRef]
  2. Urban, M.C.; Alberti, M.; De Meester, L.; Zhou, Y.; Verrelli, B.C.; Szulkin, M.; Schmidt, C.; Savage, A.M.; Roberts, P.; Rivkin, L.R.; et al. Interactions between climate change and urbanization will shape the future of biodiversity. Nat. Clim. Change 2024, 14, 436–447. [Google Scholar] [CrossRef]
  3. Turo, K.J.; Gardiner, M.M. The balancing act of urban conservation. Nat. Commun. 2020, 11, 3773. [Google Scholar] [CrossRef]
  4. McKinney, M.L. Effects of urbanization on species richness: A review of plants and animals. Urban Ecosyst. 2008, 11, 161–176. [Google Scholar] [CrossRef]
  5. Marzluff, J.M. Worldwide urbanization and its effects on birds. In Avian Ecology and Conservation in an Urbanizing World; Springer: Boston, MA, USA, 2001; pp. 19–47. [Google Scholar]
  6. Grimm, N.B.; Faeth, S.H.; Golubiewski, N.E.; Redman, C.L.; Wu, J.; Bai, X.; Briggs, J.M. Global Change and the Ecology of Cities. Science 2008, 319, 756–760. [Google Scholar] [CrossRef]
  7. Murray, M.H.; Sánchez, C.A.; Becker, D.J.; Byers, K.A.; Worsley-Tonks, K.E.L.; Craft, M.E. City sicker? A meta-analysis of wildlife health and urbanization. Front. Ecol. Environ. 2019, 17, 575–583. [Google Scholar] [CrossRef]
  8. Goddard, M.A.; Dougill, A.J.; Benton, T.G. Scaling up from gardens: Biodiversity conservation in urban environments. Trends Ecol. Evol. 2010, 25, 90–98. [Google Scholar] [CrossRef]
  9. Lepczyk, C.A.; Aronson, M.F.J.; Evans, K.L.; Goddard, M.A.; Lerman, S.B.; MacIvor, J.S. Biodiversity in the City: Fundamental Questions for Understanding the Ecology of Urban Green Spaces for Biodiversity Conservation. BioScience 2017, 67, 799–807. [Google Scholar] [CrossRef]
  10. Niemelä, J. Ecology and urban planning. Biodivers. Conserv. 1999, 8, 119–131. [Google Scholar] [CrossRef]
  11. Dunn, R. Never Home Alone—From Microbes to Millipedes, Camel Crickets, and Honeybees, the Natural History of Where We Live; Basic Books; Hachette Book Group: New York, NY, USA, 2018. [Google Scholar]
  12. Pernstich, A.; Krenn, H. (Eds.) Die Tierwelt des Botanischen Gartens der Universität Wien eine Oase Inmitten der Großstadt anläßlich des 250-jährigen Bestehens des Botanischen Gartens der Universität Wien (1754–2004); Institut für Angewandte Biologie und Umweltbildung Wien: Vienna, Austria, 2004. [Google Scholar]
  13. Dunn, R.R.; Burger, J.R.; Carlen, E.J.; Koltz, A.M.; Light, J.E.; Martin, R.A.; Munshi-South, J.; Nichols, L.M.; Vargo, E.L.; Yitbarek, S.; et al. A Theory of City Biogeography and the Origin of Urban Species. Front. Cons. Sci. 2022, 3, 761449. [Google Scholar] [CrossRef]
  14. Available online: https://en.wikipedia.org/wiki/Urban_ecology (accessed on 8 June 2024).
  15. Bertone, M.A.; Leong, M.; Bayless, K.M.; Malow, T.L.; Dunn, R.R.; Trautwein, M.D. Arthropods of the great indoors: Characterizing diversity inside urban and suburban homes. PeerJ 2016, 4, e1582. [Google Scholar] [CrossRef] [PubMed]
  16. Madden, A.A.; Barberán, A.; Bertone, M.A.; Menninger, H.L.; Dunn, R.R.; Fierer, N. The diversity of arthropods in homes across the United States as determined by environmental DNA analyses. Mol. Ecol. 2016, 25, 6214–6224. [Google Scholar] [CrossRef] [PubMed]
  17. Leong, M.; Bertone, M.A.; Bayless, K.M.; Dunn, R.R.; Trautwein, M.D. Exoskeletons and economics: Indoor arthropod diversity increases in affluent neighbourhoods. Biol. Lett. 2016, 12, 20160322. [Google Scholar] [CrossRef] [PubMed]
  18. Leong, M.; Bertone, M.A.; Savage, A.M.; Bayless, K.M.; Dunn, R.R.; Trautwein, M.D. The habitats humans provide: Factors affecting the diversity and composition of arthropods in houses. Sci. Rep. 2017, 7, 15347. [Google Scholar] [CrossRef] [PubMed]
  19. Robinson, W.H. Urban Insects and Arachnids—A Handbook of Urban Entomology; Cambridge University Press: Cambridge, UK, 2005. [Google Scholar] [CrossRef]
  20. Schoelitsz, B.; Meerburg, B.G.; Takken, W. Influence of the public’s perception, attitudes, and knowledge on the implementation of integrated pest management for household insect pests. Entomol. Exp. Appl. 2019, 167, 14–26. [Google Scholar] [CrossRef]
  21. Cranshaw, W. A review of nuisance invader household pests of the United States. Am. Entomol. 2011, 57, 165–169. [Google Scholar] [CrossRef]
  22. Rust, M.K.; Su, N.Y. Managing social insects of urban importance. Annu. Rev. Entomol. 2012, 57, 355–375. [Google Scholar] [CrossRef] [PubMed]
  23. Brokerhof, A.W.; Zanen, W.B.; Watering, K.; Porck, H. Buggy Biz, Integrated Pest Management in Collections; Netherlands Institute for Cultural Heritage (ICN) and IADA: Amsterdam, The Netherlands, 2007. [Google Scholar]
  24. Pinniger, D. Integrated Pest Management in Cultural Heritage; Archetype Publications: London, UK, 2015. [Google Scholar]
  25. Pinniger, D.; Lauder, D. Pests in Houses Great and Small: Identification, Prevention and Eradication; English Heritage: Swindon, UK, 2018. [Google Scholar]
  26. Querner, P. Insect pests and integrated pest management in museums, libraries and historic buildings. Insects 2015, 6, 595–607. [Google Scholar] [CrossRef] [PubMed]
  27. Trematerra, P.; Pinniger, D. Museum pests–cultural heritage pests. In Recent Advances in Stored Product Protection; Springer: Berlin/Heidelberg, Germany, 2018; pp. 229–260. [Google Scholar]
  28. Strang, T.; Jacobs, J.; Kigawa, R. Integrated pest management for museum collections. In Preventive Conservation: Collection Storage; Society for the Preservation of Natural History Collections: New York, NY, USA, 2019; pp. 375–406. [Google Scholar]
  29. Brimblecombe, P.; Querner, P. Investigating insect catch metrics from a large Austrian museum. J. Cult. Herit. 2024, 66, 375–383. [Google Scholar] [CrossRef]
  30. Brimblecombe, P. Predicting the changing insect threat in the UK heritage environment. J. Inst. Conserv. 2024, 47, 133–148. [Google Scholar] [CrossRef]
  31. Available online: www.wheateatingyourcollection (accessed on 8 June 2024).
  32. Querner, P. Linking webbing clothes moths to infested object or other food source in museums. Stud. Conserv. 2016, 61, 111–117. [Google Scholar] [CrossRef]
  33. Beltrame, T.N. A Matter of Dust, Powdery Fragments, and Insects. Object Temporalities Grounded in Social and Material Museum Life. Centaurus 2023, 65, 365–385. [Google Scholar] [CrossRef]
  34. Marcotte, S.; Estel, L.; Minchin, S.; Leboucher, S.; Le Meur, S. Monitoring of lead, arsenic and mercury in the indoor air and settled dust in the Natural History Museum of Rouen (France). Atmos. Pollut. Res. 2017, 8, 483–489. [Google Scholar] [CrossRef]
  35. Yoon, Y.H.; Brimblecombe, P. Contribution of dust at floor level to particle deposit within the Sainsbury Centre for Visual Arts. Stud. Conserv. 2000, 45, 127. [Google Scholar] [CrossRef]
  36. Butte, W.; Heinzow, B. Pollutants in house dust as indicators of indoor contamination. Rev. Environ. Contam. Toxicol. 2002, 175, 46. [Google Scholar]
  37. Craine, J.M.; Barberán, A.; Lynch, R.C.; Menninger, H.L.; Dunn, R.R.; Fierer, N. Molecular analysis of environmental plant DNA in house dust across the United States. Aerobiologia 2017, 33, 71–86. [Google Scholar] [CrossRef]
  38. Lennartz, C.; Kurucar, J.; Coppola, S.; Crager, J.; Bobrow, J.; Bortolin, L.; Comolli, J. Geographic source estimation using airborne plant environmental DNA in dust. Sci. Rep. 2021, 11, 16238. [Google Scholar] [CrossRef] [PubMed]
  39. Johnson, C.G.; Smith, D. Biodiversity and museum pest management. In Insect Biodiversity: Science and Society; John Wiley & Sons: Hoboken, NJ, USA, 2019; pp. 221–243. [Google Scholar]
  40. Querner, P.; Morelli, M. Nachweis von Museumsschädlingen in Schmutz. Restauro 2009, 2, 85. [Google Scholar]
  41. Arbes, S.J., Jr.; Cohn, R.D.; Yin, M.; Muilenberg, M.L.; Burge, H.A.; Friedman, W.; Zeldin, D.C. House dust mite allergen in US beds: Results from the First National Survey of Lead and Allergens in Housing. J. Allergy Clin. Immunol. 2003, 111, 408–414. [Google Scholar] [CrossRef]
  42. Gilbert, M.T. Documenting DNA in the dust. Mol. Ecol. 2017, 26, 969–971. [Google Scholar] [CrossRef]
  43. Barberán, A.; Dunn, R.R.; Reich, B.J.; Pacifici, K.; Laber, E.B.; Menninger, H.L.; Morton, J.M.; Henley, J.B.; Leff, J.W.; Miller, S.L.; et al. The ecology of microscopic life in household dust. Proc. R. Soc. B Biol. Sci. 2015, 282, 20151139. [Google Scholar] [CrossRef] [PubMed]
  44. Foster, N.R.; Martin, B.; Hoogewerff, J.; Aberle, M.G.; de Caritat, P.; Roffey, P.; Edwards, R.; Malik, A.; Thwaites, P.; Waycott, M.; et al. The utility of dust for forensic intelligence: Exploring collection methods and detection limits for environmental DNA, elemental and mineralogical analyses of dust samples. Forensic Sci. Int. 2023, 344, 111599. [Google Scholar] [CrossRef] [PubMed]
  45. Meiklejohn, K.A.; Scheible, M.K.R.; Boggs, L.M.; Dunn, R.R.; Ricke, D.O. Using Fast ID to analyze complex SNP mixtures from indoor dust. J. Forensic Sci. 2023, 68, 768–779. [Google Scholar] [CrossRef] [PubMed]
  46. Hebert, P.D.N.; Cywinska, A.; Ball, S.L.; DeWaard, J.R. Biological identifications through DNA barcodes. Proc. R. Soc. B Biol. Sci. 2003, 270, 313–321. [Google Scholar] [CrossRef] [PubMed]
  47. Ratnasingham, S.; Hebert, P.D. BOLD: The Barcode of Life Data System (http://www.barcodinglife.org). Mol. Ecol. Resour. 2007, 7, 355–364. [Google Scholar] [CrossRef] [PubMed]
  48. Oliverio, A.M.; Gan, H.; Wickings, K.; Fierer, N. A DNA metabarcoding approach to characterize soil arthropod communities. Soil Biol. Biochem. 2018, 125, 37–43. [Google Scholar] [CrossRef]
  49. Banerjee, P.; Dey, G.; Antognazza, C.M.; Kumar Sharma, R.; Maity, J.P.; Chan, M.W.Y.; Huang, Y.-H.; Lin, P.-Y.; Chao, H.-C.; Lu, C.-M.; et al. Reinforcement of Environmental DNA Based Methods (Sensu Stricto) in Biodiversity Monitoring and Conservation: A Review. Biology 2021, 10, 1223. [Google Scholar] [CrossRef] [PubMed]
  50. Roger, F.; Ghanavi, H.R.; Danielsson, N.; Wahlberg, N.; Löndahl, J.; Pettersson, L.B.; Andersson, G.K.S.; Olén, N.B.; Clough, Y. Airborne environmental DNA metabarcoding for the monitoring of terrestrial insects—A proof of concept from the field. Environ. DNA 2022, 4, 790–807. [Google Scholar] [CrossRef]
  51. Elbrecht, V.; Braukmann, T.W.A.; Ivanova, N.V.; Prosser, S.W.J.; Hajibabaei, M.; Wright, M.; Zakharov, E.V.; Hebert, P.D.N.; Steinke, D. Validation of COI metabarcoding primers for terrestrial arthropods. PeerJ 2019, 7, e7745. [Google Scholar] [CrossRef]
  52. Elbrecht, V.; Bourlat, S.J.; Hörren, T.; Lindner, A.; Mordente, A.; Noll, N.W.; Schäffler, L.; Sorg, M.; Zizka, V.M.A. Pooling size sorted Malaise trap fractions to maximize taxon recovery with metabarcoding. PeerJ 2021, 9, e12177. [Google Scholar] [CrossRef]
  53. Hospodsky, D.; Qian, J.; Nazaroff, W.W.; Yamamoto, N.; Bibby, K.; Rismani-Yazdi, H.; Peccia, J. Human occupancy as a source of indoor airborne bacteria. PLoS ONE 2014, 9, e103425. [Google Scholar] [CrossRef]
  54. Adams, R.I.; Bateman, A.C.; Bik, H.M.; Meadow, J.F. Microbiota of the indoor environment: A meta-analysis. Microbiome 2015, 3, 49. [Google Scholar] [CrossRef]
  55. Barberán, A.; Ladau, J.; Leff, J.W.; Pollard, K.S.; Menninger, H.L.; Dunn, R.R.; Fierer, N. Continental-scale distributions of dust-associated bacteria and fungi. Proc. Nat. Acad. Sci. USA 2015, 112, 5756–5761. [Google Scholar] [CrossRef]
  56. Linard, B.; CramptonPlatt, A.; Gillett, C.P.D.T.; Timmermans, M.J.T.N.; Vogler, A.P. Metagenome skimming of insect specimen pools: Potential for comparative genomics. Genome Biol. Evol. 2015, 7, 1474–1489. [Google Scholar] [CrossRef]
  57. Zhou, X.; Li, Y.; Liu, S.; Yang, Q.; Su, X.U.; Zhou, L.; Tang, M.; Fu, R.; Li, J.; Huang, Q. Ultra-deep sequencing enables high-fidelity recovery of biodiversity for bulk arthropod samples without PCR amplification. GigaScience 2013, 2, 4. [Google Scholar] [CrossRef]
  58. Elbrecht, V.; Lindner, A.; Manerus, L.; Steinke, D. A bright idea-metabarcoding arthropods from light fixtures. PeerJ 2021, 9, e11841. [Google Scholar] [CrossRef]
  59. Ritter, C.D.; Häggqvist, S.; Karlsson, D.; Sääksjärvi, I.E.; Muasya, A.M.; Nilsson, R.H.; Antonelli, A. Biodiversity assessments in the 21st century: The potential of insect traps to complement environmental samples for estimating eukaryotic and prokaryotic diversity using high-throughput DNA metabarcoding. Genome 2019, 62, 147–159. [Google Scholar] [CrossRef]
  60. Elbrecht, V.; Leese, F. Can DNA-based ecosystem assessments quantify species abundance? Testing primer bias and biomass—sequence relationships with an innovative metabarcoding protocol. PLoS ONE 2015, 10, e0130324. [Google Scholar] [CrossRef]
  61. Lynggard, C.; Nielsen, M.; Santos-Bay, L.; Gastauer, M.; Oliveira, G.; Bohmann, K. Vertebrate diversity revealed by metabarcoding of bulk arthropod samples from tropical forests. Environ. DNA 2019, 1, 329–341. [Google Scholar] [CrossRef]
  62. Sickel, W.Z.; Vera, M.A.; Scherges, A.; Bourlat, S.; Dieker, P. Abundance estimation with DNA metabarcoding—Recent advancements for terrestrial arthropods. Metabarcoding Metagenomics 2023, 7, e112290. [Google Scholar] [CrossRef]
  63. Clarke, L.J.; Soubrier, J.; Weyrich, L.S.; Cooper, A. Environmental metabarcodes for insects: In silico PCR reveals potential for taxonomic bias. Mol. Ecol. Resour. 2014, 14, 1160–1170. [Google Scholar] [CrossRef]
  64. Creedy, T.J.; Ng, W.S.; Vogler, A.P. Toward accurate species-level metabarcoding of arthropod communities from the tropical forest canopy. Ecol. Evol. 2019, 9, 3105–3116. [Google Scholar] [CrossRef] [PubMed]
  65. Krehenwinkel, H.; Fong, M.; Kennedy, S.; Huang, E.G.; Noriyuki, S.; Cayetano, L.; Gillespie, R. The effect of DNA degradation bias in passive sampling devices on metabarcoding studies of arthropod communities and their associated microbiota. PLoS ONE 2018, 13, e0189188. [Google Scholar] [CrossRef] [PubMed]
  66. Prosser, S.W.J.; de Waard, J.R.; Miller, S.E.; Hebert, P.D.N. DNA barcodes from century-old type specimens using next-generation sequencing. Mol. Ecol. Resour. 2016, 16, 487–497. [Google Scholar] [CrossRef] [PubMed]
  67. Ruppert, K.M.; Kline, R.J.; Rahman, M.S. Past, present, and future perspectives of environmental DNA (eDNA) metabarcoding: A systematic review in methods, monitoring, and applications of global eDNA. Glob. Ecol. Conserv. 2019, 17, e00547. [Google Scholar] [CrossRef]
  68. Steinke, D.; Braukmann, T.W.; Manerus, L.; Woodhouse, A.; Elbrecht, V. Effects of Malaise trap spacing on species richness and composition of terrestrial arthropod bulk samples. Metabarcoding Metagenomics 2021, 5, 43–50. [Google Scholar] [CrossRef]
  69. Steinke, D.; DeWaard, S.L.; Sones, J.E.; Ivanova, N.; Prosser, S.W.J.; Perez, K.; Braukmann, T.W.A.; Milton, M.; Zakharov, E.; DeWaard, J.R.; et al. Message in a Bottle-Metabarcoding enables biodiversity comparisons across ecoregions. GigaScience 2022, 11, giac040. [Google Scholar] [CrossRef]
  70. Meusnier, I.; Singer, G.A.C.; Landry, J.F.; Hickey, D.A.; Hebert, P.D.; Hajibabaei, M. A universal DNA mini-barcode for biodiversity analysis. BMC Genom. 2008, 9, 214. [Google Scholar] [CrossRef]
  71. Yu, D.W.; Ji, Y.; Emerson, B.C.; Wang, X.; Ye, C.; Yang, C.; Ding, Z. Biodiversity soup: Metabarcoding of arthropods for rapid biodiversity assessment and biomonitoring: Biodiversity soup. Methods Ecol. Evol. 2012, 3, 613–623. [Google Scholar] [CrossRef]
  72. Wang, C.; Abbar, S.; Pan, X.; Ranabhat, S.; Cooper, R. Diversity and prevalence of nuisance arthropods detected by sticky traps in apartments in New Jersey. J. Econ. Entomol. 2023, 4, 1317–1320. [Google Scholar] [CrossRef]
  73. Chua, P.Y.S.; Bourlat, S.J.; Ferguson, C.; Korlevic, P.; Zhao, L.; Ekrem, T.; Meier, R.; Lawniczak, M.K.N. Future of DNA-based insect monitoring. Trends Genet. 2023, 39, 531–544. [Google Scholar] [CrossRef]
  74. Cheolwoon, W.; Mohammad Imtiaj, U.B.; Donghyun, K.; Priyanka, K.; Seung-Kyung, L.; Ji, Y.P.; Ke, D.; Kiyoung, L.; Naomichi, Y. DNA metabarcoding-based study on bacteria and fungi associated with house dust mites (Dermatophagoides spp.) in settled house dust. Exp. Appl. Acarol. 2022, 88, 329–347. [Google Scholar]
  75. Sepúlveda, C.N.; Biebl, S.; Pöllath, N.; Seifert, S.; Weiss, M.; Weibulat, T.; Triebel, D. GBIF-Compliant Data Pipeline for the Management and Publication of a Global Taxonomic Reference List of Pests in Natural History Collections. Biodivers. Inf. Sci. Stand. 2023, 7, e112391. [Google Scholar] [CrossRef]
  76. Brimblecombe, P.; Querner, P. Webbing clothes moth catch and the management of heritage environments. Int. Biodeterior. Biodegrad. 2014, 96, 50–57. [Google Scholar] [CrossRef]
  77. Cox, P.; Pinniger, D. Biology, behaviour and environmentally sustainable control of Tineola bisselliella (Hummel) (Lepidoptera: Tineidae). J. Stored Prod. Res. 2007, 43, 2–32. [Google Scholar] [CrossRef]
  78. Querner, P.; Simon, S.; Morelli, M.; Fürenkranz, S. Insect pest management programs and results from their application in two large museum collections in Berlin and Vienna. Int. Biodeterior. Biodegrad. 2013, 84, 275–280. [Google Scholar] [CrossRef]
  79. Querner, P.; Sterflinger, K.; Piombino-Mascali, D.; Morrow, J.J.; Pospischil, R.; Piñar, G. Insect pests and Integrated Pest Management in the Capuchin Catacombs of Palermo, Italy. Int. Biodeterior. Biodegrad. 2018, 131, 107–114. [Google Scholar] [CrossRef]
  80. Brimblecombe, P.; Lankester, P. Long-term changes in climate and insect damage in historic houses. Stud. Conserv. 2013, 58, 13–22. [Google Scholar] [CrossRef]
  81. Brimblecombe, P.; Brimblecombe, C.T.; Thickett, D.; Lauder, D. Statistics of insect catch within historic properties. Herit. Sci. 2013, 1, 34. [Google Scholar] [CrossRef]
  82. Brimblecombe, P.; Brimblecombe, C.T. Trends in insect catch at historic properties. J. Cult. Herit. 2015, 16, 127–133. [Google Scholar] [CrossRef]
  83. Shimoda, M.; Honda, K. Insect reactions to light and its applications to pest management. Appl. Entomol. Zool. 2013, 48, 413–421. [Google Scholar] [CrossRef]
  84. Doxon, E.D.; Davis, C.A.; Fuhlendorf, S.D. Comparison of two methods for sampling invertebrates: Vacuum and sweep-net sampling. J. Field Ornithol. 2011, 82, 60–67. [Google Scholar] [CrossRef]
  85. Available online: https://biblio.naturalsciences.be/rbins-publications/abc-txa/abc-taxa-08/chapter-15.pdf (accessed on 8 June 2024).
  86. Hava, J. Beetles of the Family Dermestidae of the Czech and Slovak Republics; Zoological Keys; Academia: Prague, Czech Republic, 2021. [Google Scholar]
  87. Weidner, H.; Sellenschlo, U. Vorratsschädlinge und Hausungeziefer: Bestimmungstabellen für Mitteleuropa; Spektrum Akademischer Verlag: Heidelberg, Germany, 2010. [Google Scholar]
  88. Leray, M.; Yang, J.Y.; Meyer, C.P.; Mills, S.C.; Agudelo, N.; Ranwez, V.; Boehm, J.T.; Machida, R.J. A new versatile primer set targeting a short fragment of the mitochondrial COI region for metabarcoding metazoan diversity: Application for characterizing coral reef fish gut contents. Front Zool 2013, 10, 34. [Google Scholar] [CrossRef] [PubMed]
  89. Morinière, J.; de Araujo, B.C.; Lam, A.W.; Hausmann, A.; Balke, M.; Schmidt, S.; Hendrich, L.; Doczkal, D.; Fartmann, B.; Arvidsson, S.; et al. Species Identification in Malaise Trap Samples by DNA Barcoding Based on NGS Technologies and a Scoring Matrix. PLoS ONE 2016, 11, e0155497. [Google Scholar] [CrossRef] [PubMed]
  90. Available online: https://ftp.ncbi.nlm.nih.gov/blast/ (accessed on 8 June 2024).
  91. Available online: www.boldsystems.org (accessed on 8 June 2024).
  92. Porter, T.M.; Hajibabaei, M. Scaling up: A guide to high-throughput genomic approaches for biodiversity analysis. Mol. Ecol. 2018, 27, 313–338. [Google Scholar] [CrossRef] [PubMed]
  93. Available online: https://ftp.ncbi.nlm.nih.gov/pub/taxonomy/ (accessed on 8 June 2024).
  94. Uhler, J.; Redlich, S.; Zhang, J.; Hothorn, T.; Tobisch, C.; Ewald, J.; Thorn, S.; Seibold, S.; Mitesser, O.; Morinière, J.; et al. Relationship of insect biomass and richness with land use along a climate gradient. Nat. Commun. 2021, 12, 5946. [Google Scholar] [CrossRef] [PubMed]
  95. Available online: https://en.wikipedia.org/wiki/Berlese_funnel (accessed on 8 June 2024).
  96. Hardy, A.C.; Milne, P.S. Studies in the distribution of insects by aerial currents. J. Anim. Ecol. 1938, 7, 199–229. [Google Scholar] [CrossRef]
  97. Glick, P.A. The Distribution of Insects, Spiders and Mites in the Air; Technical Bulletin; U.S. Department of Agriculture: Washington DC, USA, 1939; Volume 673. [Google Scholar]
  98. Johnson, C.G. The distribution of insects in the air and the empirical relation of density to height. J. Anim. Ecol. 1957, 26, 479–494. [Google Scholar] [CrossRef]
  99. Bell, J.R.; Bohan, D.A.; Shaw, E.M.; Weyman, G.S. Ballooning dispersal using silk: World fauna, phylogenies, genetics and models. Bull. Entomol. Res. 2005, 95, 69–114. [Google Scholar] [CrossRef]
  100. Komposch, C. Rote Liste der Weberknechte (Opiliones) Österreichs. In Rote Listen Gefährdeter Tiere Österreichs. Checklisten, Gefährdungsanalysen, Handlungsbedarf; Zulka, P., Ed.; Grüne The Distribution of Insects, Spiders and Mites in the Air; Technical Bulletin Reihe des Lebensministeriums: Vienna, Austria, 2009; Volume 14/3, pp. 397–483. [Google Scholar]
  101. Martens, J. Die Tierwelt Deutschlands 64. Teil, Weberknechte, Opiliones; VEB Gustav Fischer Verlag: Jena, Germany, 1978; Volume 464. [Google Scholar]
  102. Martens, J. Vier Dekaden Weberknechtforschung. Arachnol. Mitteilungen 2021, 62, 35–60. [Google Scholar] [CrossRef]
  103. Pinol, J.; San Andres, V.; Clare, E.L.; Mir, G.; Symondson, W.O.C. A pragmatic approach to the analysis of diets of generalist predators: The use of next-generation sequencing with no blocking primers. Mol. Ecol. Resour. 2014, 14, 18–26. [Google Scholar] [CrossRef] [PubMed]
  104. Molero-Baltanás, R.; Mitchell, A.; Gaju-Ricart, M.; Robla, J. Worldwide revision of synanthropic silverfish (Insecta: Zygentoma: Lepismatidae) combining morphological and molecular data. J. Insect Sci. 2024, 24, 1. [Google Scholar] [CrossRef] [PubMed]
  105. Aak, A.; Hage, M.; Magerøy, Ø.; Byrkjeland, R.; Lindstedt, H.H.; Ottesen, P.; Rukke, B.A. Introduction, dispersal, establishment and societal impact of the long-tailed silverfish Ctenolepisma longicaudata (Escherich, 1905) in Norway. BioInvasions Rec. 2021, 10, 483–498. [Google Scholar] [CrossRef]
  106. Aak, A.; Rukke, B.A.; Ottesen, P.S. Long-Tailed Silverfish (Ctenolepisma longicadaudata)—Biology and Control; Norwegian Institute of Public Health Report; Norwegian Institute of Public Health: Oslo, Norway, 2019. [Google Scholar]
  107. Kulma, M.; Vrabec, V.; Patoka, J.; Rettich, F. The first established population of the invasive silverfish Ctenolepisma longicaudata (Escherich) in the Czech Republic. BioInvasions Rec. 2018, 7, 329–333. [Google Scholar] [CrossRef]
  108. Kulma, M.; Bubová, T.; Davies, M.P.; Boiocchi, F.; Patoka, J. Ctenolepisma longicaudatum Escherich (1905) Became a Common Pest in Europe: Case Studies from Czechia and the United Kingdom. Insects 2021, 12, 810. [Google Scholar] [CrossRef] [PubMed]
  109. Kulma, M.; Molero-Baltanás, R.; Petrtýl, M.; Patoka, J. Invasion of synanthropic silverfish continues: First established populations of Ctenolepisma calvum (Ritter, 1910) revealed in the Czech Republic. BioInvasions Rec. 2022, 11, 110–123. [Google Scholar] [CrossRef]
  110. Querner, P.; Szucsich, N.; Landsberger, B.; Erlacher, S.; Trebicki, L.; Grabowski, M.; Brimblecombe, P. Identification and spread of the Ghost Silverfish (Ctenolepisma calvum) among museums and homes in Europe. Insects 2022, 13, 855. [Google Scholar] [CrossRef]
  111. Brimblecombe, P.; Pachler, M.C.; Querner, P. Effect of Indoor Climate and Habitat Change on Museum Insects during COVID-19 Closures. Heritage 2021, 4, 3497–3506. [Google Scholar] [CrossRef]
  112. Brimblecombe, P.; Querner, P. Silverfish (Zygentoma) in Austrian Museums before and during COVID-19 lockdown. Int. Biodeterior. Biodegrad. 2021, 164, 105296. [Google Scholar] [CrossRef]
  113. Edgar, R.C.; Flyvbjerg, H. Error filtering, pair assembly and error correction for next-generation sequencing reads. Bioinformatics 2015, 31, 3476–3482. [Google Scholar] [CrossRef]
  114. Available online: https://quelestcetanimal-lagalerie.com/wp-content/uploads/2012/11/Family-Dermestidae-illustrated-key-to-British-species.pdf (accessed on 8 June 2024).
  115. Háva, J. Dermestidae. In Catalogue of Palaearctic Coleoptera, Volume 4. Elateroidea, Derodontoidea, Bostrichoidea, Lymexyloidea, Cleroidea and Cucujoidea; Löbl, I., Smetana, A., Eds.; Stenstrup Apollo Books: Stenstrup, Denmark, 2007; pp. 299–320. [Google Scholar]
  116. Tsvetanov, T.; Herrmann, A. First record of Attagenus smirnovi (Zhantiev, 1973) in Bulgaria (Insecta: Coleoptera: Dermestidae). ZooNotes 2022, 211, 1–4. [Google Scholar]
  117. Holloway, G.; Pinniger, D. Anthrenus species (Coleoptera; Dermestidae) found in UK museums with special reference to A. museorum Linnaeus, 1761, the museum beetle. J. Nat. Sci. Collect. 2020, 7, 68–71. [Google Scholar]
  118. Holloway, G.; Bakaloudis, D. Anthrenus flavipes LeConte, 1854 (Coleoptera; Dermestidae); a destructive pest of natural history specimens. J. Nat. Hist. Collect. 2021, 8, 39–43. [Google Scholar]
  119. Holloway, G. A review of the species of Anthrenus Geoffroy, 1762, (Coleoptera: Dermestidae) on the British list. Entomol. Mon. Mag. 2020, 156, 11–18. [Google Scholar] [CrossRef]
  120. Adams, R.G. Anthrenus olgae Kalik, new to Britain (Coleoptera: Dermestidae) with notes of separation from A. caucasicus Reitter. Entomol. Gaz. 1988, 39, 207–210. [Google Scholar]
  121. Querner, P. Thylodrias contractus Motschulsky, 1839, ein neuer Material- und Museumsschädling in Wien und Österreich. Beiträge Entomofaunist. 2018, 19, 127–132. [Google Scholar]
  122. Robinson, J.; Jackson, J.C.; Whiffin, A.L. Battling booklice in Scottish galleries, libraries, archives and museums. In Integrated Pest Management for Collections: Pest Odyssey 2021-The Next Generation; Ryder, S., Crossman, A., Eds.; Archetype Books: London, UK, 2022; pp. 210–213. [Google Scholar]
  123. New, T.R. Psocids: Psocoptera (Booklice and Barklice). In Handbooks for the Identification of British Insects; Royal Entomological Society: London, UK, 2005; pp. 68–69. [Google Scholar]
Figure 1. Aerial view of the Natural History Museum in Vienna, Austria. Aerial photo: NHM Wien © GeoPic.
Diversity 16 00476 g001
Figure 2. Collection of dust samples with a handheld vacuum cleaner (Makita). Photos PQ.
Diversity 16 00476 g002
Figure 3. Collection of the sticky blunder traps (left) and removal of insects and arthropods from the traps for a pooled trap sample for the DNA analysis (right).
Diversity 16 00476 g003
Figure 4. Absolute effective diversity from DNA in the dust and alcohol samples from traps on the floors of the museum. Note E is from the entomological rooms pooled from both Floors 3 and 4.
Diversity 16 00476 g004
Figure 5. Distribution of main taxonomic orders in the dust and trap samples in the DNA analysis before reducing the species list. Note E is from the entomological rooms of Floors 3 and 4.
Diversity 16 00476 g005
Figure 6. Correlation of the amount of DNA (log scale) in the dust for a given species present on both floors between different floors (not including the basement) with Kendall tau values.
Diversity 16 00476 g006
Figure 7. (a) Scanning electron micrograph of a typical dust sample from Floor 1. Photo PQ. (b) First two principal components of the composition of the dust samples across the floors.
Diversity 16 00476 g007
Table 1. Description of the six floors sampled across the Natural History Museum in Vienna, Austria; flooring, number of traps, visitor intensity, and potential access for insects from outside. Room perimeter: length of vacuumed floor along the wall. The Entomology collection is split into two floors (3 and 4). Areas with museum visitors are public spaces.
FloorDescriptionCollection Type
and Room Use
Dust Sample
in g
Perimeter
in m
Floor Area
in m2
Flooring
and Climate Control
Sticky Blunder TrapsPheromone
Traps
Museum
Visitors
Open Windows
4Attic,
modern
Archive, library, botany373111461Linoleum/
HVAC
9716NoNo
3historicMammal, library, botany1183762197Wood
only heating
15226NoPartly
2historicBird, library, exhibition1324392695Wood/
only heating
13558YesYes
1historicExhibition, offices1795103943Wood/
only heating
3635YesYes
0Ground floor,
historic
Library, taxidermy
studio, offices
86230592Wood/
only heating
3617NoNo
−1basement, historicTechnical rooms, storage, hallways1032002367Concrete/
no control
3535NoNo
4 + 3modern and historicEntomology43209865Linoleum/wood
only heating
12613NoNo
Table 2. Species richness (SR) of arthropods across the floors at the Natural History Museum in Vienna were collected with dust and alcohol extracts from trap samples. Species overlap represents the number of species common to both the dust and the alcohol extracts. The final column contains the percentage of human DNA in the dust samples across the floors.
FloorSR in Dust
(DNA)
Entropy-
Dust
SR in Trap
(DNA)
Entropy-
Traps
Species
Overlap
% of Human DNA in Dust
41662.731012.586520
31282.151482.448142
21292.521322.726149
11090.721622.265539
01242.541332.21695
−1581.741922.57351
Entomology612.30---62
Table 3. Species richness of pests across the floor at the Natural History Museum in Vienna collected with dust samples and alcohol extracts from traps (not including booklice).
FloorPest SR in
Dust DNA
Pests SR in
Trap DNA
Species
Overlap
Pest SR in
Monitoring
417151213
312141013
21215912
1111488
013151212
−1417410
entomology9--11
Table 4. Pest species (n = 19) collected on the traps 2023 across the floors at the Natural History Museum in Vienna (not including booklice).
Floor−101234Entomology
Tineola bisselliella502634227146311
Monopis crocicapitella7------
Plodia interpunctalla433---3
Anthrenus verbasci-91-745
Anthrenus olgae/caucasicus11-1341314
Anthrenus larvae2653142125
Attagenus smirnovi14393299-54
Attagenus unicolor/brunneus-4-114-25
Attagenus larvae1-71591258
Thylodrias contractus111011742-
Reesa vespulae22-122918
Dermestes maculatus-1-1--
Stegobium paniceum--2771510
Lasioderma serricorne-----11
Ptinus cf. sexpunctatus---112-
Lepisma saccharinum20124522-
Ctenolepisma longicaudatum741--12-
C. calvum1071-47519
C. lineatum--4161333
Total pest SR per floor:12131014151413
Disclaimer/Publisher’s Note: The statements, opinions and data contained in all publications are solely those of the individual author(s) and contributor(s) and not of MDPI and/or the editor(s). MDPI and/or the editor(s) disclaim responsibility for any injury to people or property resulting from any ideas, methods, instructions or products referred to in the content.