Article

DNA Barcoding for Species Identification of Moss-Dwelling Invertebrates: Performance of Nanopore Sequencing and Coverage in Reference Database

Institute of Biology, University of Graz, Universitätsplatz 2, 8010 Graz, Austria
*
Author to whom correspondence should be addressed.
Diversity 2024, 16(4), 196; https://doi.org/10.3390/d16040196
Submission received: 13 February 2024 / Revised: 20 March 2024 / Accepted: 22 March 2024 / Published: 25 March 2024
(This article belongs to the Special Issue DNA Barcodes for Evolution and Biodiversity—2nd Edition)

Abstract

:
In view of the current biodiversity crisis and our need to preserve and improve ecosystem functioning, efficient means for characterizing and monitoring biodiversity are required. DNA barcoding, especially when coupled with new sequencing technologies, is a promising method that can, in principle, also be employed by taxonomic lay people. In this study we compare the performance of DNA barcoding by means of a third-generation sequencing technology, nanopore sequencing with classical Sanger sequencing, based on a sample of invertebrates collected from moss pads in a bog in Austria. We find that our nanopore sequencing pipeline generates DNA barcodes that are at least as good as barcodes generated with Sanger sequencing, with the MinION producing better results than the Flongle flowcell. We further find that while many arthropod taxa are well covered in the international reference DNA barcode database BOLD, this clearly is not the case for important taxa like mites and springtails, which hampers large-scale biodiversity assessments. Based on examples from our study we further highlight which factors might be responsible for ambiguous species identification based on BOLD and how this can, at least partly, be solved.

1. Introduction

To date, taxonomists have described >1.7 million species, which, however, is only a minor portion of the predicted total number of species on Earth [1]. Invertebrates constitute a major part of our planet’s biodiversity. As such, they are crucial for ecosystem functioning and influence ecosystem services important to mankind both in positive and negative ways [2,3]. Therefore, there is an increasing interest in and need for monitoring the presence/absence and abundance of certain indicator species or entire species communities [4,5,6,7]. Yet, with the infamous taxonomic impediment [8] and its main consequence, the taxonomic gap (the discrepancy between the true species diversity and our knowledge of it; [9]), assessing whole species communities via traditional morphological taxonomy is virtually impossible for most ecosystems. In addition, morphological analyses of diverse mixed samples covering a broad taxonomic spectrum quickly become very time-consuming and require a multitude of taxonomic specialists. Moreover, the presence of cryptic diversity, i.e., phenotypically invariant but genetically clearly distinct species (e.g., [10,11,12,13,14,15]), inevitably leads to biased estimates of the actual biodiversity.
The advent of DNA barcoding, a standardized method for the identification of organisms based on specific sequences of their DNA [16], and the establishment of reference DNA barcode databases like the global database BOLD (www.boldsystems.org) have revolutionized biodiversity research. Now, it becomes feasible even for taxonomic laymen to assign unknown specimens or parts of specimens to species based on their DNA barcodes. Identification success, however, strongly depends on the quality and completeness of the reference data. Even though there has been a tremendous increase in reference DNA barcode data available in BOLD in the last few years, species coverage is far from complete for most taxa and most parts of the world. Indeed, the number of DNA barcodes available in BOLD differs a lot among countries and does not reflect the distribution of biodiversity across our planet [17].
Currently, Sanger sequencing [18,19], which amplifies and sequences individual samples, is (still) regarded as the gold standard for DNA barcoding. It is considered a highly accurate method but is time-consuming and thus also expensive for larger sample sizes [20], which makes it unfeasible in large-scale biodiversity assessment/monitoring activities.
The first two decades of this century have seen huge developments in so-called next-generation sequencing technologies, allowing simultaneous sequencing of a large number of short fragments quickly. With these second-generation sequencing methods, the field of metabarcoding, the barcoding of pooled samples, either from bulk samples or from environmental DNA (eDNA), was opened [21,22]. However, even though (e)DNA-metabarcoding has clearly revolutionized biodiversity assessment, facilitating the rapid assessment of entire species communities in a cost-efficient way, the method does not come without shortcomings. Primer efficiency differs among taxa, such that, in bulk samples, some of them are preferentially amplified, depending on the number and position of mismatches between primer and template, while other taxa might not be amplified at all [23,24]. Thus, some taxa might go undetected when employing metabarcoding. While significant steps forward have been made in using (e)DNA-metabarcoding data for inferring species abundance and/or biomass [25,26,27], this approach still requires preliminary investigations to determine species- and context-specific factors that influence the relationship between read counts and species abundance/biomass [27], especially in multi-species communities affected by differences in primer efficiency [28].
More recently, third-generation sequencing technologies have become available, facilitating the sequencing of longer reads, thus overcoming another limitation of second-generation sequencing approaches, while still yielding amounts of data sufficient to allow for multiplexing of hundreds to thousands of samples. Among the currently available third-generation sequencing technologies, Oxford Nanopore Technologies’ (ONT) nanopore sequencing technology, especially the MinION and Flongle systems, is particularly attractive for biodiversity monitoring and assessment. These systems are relatively low-cost, portable devices that deliver real-time sequencing [29]. They also require much less hands-on time per sample than Sanger sequencing, particularly when projects scale to thousands of samples. While for nanopore sequencing cost per individual base pair is still comparatively high compared to second-generation sequencing technologies, it is considerably lower than for standard Sanger sequencing, especially for large sample sizes [19]. Furthermore, the latest releases of nanopore sequencing chemistry, flowcells and basecalling models promise to improve sequencing accuracy, which was perhaps considered the largest drawback of nanopore sequencing compared to Sanger and second-generation sequencing [30]. In addition, a range of software solutions have been developed specifically for the correction of nanopore amplicon reads in the context of DNA barcoding (NGSpeciesID [31], ONTbarcoder [32], Amplicon-sorter [33]). While nanopore sequencing can be used for metabarcoding [34,35,36], its real strength for biodiversity assessment and monitoring is its potential for rapid and cost-effective individual-based sequencing of DNA barcodes (or multiple markers), which not only provides presence/absence data but also reliable information on the abundance of individual species. Current protocols allow for the generation of DNA barcodes for up to 10,000 specimens in a single MinION run [32]. Thus, with increased automatization and optimization of the few steps involved from specimen sorting to actual sequencing, nanopore barcoding has great potential for becoming a standard tool for basic and applied biodiversity research.
In the present study, which was conducted in the frame of a student course on wetland restoration, we aimed at showing the potential and problems associated with nanopore sequencing for biodiversity assessment and monitoring, with a particular focus on the invertebrate fauna of mosses. Specifically, we assessed (1) whether the quality of DNA barcodes differed between nanopore sequencing (using both Oxford Nanopore Technologies’ MinION and Flongle systems) and traditional Sanger sequencing and (2) to what extent the barcoded taxa were covered by the available reference data in BOLD, enabling reliable species identification. Furthermore, we discuss our findings in a broader context, i.e., with respect to current metabarcoding strategies employed for biodiversity research.

2. Materials and Methods

2.1. Sampling and DNA Extraction

We collected seven moss pads (~15 × 15 cm; five species: Sphagnum capillifolium, S. palustre, S. nemoreum, Lemobryum glaucum, and Pleurocium schreberi) from a peat moss lawn in a bog in the Natura 2000 area Gamperlacke, near Liezen, Austria (47.554° N, 14.283° E) on 13 June 2022 under the permit ABT13-198250/2020-9 issued by the provincial government of Styria. From these moss pads, 88 invertebrate specimens were collected in the field by shaking the moss above a white plastic foil. Individual invertebrate specimens were immediately put in 2 mL Eppendorf tubes with >99% ethanol. We did not try to identify the specimens to species level, as we wanted to simulate an approach in which species identification is purely based on available reference data, as propagated for efficient monitoring of biodiversity based on DNA data (individual barcoding, (e)DNA-metabarcoding). Whole genomic DNA was extracted from either single legs or other body parts (for larger specimens) or whole specimens (smaller specimens) using a rapid Chelex approach [37].
The samples were PCR-amplified for different sequencing approaches: nanopore sequencing using both the MinION and Flongle systems and the traditional Sanger sequencing.

2.2. Nanopore Sequencing

To prepare the samples for nanopore sequencing, we used the PCR primers LCO1490 and HCO2198 [38]. This primer pair is considered the standard barcoding primer pair for many animal taxa with high amplification success in invertebrates [39,40,41,42,43]. The primers for each individual sample were tagged with index sequences on both the forward and reverse primer (in our case a selection of the tags from [44]; Table S1). Later, during demultiplexing of nanopore sequencing reads, these indices allow for unambiguous sample assignment.
The PCR cocktail per sample contained 6.15 µL ddH2O, 1.00 µL of 10x buffer (incl. 15 mM MgCl2; BioTherm, Cologne, Germany), 0.5 µL MgCl2 (50 mM; biotechrabbit, Berlin, Germany), 0.35 µL dNTP mix (10 µM; biotechrabbit), 0.35 µL primer LCO1490 (10 µM), 0.35 µL primer HCO2198 (10 µM), 0.3 µL TAQ polymerase (5 U/µL; BioTherm), and 1.5 µL of DNA extract. The PCR cycling conditions were an initial denaturation at 94 °C (3 min), followed by 45 cycles of denaturation at 94 °C (30 s), annealing at 48 °C (35 s), and extension at 72 °C (1 min), with a final extension at 72 °C (7 min). A subset of the PCR products was run on a 2% agarose gel to ensure that the PCR was successful.
We pooled 2 µL of each of the 88 PCR products into a single 1.5 µL Eppendorf tube. This pool was then cleaned up with AMPure XP magnetic beads (Beckman Coulter, Brea, CA, USA) and the final concentration was measured with a Qubit 4 Fluorometer using the Qubit dsDNA HS Assay Kit (Invitrogen by Thermo Fisher Scientific, Waltham, MA, USA). Two sequencing libraries were prepared using the Oxford Nanopore Ligation Sequencing kit versions SQK-LSK109 and SQK-LSK112, following the official protocols and sequenced on Flongle (R9.4.1; FLO-FLG001) and MinION flowcells (R10.4; FLO-MIN112), respectively. The Flongle flowcell was new and the sequencing run was set to terminate automatically after 48 h. The MinION flowcell had already run for 48 h and was washed using the ONT washkit (EXP-WSH004; Oxford Nanopore Technologies, Oxford, UK) before loading the library. An initial flowcell check revealed approx. 100 available pores. Sequencing was terminated after 16 h and 20 min, since the run had already generated three times the total number of reads obtained by the Flongle flowcell and less than 10 pores remained active at this time.

2.3. Basecalling of ONT Reads

Raw ONT data (fast5 format) were basecalled using guppy_basecaller of Guppy version 6.4.2 with a quality threshold of five (--min_qscore 5). Different basecalling models were specified according to the particular flowcell version and basecalling accuracy desired for our study via the basecalling model config file shipping with guppy: (1) Flongle, high accuracy: --config dna_r9.4.1_450bps_hac.cfg, (2) Flongle, super high accuracy: --config dna_r9.4.1_450bps_sup.cfg; MinION, high accuracy: --config dna_r10.4_e8.1_hac.cfg; MinION, super high accuracy: --config dna_r10.4_e8.1_sup.cfg.

2.4. Demultiplexing and Generating Consensus Barcodes

For demultiplexing of nanopore sequencing data and generating individual consensus barcodes we used ONTbarcoder [32], employing the default settings. We opted to use ONTbarcoder as it is specifically designed for analyzing protein-coding genes. To investigate barcode recovery efficiency, we analyzed raw reads generated with different basecalling methods (guppy high accuracy (hac) vs. guppy super high accuracy (shac)) and ONT technologies (Flongle vs. MinION flowcell).
To test whether more input data increase the number of recovered barcodes, we performed two additional ONTbarcoder runs with the combined reads from the Flongle and the MinION flowcell.
Additionally, we wanted to test whether the basecalled reads from the MinION flowcell are inherently better than the reads generated with the Flongle. Therefore, we ran ONTbarcoder two additional times with the first 50,000 reads from the MinION flowcell, i.e., comparable sequencing depth to that obtained from the Flongle flowcell, basecalled with hac and shac. For downstream analysis we only used consensus barcode sequences from shac basecalled data with up to five ambiguous bases.

2.5. Sanger Sequencing

To generate Sanger sequencing data for the same samples, PCR amplification followed the protocol mentioned above, but using untagged PCR primers. Again, a subset of the PCR products was run on a 2% agarose gel to ensure that the PCR was successful. Clean-up of PCR products was carried out using ExoSAP-IT (ThermoFisher Scientific) by adding 1.0 µL of ddH2O and 0.7 µL of ExoSAP-IT to the PCR product. The mixture was incubated at 37 °C (45 min) to degrade remaining primers and nucleotides before the enzymes were inactivated at 80 °C (15 min). Bidirectional chain termination sequencing used 5.7 µL of ddH2O, 2.0 µL of 5× Sequencing Buffer (ThermoFisher Scientific), 0.4 µL of primer, 0.3 µL BigDye (Thermo Fisher Scientific), and 2 µL of purified PCR product. The run conditions were an initial denaturation at 94 °C (3 min) followed by 35 cycles of denaturation at 94 °C (30 s), annealing at 50 °C (30 s), and extension at 60 °C (3 min), followed by a final extension at 60 °C for 7 min. DNA fragments were purified with Sephadex G-50 (Amersham Biosciences, Amersham, UK) following the manufacturer’s instructions and visualized on an ABI 3500xl Genetic Analyzer (ThermoFisher Scientific). Trace files/sequences were checked, edited, and aligned in MEGA11 [45] by a single experienced person.

2.6. Comparison among Sequencing Methods and Reference Database Coverage

Barcodes obtained via different approaches (MinION, Flongle, Sanger sequencing) were compared in MEGA11. Initially, we inferred a neighbor-joining tree (based on uncorrected p-distances and complete deletion of gaps/missing data, as we wanted to infer the effect of estimated errors in the nanopore barcodes) including all Sanger sequencing data and all shac replicates (for reasons, see Results section) from different nanopore sequencing runs. We then checked positions that differed between nanopore and Sanger sequencing data in the electropherograms obtained by Sanger sequencing and checked the number of ambiguous bases and estimated gaps in the MinION and Flongle barcodes (as reported as quality criterion by ONTbarcoder).
Lastly, we blasted our final barcodes against barcoding data available in BOLD (www.boldsystems.org; accessed on 11 March 2024) and, if there was no match in BOLD, GenBank (https://www.ncbi.nlm.nih.gov/genbank/; accessed on 11 March 2024), to assess whether, as would be the case in a usual biodiversity monitoring/assessment situation, the available reference data would allow for a reliable species assignment. In addition, a neighbor-joining tree, based on K2P distances [46], which is the standard model of evolution used in DNA barcoding studies, was inferred in MEGA11 with one barcode sequence per sample. In cases where barcodes differed in quality between sequencing approaches the sequence with the fewest ambiguous bases was used.

3. Results

3.1. Comparison of Sequencing Approaches

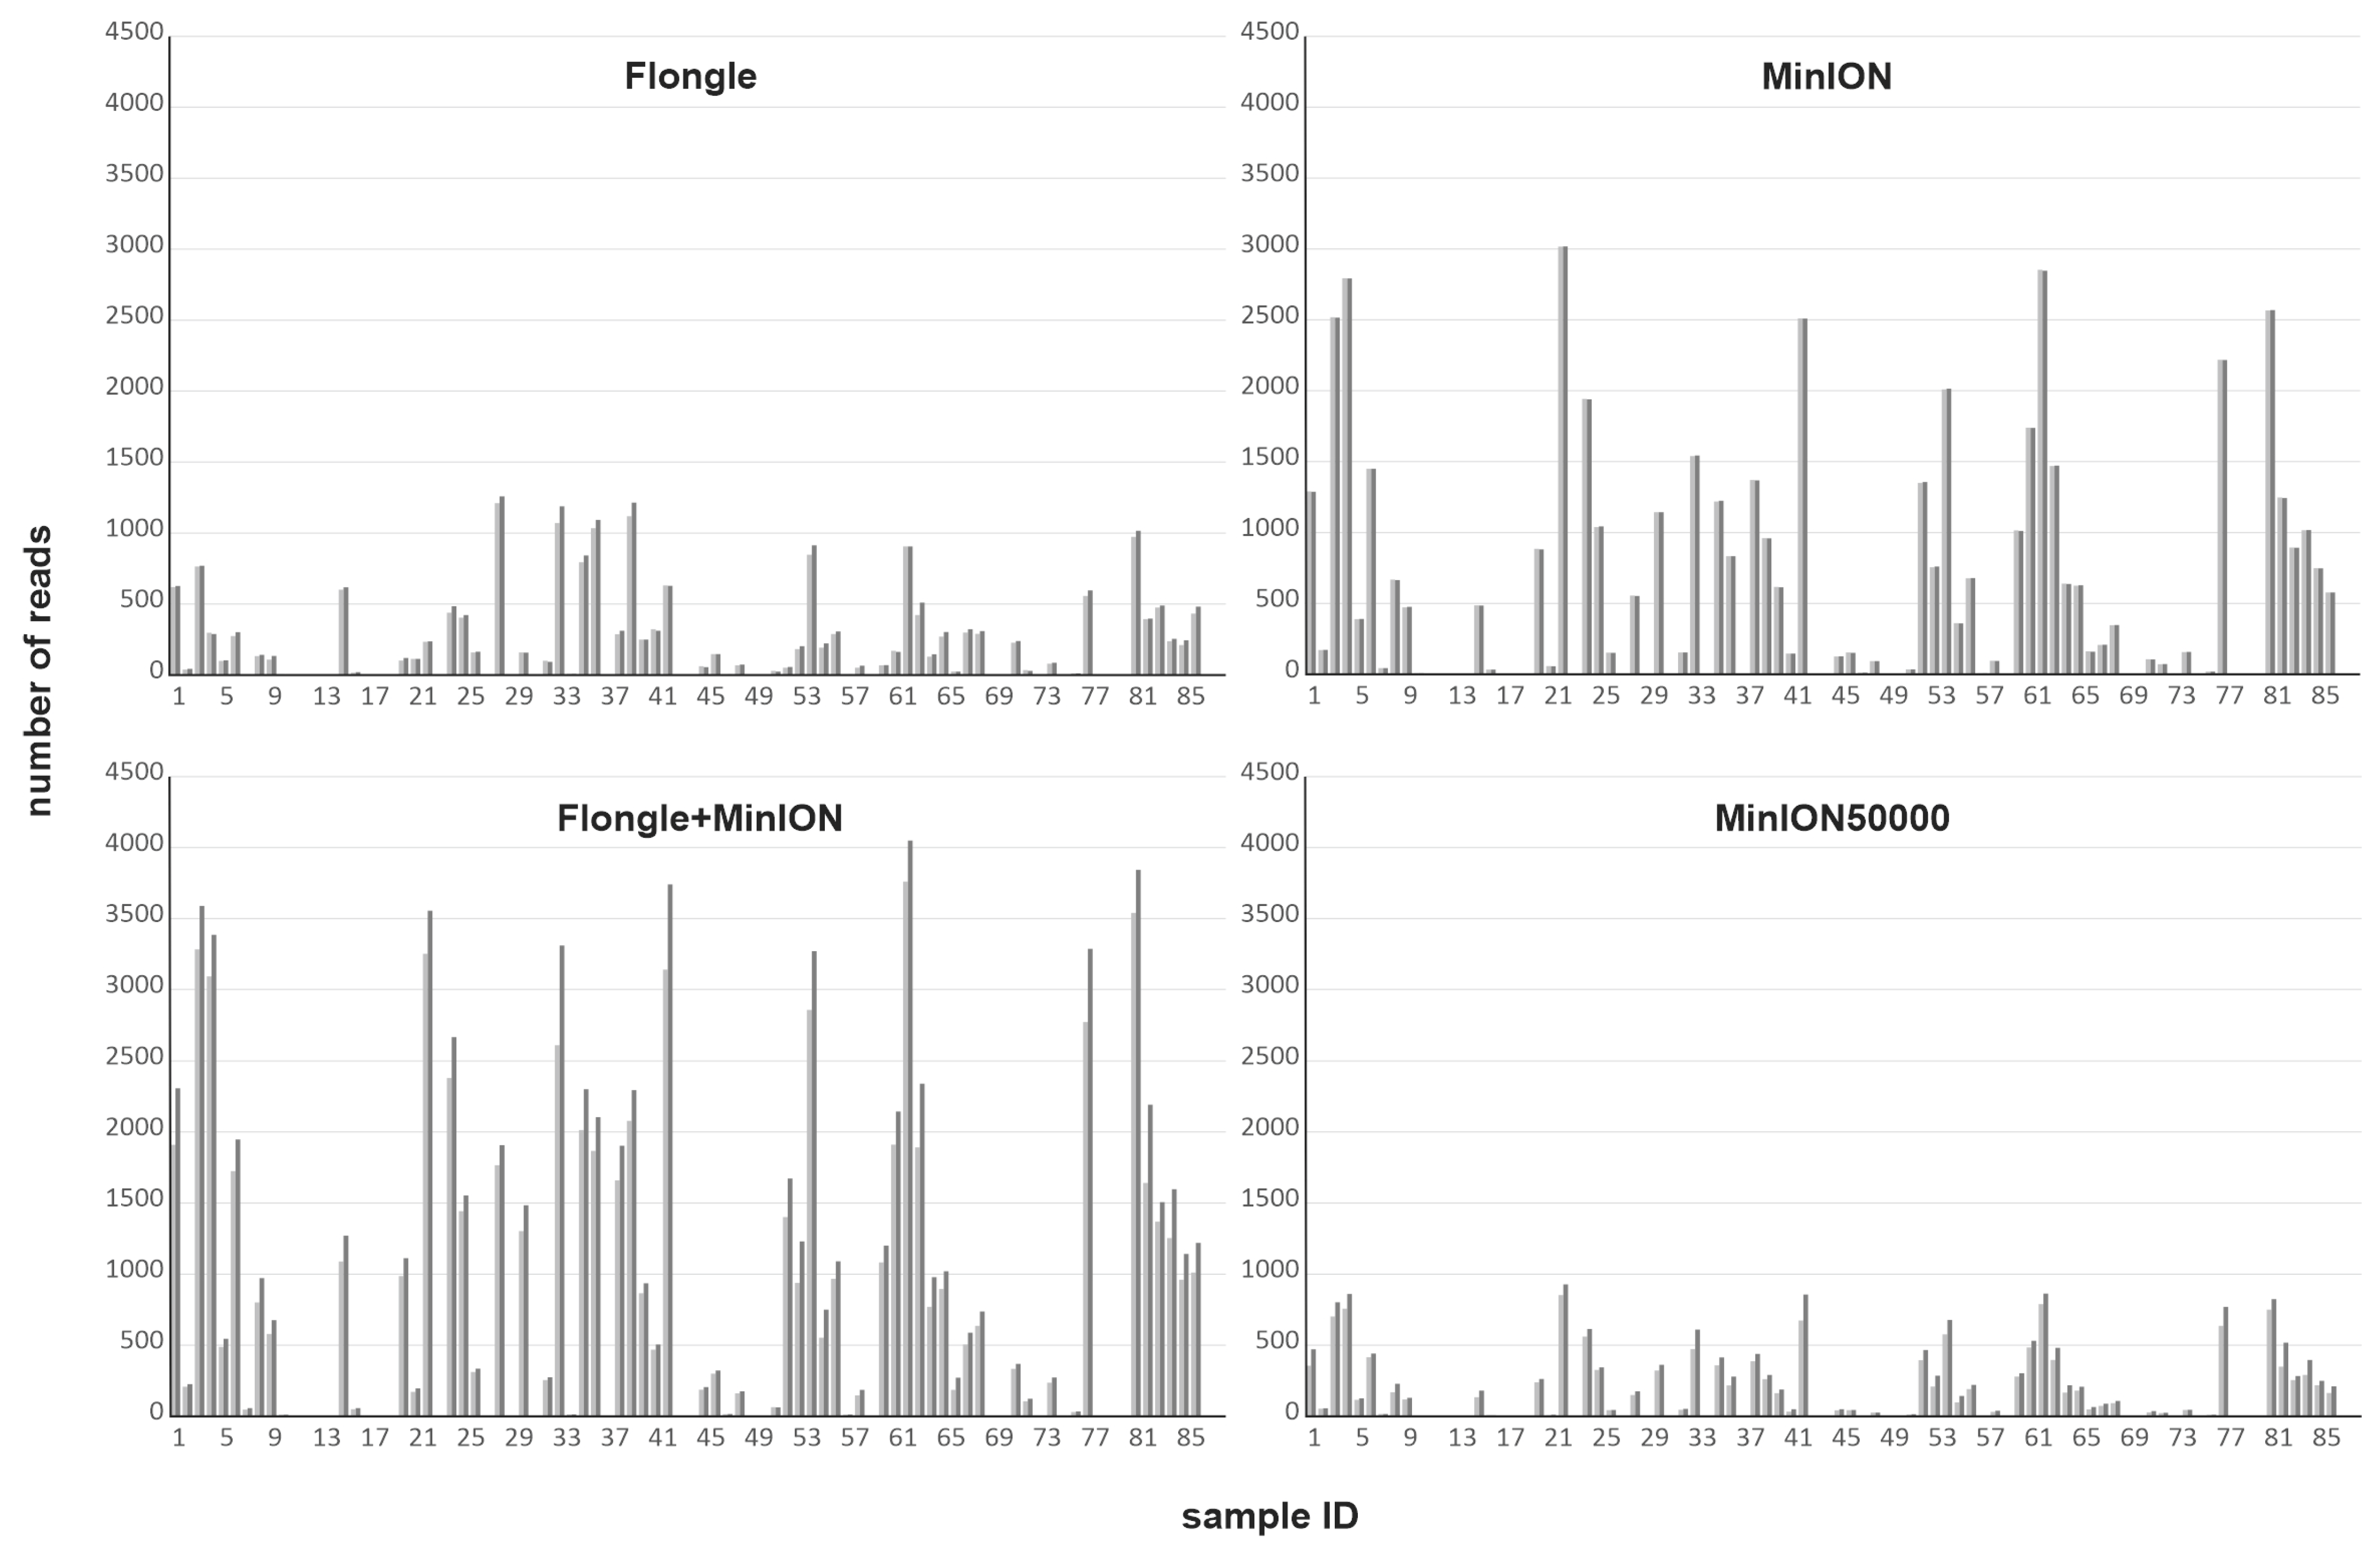
3.1.1. Different Nanopore Sequencing Approaches

Irrespective of the basecalling algorithm used (hac vs. shac), the Flongle flowcell generated ~60,000 reads and the MinION flowcell ~180,000 reads (Table 1). After filtering, roughly two thirds of these reads were used for demultiplexing. The individual number of reads per sample for further downstream analysis in ONTbarcoder ranged from 7 to 4050 (Figure 1). For most samples, more usable reads were recovered by the shac than the hac basecalling algorithm (Figure 1, Table 1). Depending on the sequencing method (Flongle, MinION, combined Flongle+MinION) and basecalling approach (hac and shac), the number of recovered barcodes differed only slightly (Table 1). Among the various nanopore sequencing and basecalling approaches tested, the lowest number of barcodes (N = 57) was obtained with the Flongle run with hac basecalling and the largest number of barcodes (N = 60) was recovered with the MinION run and shac basecalling. While most of these barcodes were QC compliant for the MinION runs and the Flongle+MinION combination, this number was much lower for the Flongle barcodes; most of the non-QC-compliant barcodes had one to five errors. Interestingly, the MinION50000 run resulted in a much higher number of QC-compliant barcodes than the Flongle run, despite a comparable number of reads (Table 1). In general, shac basecalling produced (slightly) more high-quality barcodes than the less computationally intensive hac basecalling algorithm (Table 1). The number of ambiguities and errors generally decreased with increasing read numbers, but, for MinION data, most consensus barcodes based on >11 individual reads were free of both ambiguities and errors. Flongle data also yielded some ambiguities and errors for some samples with larger read numbers (Figures S1 and S2).

3.1.2. Nanopore vs. Sanger Sequencing

The final number of barcodes generated with Sanger sequencing (N = 63) was higher than for any of the nanopore sequencing approaches. The number of QC-compliant barcodes, however, was much lower and comparable with the results obtained with the Flongle flowcell (Table 1). In addition, a few of the barcodes generated by Sanger sequencing had to be trimmed to a shorter size because of ambiguous bases/background noise at the start/end of the individual sequences (see alignment in Data S1). Most QC-compliant Flongle, MinION, and combined Flongle+MinION shac barcodes were identical to Sanger-generated barcodes (Figure S3). In two cases (samples 2 and 62) the Flongle barcode differed from MinION, combined Flongle+MinION, and Sanger barcode by 1 bp. In five cases (samples 6, 10, 24, 40, and 71) the Sanger barcode differed by 1 bp from the barcodes generated by the other approaches. Indeed, upon further scrutiny, it turned out that, even though the automatically basecalled Sanger data had been checked by eye by an experienced person, wrong bases were scored/missed (Figure S4). In one case (sample 4), the Flongle barcodes did not cluster with the corresponding MinION and combined Flongle+MinION barcodes (no Sanger sequence could be obtained for this sample) but rather with the barcodes of another sample (sample 6; Figure S3). The reason for this is unclear as the index primers used for these two samples are quite different (Table S1) such that an accidental assignment of individual reads to the wrong sample, due to the comparatively high inherent error rate of nanopore sequencing [47], is highly unlikely.

3.2. Coverage in BOLD

For 17 of the 88 samples, none of the different sequencing approaches produced a DNA barcode. Of the remaining samples, 46 had matches in BOLD (similarity > 97%). Some of these samples could not be assigned to a single species by BOLD but rather to a set of species that required further scrutiny (Table S2). For 25 samples, BOLD (and GenBank) found no species-level matches at all. For one of these (sample 26) the best hit in BOLD was Arthropoda (84.13% similarity) but in GenBank the consensus sequences had significant matches to Arthropoda only across a part of its total length with the remainder of the sequence matching to completely different organisms (sponges, fungi) with comparable similarity. Given that the ONT consensus sequences contained ambiguities (Table S2) and Sanger sequencing for this sample was unsuccessful, we consider the consensus a spurious, potentially chimeric sequence which we omitted from further analyses. Two samples (samples 41 and 67) could be assigned to the dipluran family Campodeidae. Seven samples, belonging to five molecular taxonomic units (MOTUs), could be assigned to three mite orders and two families. Sixteen samples forming five MOTUs were clearly entomobryomorph Collembola, but could only be reliably identified to family level (Table S2, Figure 2).

4. Discussion

In this study we compared the performance of DNA barcoding via nanopore sequencing using Flongle and MinION flowcells with traditional DNA barcoding based on Sanger sequencing. We found that nanopore sequencing followed by barcode calling using ONTbarcoder produces high-quality barcodes. When Sanger barcodes and QC-compliant nanopore barcodes differed, this was usually due to erroneous basecalls or ambiguities in the Sanger sequences. Thus, our results are in line with previous studies that assessed the potential of nanopore sequencing for DNA barcoding, demonstrating that nanopore sequencing is a viable alternative for generating high-quality barcoding data [20,32,44]. Even though the automatically basecalled Sanger data had been checked and edited by an experienced person (without knowledge about the corresponding nanopore barcodes), some obviously wrongly called bases were overlooked. Thus, while we strongly encourage checking Sanger data prior to using them for further downstream analyses and uploading to BOLD instead of simply using automatically basecalled data, this procedure is clearly not totally fail-proof and some errors are to be expected, especially when working with large datasets. The alternative pipeline we used (nanopore sequencing followed by barcode calling in ONTbarcoder) excludes the possibility of such errors, yielding QC-compliant barcodes that are at least as good as the corresponding Sanger barcodes. In addition, nanopore sequencing is a considerably cheaper and more time-efficient alternative for larger DNA barcoding projects. Indeed, a recent study showed that barcoding with Flongle or MinION flowcells is more cost-efficient than Sanger sequencing already with 61 or 180 samples, respectively [20].
In our study, the number of high-quality barcodes recovered from Flongle runs was lower than for MinION runs and comparable to Sanger sequencing. A similar pattern has been observed previously (e.g., [20]). Probably, this difference in performance between Flongle and MinION can be attributed to the particular flowcell versions and basecalling models used. At the time of writing this article both Flongle and MinION flowcells are available for the latest V14 chemistry and current versions appear to produce more barcodes with higher quality [48]. However, as the newest versions of ONT flowcells and sequencing chemistry became available only very recently, many labs might still have data generated using older versions. Our findings show that already these data can yield results which are at least as reliable as DNA barcodes generated by Sanger sequencing.
Though shac basecalling produced slightly more QC-compliant barcodes than the faster hac algorithm, hac basecalling produces barcodes that are well suited for assignment to particular MOTUs. The shac model is more likely to produce reference-quality barcodes but the runtime of the basecalling algorithm is considerably longer than for hac unless GPU resources are available. It is noteworthy, however, that for most samples already the hac model produced QC-compliant barcodes. Currently, Sanger barcodes are still considered the gold standard in DNA barcoding and quality criteria of BOLD are still only available for barcodes generated via Sanger sequencing. Considering that now high-quality barcodes can also be generated by means of nanopore sequencing in a time- and cost-efficient way, equivalent standards are also urgently needed for nanopore sequencing data.
Probably not surprisingly, we found that some taxa were well covered in BOLD whereas for others no reference data were available. Spiders, chilopods, and most insects could be identified to species level, i.e., close matches were found in BOLD. For springtails and mites, this, however, was the exception and only a few samples could be identified to species level, highlighting the urgent need for additional reference data for these taxa. Even carrying out a BLAST search on GenBank did not help much in these cases, as, for these samples, identification was only possible to genus or family level and sometimes to order level. Springtails and mites are among the major functional groups in soil. Thus, accurate species identification is critical for our understanding of ecosystem functioning. Not only is a general lack of reference DNA barcodes hampering species assignment in these taxa but also high levels of cryptic diversity. There is increasing evidence that the species diversity in these taxa is considerably higher than generally assumed. For example, DNA barcoding of mites from a large number of sites across Canada revealed that the number of MOTUs was 2.4 times the number of species previously recorded for Canada [49]. Similar large-scale studies on mites or other soil invertebrates are lacking from other geographic regions, but it is likely that the same pattern holds true also for other regions and will be even more extreme in largely understudied parts of the world. On a more local scale and/or focused on particular taxa within springtails and mites, recent studies have indeed provided increasing evidence for high levels of cryptic diversity (springtails: [50,51,52]; mites: e.g., [10,11,13]). While for some questions in basic and applied research exact species identification might not be necessary and MOTUs might be used as species proxies instead, proper molecular species identification does not only allow for comparisons across DNA barcode-based studies but also for comparisons with other, often older, studies that employed traditional morphological species identification. Currently, much emphasis is put on safeguarding and monitoring biodiversity in various environments, including soil, to mitigate biodiversity loss with its negative impact on ecosystem services. Thus, the EU Soil Strategy for 2030, which contributes to the goals of the EU Green Deal and is part of the EU’s Biodiversity Strategy, proposes specific actions related to climate change mitigation, circular economy, biodiversity, desertification, soil restoration and monitoring, and citizen engagement for the maintenance of or transition to healthy soils [53]. The accurate characterization of biodiversity is the paramount foundation for some of these actions. Large-scale characterization and monitoring of soil biodiversity are virtually impossible based on traditional morphological methods and thus have to rely on DNA-based approaches. For these to work, however, cryptic species complexes need to be resolved by employing integrative taxonomic approaches (e.g., [54]) and reference (DNA barcode) data at least for the major functional groups need to be available.
In BOLD, sequences are ideally assigned to a single BIN, which is a MOTU inferred based on BOLD’s molecular species delimitation algorithm [55] that in most cases closely corresponds to biological species. In some cases, however, even when there is a match in BOLD, exact species assignment is not that straightforward. This is usually due to BIN sharing, a consequence of recent species divergence, introgression, or misidentification of specimens used for generating reference DNA barcode data. Misidentification of some reference specimens in BOLD prevented the straightforward identification of our Lithobius (Chilopoda) samples (Table S2). Among the best matches for one of the two Lithobius MOTUs in our dataset were mostly L. tenebrosus but also an alleged L. nodulipes. Similarly, the second Lithobius MOTU matched L. agilis but also a single L. pelidnus. Indeed, these L. nodulipes and L. pelidnus in BOLD seem to have been misidentified as the vast majority of L. nodulipes and L. pelidnus in BOLD cluster in different, species-specific BINs (BOLD:ACT7891 and BOLD:AAV8113, respectively). Other cases of BIN sharing in our dataset can be attributed to recent divergence. Two MOTUs of myrmycine ant species matched BINs in BOLD with four and three species, respectively. The first one includes Myrmica aloba, M. sabuleti, M. scabrinodis, and M. spinosior, with M. aloba and M. spinosior not occurring in Austria but in southwestern Europe, M. sabuleti being present in Central Europe and inhabiting predominantly xerothermic dry and semidry meadows, and M. scabrinodis also occurring in Central Europe with a clear preference for open peat moss lawns in bogs [56]. Consequently, we conclude that M. scabrinodis is the species we found in our moss samples. The second case includes Lasius niger, L. platythorax, and L. psammophilus. All three species do occur in Central Europe, but L. psammophilus has a clear preference for sandy habitats [57] and thus is very unlikely to be the species found in our study. Of the remaining two species, L. niger is very common and found in a variety of (mostly dry and warm) habitats whereas L. platythorax is a rarer species that mainly occurs in habitats not inhabited by the former species, such as colder and moister forests and bogs [57]. Even though it is likely that the species we sequenced is L. platythorax we cannot exclude the possibility that it is actually L. niger. Also, for the sample finally identified as the aphid Pemphigus populivenae, BOLD yielded an inconclusive result based on mere sequence similarity. Employing the standard 97% similarity threshold, a species-level match could not be made by BOLD and the following potential species were suggested: Pemphigus groenlandicus, P. monophagus, P. populiglobuli, P. populivenae, and P. sp. D. However, although these species are closely related and diverged only recently, tree-based clustering in BOLD clearly placed our sample in a clade with P. populivenae, well apart from the other species (Figure S5). Some samples were assigned to a single species in BOLD even though % similarity to the best match was <99%. Specifically, this concerned samples 51 and 82, which were assigned to the crane fly Tipula melanoceros and the cobweb spider Robertus lividus with similarities of 98.92% and 97.32%, respectively. While it is indeed possible that species assignment was correct, potential cryptic diversity or incomplete taxonomic coverage of closely related species in BOLD has to be considered as well. These cases show that the species identification suggested by BOLD should not be accepted without further scrutiny and that considering the species’ distribution and biology is essential to further narrow down the range of candidate species in instances where there are several species sharing a BIN.
For 17 out of the 88 samples, no barcodes could be generated, neither with the nanopore nor the Sanger sequencing approach. The reasons therefore could be that DNA extraction failed or that primers did not bind because of an excess of substitutions in the primer-binding region. A complete failure of DNA extraction for all these samples, however, seems unlikely. On the other hand, it is well known that the commonly used standard barcoding primers LCO1490 and HCO2198 [38] do not work for all arthropods such that alternative primers have been developed for a range of taxa (e.g., [58,59,60]). In metabarcoding approaches, i.e., the barcoding of pooled samples, species that fail to amplify will go undetected and result in a biased species diversity estimate. In addition, amplification bias also impacts relative abundance estimates of taxa in metabarcoding studies. Using individual-based nanopore sequencing instead of typical metabarcoding circumvents the problems associated with amplification bias. Samples that fail to be amplified with standard primers can be repeated with a different primer pair and since sequence data are linked to each individual, abundance estimates are possible. Though clearly more expensive and time-consuming than a typical metabarcoding study, individual-based nanopore sequencing is much more cost- and time-efficient, and, as we and other studies have shown, less error prone than classic Sanger sequencing. Thus, nanopore sequencing is a viable option for efficient biodiversity assessment, especially when inferring the entire diversity and (relative) abundances is particularly important.
To conclude, our study shows that (i) nanopore sequencing produces DNA barcodes that are at least as good as barcodes generated via classical Sanger sequencing, (ii) taxonomic coverage of mites and springtails in BOLD is poor, allowing only for limited inferences regarding actual species identity in these taxa, and (iii) molecular species identification by BOLD requires further scrutiny to sort out potential misidentification of voucher material in BOLD and resolve cases of BIN sharing. Thus, current nanopore sequencing pipelines are clearly a viable cost- and time-efficient alternative for generating high-quality DNA barcode data and might also be useful for efficient biodiversity monitoring when it is crucial that all species are identified or when (relative) abundance estimates are required.

Supplementary Materials

The following supporting information can be downloaded at: https://www.mdpi.com/article/10.3390/d16040196/s1, Data S1: Full alignment, including shac basecalled Flongle and MinION data plus Sanger sequences, used for inferring the neighbor-joining tree in Figure S3; Figure S1: Relationship between number of ambiguities and number of reads per sample, depending on nanopore sequencing approach; Figure S2: Relationship between number of mismatches and number of reads per sample, depending on nanopore sequencing approach; Figure S3: Neighbor-joining tree of Sanger-sequenced barcodes and all shac-basecalled barcodes from Flongle, MinION, and combined Flongle+MinION runs; Figure S4: Inconsistencies between QC-compliant nanopore sequences and Sanger sequences; Figure S5: Assignment of sample 30 to Pemphigus populivenae using the tree-based assignment in BOLD; Table S1: Index sequences (for nanopore sequencing) and PCR primers used for each individual sequencing; Table S2: Taxonomic assignment of shac-basecalled Flongle and MinION barcodes and barcodes generated via Sanger sequencing.

Author Contributions

Conceptualization, S.K. and C.H.; methodology, N.K., H.B. and L.Z.; formal analysis, S.K., P.R., N.K. and C.H.; writing—original draft preparation, S.K.; writing—review and editing, P.R., L.Z. and C.H.; visualization, S.K.; project administration, S.K. All authors have read and agreed to the published version of the manuscript.

Funding

This research received no external funding. Open Access Funding by the University of Graz.

Institutional Review Board Statement

Not applicable.

Data Availability Statement

The basecalled reads from Flongle and MinION runs have been deposited in NCBI’s Sequence Read Archive (SRA) under accessions SRR28388871, SRR28388872, SRR28388874, and SRR2838887 (BioProject No. PRJNA1088450, BioSample SAMN40470669). The alignment used for inferring the neighbor-joining tree in Figure S3, including Sanger-sequenced barcodes and all shac-basecalled barcodes from Flongle, MinION, and combined Flongle+MinION runs, is available in Data S1.

Conflicts of Interest

The authors declare no conflicts of interest. The funder had no role in the design of the study, in the collection, analyses, or interpretation of data, in the writing of the manuscript, or in the decision to publish the results.

References

  1. Vernooy, R.; Haribabu, E.; Muller, M.R.; Vogel, J.H.; Hebert, P.D.N.; Schindel, D.E.; Shimura, J.; Singer, G.A.C. Barcoding life to conserve biological diversity: Beyond the taxonomic imperative. PLoS Biol. 2010, 8, e1000417. [Google Scholar] [CrossRef]
  2. Prather, C.M.; Pelini, S.L.; Laws, A.; Rivest, E.; Woltz, M.; Bloch, C.P.; Del Toro, I.; Ho, C.K.; Kominoski, J.; Newbold, T.A.S.; et al. Invertebrates, ecosystem services and climate change. Biol. Rev. 2013, 88, 327–348. [Google Scholar] [CrossRef]
  3. Tilman, D.; Isbell, F.; Cowles, J.M. Biodiversity and ecosystem functioning. Annu. Rev. Ecol. Evol. Syst. 2014, 45, 471–493. [Google Scholar] [CrossRef]
  4. Birkhofer, K.; Rusch, A.; Andersson, G.K.S.; Bommarco, R.; Dänhardt, J.; Ekbom, B.; Jönsson, A.; Lindborg, R.; Olsson, O.; Rader, R.; et al. A framework to identify indicator species for ecosystem services in agricultural landscapes. Ecol. Indic. 2018, 91, 278–286. [Google Scholar] [CrossRef]
  5. Fernandes, K.; van der Heyde, M.; Coghlan, M.; Wardell-Johnson, G.; Bunce, M.; Harris, R.; Nevill, P. Invertebrate DNA metabarcoding reveals changes in communities across mine site restoration chronosequences. Restor. Ecol. 2019, 27, 1177–1186. [Google Scholar] [CrossRef]
  6. Hines, J.; Pereira, H.M. Biodiversity: Monitoring trends and implications for ecosystem functioning. Curr. Biol. 2021, 31, R1390–R1392. [Google Scholar] [CrossRef] [PubMed]
  7. Losapio, G.; Genes, L.; Knight, C.J.; McFadden, T.N.; Pavan, L. Monitoring and modelling the effects of ecosystem engineers on ecosystem functioning. Funct. Ecol. 2024, 38, 8–21. [Google Scholar] [CrossRef]
  8. Engel, M.E.; Ceríaco, L.M.P.; Daniel, G.M.; Dellapé, P.M.; Löbl, I.; Marinov, M.; Reis, R.E.; Young, M.T.; Dubois, A.; Agarwal, I.; et al. The taxonomic impediment: A shortage of taxonomists, not the lack of technical approaches. Zool. J. Linn. Soc. 2021, 193, 381–387. [Google Scholar] [CrossRef]
  9. Raposo, M.A.; Kirwan, G.M.; Lourenço, A.C.C.; Sobral, G.; Bockmann, F.A.; Stopiglia, R. On the notions of taxonomic ‘impediment’, ‘gap’, ‘inflation’ and ‘anarchy’, and their effects on the field of conservation. Syst. Biodivers. 2021, 19, 296–311. [Google Scholar] [CrossRef]
  10. Schäffer, S.; Kerschbaumer, M.; Koblmüller, S. Multiple new species: Cryptic diversity in the widespread mite species Cymbaeremaeus cymba (Oribatida, Cymbaeremaeidae). Mol. Phylogenet. Evol. 2019, 135, 185–192. [Google Scholar] [CrossRef]
  11. Schäffer, S.; Koblmüller, S. Unexpected diversity in the host-generalist oribatid mite Paraleius leontonychus (Oribatida, Scheloribatidae) phoretic on Palearctic bark beetles. PeerJ 2020, 8, e9710. [Google Scholar] [CrossRef] [PubMed]
  12. Carapelli, A.; Greenslade, P.; Nardi, F.; Leo, C.; Convey, P.; Frati, F.; Fanciulli, P.P. Evidence for cryptic diversity in the “Pan-Antarctic” springtail Friesea antarctica and the description of two new species. Insects 2020, 11, 141. [Google Scholar] [CrossRef]
  13. Pfingstl, T.; Lienhard, A.; Baumann, J.; Koblmüller, S. A taxonomist‘s nightmare–cryptic diversity in Caribbean intertidal arthropods (Arachnida, Acari, Oribatida). Mol. Phylogenet. Evol. 2021, 163, 107240. [Google Scholar] [CrossRef] [PubMed]
  14. Raphalo, E.M.; Cole, M.L.; Daniels, S.R. Barcoding of South African forest-dwelling snails (Mollusca: Gastropoda) reveals widespread cryptic diversity. Invertebr. Biol. 2021, 140, e12348. [Google Scholar] [CrossRef]
  15. Hlebec, D.; Podnar, M.; Kučinić, M.; Harms, D. Molecular analyses of pseudoscorpions in a subterranean biodiversity hotspot reveal cryptic diversity and microendemism. Sci. Rep. 2023, 13, 430. [Google Scholar] [CrossRef] [PubMed]
  16. Hebert, P.D.N.; Cywinska, A.; Ball, S.L.; deWaard, J.R. Biological identifications through DNA barcodes. Proc. R. Soc. Lond. B Biol. Sci. 2003, 270, 313–321. [Google Scholar] [CrossRef]
  17. Grant, D.M.; Brodnicke, O.B.; Evankow, A.M.; Ferreira, A.O.; Fontes, J.T.; Hansen, A.K.; Jensen, M.R.; Kalaycı, T.E.; Leeper, A.; Patil, S.K.; et al. The future of DNA barcoding: Reflections from early career researchers. Diversity 2021, 13, 313. [Google Scholar] [CrossRef]
  18. Sanger, F.; Nicklen, S.; Coulson, A.R. DNA sequencing with chain-terminating inhibitors. Proc. Natl. Acad. Sci. USA 1977, 74, 5463–5467. [Google Scholar] [CrossRef] [PubMed]
  19. Smith, L.M.; Sanders, J.Z.; Kaiser, R.J.; Hughes, P.; Dodd, C.; Connell, C.R.; Heiner, C.; Kent, S.B.H.; Hood, L.E. Fluorescence detection in automated DNA sequence analysis. Nature 1986, 321, 674–679. [Google Scholar] [CrossRef]
  20. Cuber, P.; Chooneea, D.; Geeves, C.; Salatino, S.; Creedy, T.J.; Griffin, C.; Sivess, L.; Barnes, I.; Price, B.; Misra, R. Comparing the accuracy and efficiency of third generation sequencing technologies, Oxford Nanopore Technologies, and Pacific Biosciences, for DNA barcode sequencing applications. Ecol. Genet. Genom. 2023, 28, 100181. [Google Scholar] [CrossRef]
  21. Taberlet, P.; Coissac, E.; Pompanon, F.; Brochmann, C.; Willerslev, E. Towards next-generation biodiversity assessment using DNA metabarcoding. Mol. Ecol. 2012, 21, 2045–2050. [Google Scholar] [CrossRef] [PubMed]
  22. Ruppert, K.M.; Kline, R.J.; Rahman, M.S. Past, present, and future perspectives of environmental DNA (eDNA) metabarcoding: A systematic review in methods, monitoring, and applications of global eDNA. Glob. Ecol. Conserv. 2019, 17, e00547. [Google Scholar] [CrossRef]
  23. Piñol, J.; Mir, G.; Gomez-Polo, P.; Agustí, N. Universal and blocking primer mismatches limit the use of high-throughput DNA sequencing for the quantitative metabarcoding of arthropods. Mol. Ecol. Resour. 2015, 15, 819–830. [Google Scholar] [CrossRef]
  24. Hajibabaei, M.; Shokralla, S.; Zhou, X.; Singer, G.A.C.; Baird, D.J. Environmental barcoding: A next-generation sequencing approach for biomonitoring applications using river benthos. PLoS ONE 2011, 6, e17497. [Google Scholar] [CrossRef] [PubMed]
  25. Schenk, J.; Geisen, S.; Kleinbölting, N.; Traunspurger, W. Metabarcoding data allow for reliable biomass estimates in the most abundant animals on Earth. Metabarcoding Metagenom. 2019, 3, e46704. [Google Scholar] [CrossRef]
  26. Verkuil, Y.I.; Nicolaus, M.; Ubels, R.; Dietz, M.W.; Samplonius, J.M.; Galema, A.; Kiekebos, K.; de Knijff, P.; Both, C. DNA metabarcoding quantifies the relative biomass of arthropod taxa in songbird diets: Validation with camera-recorded diets. Ecol. Evol. 2022, 12, e8881. [Google Scholar] [CrossRef] [PubMed]
  27. Rourke, M.L.; Fowler, A.M.; Hughes, J.M.; Broadhurst, M.K.; DiBattista, J.D.; Fielder, S.; Wilkes Walburn, J.; Furlan, E.M. Environmental DNA (eDNA) as a tool for assessing fish biomass: A review of approaches and future considerations for resource surveys. Environ. DNA 2022, 4, 9–33. [Google Scholar] [CrossRef]
  28. Elbrecht, V.; Leese, F. Can DNA-based ecosystem assessments quantify species abundance? Testing primer bias and biomass-sequence relationships with an innovative metabarcoding protocol. PLoS ONE 2015, 10, e0130324. [Google Scholar] [CrossRef]
  29. Jain, M.; Olsen, H.E.; Paten, B.; Akeson, M. The Oxford Nanopore MinION: Delivery of nanopore sequencing to the genomics community. Genome Biol. 2016, 17, 239. [Google Scholar] [CrossRef]
  30. Delahaye, C.; Nicolas, J. Sequencing DNA with nanopores: Troubles and biases. PLoS ONE 2021, 16, e0257521. [Google Scholar] [CrossRef]
  31. Sahlin, K.; Lim, M.C.W.; Prost, S. NGSpeciesID: DNA barcode and amplicon consensus generation from long-read sequencing data. Ecol. Evol. 2021, 11, 1392–1398. [Google Scholar] [CrossRef] [PubMed]
  32. Srivathsan, A.; Lee, L.; Katoh, K.; Hartop, E.; Kutty, S.N.; Wong, J.; Yeo, D.; Meier, R. ONTbarcoder and MinION barcodes aid biodiversity discovery and identification by everyone, for everyone. BMC Biol. 2021, 19, 217. [Google Scholar] [CrossRef] [PubMed]
  33. Vierstraete, A.R.; Braeckman, B.P. Amplicon_sorter: A tool for reference-free amplicon sorting based on sequence similarity and for building consensus sequences. Ecol. Evol. 2022, 12, e8603. [Google Scholar] [CrossRef] [PubMed]
  34. Davidov, K.; Iankelevich-Kounio, E.; Yakovenko, I.; Koucherov, Y.; Rubin-Blum, M.; Oren, M. Identification of plastic-associated species in the Mediterranean Sea using DNA metabarcoding with nanopore MinION. Sci. Rep. 2020, 10, 17533. [Google Scholar] [CrossRef] [PubMed]
  35. Baloğlu, B.; Chen, Z.; Elbrecht, V.; Braukmann, T.; MacDonald, S.; Steinke, D. A workflow for accurate metabarcoding using nanopore MinION sequencing. Methods Ecol. Evol. 2021, 12, 794–804. [Google Scholar] [CrossRef]
  36. van der Reis, A.L.; Beckley, L.E.; Olivar, M.P.; Jeffs, A.G. Nanopore short-read sequencing: A quick, cost-effective and accurate method for DNA metabarcoding. Environ. DNA 2022, 5, 282–296. [Google Scholar] [CrossRef]
  37. Richlen, M.L.; Barber, P.H. A technique for the rapid extraction of microalgal DNA from sngle live and preserved cells. Mol. Ecol. Notes 2005, 5, 688–691. [Google Scholar] [CrossRef]
  38. Folmer, O.; Black, M.; Hoeh, W.; Lutz, R.; Vrijenhoek, R. DNA primers for amplification of mitochondrial cytochrome c oxidase subunit I from diverse metazoan invertebrates. Mol. Mar. Biol. Biotechnol. 1994, 3, 294–299. [Google Scholar] [PubMed]
  39. Pentinsaari, M.; Hebert, P.D.N.; Mutanen, M. Barcoding beetles: A regional survey of 1872 species reveals high identification success and unusually deep interspecific divergences. PLoS ONE 2014, 9, e108651. [Google Scholar] [CrossRef]
  40. Pereira-da-Conceicoa, L.; Elbrecht, V.; Hall, A.; Briscoe, A.; Barber-James, H.; Price, B. Metabarcoding unsorted kick-samples facilitates macroinvertebrate-based biomonitoring with increased taxonomic resolution, while outperforming environmental DNA. Environ. DNA 2021, 3, 353–371. [Google Scholar] [CrossRef]
  41. Anđelić Dmitrović, B.; Jelić, M.; Rota, E.; Jelaska, L.Š. DNA barcoding of invertebrates inhabiting olive orchards and vineyards accelerates understudied Mediterranean biodiversity assessment. Diversity 2022, 14, 183. [Google Scholar] [CrossRef]
  42. Bukowski, B.; Ratnasingham, S.; Hanisch, P.E.; Hebert, P.D.N.; Perez, K.; deWaard, J.; Tubaro, P.L.; Lijtmaer, D.A. DNA barcodes reveal striking arthropod diversity and unveil seasonal patterns of variation in the southern Atlantic Forest. PLoS ONE 2022, 17, e0267390. [Google Scholar] [CrossRef]
  43. Roslin, T.; Somervuo, P.; Pentinsaari, M.; Hebert, P.D.N.; Agda, J.; Ahlroth, P.; Anttonen, P.; Aspi, J.; Blagoev, G.; Blanco, S.; et al. A molecular-based identification resource for the arthropods of Finland. Mol. Ecol. Resour. 2022, 22, 803–822. [Google Scholar] [CrossRef] [PubMed]
  44. Srivathsan, A.; Hartop, E.; Puniamoorthy, J.; Lee, W.T.; Kutty, S.N.; Kurina, O.; Meier, R. Rapid, large-scale species discovery in hyperdiverse taxa using 1D MinION sequencing. BMC Biol. 2019, 17, 96. [Google Scholar] [CrossRef]
  45. Tamura, K.; Stecher, G.; Kumar, S. MEGA11: Molecular Evolutionary Genetics Analysis version 11. Mol. Biol. Evol. 2021, 38, 3022–3027. [Google Scholar] [CrossRef]
  46. Kimura, M. A simple method for estimating evolutionary rates of base substitutions through comparative studies of nucleotide sequences. J. Mol. Evol. 1980, 16, 111–120. [Google Scholar] [CrossRef]
  47. Wang, Y.; Zhao, Y.; Bollas, A.; Wang, Y.; Au, K.F. Nanopore sequencing technology, bioinformatics and applications. Nat. Biotechnol. 2021, 39, 1348–1365. [Google Scholar] [CrossRef] [PubMed]
  48. Srivathsan, A.; Feng, V.; Suárez, D.; Emerson, B.; Meier, R. ONTbarcoder 2.0: Rapid species discovery and identification with real-time barcoding facilitated by Oxford Nanopore R10.4. Cladistics 2023, 40, 192–203. [Google Scholar] [CrossRef]
  49. Young, M.R.; Proctor, H.C.; deWaard, J.R.; Hebert, P.D.N. DNA barcodes expose unexpected diversity in Canadian mites. Mol. Ecol. 2019, 28, 5347–5359. [Google Scholar] [CrossRef]
  50. Porco, D.; Bedos, A.; Greenslade, P.; Janion, C.; Skarżyński, D.; Stevens, M.I.; Jansen van Vuuren, B.; Deharveng, L. Challenging species delimitation in Collembola: Cryptic diversity among common springtails unveiled by DNA barcoding. Invertebr. Syst. 2012, 26, 470–477. [Google Scholar] [CrossRef]
  51. von Saltzwedel, H.; Scheu, S.; Schaefer, I. Genetic structure and distribution of Parisotoma notabilis (Collembola) in Europe: Cryptic diversity, split of lineages and colonization patterns. PLoS ONE 2017, 12, e0170909. [Google Scholar] [CrossRef] [PubMed]
  52. Zhang, B.; Chen, T.-W.; Mateos, E.; Scheu, S.; Schaefer, I. DNA-based approaches uncover cryptic diversity in the European Lepidocyrtus lanuginosus species group (Collembola: Entomobryidae). Invertebr. Syst. 2019, 22, 661–670. [Google Scholar] [CrossRef]
  53. European Commission. EU Soil Strategy for 2030: Reaping the Benefits of Healthy Soils for People, Food, Nature and Climate; Communication from the Commission to the European Parliament, the Council, the European Economic and Social Committee and the Committee of the Regions: Brussels, Belgium, 2021. [Google Scholar]
  54. Skoracka, A.; Magalhães, S.; Rector, B.G.; Kuczyński, L. Cryptic speciation in the Acari: A function of species lifestyles or our ability to separate species? Exp. Appl. Acarol. 2015, 67, 165–182. [Google Scholar] [CrossRef] [PubMed]
  55. Ratnasingham, S.; Hebert, P.D.N. A DNA-based registry for all animal species: The Barcode Index Number (BIN) system. PLoS ONE 2013, 8, e66213. [Google Scholar] [CrossRef]
  56. Seifert, B. Die Ameisen Mittel-Und Nordeuropas; Lutra: Boxberg, Germany, 2007. [Google Scholar]
  57. Seifert, B. A Taxonomic revision of the Palaearctic members of the subgenus Lasius s.str. (Hymenoptera, Formicidae). Soil Org. 2020, 92, 15–86. [Google Scholar]
  58. Hebert, P.D.N.; Penton, E.H.; Burns, J.M.; Janzen, D.H.; Hallwachs, W. Ten species in one: DNA barcoding reveals cryptic species in the Neotropical Skipper Butterfly Astraptes fulgerator. Proc. Natl. Acad. Sci. USA 2004, 101, 14812–14817. [Google Scholar] [CrossRef] [PubMed]
  59. Germain, J.-F.; Chatot, C.; Meusnier, I.; Artige, E.; Rasplus, J.-Y.; Cruaud, A. Molecular identification of Epitrix potato flea beetles (Coleoptera: Chrysomelidae) in Europe and North America. Bull. Entomol. Res. 2013, 103, 354–362. [Google Scholar] [CrossRef]
  60. Lobo, J.; Costa, P.M.; Teixeira, M.A.; Ferreira, M.S.; Costa, M.H.; Costa, F.O. Enhanced primers for amplification of DNA barcodes from a broad range of marine metazoans. BMC Ecol. 2013, 13, 34. [Google Scholar] [CrossRef]
Figure 1. Number of reads per sample for each combination of flowcell (Flongle, MinION, combined, and MinION downsampled to 50,000 reads) and basecalling algorithm (hac, light grey, and shac, dark grey).
Diversity 16 00196 g001
Figure 2. Neighbor-joining tree (K2P distances, pairwise deletion of missing data) of the barcodes of moss-dwelling invertebrates generated in this study. As measures of nodal support, bootstrap values are shown (1000 pseudoreplicates; only values >50 are shown). Sample IDs are followed by (conservative) taxonomic assignment and % similarity to the best match in BOLD or GenBank, if species assignment failed with BOLD. Samples with species identity inferred via BOLD are highlighted in bold.
Diversity 16 00196 g002
Table 1. Read and barcode statistics for the different sequencing approaches.
Flongle hacFlongle shacMinION hacMinION shacMinION+
Flongle hac
MinION+
Flongle shac
MinION
50000
hac
MinION
50000
shac
Sanger
Number of reads in file59,63859,185179,488181,252239,126240,43750,00050,000
Number of reads passing length filter43,33443,304126,041127,618169,375170,92235,21435,270
Number of reads used for demultiplexing39,41739,428113,266114,799152,683154,22731,80631,868
Number of samples in demultiplexing file8888888888888888
Number of samples with ≥5× coverage6060626362635858
Number of good barcodes obtained after first alignment of up to 200 reads2837505654554552
Number of erroneous barcodes obtained after first alignment of up to 200 reads282111466105
Number of good barcodes obtained after aligning similar reads42122131
Number of erroneous barcodes obtained after aligning similar reads2317924483
Number of barcodes fixed2520723383
Final number of barcodes575958605959565663
Final number of barcodes that cannot be fixed31423322
Number of Ns in final barcodes94661123324926
Number of filtered barcodes5355575859585354
Number of QC-compliant full-length barcodes *323951585656485335
Number of barcodes with 1–5 errors2116603251
Number of barcodes with 6–10 errors33110121
Number of barcodes with 11–15 errors00000010
Number of barcodes with over 15 errors11010001
*, no Ns or errors are permitted in QC-compliant barcodes.
Disclaimer/Publisher’s Note: The statements, opinions and data contained in all publications are solely those of the individual author(s) and contributor(s) and not of MDPI and/or the editor(s). MDPI and/or the editor(s) disclaim responsibility for any injury to people or property resulting from any ideas, methods, instructions or products referred to in the content.

