Article

Diet Composition Explains Interannual Fluctuations in Reproductive Performance in a Lowland Golden Eagle Population

1
Environmental Board, Roheline 64, 80010 Pärnu, Estonia
2
Institute of Agricultural and Environmental Sciences, Estonian University of Life Sciences, Kreutzwaldi 5D, 51006 Tartu, Estonia
*
Author to whom correspondence should be addressed.
Diversity 2024, 16(1), 69; https://doi.org/10.3390/d16010069
Submission received: 18 December 2023 / Revised: 16 January 2024 / Accepted: 19 January 2024 / Published: 20 January 2024
(This article belongs to the Special Issue Ecology and Conservation of the White-Tailed Eagle and Golden Eagle)

Abstract

:
Food supply stands out as one of the most critical drivers of population demographics by limiting reproductive rates. In this study, we assessed fluctuations in diet composition and monitored various reproductive parameters over a nine-year period in a Golden Eagle population in an Eastern European peatland. The identification of 2439 prey specimens from 84 species revealed that the studied eagles primarily preyed upon birds (constituting 78.3% of prey numbers and 67.2% of prey biomass) and less on mammals (21.6% and 32.8%, respectively). Grouse emerged as the most important prey group (31% and 27%), followed by waterfowl (17%) and hares (8% and 14%). The most significant prey species, both in terms of numbers and weight, were the Black Grouse, Mountain Hare, Common Crane, and Capercaillie. The share of the Black Grouse decreased, while those of the White-fronted Goose, Roe Deer, and hares increased. The food niche, as measured by the Levins’ index, was broad (6.6), and it expanded during the study. On average, 58.3% of Golden Eagle pairs initiated breeding annually, with 69.1% successfully completing it, and 0.41 young per occupied territory were produced annually; there was pronounced interannual variation in reproductive performance. These fluctuations were associated with the shares of White-fronted Goose, Capercaillie, Mountain Hare and Roe Deer in the diet, suggesting that these species may be gaining increasing importance for the Golden Eagle, particularly following the decline of the Black Grouse.

1. Introduction

Monitoring demography and understanding the causes of its variation are essential for comprehending the dynamics of animal populations and guiding their management [1,2,3]. Food supply is a crucial factor influencing population demography by limiting reproductive rates. In many bird species, for instance, the breeding rate is heavily influenced by food availability [4]. Consequently, long-lived species such as large raptors may skip breeding in poor years to increase their chances of successful breeding in the future, ultimately maximizing their lifetime reproductive success [5,6]. In other words, parents should balance investment in their offspring against their own chances to reproduce in the future [3,6].
The relationship between food abundance and reproductive success is particularly notable among diet specialists that primarily depend on one or a few prey species [7]. In contrast, diet generalists have the ability to switch to alternative prey species to sustain successful breeding [8]. However, even generalist species have their dietary preferences, and as the abundance of preferred prey species declines, the dietary breadth of predators increases, negatively impacting their reproductive success [9].
The Golden Eagle (Aquila chrysaetos Linné, 1758) is a cosmopolitan raptor species found across the northern hemisphere and adapted to various habitats. As a large generalist top predator, the Golden Eagle preys upon a variety of animals, including mammals, birds, reptiles, and occasionally fish [10]. However, it typically primarily feeds on the few most abundant medium-sized prey species in a given habitat [10,11].
The composition of the Golden Eagle’s diet, its long-term temporal changes, and the fitness consequences are relatively well established in the review by [10]. Reproductive success decreases as the proportion of optimal prey species declines; this is accompanied by an increase in diet breadth, indicated by a higher proportion of suboptimal prey species [10,12]. However, the interannual fluctuations in the Golden Eagle’s diet and their link to reproductive output have received less attention. Similar to long-term changes, annual productivity tends to increase with the abundance of primary prey [13,14,15,16,17,18,19,20], suggesting a bottom-up limitation on eagle reproduction [21].
Although the foraging and reproductive ecology of the Golden Eagle have been relatively well studied in many populations, some regions, particularly the eastern European lowlands (including Estonia, Latvia, Belarus, and western Russia), have remained poorly investigated. In this region, the Golden Eagle is associated with bogs, its primary foraging habitat, and it constructs nests on trees in nearby forests. While regional descriptions of diet composition and reproductive success exist [22,23,24,25,26], no analyses of their variations or the relationships between these life history traits have been published. Similar to the situation in Fennoscandia [13,15,16,17,18], grouse and hares have been the main prey in the lowlands of eastern Europe [22,25,26]. Notably, both prey groups have experienced severe declines in recent decades [27,28], which may have triggered changes in diet composition. Consequently, earlier published data may now be outdated and should be used cautiously in the current conservation management of the Golden Eagle, a strictly protected species in the region. Therefore, a comprehensive contemporary analysis elucidating the trophic relationships and their effects on the reproductive success of peatland-associated Golden Eagle populations is needed.
In the current study, we describe the diet composition of a Golden Eagle population in Estonia, Eastern Europe, over a nine-year period of 2013 to 2021. Simultaneously, we monitored various reproductive parameters during the same period. We hypothesized that: (i) the diet composition of the Golden Eagle in Estonia is similar to that of neighboring peatland-associated populations, with prey proportions intermediate between Finland in the north and Belarus in the south of Estonia; (ii) the diet composition of the Golden Eagle and its reproductive performance fluctuate interannually; and (iii) variations in the proportions of the main prey items of the Golden Eagle are associated with changes in reproductive performance.

2. Materials and Methods

The Golden Eagle is a native species in Estonia (59° N, 25° E) and is distributed across this lowland country (with elevations up to 318 m above sea level), albeit being rarer in its drier southeastern part. Since the 1970s, when a few dozens pairs bred in the country [29], the population has gradually increased, reaching 65 pairs in 2013 [30]. Subsequently, the population has stabilized since then [31] [G. Sein unpubl. data]. Diet estimation was performed for 39 pairs, representing approximately 75% of the population.
The Estonian Golden Eagle population is closely associated with peatlands. The eagles predominantly forage on raised bogs, fens, transitional bogs, and occasionally on remote human-made grasslands or forest clear-cuts [32] [G. Sein, unpubl. data]. They construct their nests in forests near bogs or even on small forest islands within bogs. This monogamous bird of prey breeds solitarily, with an average distance of approximately 10 km between neighboring pairs [33]. Pairs may remain together for several years, possibly for life [10], using the same nests for multiple years, although they may alternate between several nests. Adult birds are sedentary, occupying their home range surrounding their nests year-round. Eggs are typically laid in March, with offspring hatching in May and fledging in July.
Golden Eagles are annually monitored in Estonia. In June, nests are inspected, and nestlings are ringed. In cases where no nestlings are present, the occurrence of freshly brought twigs and molted feathers is checked to determine nest occupancy (the greenery brought in spring remains distinguishable in the Nordic climate even in summer). Additionally, remains of eggshells or nestlings are sought to identify failed breeding. Rarely, entire eggs may have been removed by predators such as pine martens. However, as a consistent methodology has been applied over the years, reliable interannual comparisons could be made.
Similar to many other studies, productivity (number of large nestlings ≥4 weeks old [20] per year of territory occupation) has served as a standard reproductive success metric in Estonian Golden Eagle monitoring. Also, breeding frequency (the number of nests where eggs were laid/the number of occupied nests) and breeding success (the number of successful nests/the number of nests where eggs were laid) were separately calculated to distinguish components forming productivity. During the study period (2013–2021), breeding frequency exhibited no association with breeding success (r = −0.12, p = 0.74) or productivity (r = 0.41, p = 0.28). However, breeding success strongly correlated with productivity (r = 0.83, p = 0.005).
Diet analysis was conducted based on prey remains collected at nest sites, a common method in Golden Eagle diet studies [10]. Remains were first collected during nest monitoring in June. However, as the inspection time in June was limited to reduce disturbance of the birds, another visit to successful nests was made in autumn (September–November). Hence, the collected data reflect the diet composition of successful nests in late spring and summer. Pellets were not analyzed, potentially resulting in the underestimation of small prey items like rodents [17]. However, this limitation minimally impacts between-year comparisons, especially those involving prey weight, as this prey group represents only a small fraction of the total prey biomass.
Prey items were identified using group-specific guides [34,35,36], online resources for feathers and bones [37,38], and our own reference collections. Identification was performed to the lowest taxonomic level, and the minimum number of individual prey items present was estimated. Food niche breadth was computed according to Levins [39] using formula B = 1/Σpi2, where pi is the proportion of prey category i by number in the diet. Larger values of B indicate higher dietary diversity. To maintain comparability with earlier studies [10], taxa were classified by family, discarding unidentified birds and mammals from the calculations.
The weights of birds and mammals were obtained from monographs based on local (Estonian) measurements [40,41]. However, some weights were adjusted because most of the medium-sized mammals (e.g., Red Fox, Raccoon Dog, Roe Deer) and a fraction of the hares were taken as small-sized juveniles (see also [16,17]). Furthermore, we also assumed that only a portion of large mammals, which were probably eaten as carrion (e.g., a cow and a Red Deer, both calves), were taken to the nest; the weight of such prey items was adjusted accordingly. As an estimate of game abundance, we used annual reports on hunting bag statistics supplied by the Estonian Environment Agency [28].
The data analysis was conducted at the population level, allowing direct comparisons with earlier studies in the region [17,18,24,25]. The mean values ± standard deviation described the average reproductive parameters and proportions of prey species or groups. Linear regressions were used to depict trends in prey proportions and the characteristics of reproductive performance over the years. The proportions of prey biomass were used in the analysis of temporal trends; however, the proportions of numbers yielded similar results (not presented). As only a few species dominated each taxonomic group (e.g., Black Grouse among grouse and hares among mammals), analyses of temporal fluctuations in diet composition and reproductive success were conducted at the species level, not at the group level.
Spearman’s rank correlation coefficient was used to describe associations between the relative abundance of prey species and the share of respective species in diet; Pearson’s product–moment correlation described associations between shares of prey items and reproductive parameters. Linear regression models were utilized to evaluate associations between diet composition (dependent variable) and reproductive performance (independent variable). As significant or nearly significant temporal trends in the proportions of several dominant prey species were detected (see results), residuals of linear trends were used in models evaluating interannual fluctuations. However, we also established models using raw annual estimates to study associations in the long-term trends of variables during the study period (2013–2021). In the initial models, we included shares of six species that had been earlier shown to be important prey items for the Golden Eagle or had significant temporal trends in proportions in the current study (Black Grouse, Capercaillie, hares, Common Crane, Roe Deer, White-fronted Goose). This restriction of the species set was used because the number of study years was low. A stepwise elimination procedure based on Akaike information criterion (AIC) values was used for model compression and the development of the best model. The data analysis was conducted in the statistical environment R v.4.3.2 [42].

3. Results

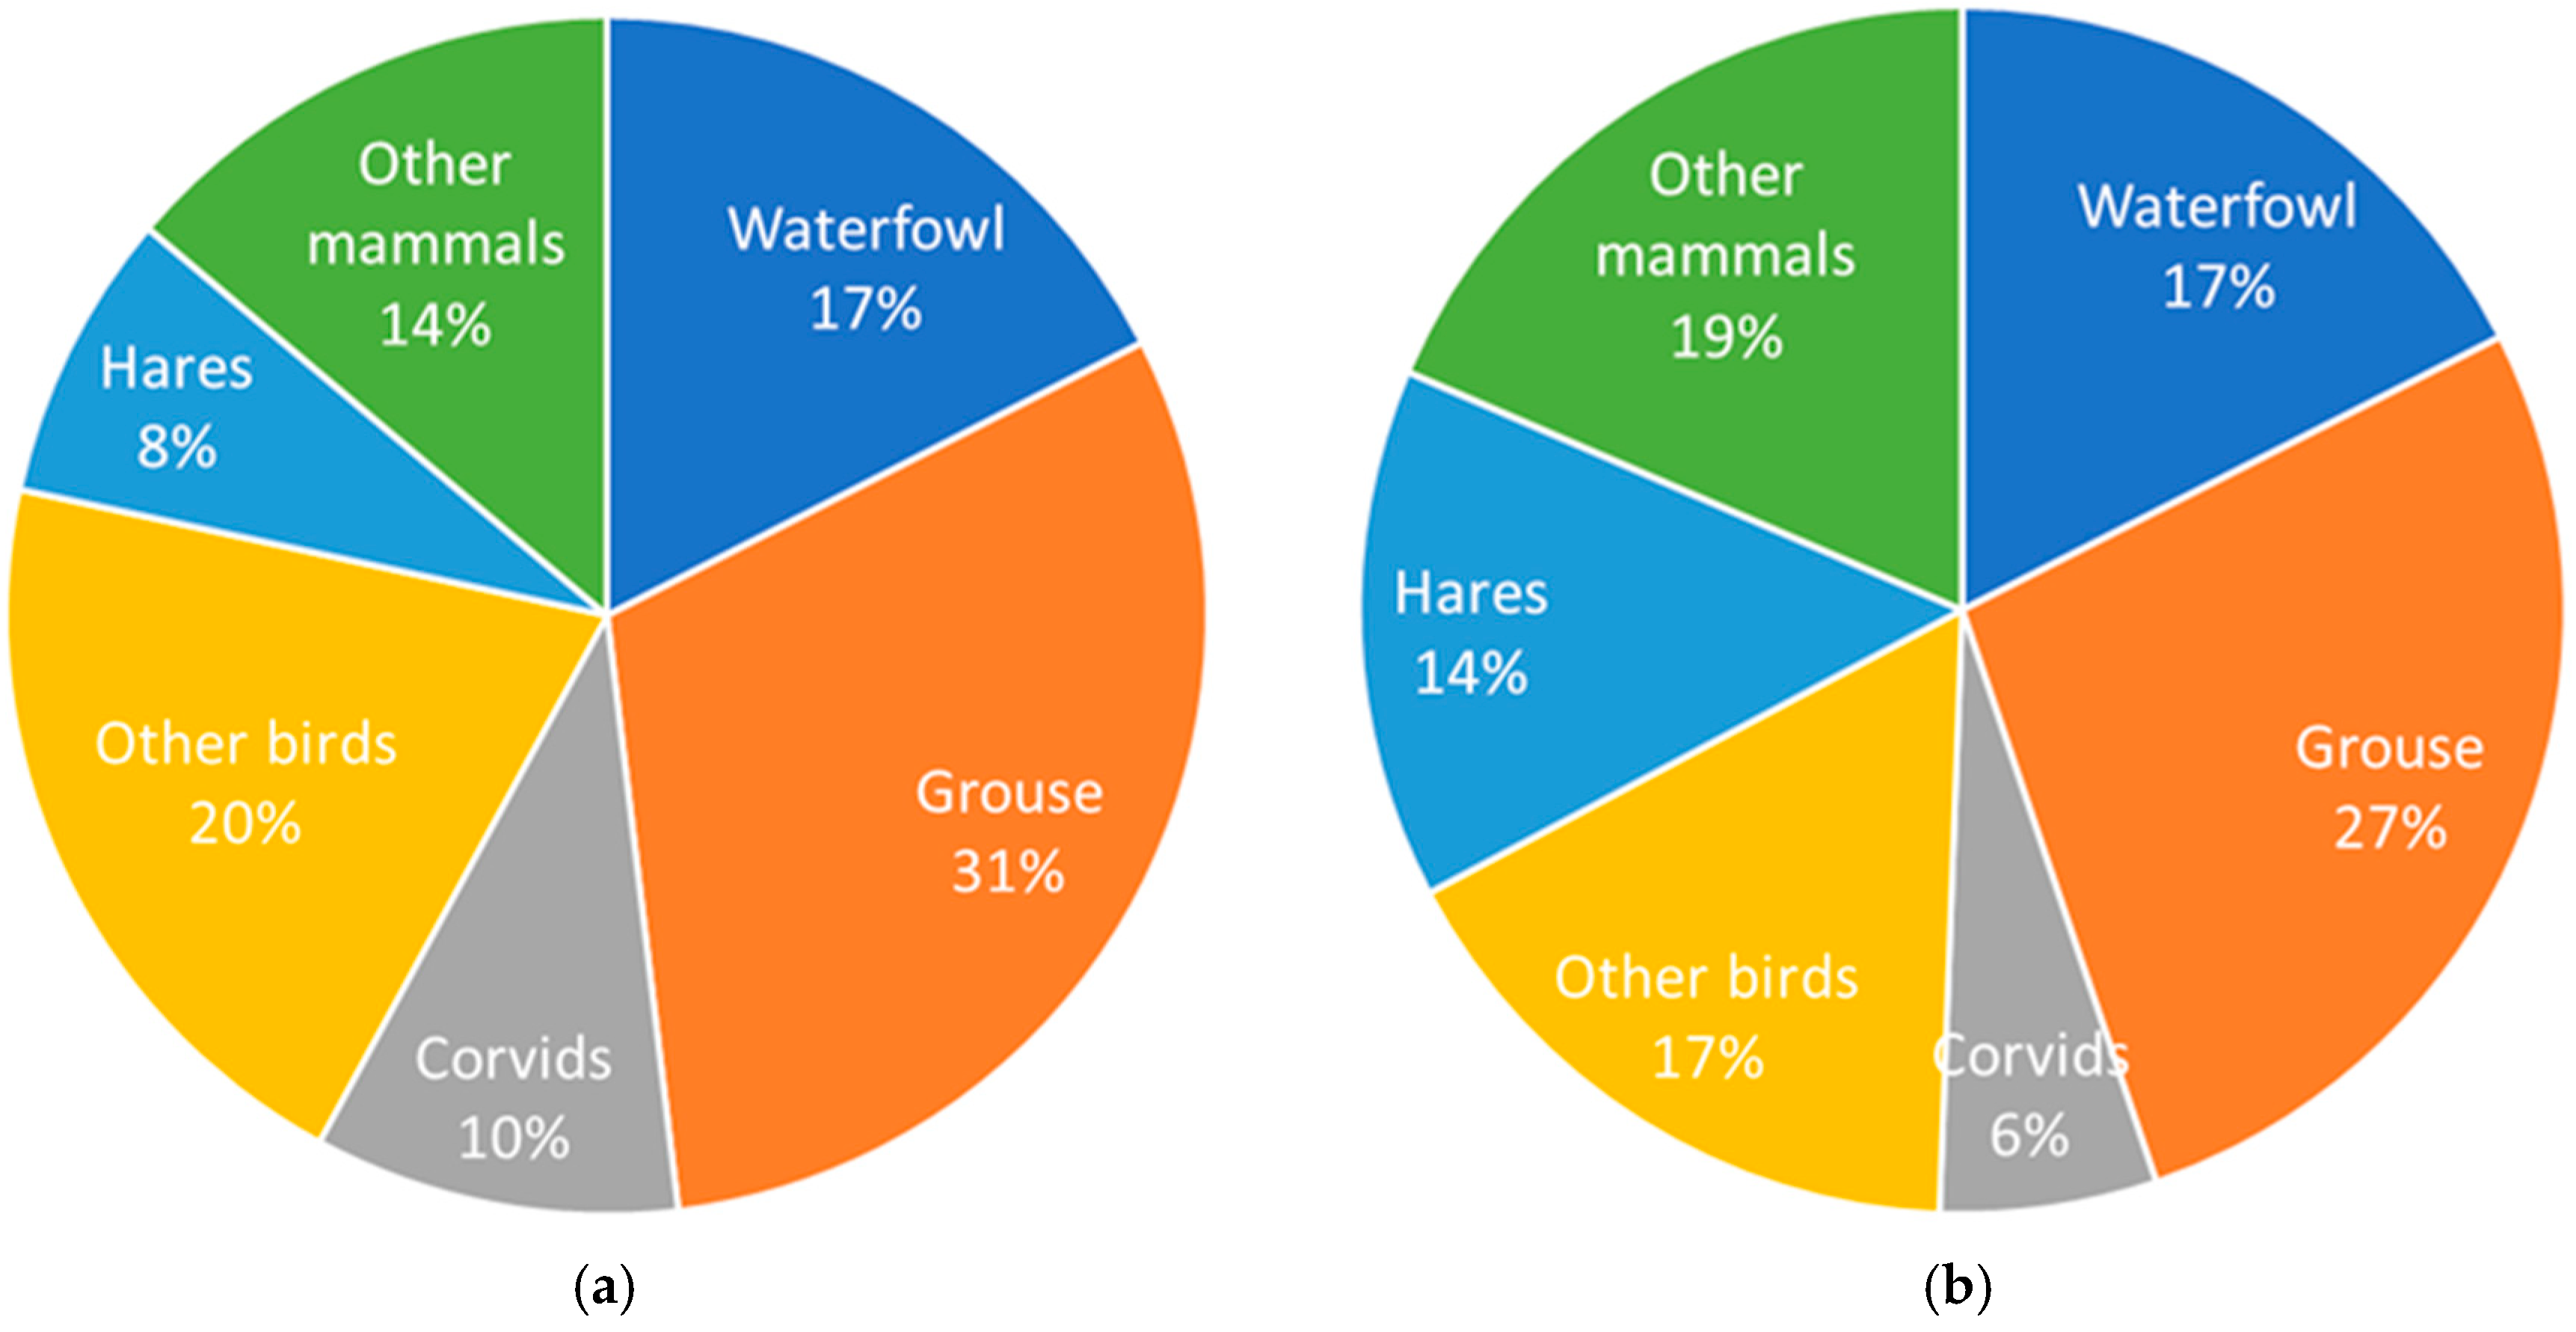
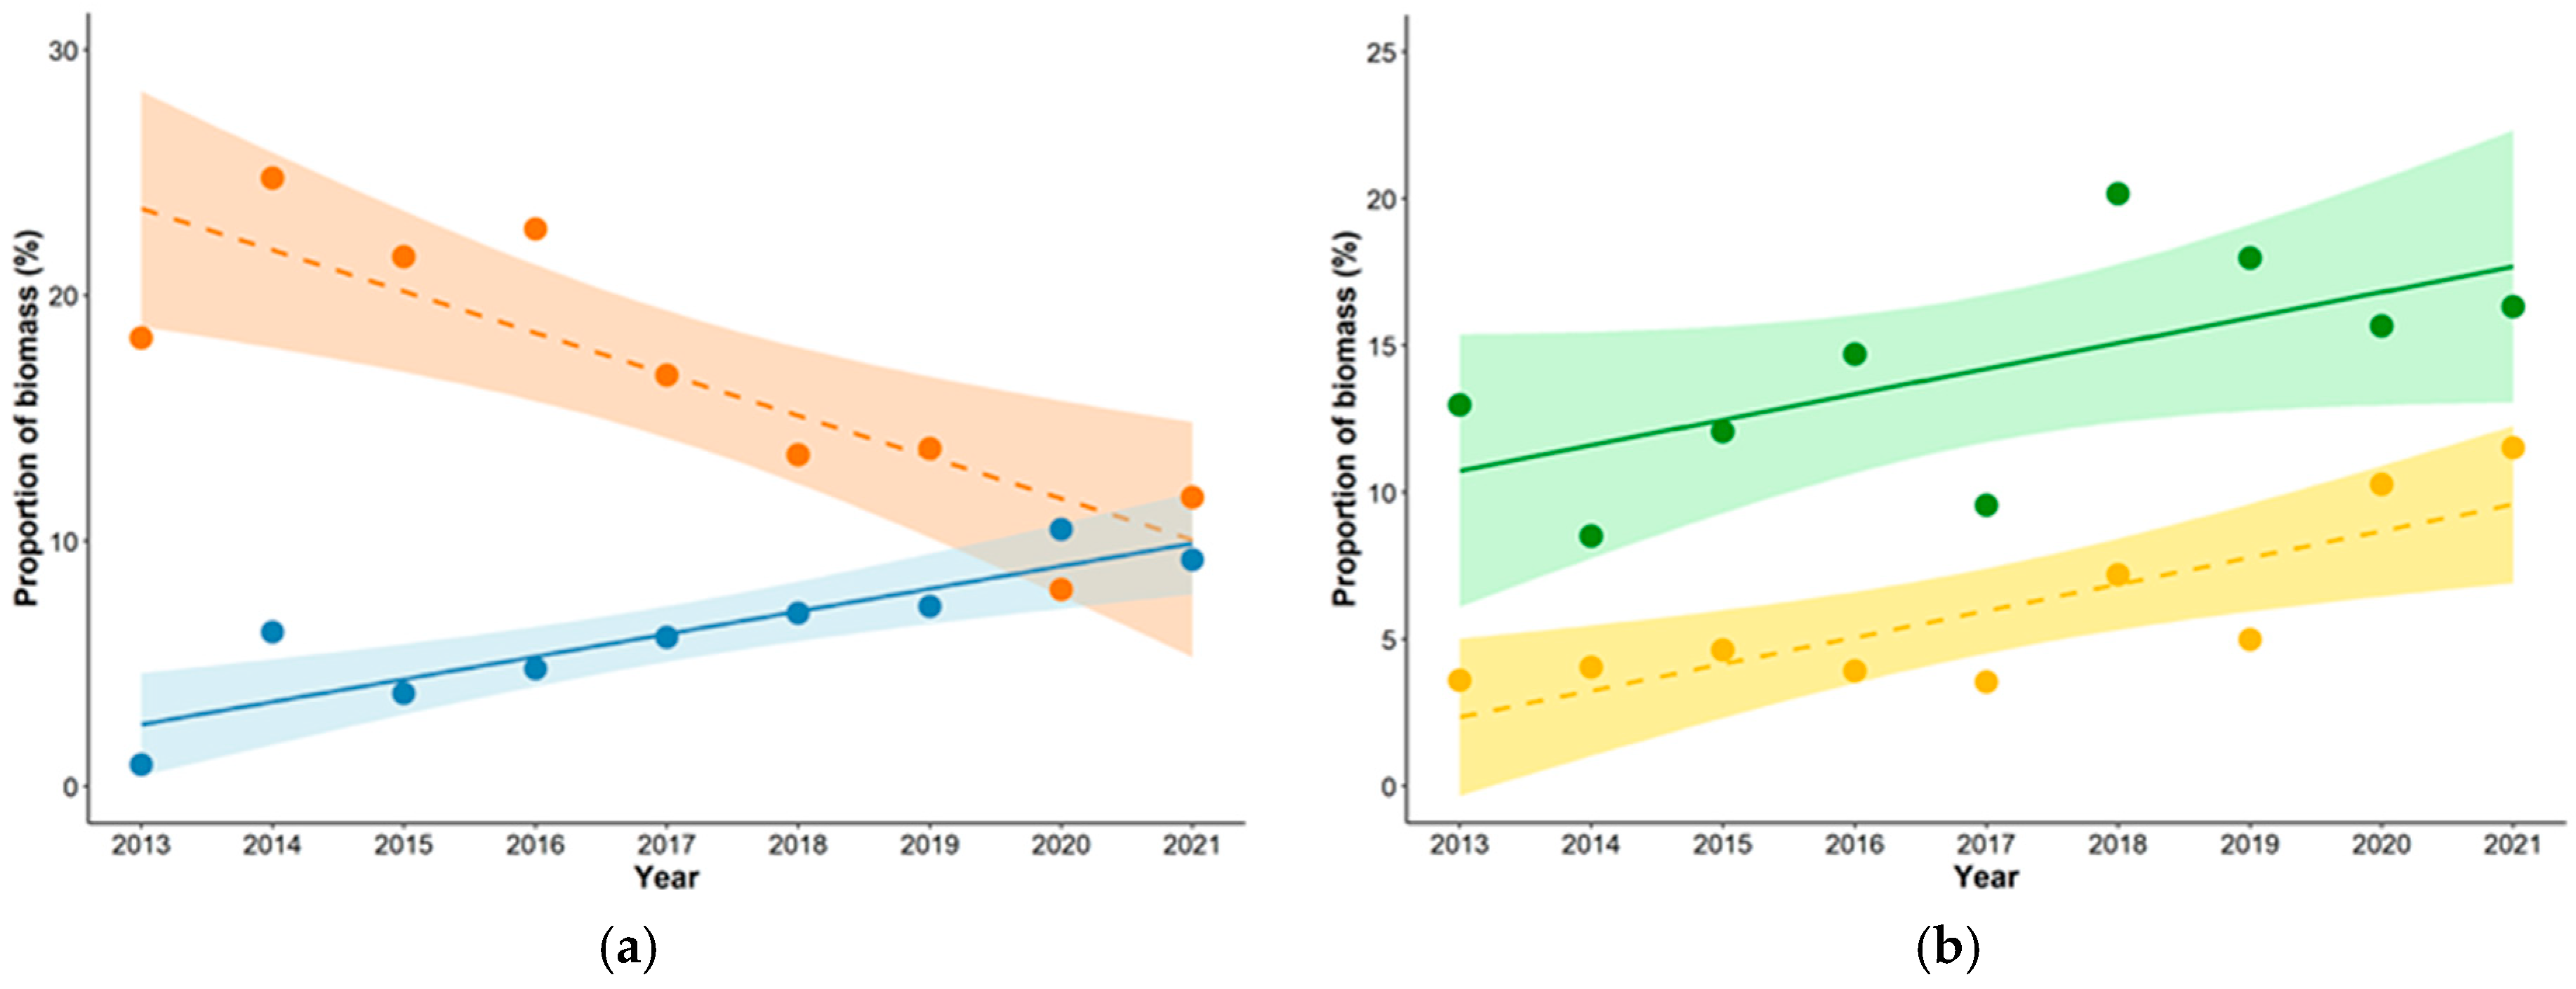
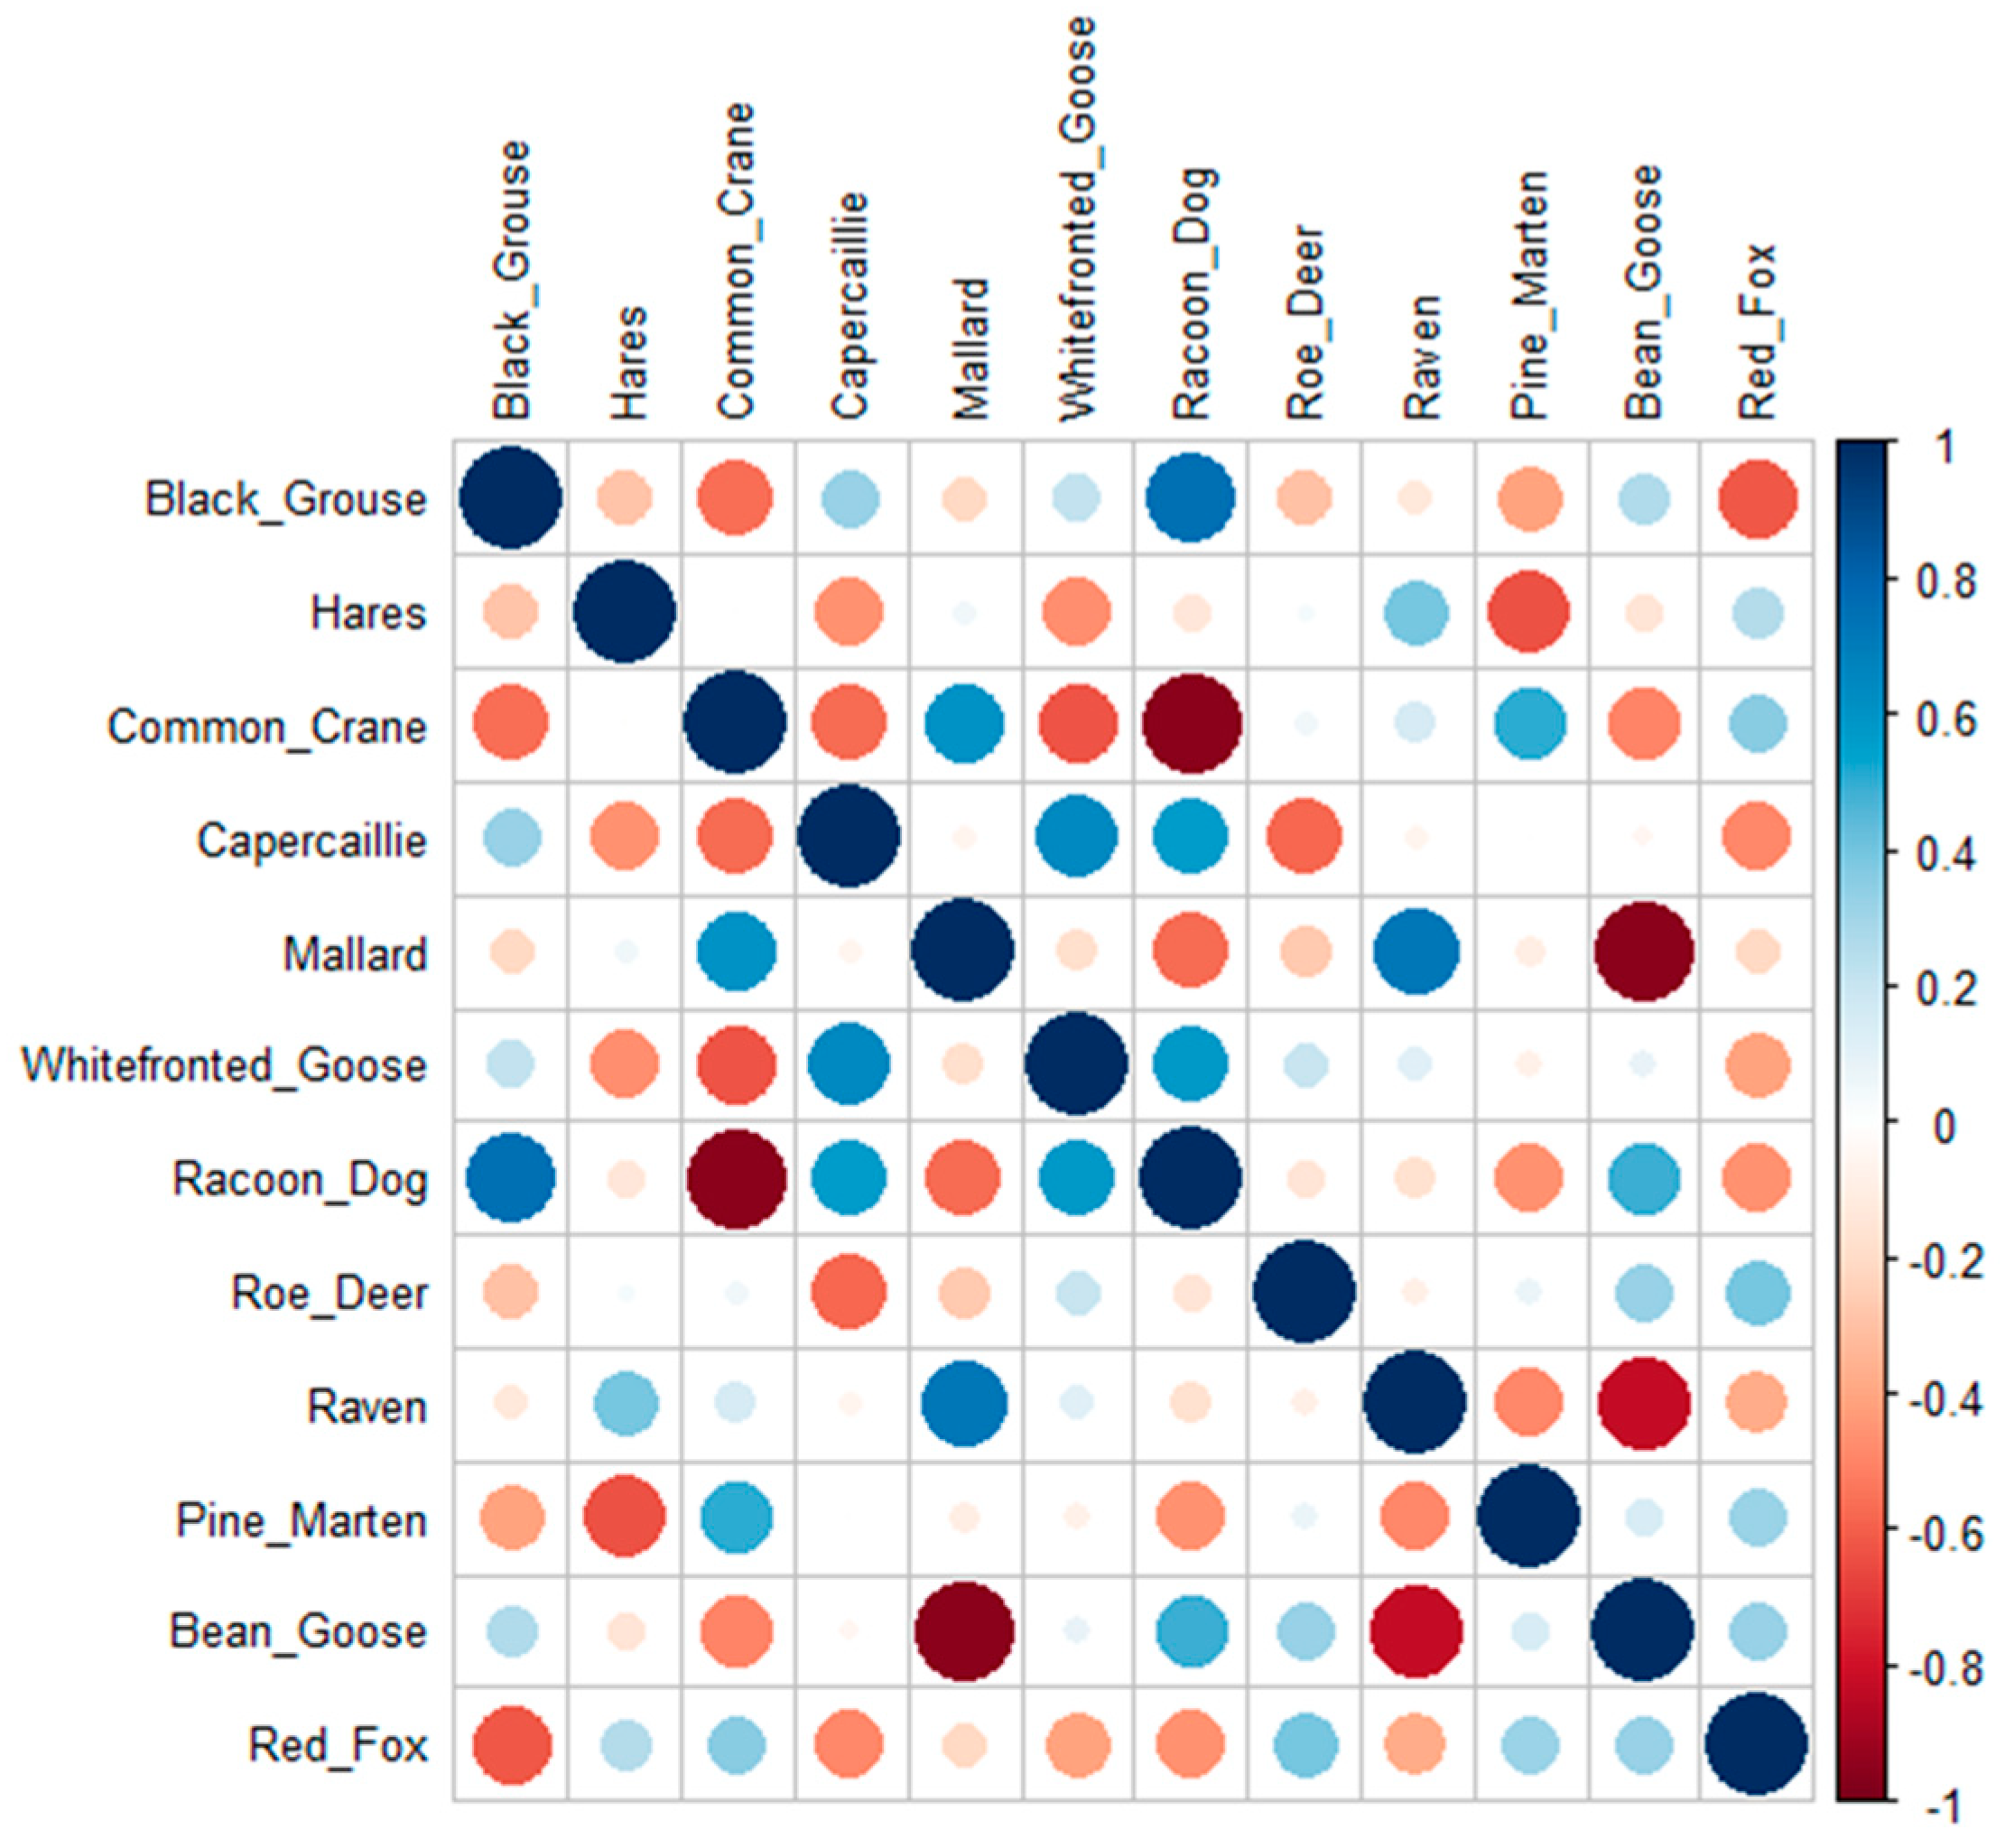
3.1. Diet Composition

In total, 2439 prey specimens from 84 species were identified (Supplementary Table S1). The diet of Estonian Golden Eagles primarily comprised birds, constituting 78.34 ± 4.06% (mean of study years ± SD) of the diet in numbers and 67.23 ± 5.24% of biomass. Mammals made up a lesser portion, accounting for 21.63 ± 3.99% in numbers and 32.76 ± 5.23% in biomass. Exceptionally, a fish was taken, forming 0.03 ± 0.10% in numbers and 0.01 ± 0.03% in biomass. Grouse emerged as the most significant prey group in both numbers and biomass, followed by waterfowl and hares (Figure 1). Corvids and waders were also occasionally preyed upon but constituted a smaller portion of the biomass. Intraguild predation was infrequent, with raptors and owls accounting for only 1.9% in numbers and 0.8% in biomass.However, mammalian mesopredators comprised 5.3% in numbers and 5.7% in biomass.
The most frequently targeted avian species was the Black Grouse, contributing nearly a quarter of the total prey numbers and one sixth of biomass (Table 1). Hares, Common Crane, and Capercaillie were less frequently preyed upon but still constituted over 10% of the biomass each (Table 1). Collectively, these four species (with hares not separated but the majority consisting of Mountain Hares) comprised almost half of the diet, both in terms of numbers and biomass. The twelve most crucial prey species (each forming at least 1% of the biomass) constituted 76.8% of prey numbers and 92.0% of biomass (Table 1). The mean food niche breadth (Levins’ index) was 6.6 ± 1.3.
Regarding prey weight, the share of Black Grouse in the diet decreased over the study period (F1,7 = 15.7, p = 0.005), while that of White-fronted Goose (F1,7 = 24.5, p = 0.002) and Roe Deer (F1,7 = 14.5, p = 0.007) increased. Additionally, the share of hares tended to increase (F1,7 = 4.4, p = 0.073; Figure 2). Similar trends were observed when analyzing prey numbers. These increasing shares tended to be associated with the actual increase in the abundance of the respective species, estimated by the number of hunted specimens (rs = 0.55, p = 0.133 for the White-fronted Goose, rs = 0.60, p = 0.097 for the Mountain Hare, and rs = 0.67, p = 0.059 for the Roe Deer). The food niche also broadened over the years (F1,7 = 8.3, p = 0.024; Table 1).
There were remarkable fluctuations among the shares of the main prey species (Table 1, Figure 2). However, no correlations were found between the interannual fluctuations (residuals) of these four species’ temporal linear trends, suggesting that these species did not compensate each other in interannual variations. Instead, strong correlations between the residuals of temporal trends for other species (Figure 3) indicated that Golden Eagles effectively utilized various alternative prey items over the years. This was further supported by a strong negative correlation between the residuals of the Black Grouse share and food niche breadth (r = −0.94, p < 0.001), while positive correlations between food niche breadth and the share fluctuations of species with growing importance (hares, White-fronted Goose, and Roe Deer) remained just on the threshold of significance (p = 0.02–0.09).

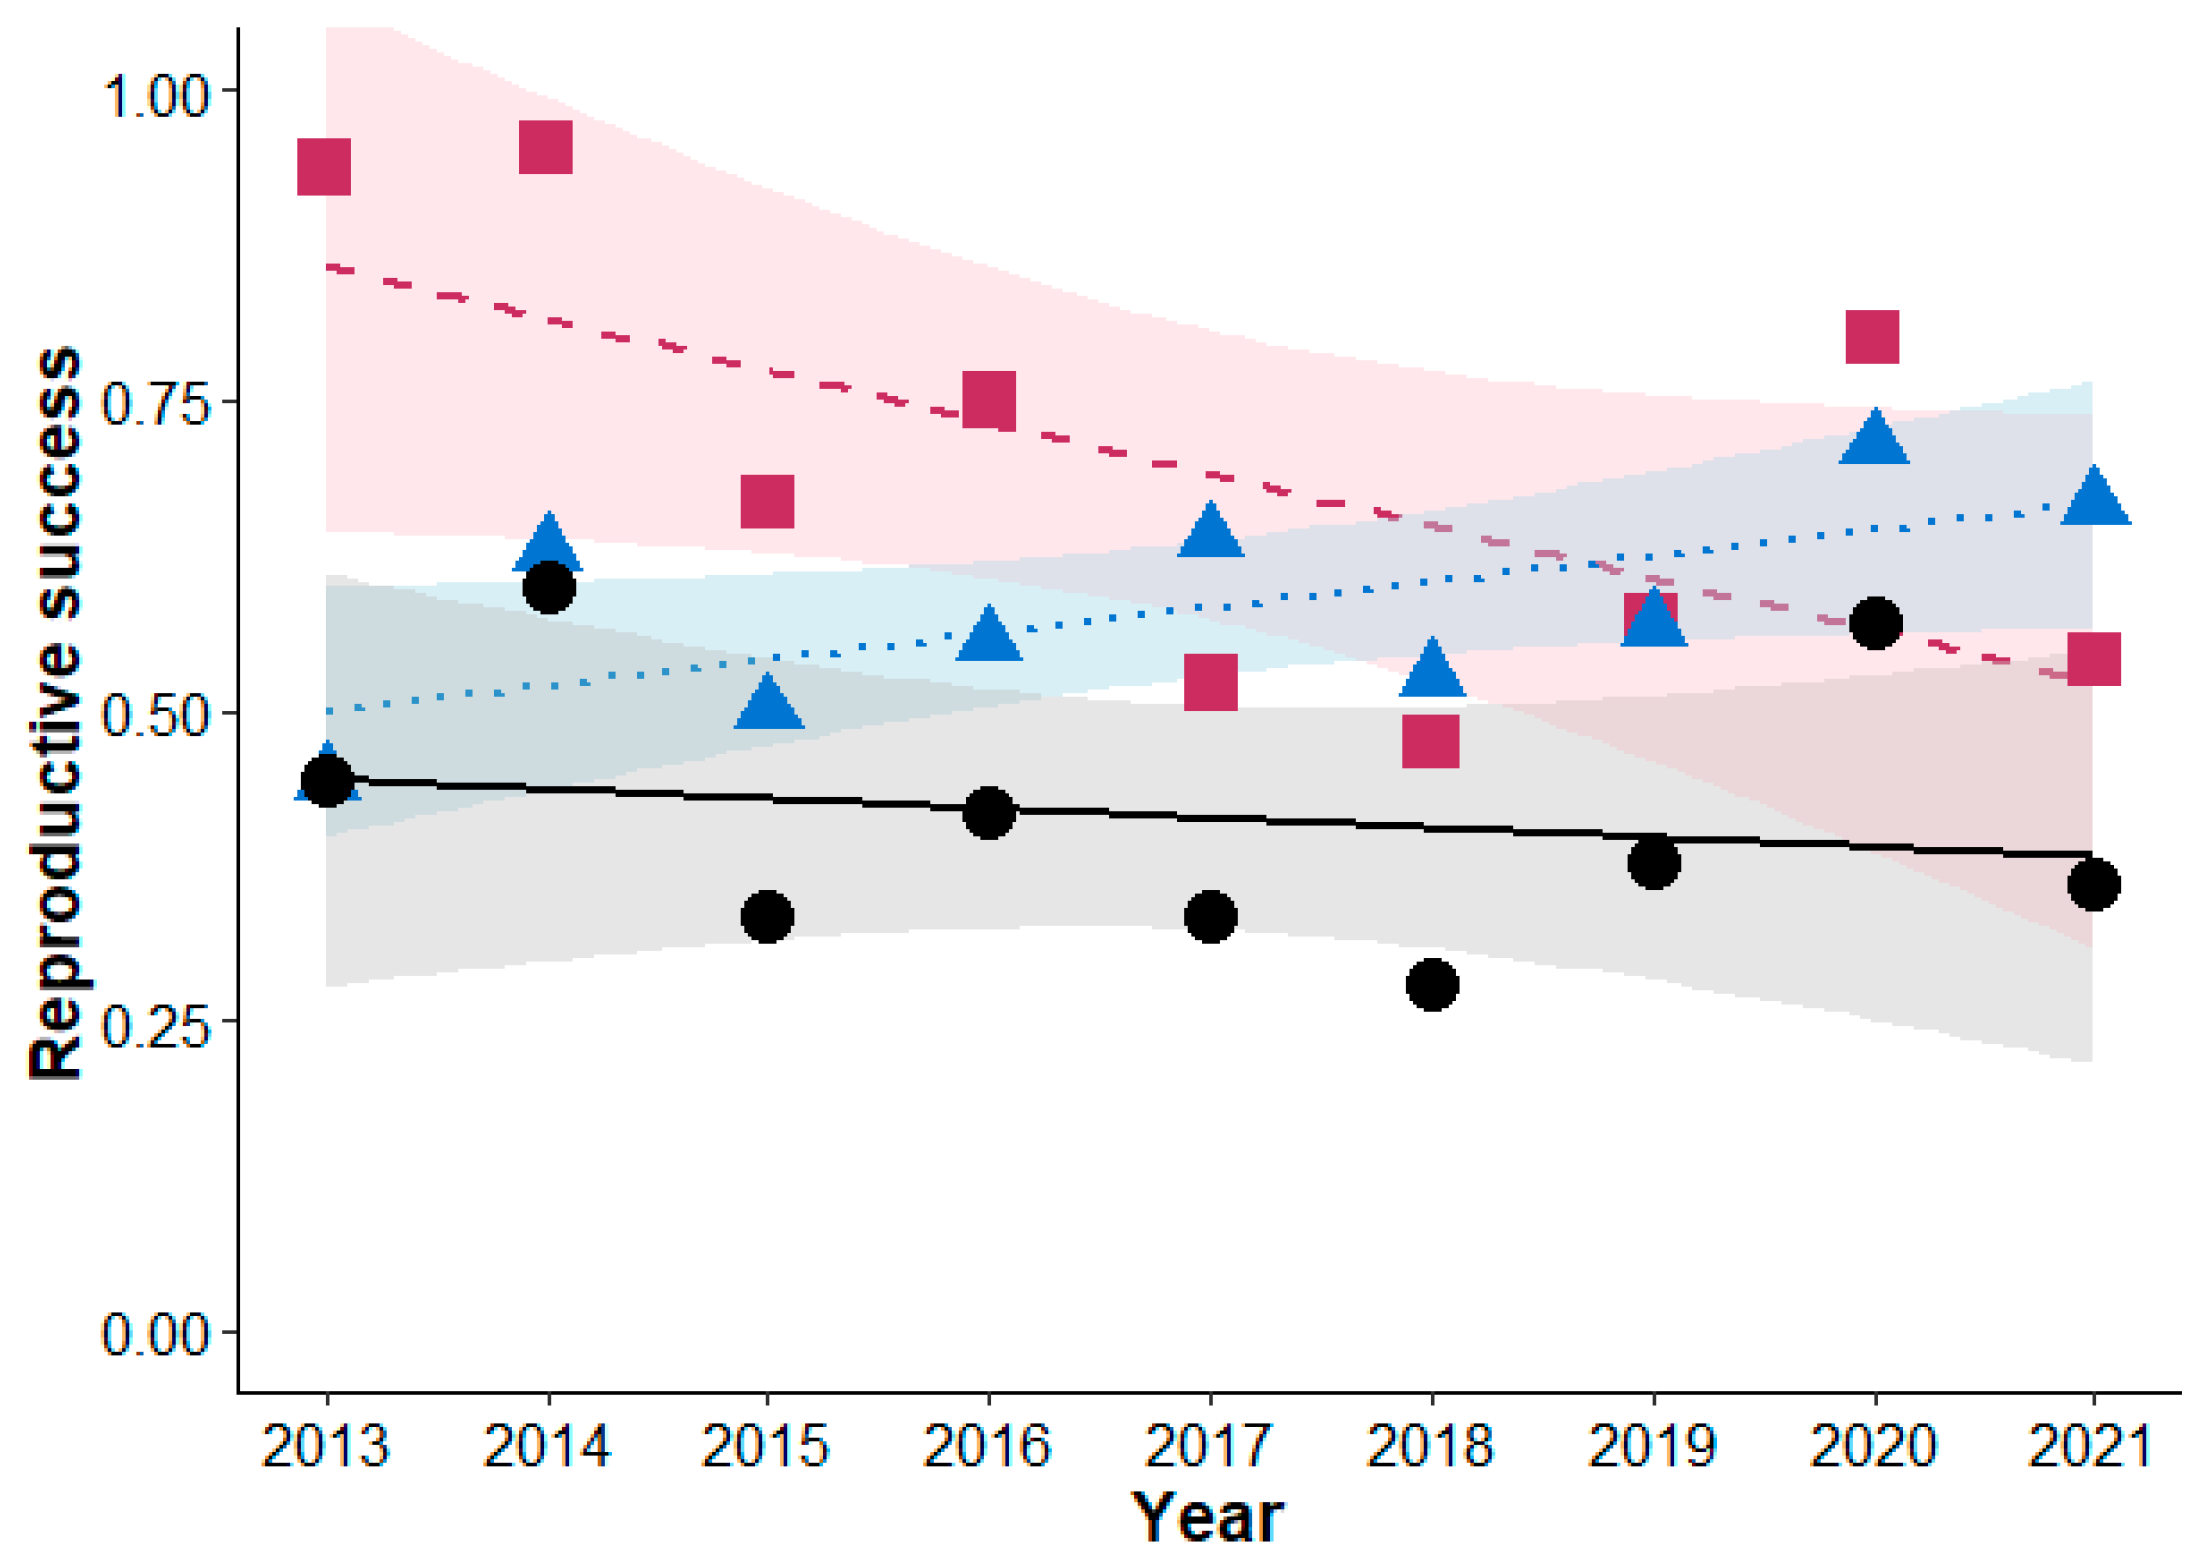
3.2. Reproductive Performance

From 2013 to 2021, an average of 58.3 ± 8.6% of Golden Eagle pairs initiated breeding annually, with 69.1 ± 18.0% successfully completing it. On average, 0.41 ± 0.11 young were produced annually per occupied territory. Breeding frequency showed a tendency to increase (slope = 0.02 ± 0.01; F1,7 = 5.5, p = 0.052), while breeding success declined during the study period (slope = −0.04 ± 0.02, F1,7 = 4.8, p = 0.064; Figure 4). No significant trend was observed in productivity (F1,7 = 0.3, p = 0.61).
The best model explaining interannual variation in productivity included a positive association with the residuals of Capercaillie and Roe Deer’s linear trends (Table 2). In other words, years with higher productivity also featured a higher share of these two species in the diet. Similar variables were included in the best model explaining breeding success, although the model remained below the significance threshold (Table 2). The best model explaining breeding frequency included a positive association with the share of White-fronted Goose and a negative association with the share of hares (Table 2). Comparable models were obtained for the long-term associations between reproductive performance and the raw values of prey species’ shares; however, only the model for breeding frequency was significant (Table 3).

4. Discussion

The peatland-associated Estonian population of Golden Eagles primarily prey upon birds, a characteristic observed in the lowlands of Eastern Europe [10]. This region, where Golden Eagles predominantly breed in pine-dominated forests near extensive, open mires, has been previously studied in Finland [17,18] and Belarus [24,25]. Similar to these regions, the main prey group is grouse, constituting 30.6% in Estonia, 43.3% in Belarus, and 51.2% in central Finland. This is in line with the general observation that medium-sized prey species, ranging between 0.5 and 4 kg, are optimal during the breeding season [10,12]. Due to the lower share of grouse and the absence of other dominant species in the diet, the food niche is considerably broader in Estonia (6.6) compared to Central Finland (2.7) and Belarus (3.4), as well as most previously studied regions [10] (but see [17,24] for values calculated using a different method). Interestingly, the food niche appears to have remained consistently broad over time in Estonia, as a similar value (6.4) was recorded nearly a century ago [10,23].
In Estonia, the primary prey species was the Black Grouse, comprising 23.9% of prey numbers. Notably, this proportion falls between those observed in Central Finland (19.6% [17]) and Belarus (32.5% [25]). In comparison with the two southern regions, Capercaillie holds higher importance in Finland [17], akin to northern Sweden [16]. Intriguingly, Golden Eagles in eastern European peatlands consistently catch large avian prey such as the Common Crane (4.5% in Estonia [this study], 3.5% in Central Finland [17], and 3.5% in Belarus [25], also recorded in Latvia [26]). Among mammals, hares played a significant role in the Golden Eagles’ diet in Estonia, particularly in the later years of the study period (Figure 2). Hares seem to be paramount to grouse in Finland [17], and they also form the most important prey in Belarus [25] and Sweden [16]. In Gotland, a Swedish island just 150 km west of Estonia but with different lowland-type foraging habitats such as pastures and shorelands, rare hares are replaced by rabbits and hedgehogs, and the absence of grouse is compensated by waterfowl [16,43]. Notably, Zastrov [23] previously reported a high proportion (42.5%) of hedgehogs in Estonia. However, our sample did not include any hedgehogs, suggesting that Zastrov’s earlier finding, based on a small sample (133 items from four nests [23]), likely reflected the specific diet of particular pairs.
Over the long term, the abundance of both hare species, particularly the Mountain Hare, has been declining in Estonia since at least the early 1990s [28]. Although the Brown Hare has experienced some recovery, the number of Mountain Hares, prevalent in Estonian wilderness areas and thus more frequently preyed upon by Golden Eagles, has remained extremely low. Similarly, the Black Grouse (as well as the Capercaillie) has been on a declining trend. While the Golden Eagle may replace Black Grouse with hares in the long term (as observed in Finland [17]), this may not be sufficient, given the slow recovery rate of hares in Estonia [28]. Randla and Tammur [29] proposed that in Estonia, both the unstable availability of Mountain Hare and Black Grouse may be compensated by the Common Crane, Raccoon Dog, Mallard, and carrion. This hypothesis is supported by the current study.
The reproductive performance characteristics of Golden Eagles in Estonia, where 58% of pairs initiated breeding and 69% completed it successfully, resulting in an average of 0.4 young per pair, were lower than estimates from other populations across the global range [10,20,34]. This suggests poor breeding conditions, likely associated with food scarcity [4]. This conclusion is supported by the observed broad diet width [10]. Importantly, although breeding frequency tended to increase and breeding success (along with productivity) tended to decline, both characteristics have remained stable over the long term (1995–2023) in Estonia [G. Sein, unpubl. data].
All evaluated characteristics of breeding performance displayed strong interannual variation. Moreover, three-year cycles in breeding frequency suggest an association with certain prey items exhibiting similar abundance cycles. Voles, with their periodic abundance cycles every 3–4 years in Estonia [44], emerge as potential candidates to drive these cycles. While voles themselves may not be significant prey for Golden Eagles [43], their abundance influences the diet composition and reproductive success of mesopredators such as Red Fox, and therewith impacting grouse and hares, which are the primary prey of Golden Eagles. We do not have sufficient data on vole abundance during the study period (the countrywide monitoring of small mammals only started in 2016 in Estonia), and we did not detect any periodicity nor any significant associations between fluctuations in the proportion of grouse or hares in the diet and those concerning reproductive performance. However, in northern Sweden, the annual production of the Golden Eagle population correlated with changes in vole abundance, as well as those of hares and grouse [13,20], although clear periodicity was not detected [20]. A similar relationship has been established for North American Golden Eagles, whose reproductive success often follows the cycles of leporid prey [14,45,46]. For instance, the abundance of hares influenced both the number of eagles that laid eggs and the number of eagles that produced fledglings in Alaska [19].
In the current study, interannual variation in reproductive performance (i.e., residuals of the linear trend) showed no association with the proportion of Black Grouse in the diet. The absence of an association with this primary prey species, often observed in earlier studies, is surprising and may indicate the decreasing importance of the Black Grouse for the Golden Eagle, a consequence of the long-term decrease in Black Grouse abundance [31]. The same holds true for hares, especially Mountain Hare, whose numbers have remained stable at a very low level since a severe decline in the early 1990s [28]. Although the share of hares increased during the study period, this might be a poor replacement in Estonia, as the share of hares was negatively associated with breeding frequency. The decline in Black Grouse and the persistent low levels of hares, particularly the Mountain Hare, may be indicative of the importance of compensatory prey items such as the Common Crane, Raccoon Dog, Mallard, and carrion for Golden Eagles in Estonia, as suggested by Randla and Tammur [29]. However, further discussion on the long-term associations extends beyond the current nine-year study.
Conversely, another grouse species, the Capercaillie, along with the White-fronted Goose, hares, and the Roe Deer, appears to drive interannual variation in reproductive success. The share of the Capercaillie has remained stable over the years, while the importance of Roe Deer and the White-fronted Goose is on the rise. This increase is a clear reflection of the continuously growing numbers of staging White-fronted Goose and the recovery of Estonian Roe Deer abundance after the population crash in 2009–2011 [28].
In this study, our focus was on associations at the population level. Although we examined the diet of successful pairs, it cannot be ruled out that our results may not only reflect temporal changes in prey abundance or availability for particular pairs. Instead, it might also indicate spatial variability between individual pairs breeding successfully in different years. However, the outcome at the population level remains consistent: temporal variability in diet composition among successful pairs. A follow-up study at the individual level is imperative, especially if the diet of unsuccessful pairs can be examined.

Supplementary Materials

The following supporting information can be downloaded at: https://www.mdpi.com/article/10.3390/d16010069/s1. Table S1: Diet composition of the Golden Eagle by prey species in Estonia in 2013–2021.

Author Contributions

Conceptualization, G.S. and Ü.V.; methodology, G.S. and Ü.V.; validation, G.S. and Ü.V.; formal analysis, Ü.V.; investigation, G.S. and Ü.V.; resources, G.S.; data curation, G.S.; writing—original draft preparation, Ü.V.; writing—review and editing, G.S. and Ü.V.; visualization, G.S. and Ü.V.; supervision, Ü.V.; project administration, G.S.; funding acquisition, G.S. All authors have read and agreed to the published version of the manuscript.

Funding

This research was funded by the Estonian Eagle Club, the Estonian Environmental Investments Fund, and the Estonian University of Life Sciences (grant number P180271).

Institutional Review Board Statement

Not applicable.

Data Availability Statement

The Supplementary Data analyzed in this study are available in Supplementary Table S1.

Acknowledgments

Elena Chaadaeva, Jaan Grosberg, Kristo Lauk, Triin Leetmaa, Pelle Mellov, Vasiliy Pchelintsev, Urmas Sellis, and several other people assisted us in the identification of prey remains. The comments from the two anonymous reviewers helped to improve the manuscript.

Conflicts of Interest

The authors declare no conflicts of interest.

References

  1. Mills, L.S. Conservation of Wildlife Populations: Demography, Genetics, and Management; Wiley-Blackwell: New York, NY, USA, 2006; ISBN 978-1-4051-2146-0. [Google Scholar]
  2. Fryxell, J.M.; Sinclair, A.R.E.; Caughley, G. Wildlife Ecology, Conservation, and Management; Wiley-Blackwell: Oxford, UK, 2014; ISBN 978-1-118-29107-8. [Google Scholar]
  3. Williams, G.E. Natural Selection, the Costs of Reproduction, and a Refinement of Lack’s Principle. Am. Nat. 1966, 100, 687–690. [Google Scholar] [CrossRef]
  4. Newton, I. Population Limitation in Birds; Academic Press: Cambridge, MA, USA, 1998; ISBN 978-0-08-087923-9. [Google Scholar]
  5. Newton, I. Population Ecology of Raptors; T & AD Poyser: Berkhamsted, UK, 1979; ISBN 978-0-85661-023-3. [Google Scholar]
  6. Erikstad, K.E.; Fauchald, P.; Tveraa, T.; Steen, H. On the Cost of Reproduction in Long-Lived Birds: The Influence of Environmental Variability. Ecology 1998, 79, 1781–1788. [Google Scholar] [CrossRef]
  7. Hanski, I.; Hansson, L.; Henttonen, H. Specialist Predators, Generalist Predators, and the Microtine Rodent Cycle. J. Anim. Ecol. 1991, 60, 353–367. [Google Scholar] [CrossRef]
  8. Korpimäki, E.; Hongisto, K.; Masoero, G.; Laaksonen, T. The Difference between Generalist and Specialist: The Effects of Wide Fluctuations in Main Food Abundance on Numbers and Reproduction of Two Co-Existing Predators. J. Avian Biol. 2020, 51, e02508. [Google Scholar] [CrossRef]
  9. Whitfield, D.P.; Reid, R.; Haworth, P.F.; Madders, M.; Marquiss, M.; Tingay, R.; Fielding, A.H. Diet Specificity Is Not Associated with Increased Reproductive Performance of Golden Eagles Aquila Chrysaetos in Western Scotland. Ibis 2009, 151, 255–264. [Google Scholar] [CrossRef]
  10. Watson, J. The Golden Eagle; T & AD Poyser: London, UK, 1997; ISBN 0-85661-099-2. [Google Scholar]
  11. Bedrosian, G.; Watson, J.W.; Steenhof, K.; Kochert, M.N.; Preston, C.R.; Woodbridge, B.; Williams, G.E.; Keller, K.R.; Crandall, R.H. Spatial and Temporal Patterns in Golden Eagle Diets in the Western United States, with Implications for Conservation Planning. J. Raptor Res. 2017, 51, 347–367. [Google Scholar] [CrossRef]
  12. Schweiger, A.; Fünfstück, H.-J.; Beierkuhnlein, C. Availability of Optimal-Sized Prey Affects Global Distribution Patterns of the Golden Eagle Aquila Chrysaetos. J. Avian Biol. 2015, 46, 81–88. [Google Scholar] [CrossRef]
  13. Nyström, J.; Ekenstedt, J.; Angerbjörn, A.; Thulin, L.; Hellström, P.; Dalén, L. Golden Eagles on the Swedish Mountain Tundra—Diet and Breeding Success in Relation to Prey Fluctuations. Ornis Fenn. 2006, 83, 145–152. [Google Scholar]
  14. Steenhof, K.; Kochert, M.N.; Mcdonald, T.L. Interactive Effects of Prey and Weather on Golden Eagle Reproduction. J. Anim. Ecol. 1997, 66, 350–362. [Google Scholar] [CrossRef]
  15. Tjemberg, M. Prey Abundance and Reproductive Success of the Golden Eagle Aquila Chrysaetos in Sweden. Ecography 1983, 6, 17–23. [Google Scholar] [CrossRef]
  16. Tjernberg, M. Diet of the Golden Eagle Aquila Chrysaetos during the Breeding Season in Sweden. Ecography 1981, 4, 12–19. [Google Scholar] [CrossRef]
  17. Sulkava, S.; Huhtala, K.; Rajala, P.; Tornberg, R. Changes in the Diet of the Golden Eagle Aquila Chrysaetos and Small Game Populations in Finland in 1957–96. Ornis Fenn. 1999, 76, 1–16. [Google Scholar]
  18. Sulkava, S.; Huhtala, K.; Rajala, P. Diet and Breeding Success of the Golden Eagle in Finland 1958–82. Ann. Zool. Fenn. 1984, 21, 283–286. [Google Scholar]
  19. Mcintyre, C.L.; Schmidt, J.H. Ecological and Environmental Correlates of Territory Occupancy and Breeding Performance of Migratory Golden Eagles Aquila Chrysaetos in Interior Alaska. Ibis 2012, 154, 124–135. [Google Scholar] [CrossRef]
  20. Moss, E.H.R.; Hipkiss, T.; Oskarsson, I.; Häger, A.; Eriksson, T.; Nilsson, L.-E.; Halling, S.; Nilsson, P.-O.; Hörnfeldt, B. Long-Term Study of Reproductive Performance in Golden Eagles in Relation to Food Supply in Boreal Sweden. J. Raptor Res. 2012, 46, 248–257. [Google Scholar] [CrossRef]
  21. Schmidt, J.H.; McIntyre, C.L.; Roland, C.A.; MacCluskie, M.C.; Flamme, M.J. Bottom-up Processes Drive Reproductive Success in an Apex Predator. Ecol. Evol. 2018, 8, 1833–1841. [Google Scholar] [CrossRef] [PubMed]
  22. Randla, T. Estonian Birds of Prey; Valgus: Tallinn, Estonia, 1976. [Google Scholar]
  23. Zastrov, M. Om Kungsörnens (Aquila Chr. chrysaetos L.) Utbredning Och Biologi i Estland. Vår Fågelvärld 1946, 5, 64–80. [Google Scholar]
  24. Ivanovsky, V.V. Trophic Links Between Birds of Prey and Their Preys and Their Competitors in Wetlands During Nesting Period. Raptors Conserv. 2019, 38, 15–22. [Google Scholar] [CrossRef]
  25. Ivanovsky, V.V. Birds of Prey of Belarussian Lakeland; VGU P.M. Masherova: Vicebsk, Belarus, 2012. [Google Scholar]
  26. Bergmanis, U. Klinšu Ērgla Aquila Chrysaetos Atgriešanās Teiču Purvā. Putni Dabā 2000, 10, 6–11. [Google Scholar]
  27. Lõhmus, A.; Leivits, M.; Pēterhofs, E.; Zizas, R.; Hofmanis, H.; Ojaste, I.; Kurlavičius, P. The Capercaillie (Tetrao Urogallus): An Iconic Focal Species for Knowledge-Based Integrative Management and Conservation of Baltic Forests. Biodivers. Conserv. 2017, 26, 1–21. [Google Scholar] [CrossRef]
  28. Veeroja, R.; Männil, P.; Jõgisalu, I.; Kübarsepp, M. Status of Game Populations in Estonia and Proposal for Hunting in 2023; Estonian Environment Agency: Tartu, Estonia, 2023. [Google Scholar]
  29. Randla, T.; Tammur, E. Population Trends and Breeding Success of the Golden Eagle Aquila Chrysaetos in Estonia, 1935–1991. In Eagle Studies; WWGBP: Berlin, Germany; London, UK; Paris, France, 1996; pp. 483–487. [Google Scholar]
  30. Elts, J.; Leito, A.; Leivits, A.; Luigujõe, L.; Mägi, E.; Nellis, R.; Nellis, R.; Ots, M.; Pehlak, H. Status and Numbers of Estonian Birds, 2008–2012. Hirundo 2013, 26, 80–112. [Google Scholar]
  31. Elts, J.; Leito, A.; Leivits, M.; Luigujõe, L.; Nellis, R.; Ots, M.; Tammekänd, I.; Väli, Ü. Status and Numbers of Estonian Birds, 2013–2017. Hirundo 2019, 32, 1–39. [Google Scholar]
  32. Lõhmus, A. Selection of Foraging Habitats by Birds of Prey in North-Western Tartumaa. Hirundo 2001, 14, 27–42. [Google Scholar]
  33. Sein, G.; Lõhmus, A. Nest-stand and Nest-tree Characteristics of the Golden Eagle in Estonia. Hirundo 2006, 19, 68–80. [Google Scholar]
  34. Svensson, L.; Mullarney, K.; Zetterström, D.; Grant, P.J. Bird Guide: The Most Complete Guide to the Birds of Britain and Europe, 2nd ed.; Harper Collins: London, UK, 2009; ISBN 978-0-00-726814-6. [Google Scholar]
  35. Macdonald, D.W.; Barrett, P. Mammals of Britain & Europe; Harper Collins: London, UK, 1993; ISBN 978-0-00-219779-3. [Google Scholar]
  36. Siivonen, L.; Sulkava, S. Pohjolan Nisäkkäät; Otava: Keuruu, Finland, 1994; ISBN 978-9-51-113004-8. [Google Scholar]
  37. Haase, A.; Schlusen, J.; Schwenk, K. Featherbase. Available online: https://www.featherbase.info (accessed on 3 December 2023).
  38. Schubert, S. Vogelfedern—Die Seite Als Bestimmungshilfe Für Mauserfedern Und Rupfungen. Available online: http://www.vogelfedern.de/ (accessed on 3 December 2023).
  39. Levins, R. Evolution in Changing Environments: Some Theoretical Explorations; Princeton University Press: Princeton, NJ, USA, 1968; ISBN 978-0-691-08062-8. [Google Scholar]
  40. Kumari, E. Birds of Estonian SSR; Eesti Riiklik Kirjastus: Tallinn, Estonia, 1954. [Google Scholar]
  41. Aul, J.; Ling, H.; Paaver, K. Mammals of Estonian SSR; Eesti Riiklik Kirjastus: Tallinn, Estonia, 1957. [Google Scholar]
  42. R Core Team R: A Language and Environment for Statistical Computing; R Foundation for Statistical Computing: Vienna, Austria, 2023.
  43. Högström, S.; Wiss, L.-E. Diet of the Golden Eagle Aquila chrysaetos (L.) in Gotland, Sweden during the Breeding Season. Ornis Fenn. 1992, 69, 39–44. [Google Scholar]
  44. Lõhmus, A. Vole-Induced Regular Fluctuations in the Estonian Owl Populations. Ann. Zool. Fenn. 1999, 36, 167–178. [Google Scholar]
  45. McIntyre, C.L. Patterns in Nesting Area Occupancy and Reproductive Success of Golden Eagles (Aquila Chrysaetos) in Denali National Park and Preserve, Alaska, 1988–1999. J. Raptor Res. 2002, 36, 50–54. [Google Scholar]
  46. McIntyre, C.L.; Adams, L.G. Reproductive Characteristics of Migratory Golden Eagles in Denali National Park, Alaska. Condor 1999, 101, 115–123. [Google Scholar] [CrossRef]
Figure 1. Proportions in (a) numbers and (b) biomass of the main prey groups in the diet of the Golden Eagle in Estonia in 2013–2021.
Diversity 16 00069 g001
Figure 2. Significantly increasing or decreasing trends in the proportions of (a) birds (orange circles indicate Black Grouse and blue circles indicate White-fronted goose) and (b) mammals (green circles indicate hares and yellow circles indicate Roe Deer) in the diet of Estonian Golden Eagles in 2013–2021. Lines indicate linear trends and dashed areas are the 95% confidence intervals of the trends.
Diversity 16 00069 g002
Figure 3. Correlations between interannual fluctuations (residuals of linear trends) of the main prey species. The color and size of the circles indicate the direction and the strength of the correlations.
Diversity 16 00069 g003
Figure 4. Dynamics of reproductive success in Estonian Golden Eagles in 2013–2021. Productivity is represented as black circles, breeding frequency is represented as blue triangles, and breeding success is represented as maroon boxes. Lines indicate linear trends and dashed areas are the 95% confidence intervals of the trends.
Diversity 16 00069 g004
Table 1. Proportions of main Golden Eagle prey items (forming > 1% of the biomass), the annual and mean values of Levins’ index (food niche breath), and the sample sizes in Estonia, 2013–2021.
Numbers (N)Biomass (B)Mean (N)Mean (B)
201320142015201620172018201920202021201320142015201620172018201920202021
Black GrouseTetrao tetrix24.333.532.031.022.519.120.713.218.918.324.821.622.716.813.513.88.011.823.916.8
HaresLepus sp.6.54.36.77.54.810.710.19.79.813.08.512.114.79.620.218.015.716.37.814.2
Common CraneGrus grus5.92.13.63.35.94.63.84.76.418.06.19.99.817.713.110.211.516.24.512.5
CapercaillieTetrao urogallus3.27.25.25.16.44.67.67.04.26.414.09.29.912.68.513.311.26.85.610.2
MallardAnas platyrchynchos12.410.56.28.712.812.28.96.29.58.77.23.96.08.98.15.53.55.59.86.4
White-fronted gooseAnser albifrons0.53.92.63.03.74.65.17.96.80.96.33.84.86.17.17.310.59.24.26.3
Racoon DogNyctereutes procyonoides1.16.25.25.72.13.14.64.43.01.810.17.79.33.54.86.95.94.23.96.0
Roe DeerCapreolus capreolus1.11.21.51.21.12.31.73.84.23.64.14.63.93.57.25.010.311.52.06.0
RavenCorvus corax7.07.44.17.87.511.55.97.06.45.55.72.96.05.88.54.14.54.27.25.2
Pine MartenMartes martes5.93.76.23.67.52.34.28.56.14.82.94.52.86.01.73.05.54.05.33.9
Bean GooseAnser fabalis0.51.02.61.50.00.01.72.62.31.22.35.33.30.00.03.44.84.31.42.8
Red FoxVulpes vulpes3.20.61.00.90.00.01.31.81.15.41.01.51.50.00.01.92.41.61.11.7
Food niche breath (Levins’ index)6.64.65.35.56.77.76.58.87.5 6.6
Sample size1854861943187131237341264185486194332187131237341264
Number of nests122716211210142016122716211210142016
Table 2. Best linear models explaining interannual variation in reproductive performance in Estonian Golden Eagles in 2013–2021. The linear models were compiled using the residuals of the raw linear trends presented in Figure 2.
Estimate ± SEtp
Productivity
F2,6 = 6.53, R2adj = 0.58, p = 0.032
Capercaillie Tetrao urogallus0.035 ± 0.0113.2380.017
Roe Deer Capreolus capreolus0.055 ± 0.0173.1680.019
Breeding frequency
F2,6 = 40.44, R2adj = 0.91, p < 0.001
White-fronted Goose Anser albifrons0.026 ± 0.0064.4610.004
Hares Lepus sp.−0.012 ± 0.002−4.8490.002
Breeding success
F2,6 = 3.06, R2adj = 0.34, p = 0.121
Capercaillie Tetrao urogallus0.029 ± 0.0181.6740.145
Roe Deer Capreolus capreolus0.069 ± 0.0282.4540.049
Table 3. Best linear models explaining the long-term (2013–2021) temporal changes in the reproductive performance of Estonian Golden Eagles. The linear models were compiled using the raw values presented in Figure 2.
Estimate ± SEtp
Productivity
F3,5 = 2.15, R2adj = 0.30, p = 0.212
Capercaillie Tetrao urogallus0.093 ± 0.0382.4430.058
White-fronted Goose Anser albifrons−0.116 ± 0.055−2.0860.091
Roe Deer Capreolus capreolus0.115 ± 0.0532.1690.082
Breeding frequency
F2,6 = 61.02, R2adj = 0.94, p < 0.001
White-fronted Goose Anser albifrons0.032 ± 0.00311.013<0.001
Hares Lepus sp.−0.011 ± 0.002−4.9810.002
Breeding success
F3,5 = 2.41, R2adj = 0.35, p = 0.182
Capercaillie Tetrao urogallus0.140 ± 0.0612.3200.068
White-fronted Goose Anser albifrons−0.219 ± 0.088−2.4850.055
Roe Deer Capreolus capreolus0.186 ± 0.0842.2130.078
Disclaimer/Publisher’s Note: The statements, opinions and data contained in all publications are solely those of the individual author(s) and contributor(s) and not of MDPI and/or the editor(s). MDPI and/or the editor(s) disclaim responsibility for any injury to people or property resulting from any ideas, methods, instructions or products referred to in the content.

