Article

Presence of Endangered Red-Crowned Parrots (Amazona viridigenalis) Depends on Urban Landscapes

by
Simon Kiacz
1,*,
Hsiao-Hsuan Wang
2 and
Donald J. Brightsmith
3
1
Ecology and Evolutionary Biology, Department of Ecology and Conservation Biology, Texas A&M University, College Station, TX 77843, USA
2
Ecological Systems Laboratory, Department of Ecology and Conservation Biology, Texas A&M University, College Station, TX 77843, USA
3
Department of Veterinary Pathobiology, TAMU 4467, Texas A&M University, College Station, TX 77843, USA
*
Author to whom correspondence should be addressed.
Diversity 2023, 15(7), 878; https://doi.org/10.3390/d15070878
Submission received: 19 June 2023 / Revised: 14 July 2023 / Accepted: 17 July 2023 / Published: 23 July 2023
(This article belongs to the Section Biogeography and Macroecology)

Abstract

:
Many species of plants and animals thrive in urban habitats and stand to gain from the global trend in increased urbanization. One such species, the Red-crowned Parrot (Amazona viridigenalis), is endangered within its native range but seems to thrive in urban landscapes. While populations of endangered synanthropic species may be uncommon, they can act as genetic reservoirs and present us with unique conservation and research opportunities. We sought to determine the red-crowned parrot’s level of dependency on urban areas, as well as the climatic and anthropogenic drivers of their distribution throughout the United States. We built national level species distribution models for the USA using Maxent and correlated presence points derived from field work and citizen science databases to environmental variables for three Red-crowned Parrot populations: two naturalized (California and Florida) and one native (Texas). We found current occupancy to be 18,965 km2 throughout the three states. These three states also contained 39,429 km2 of high- and medium-quality habitats, which, if occupied, would represent a substantial increase in the species range. Suitable habitat showed a strong positive correlation with urbanization in areas where average monthly temperatures were at least 5 °C. The current and predicted distributions of Red-crowned Parrots were closely aligned with urban boundaries. We expected populations of Red-crowned Parrots and other synanthropic species to grow due to a combination of factors, namely, continued urbanization and the effects of climate change, which increase the size and connectivity of a suitable habitat. For some imperiled species, urban habitats could prove to be important bastions for their conservation.

1. Introduction

Urbanization is one of the leading causes of biodiversity loss and can result in habitat degradation and fragmentation [1,2,3]. However, many species of plants and animals can thrive in urban habitats and stand to gain from this conversion [4]. The global trend in increased urbanization is likely to continue for the foreseeable future [2]. Species that thrive in urban areas (synanthropes) are generally viewed as neutral or invasive in terms of their ecological or economic impacts [5]. Synanthropes can be intentionally brought to urban areas (i.e., ornamental plants), can be accidentally introduced (i.e., escaped pets), or can be species naturally expanding their ranges into these novel habitats [6,7,8]. They rarely have declining populations within their native ranges, are infrequently considered to be threatened or endangered, and, as such, are not usually considered to be conservation priorities [4,9]. But, when endangered species are synanthropic and thrive in urban landscapes, we are presented with unique conservation, research, and social opportunities [10,11].
While populations of endangered synanthropic species are uncommon, they can provide valuable information on the natural history of the species and can act as genetic reservoirs or backup populations for possible translocations [10,11]. One endangered synanthropic species, the Red-crowned Parrot (Amazona viridigenalis), is a medium-sized parrot endemic to northeastern Mexico and southern Texas. It has been popular in the domestic and international pet trade [12,13,14], and, like many other parrot species, Red-crowned Parrots have declined in their native range due to threats from the pet trade and habitat destruction [12]. However, three significant populations occur within the United States. Two of these populations, one in southern California and another in southern Florida, are considered naturalized and owe their origins to released or escaped pets. Roughly 3700 individuals make up the California population, whereas a smaller population of an unknown size is found in Florida [15,16]. The third US population is recognized as native by the State of Texas and the United States Fish and Wildlife Service and consists of roughly 675 birds located in the two southernmost Texas counties Hidalgo and Cameron [13].
Some authors have equated urban areas to “arks”, in which endangered species could persist while the drivers of their declines in their native range are remedied [11,17]. However, different species likely depend on urban areas with unique conditions [18,19,20]. To determine the Red-crowned Parrots’ levels of dependency on urban areas, as well as the drivers of their distribution throughout the United States, we utilized the Species Distribution Modeling (SDM) algorithm Maxent which estimates likelihoods of presence under different environmental conditions [21].
Understanding habitat use of threatened species is a prerequisite for identifying where and how to manage and maintain populations, as well as to ascertaining a population’s level of synanthropy [22,23]. Species distribution models correlate climatic and environmental data with areas of known species presence and are useful in determining the drivers that may influence a species’ potential distribution and in predicting geographic regions where a species may occur [24,25,26,27]. Although climate is usually considered the main driver of species distributions [28], many ecologically relevant variables, e.g., land-use variables [29] or edaphic factors [30], have been added to SDMs to increase the predictive abilities of species distributions. As land use has been shown to influence the distribution of animals, we also include land use/cover variables in our models [31,32]. Frequently, SDMs are used to identify critical habitat for species with reduced ranges and predict areas where these species might expand their ranges [30,33]. Coupled with expert knowledge, SDMs have played an important role in determining protected areas for target species important to the maintenance of biodiversity [23,24].
In this study, we produce coarse-scale, national level SDMs for three isolated populations of the Red-crowned Parrot (Amazona viridigenalis) to answer the following questions:
(1)
What is the current geographical range of Red-crowned Parrots in the USA, and what is the potential for range expansion?
(2)
Does a combined model that includes all populations predict presence similarly to individual population models?
(3)
What are the important climatic and environmental (anthropogenic) drivers for Red-crowned Parrot presence in the USA?
(4)
Are all populations of Red-crowned Parrots in the contiguous USA responding to climate and environmental (anthropogenic) variables similarly?

2. Methods

2.1. Occurrence Data

We obtained occurrence data (presence-only records) for Red-crowned Parrots from two sources: sightings entered into the citizen science database eBird [34] and locations from four years of field work in South Texas (2016–2019). Records obtained through eBird and other citizen science databases have been shown to be valuable for building accurate SDMs [35].
The eBird presence records (n = 36,680) were from March 1973 through February 2020. Only the states of California (n = 23,717), Texas (n = 11,956), and Florida (n = 1007) contained presence points for Red-crowned Parrots. We included points from both “complete” and “incomplete” checklists but excluded “random” and “historical” checklists due to their potential inaccuracies. All travelling checklists over 10 km in distance were removed, as were all points with duplicate coordinates and all points located over water. Additionally, we removed all locations of single birds located over 20 km from another presence point, as these likely represented released or escaped pets that were not part of established populations. We then scrutinized the points individually as a final quality check and removed any point that was likely from list-building checklists or placed at a county level. After data refinement, we retained a total of 4784 eBird presence points for use in modeling (n = 2740 California; n = 1826 Texas; n = 217 Florida).
We also included 415 presence locations gathered during field work in South Texas from June 2016 through February 2020. These points consisted of foraging, roosting, and nesting locations and were obtained throughout all four seasons [13]. For the purpose of this nationwide study, all points were lumped and considered as presence only. A fine-scale study comparing specific habitat use of foraging, roosting, and nesting of Red-crowned Parrots in South Texas is currently in preparation.

2.2. Environmental Data

The environmental data we used as potential drivers in our SDMs included climatic variables commonly regarded as important, such as rainfall and temperature data [36,37], as well anthropogenic variables frequently suspected to drive species distribution, including land-use and human density data [38,39].
As variables used in Maxent must have identical cell sizes, we resampled all datasets to a resolution of ~300 m × 300 m using bilinear interpolation for continuous data layers, and nearest neighbors for categorical data, calculated with QGIS V3.12.0. The cell size chosen represented a balance of the original datasets’ grid sizes, which ranged from 1 km to 30 m, and allowed us to easily detail the range of Red-crowned Parrots. Previous studies on parrot distributions generally used rather coarse grid sizes (>1 km) [40,41], so, while 300 m2 may not have been detailed enough to specify tree species or microhabitats, it could adequately describe important drivers of distribution at a broad scale.

2.2.1. Climatic Variables

We used 19 world bioclimatic layers (30 arc-second resolution) that included variables that represented minimum, maximum, and average temperatures and precipitation throughout the seasons, as well as indexes of climatic variance. The bioclimatic variables used were averages from the years 1970–2000 and represented biologically meaningful environmental data [42] (see complete list in Table S1).

2.2.2. Anthropogenic Variables

As a proxy of anthropogenic activity at a landscape level, we included an estimation of human population density during 2015 (30 arc-second resolution, represented as persons per km2) [43]. We also included three land cover layers: (1) the GAP/LANDFIRE National Terrestrial Ecosystems data layer, (2) the National Land Cover Databases (NLCD) land cover data layer, and (3) an urban imperviousness layer [44,45,46,47]. These layers represent land cover and vegetation at a 30 m × 30 m scale and detail the level of developed surfaces such as roads and core urban areas throughout the contiguous United States. Finally, we included percent tree canopy cover estimates from the NLCD [48] as well as a Normalized Difference Vegetation Index (NDVI) derived from early 2020. See Table S1 for a detailed list of all variables used in the modeling process.
Many naturalized parrot populations have been shown to be at least partially reliant on urban parks and the diversity of flora that is associated with human settlements [15,49,50]. To analyze this phenomenon in our current study, we use post hoc analysis to detail land use (urban vs. nonurban) where presence, foraging, nesting, and roosting sites occurred. We utilized a data layer denoting urbanization that considered areas urban if over 50% of land cover consisted of non-vegetated human constructed elements [51,52]. We did not use this binary layer in the SDMs since urban imperviousness and land cover layers provided a more detailed image of urbanization for modeling.

2.3. Species Distribution Modeling

We determined the relationships between environmental variables and Red-crowned Parrot presence using maximum entropy modeling (Maxent V3.4.0) [21]. Maxent is widely used with presence-only data [53] and for modeling nonnative species distributions [54,55].

2.3.1. Model Settings

To detail any potential differences in habitat use among the three US populations, we also created SDMs analyzing each population independently [56,57]. We parameterized four models using presence points from only (1) California (California model), (2) Texas (Texas model), and (3) Florida (Florida model), and (4) using presence points from all three states (combined model).
Maxent considered any cell with at least one presence point within its bound as a “presence” cell, which helped to reduce spatial autocorrelation of presence points. After Maxent removed spatially correlated presence points, the final combined model used 2922 presence locations (eBird and field data combined), including 1995 in the California model, 779 in the Texas model, and 148 in the Florida model.
All models utilized 75% of presence records for training and 25% for testing, which exceeded the minimum recommended number of presence locations (30) for accurate model production [58]. We used default Maxent parameters for all other options. We did not spatially bias background data for pseudo-absence point creation since the presence of Red-crowned Parrots was not limited by any physical or geographical barriers because they are popular in the pet trade and moved by humans throughout the United States [15]. We ran five replicates for each model, utilizing random seeds and bootstrapping during each run. We reported the averages of the 5 replicates (±1 SD) for each of the four models unless otherwise stated below.

2.3.2. Model Evaluation

As a measure of model validity, we used the area under the receiver operating characteristic curve (AUC), which is commonly used for Maxent and other ecological distribution models [59]. Interpretation of the AUC measurements ranged from random (0.5) to perfect (1.0), with values >0.9 considered very good, >0.8 considered good, and <0.8 considered poor [60]. To analyze variable importance and to determine the correlations among similar variables, we used jackknifing [61,62].

2.3.3. Distribution

We use Maxent’s default Cloglog output to estimate occurrence probability [63]. For analyses, including map creation and calculating the area of predicted Red-crowned Parrot presence, we divided habitat suitability into three categories consisting of “High-quality”, “Medium-quality”, and “Unsuitable”. We defined a high-quality habitat as all areas ranking at or above the Cloglog threshold, denoting the 10th percentile training presence (P10). The P10 threshold excluded the bottom 10% of training occurrence points with the lowest predicted habitat suitability. We defined medium-quality habitat as areas with values half of P10 up to P10. We defined all areas below half of the P10 threshold as unsuitable. (High-quality habitat ≥ P10; 0.5 × P10 ≤ medium-quality habitat < P10; unsuitable < 0.5 × P10).
We determined actual distribution by applying a 10 km radius buffer to all presence points. Red-crowned Parrots are known to make daily flights from roost to foraging or nesting areas of roughly 10 km one-way (Kiacz pers. obvs.). Although Red-crowned Parrots can undergo much longer flights [12], we used 10 km to represent a normal daily use range, which excluded long-distance winter foraging flights.
To determine the percent of each habitat class that was currently occupied (high-quality, medium-quality, and unsuitable), we used the predicted presence of the combined model overlaid with current (actual) presence. We made all calculations using RStudio Version 1.2.5033.

3. Results

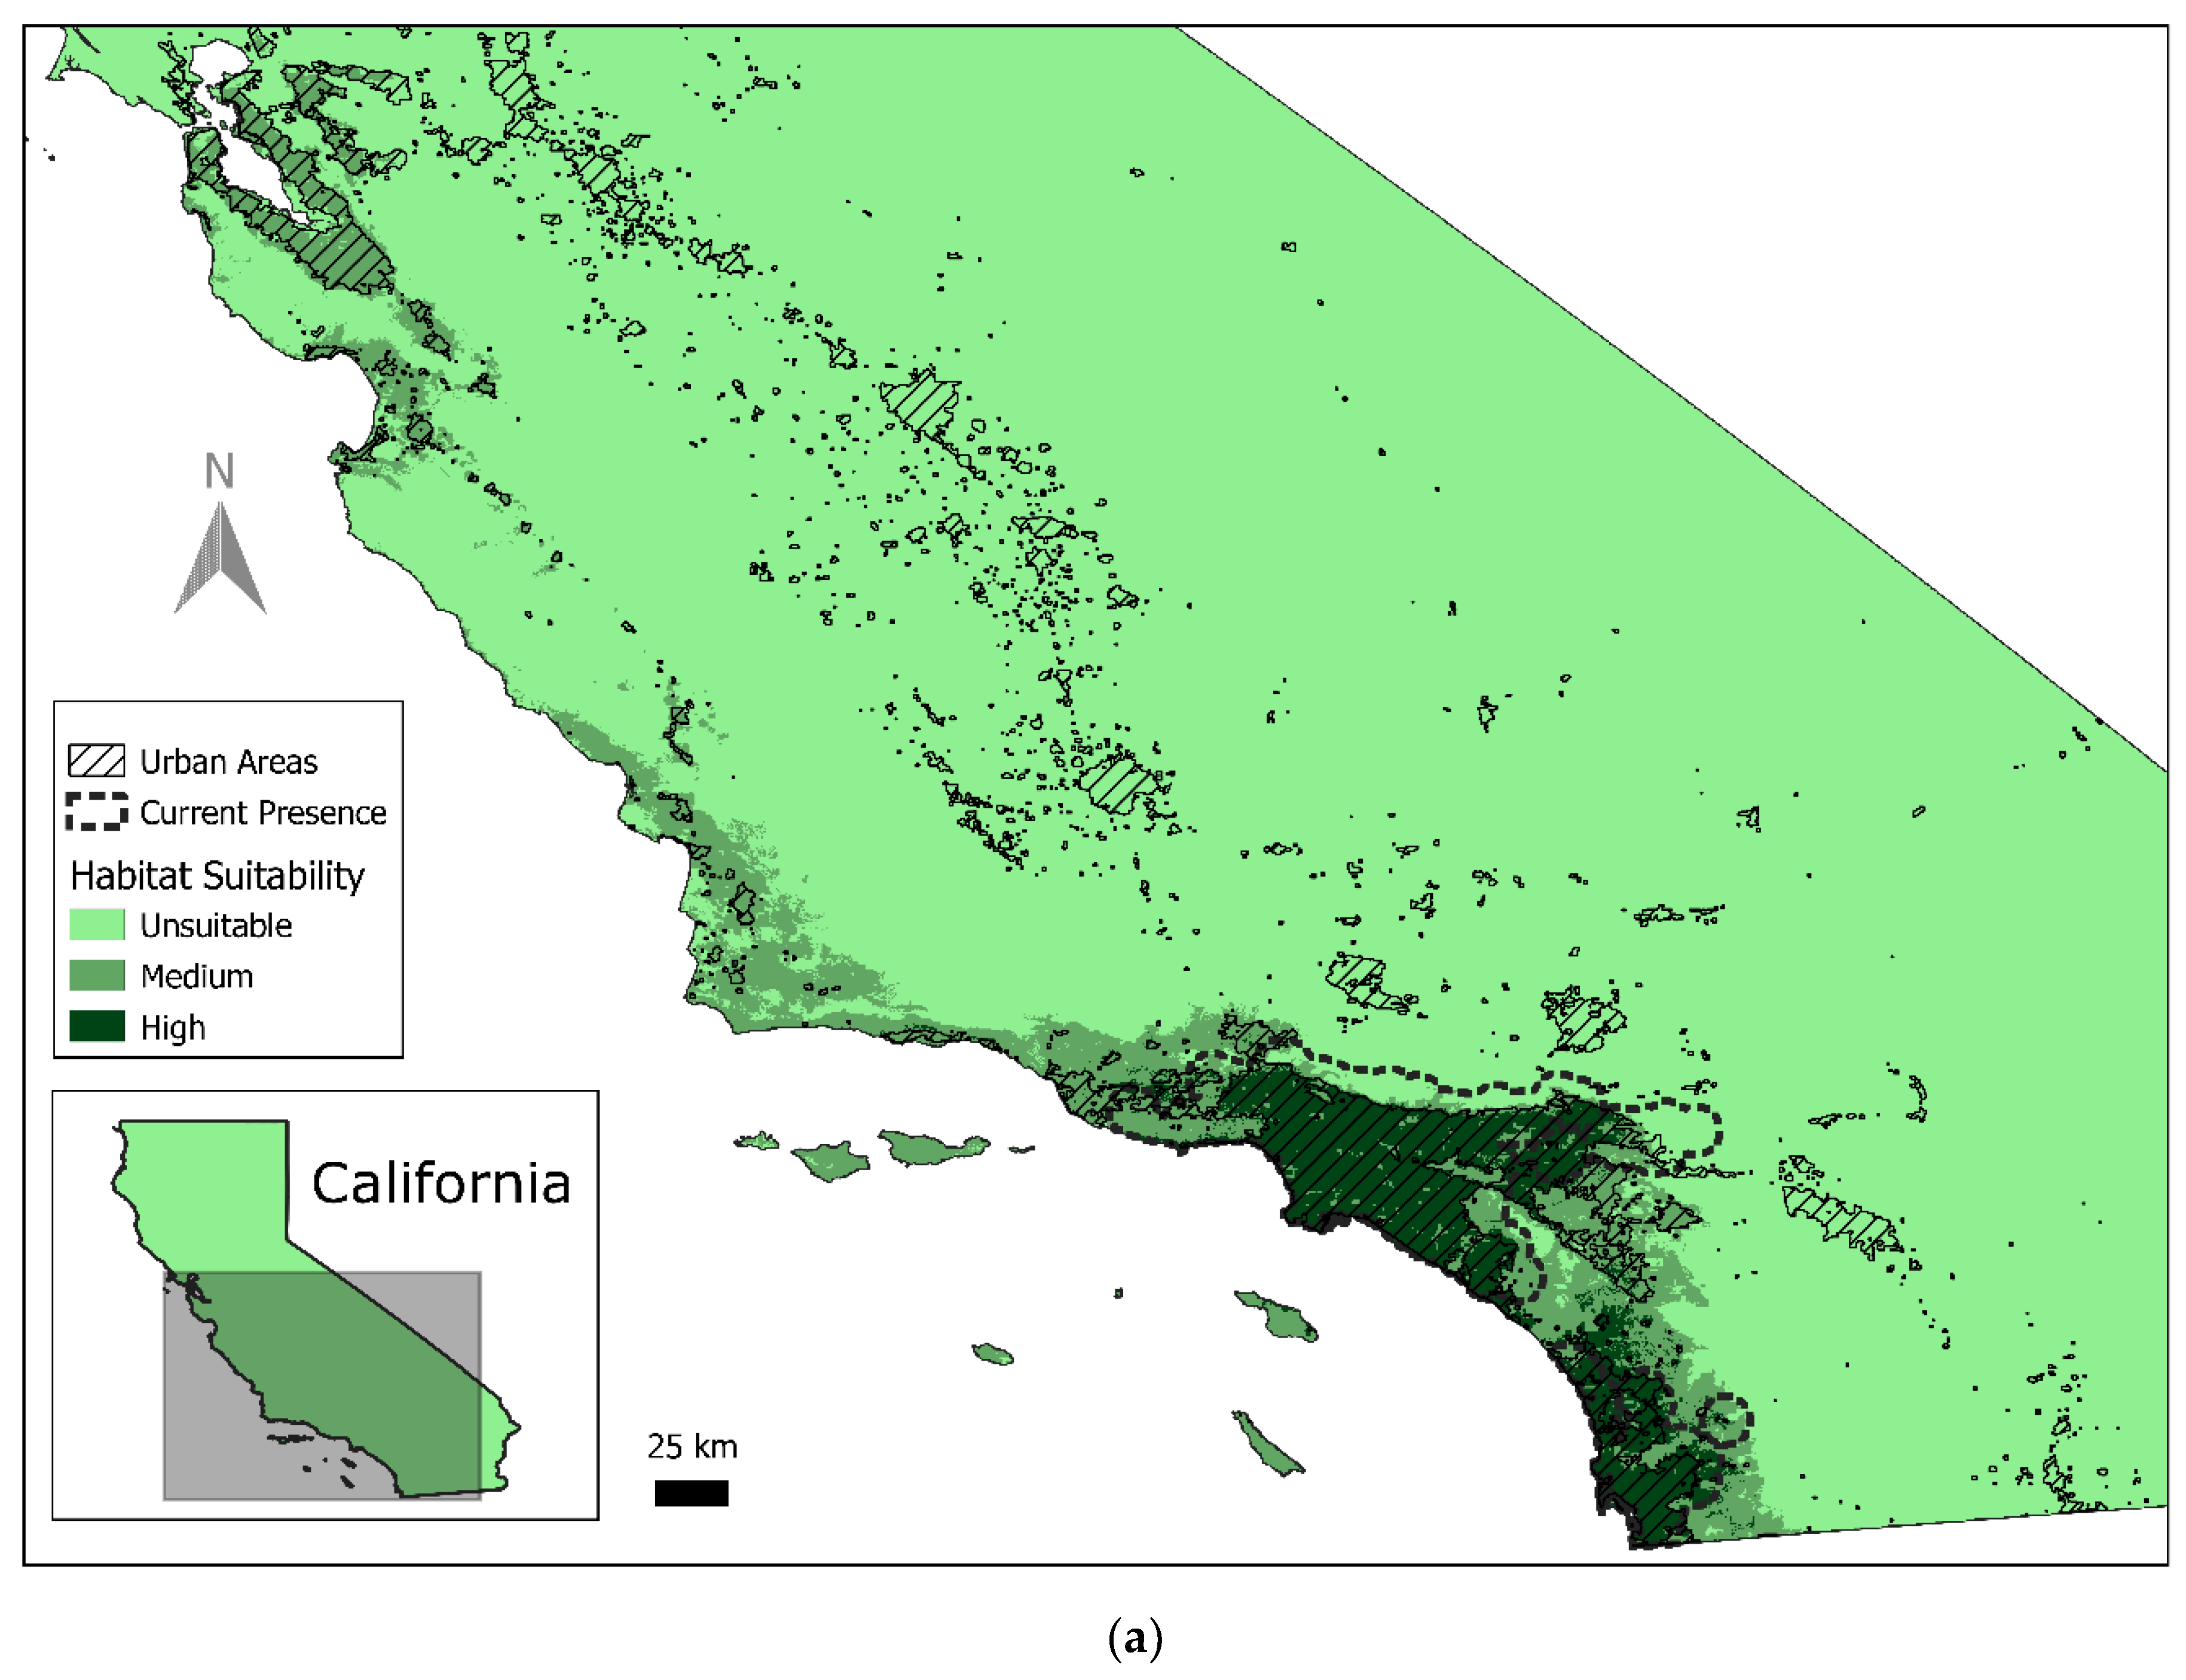
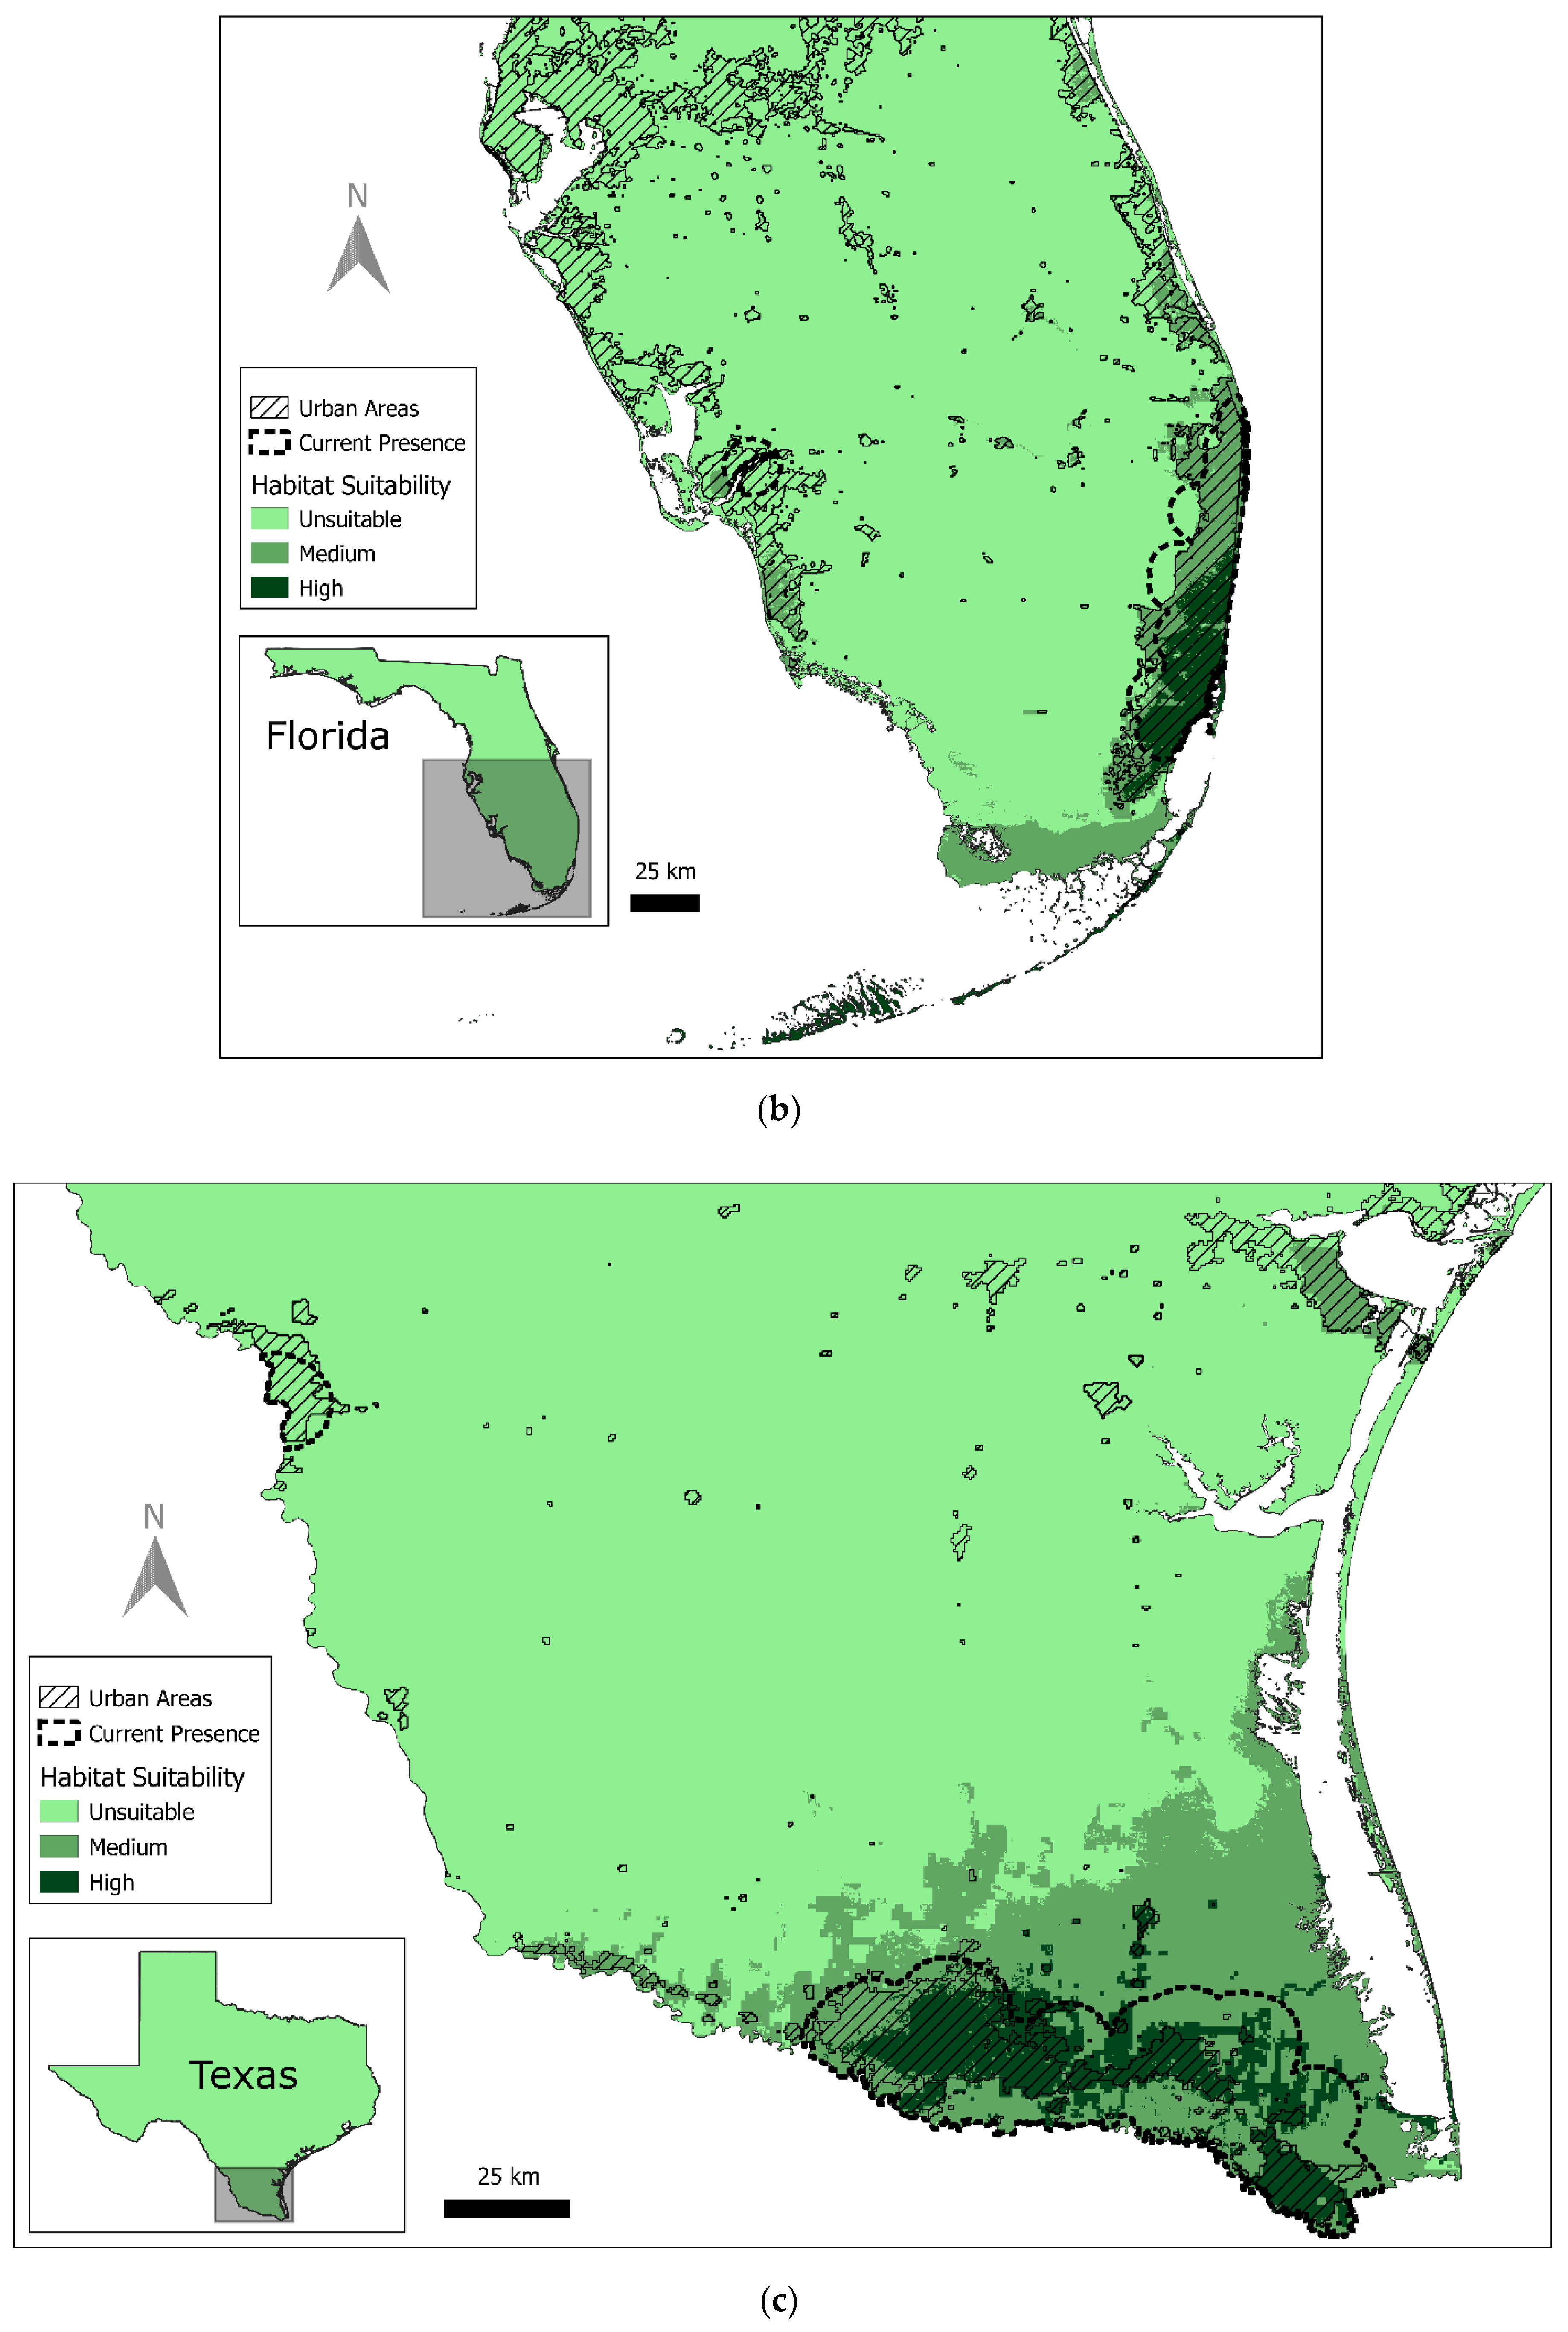
3.1. Current Red-Crowned Parrot Distribution

The current distribution of Red-crowned Parrots in the United States was estimated at 18,965 km2–11,890 km2 (2.9% of state) in California, 3573 km2 (0.5%) in Texas, and 3502 km2 (2.4%) in Florida (Figure 1). Using the combined model, 57% of the current Red-crowned Parrot distribution in California was classified as high-quality habitat, 29% as medium-quality habitat, and 14% as unsuitable habitat. In Texas, 39% of the current distribution was classified as high-quality habitat, 55% as medium-quality habitat, and 6% as unsuitable habitat. In Florida, 37% of the current distribution was classified as high-quality habitat, 39% as medium-quality habitat, and 24% as in unsuitable habitat.
In the combined model, 1950 km2 of high-quality habitat and 21,199 km2 of medium-quality habitat throughout the contiguous USA is unoccupied; 17% of high-quality habitat and 80% of medium-quality habitat in California is unoccupied, 9% of high-quality habitat and 65% of medium-quality habitat in Texas is unoccupied; and 23% of high-quality habitat and 72% of medium-quality habitat in Florida is unoccupied.
Presence points used by the models were distributed almost entirely in urban areas. In California, 92% of all presence points (n = 2740) were in urban areas, in Texas 96% (n = 2241), and in Florida 62% (n = 217). Almost all points not in urban areas were <1 km from the edge of land classified as urban.

3.2. Predicted Habitat Distribution

The combined model predicted 11,463 km2 of high-quality habitat across the contiguous USA (8250 km2 in California; 1523 km2 in Texas; 1690 km2 in Florida) and 27,966 km2 of medium-quality habitat (17,489 km2 in California; 5623 km2 in Texas; 4854 km2 in Florida; Table 1). Models created to predict nationwide habitat suitability by using only one state’s presence locations (state-level models) each gave radically different results, as they predicted high- and medium-quality habitats only in the state from which the presence points originated. For each state-level model, all areas outside the state of origin were predicted as unsuitable. Of note is that the medium- and high-quality areas predicted by single-state models were similar to that state’s predicted area using the combined model (Table 2).

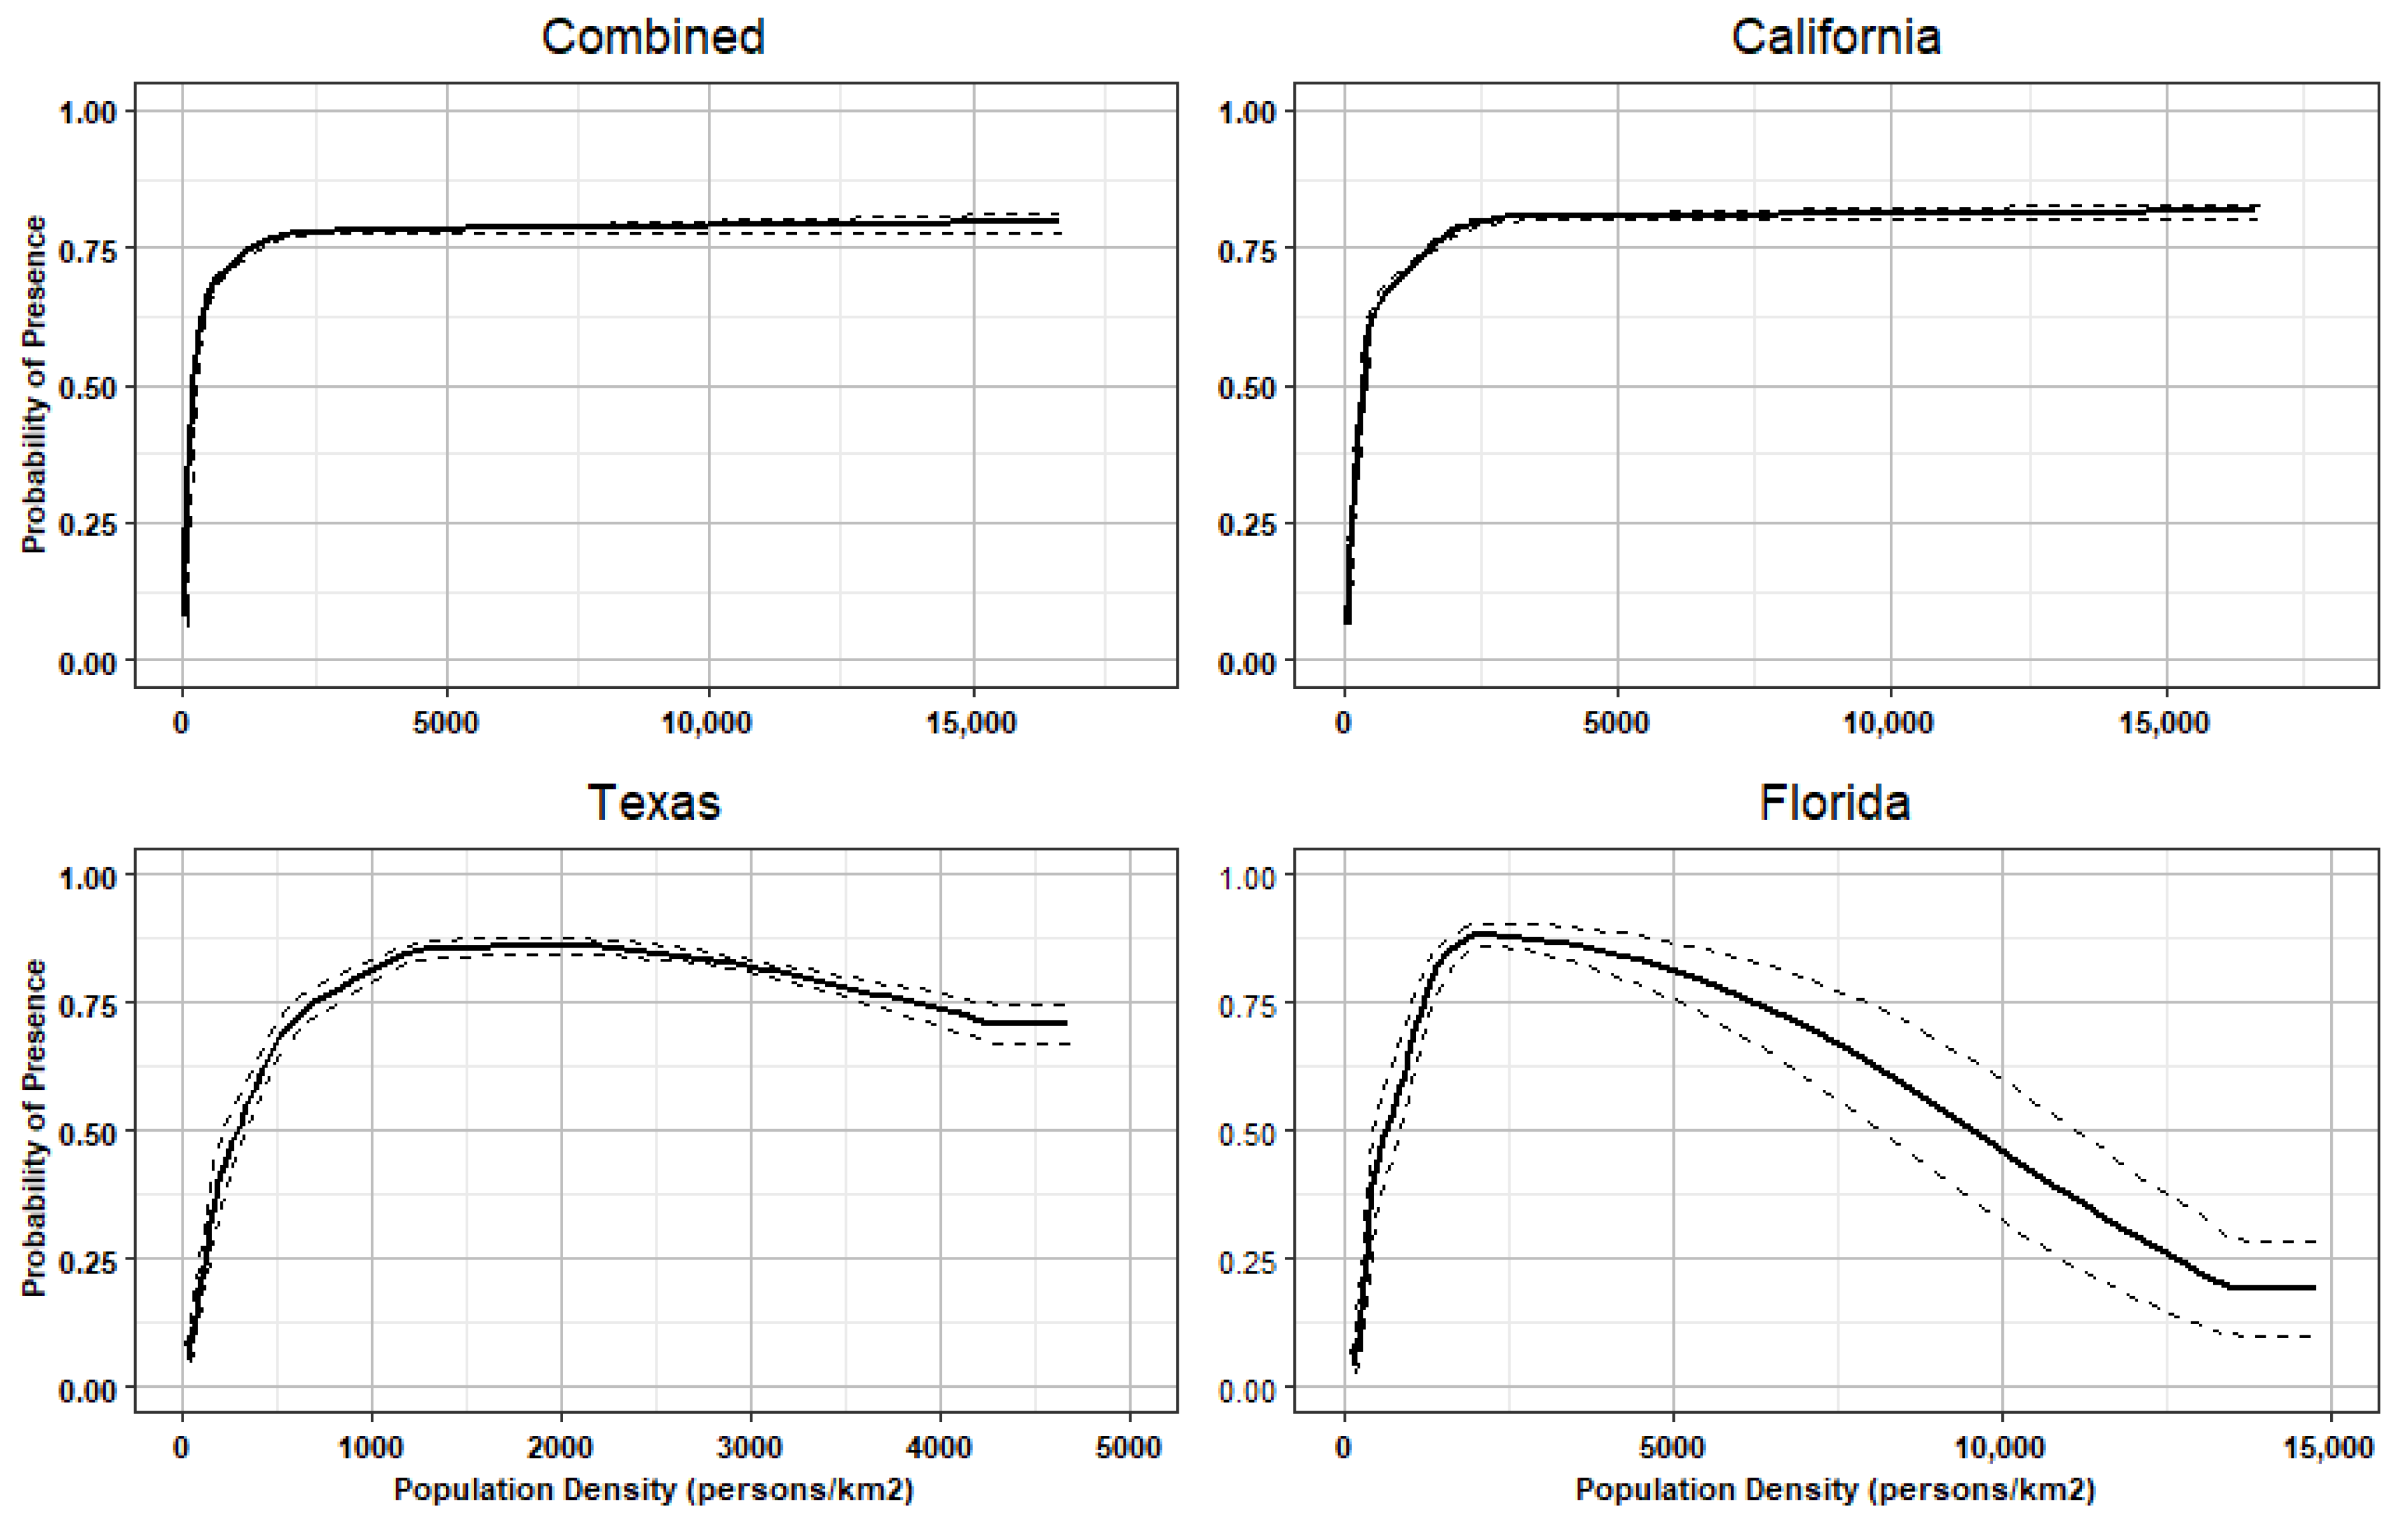
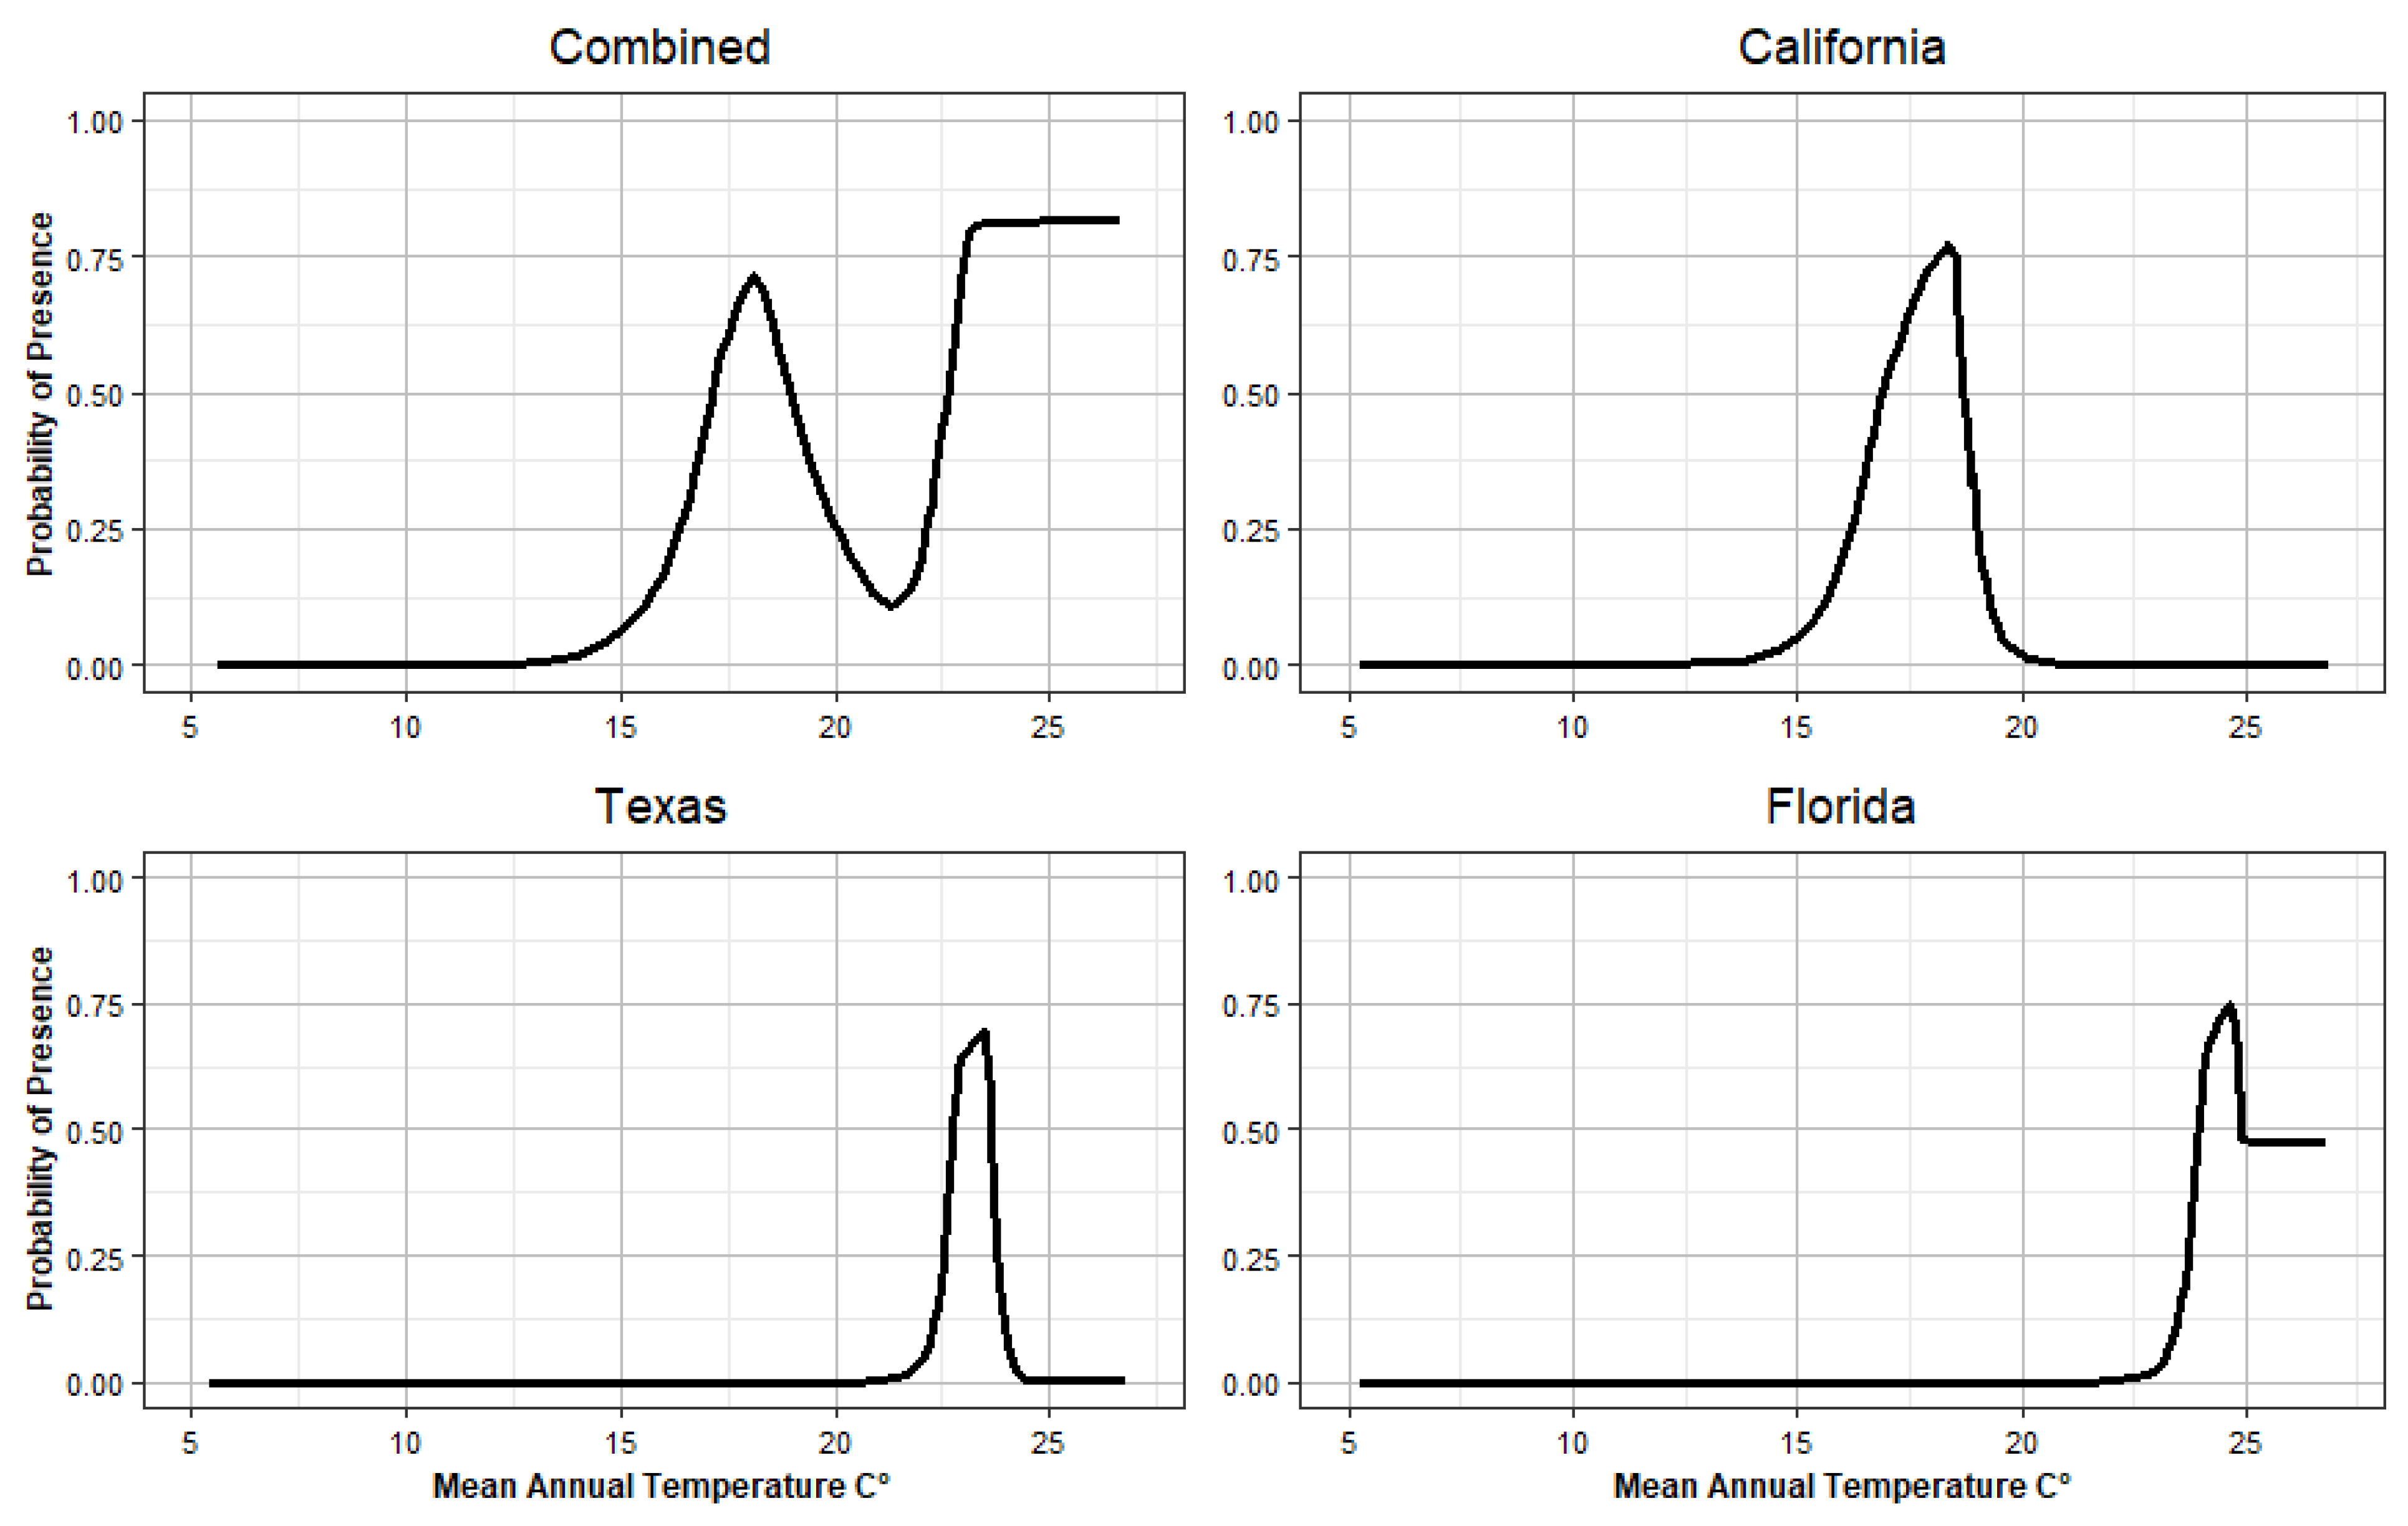
3.3. Variable Importance

All three state-level models and the combined model had a very good AUC (>0.91), averaging 0.95 (Table S2). Variable importance for each model was similar, with colinear variables related to temperature playing a large role in three of the four final models produced, with the exception being the California model, where precipitation variables played a larger role (Table S3). With regard to permutation importance (found by randomly permuting values for each variable at presence locations and determining the resulting drop in AUC [62]), temperature seasonality (Bio04_250; the difference between the warmest and coldest seasons) played the largest role in the combined model (93%) (Table S3). Human population density also played an important role in the combined model, precipitation-related variables were important in the California model, and temperature-related variables played important roles in the Florida model and Texas model (Table S3). Additionally, jackknifing results supported the conclusion that temperature seasonality, population density, and mean coldest temperature played important roles in all models, whereas precipitation variables (specifically Bio15_250; precipitation seasonality, Bio18_250; precipitation of the warmest quarter) were increasingly important in the California model. The percent contributions representing variable importance should be interpreted with caution since they are only heuristically defined and can express multicollinearity with one another [62,64]. However, Maxent accounts for variable correlation reasonably well, and excluding correlated variables does not significantly influence model performance [65].

Response Curves

In Maxent, response curves depict model responses from changing each variable while holding other variables at their average sample values. Predicted habitat suitability generally showed a strong positive correlation with urbanized areas (Figure 1). In all models, ideal habitat suitability was mostly constrained to developed areas at a low-to-medium intensity (defined as 20–79% impervious surfaces, generally including single-family homes). Human population density was positively correlated with high habitat suitability in all models. However, this effect was limited in the Texas and Florida models where suitability dropped off at densities higher than ~2500 people/km2. The decrease in habitat suitability was much more pronounced in the Florida model (Figure 2). The most suitable human population density in the Texas model was 500–2500 people/km2, in the Florida model 1000–8000 people/km2, and in the California model and combined model at densities greater than 1000 people/km2.
Habitat suitability was positively correlated with the mean annual temperature in all models, with ideal minimum annual means of at least ~17 °C (Figure 3). Temperature seasonality (standard deviation of monthly values × 100) did not play a significant role in the state-level models, but, in the combined model, any variation above 5.5 °C showed a strong negative correlation with habitat suitability. Additionally, this negative correlation was noticeable in all models when building models using only temperature seasonality, and the correlation occurred at roughly the same temperature (5.5 °C). In all models, the mean temperature of the coldest month strongly suggested that temperatures below ~5 °C were unsuitable for Red-crowned Parrots. Annual precipitation showed no consistent correlation among all models, but ideal habitat suitability seemed to require at least ~400 mm.

4. Discussion

4.1. Current Geographical Range and Potential for Expansion

Previous studies have indicated that Red-crowned Parrots in Mexico have lost an estimated 127,278 km2 of habitat from 1995 through 2016, whereas the current amount of suitable habitat in Mexico is estimated to be 94,988 km2 [66]. Our study shows that 39,429 km2 of suitable habitat (occupied and unoccupied high- and medium-quality habitat) is available for Red-crowned Parrots within the contiguous United States. These data suggest that roughly 30% of the suitable worldwide range lies within the United States, and almost all high-quality habitat is in urban areas. Thus, similar to other endangered species like Sociable Lapwings (Vanellus gregarious) and Rhinolophus sp. bats, synanthropy may play an important role in the future conservation and recovery of Red-crowned Parrots [67,68].
A large percentage of the high-quality habitat predicted by our models is currently inhabited by Red-crowned Parrots. Only 23% of high-quality habitat in Florida, 17% in California, and 9% in Texas are unoccupied. In Florida, most of the unoccupied high-quality habitat is south of the parrot’s current range in recently urbanized areas and throughout the Florida Keys. Although our models identified high-quality habitat in the Florida Keys, individual islands are likely not large enough to maintain populations, owing to the large sizes of individual home ranges [12]. Frequent hurricanes, which destroy nesting, feeding, and roost resources and cause high mortality, may also limit use of the Keys [69,70].
In California and Texas, we predict range expansion into high-quality habitats neighboring currently occupied areas, but such expansion may not include large enough areas to significantly impact the overall populations within these states. However, California and Texas are urbanizing rapidly, and we expect recently developed urban and suburban areas will become high-quality habitat as urban vegetation matures [71].
Our model identified 21,200 km2 of unoccupied medium-quality habitat, which, if occupied, would represent a 112% increase in range. Most medium-quality habitat is urbanized or abuts urban areas but lacks the mature vegetation and favorable climatic conditions to be classified as high-quality. Also, most medium-quality urban areas are smaller and more isolated than the currently inhabited metro centers in our three states and, therefore, have lower levels of propagule pressure and lower connectivity to current Red-crowned Parrot populations. Climate change may increase the suitability of these areas [72], and continued urban growth may decrease their isolation and increase connectivity to current populations. Thus, given climate change and urbanization, medium-quality habitats may represent important future resources and drive the future spread of the red-crowned parrot. However, increased propagule pressure, climate matching, and range connectivity alone will not guarantee spread and establishment success. Site-specific factors, such as availability of nesting and foraging substrate, as well as species-specific factors, such as behavioral flexibility and life history traits, will also play important roles in the success of the red-crowned parrot, as well as other synanthropic species [5,73,74].

4.2. Variation among Models

When building SDMs, it is assumed that species respond to environmental conditions similarly across their ranges. In our case, it was clear that the three disjunct populations of Red-crowned Parrots in the contiguous USA were responding to their environments in slightly different ways. State-level models predicted suitable habitats only within the states where presence locations originated, whereas the combined model predicted presence in all three states. This regional variability could have been caused by biological processes, including biotic interactions, genetic differentiation, or resource availability [75,76,77]. Additionally, models built with confined populations such as ours may not be easily generalized to novel environments because of the specificity of the species response to its surroundings or overfitting of the model [78], which was likely the situation in our case. Regardless, this finding suggested that Red-crowned Parrot populations were responding to their environments similarly but uniquely throughout the United States. The following discussion will explore these nuances.

4.3. Important Climatic and Environmental Drivers of Presence

All four of our models indicated the importance of minimum temperatures and minimum annual precipitation. They also showed that urbanization and population density were extremely important. However, they also indicated that Red-crowned Parrots have a rather wide niche relative to other variables we explored. This pattern is similar to other nonnative birds, including parrots [79,80,81,82,83]. Red-crowned Parrots have established populations in the United States in regions that are similar but unique, so, while strict climate matching can increase spread rates of nonnative species, it is often not necessary for their successful establishment [36,84].

4.4. Temperature

Our data suggest that Red-crowned Parrots have a low tolerance for low temperatures, as the minimum temperature in suitable habitats is relatively constant among all models at roughly 5 °C, and all models indicate a high tolerance to high temperatures. Temperature plays an important role in predicting the establishment of other nonnative tropical birds, with minimum temperatures limiting the northward expansion of many species [50,66,79,80,85]. Our results suggest that warming trends associated with climate change will likely increase suitable areas for Red-crowned Parrots within the United States. Other authors have similarly suggested that climatically suitable areas likely will increase for subtropical and tropical synanthropes, especially nonnatives [72,86].

4.5. Precipitation

The ideal annual precipitation was at least 400 mm in all four models. While the use of urban areas likely lessened dependency on precipitation due to increases in irrigation, otherwise suitable urban areas in drier regions, such as Phoenix, Arizona (204 mm/y), Tucson, Arizona (294 mm/y), and El Paso, Texas (250 mm/y), may not maintain the vegetation required for foraging, roosting, and nesting. In Arizona, multiple naturalized populations of the rosy-faced lovebird (Agapornis roseicollis) inhabit urban areas, but its native desert distribution, high trade volume in aviculture (i.e., high propagule pressure), and small size likely explain its presence [15,80]. The presence of medium-to-large-sized cavity nesters may be precluded by the lack of precipitation sufficient for large tree growth. Although sizable Red-crowned Parrot populations exist in southern California, the areas of Los Angeles and San Diego are relatively dry (~300 mm precipitation annually), well below what our models indicated as ideal (>400 mm annually). Our California model was also the only model where precipitation variables played outsized roles in predicting parrot presence. It is likely that high levels of residential irrigation offset the lack of precipitation in this region. Southern California imports ~90% of their water supply from outside the region [87], and residential areas in southern California utilize twice as much water for outdoor irrigation than northern California [88,89]. Additionally, affluent neighborhoods irrigate landscapes at higher levels compared to less affluent areas [90], which may help explain why these neighborhoods have increased numbers of large trees and more wildlife. In short, our results suggest that suitable Red-crowned Parrot habitats depend on a minimum level of at least 400 mm of precipitation and/or irrigation.

4.6. Urbanization and Population Density

Most high- and medium-quality habitats predicted by our models closely followed urban boundaries (Figure 1), which was consistent with some of the earliest observations of these birds in the United States [15,91,92]. While the California model, Florida model, and combined model predicted high- and medium-quality habitats in areas that had at least 1,000 people/km2, the Texas model predicted high- and medium-quality habitats in the Lower Rio Grande Valley at levels above 500 people/km2, which was similar to previous models focused on San Diego County in California [91]. Overall, all models indicated a similar lower limit to human population density (500–1000 people/km2), but upper limits were extremely variable (2500–15,000 people/km2). In general, regions with Red-crowned Parrot populations in southern California, including Los Angeles and San Diego, and in the Miami area of southeastern Florida had much higher human population densities than South Texas, but these regions did not seem to harbor higher densities of Red-crowned Parrots [13,93]. These wide tolerance ranges may explain why our three state-level models did not predict suitable habitat outside of the state from which the presence points originated. The lower bounds for climatic and anthropogenic variables may have been suitable in many areas, but the upper bounds were overfit. Therefore, when modeling distributions for species that may have wider physiological constraints than realized or that may not be in equilibrium with their environment, it is important to include presence locations from as many viable populations as possible.
Human population density alone is not likely to be the driving factor of occupancy for this synanthropic species. Instead, density is likely a proxy for an array of anthropogenic changes (i.e., urban landscaping, irrigation, bird feeders, etc.) [91,92,94]. Given that many Red-crowned Parrots were released or escaped pets, higher human density also correlated with higher levels of propagule pressure [95]. Additionally, human density could be seen as a proxy of human activity or of socio-economic drivers, and studies have shown that these factors alter bird behavior, habitat selection, distribution, and IUCN status [96,97].
Previous studies have noted that wildlife presence in urban ecosystems can increase with the presence of resources such as bird feeders, large street trees, and berry-bearing plants—all of which are abundant in mature suburban areas of southern California, Texas, and Florida [98,99]. Another well-noted pattern is that affluent neighborhoods harbor more and larger trees and thus a greater diversity of wildlife [99,100]. While we did not integrate data on neighborhood income into our work in South Texas, it was evident that parrots favored areas with larger homes and more mature trees. As Red-crowned Parrots in South Texas were utilizing roughly 70% nonnative tree species for roosting, nesting, and feeding (Kiacz, personal communication), it was apparent that urban landscaping was a large driving force behind species occupancy, supporting previous observations and modeling outcomes [91,92]. While native trees are generally better for native birds in urban areas [99,101,102], nonnative trees in urban areas can be beneficial for native and nonnative birds alike [103], which appeared to be the case for the Red-crowned Parrots in our three US populations.
Although Red-crowned Parrots in Texas are considered native, they depend on a completely modified urban ecosystem similar to naturalized populations in California and Florida [13,91]. Urban and suburban areas with ample and mature landscaping on residential and commercial properties are likely the main non-climatic drivers of Red-crowned Parrot occupancy, which seems to be a dependence commonly exhibited by other synanthropic species, including other naturalized parrot populations [15,104].
Urbanization was an extremely influential predictor for occupancy, and our presence locations contained few sightings in natural areas. These findings suggested that it was unlikely that Red-crowned Parrots would inhabit surrounding natural or wild areas in large numbers. While many “urbanized” species are dependent on remnant patches of native habitat within or adjacent to urban areas, Red-crowned Parrots do not seem to utilize these natural habitats often [13]. The reasons why are unknown, but we suspect that populations learn to survive in these urban areas and pass this knowledge to subsequent generations since urban areas are generally where individuals or groups are initially released or escape into. This urban adaptation likely limits the species ability to disperse into and survive in more natural areas, leading to isolation by adaptation [105]. This has important implications for the future of populations of Red-crowned Parrots within the United States and should alleviate most threats they may represent as a potential invasive species. It also implies that synanthropic species like the Red-crowned Parrot are likely to persist as long as currently inhabited urban areas do not drastically change their vegetation structures or landscape mosaics. Moreover, if urbanization continues along its recent trajectory, and urban yards and landscaping are maintained at similar levels, populations of these and other synanthropes are likely to grow in California, Texas, and Florida.

Supplementary Materials

The following supporting information can be downloaded at: https://www.mdpi.com/article/10.3390/d15070878/s1, Table S1: Descriptions and units of all climatic and environmental variables included in all models; Table S2: AUCs for each model; Table S3: Percent contribution and permutation importance for all variables.

Author Contributions

S.K. and D.J.B. conceptualized the project and worked on funding and the design of fieldwork methods. S.K. collected field data, built and ran models, wrote the manuscript, and created the accompanying figures and tables. H.-H.W. contributed to model design and, along with D.J.B., contributed to manuscript editing. All authors have read and agreed to the published version of the manuscript.

Funding

Funding was provided through the Texas Parks and Wildlife Department and the State Wildlife Grant Program (grant F15AF01189). Additional support was provided by the Ecology and Evolutionary Biology Program and Department of Veterinary Pathobiology at Texas A&M University, The Parrot Fund USA, and the Rio Grande Valley Birding Festival.

Institutional Review Board Statement

Not applicable.

Data Availability Statement

Most location data can be freely accessed through the eBird database. All datasets used in model building can be found freely online.

Conflicts of Interest

No conflicts of interest or competing interests are claimed by the authors.

References

  1. Ceballos, G.; Ehrlich, P.R.; Barnosky, A.D.; García, A.; Pringle, R.M.; Palmer, T.M. Accelerated modern human–induced species losses: Entering the sixth mass extinction. Sci. Adv. 2015, 1, e1400253. [Google Scholar] [CrossRef] [Green Version]
  2. United Nations; Department of Economic and Social Affairs; Population Division. World Urbanization Prospects: The 2018 Revision (ST/ESA/SER.A/420); United Nations: Geneva, Switzerland, 2019. [Google Scholar]
  3. Schmidt, C.; Domaratzki, M.; Kinnunen, R.; Bowman, J.; Garroway, C.J. Continent-wide effects of urbanization on bird and mammal genetic diversity. Proc. R. Soc. B 2020, 287, 20192497. [Google Scholar] [CrossRef] [PubMed]
  4. Kowarik, I. Novel urban ecosystems, biodiversity, and conservation. Environ. Pollut. 2011, 159, 1974–1983. [Google Scholar] [CrossRef] [PubMed]
  5. McKinney, M.L. Urbanization as a major cause of biotic homogenization. Biol. Conserv. 2006, 127, 247–260. [Google Scholar] [CrossRef]
  6. Thompson, K.; McCarthy, M.A. Traits of British alien and native urban plants. J. Ecol. 2008, 96, 853–859. [Google Scholar] [CrossRef]
  7. Uehling, J.J.; Tallant, J.; Pruett-Jones, S. Introduced and naturalized parrots in the United States. In Naturalized Parrots of the World: Distribution, Ecology, and Impacts of the World’s Most Colorful Colonizers; Pruett-Jones, S., Ed.; Princeton University Press: Princeton, NJ, USA, 2021. [Google Scholar]
  8. Veech, J.A.; Small, M.F.; Baccus, J.T. The effect of habitat on the range expansion of a native and an introduced bird species. J. Biogeogr. 2011, 38, 69–77. [Google Scholar] [CrossRef]
  9. Brightsmith, D.J.; Kiacz, S. Are Parrots Priority Invasive Species? In Naturalized Parrots of the World: Distribution, Ecology, and Impacts of the World’s Most Colorful Colonizers; Pruett-Jones, S., Ed.; Princeton University Press: Princeton, NJ, USA, 2021. [Google Scholar]
  10. Kiacz, S.; Brightsmith, D.J. Naturalized Parrots: Conservation and Research Opportunities. In Naturalized Parrots of the World: Distribution, Ecology, and Impacts of the World’s Most Colorful Colonizers; Pruett-Jones, S., Ed.; Princeton University Press: Princeton, NJ, USA, 2021. [Google Scholar]
  11. Shaffer, H.B. Urban biodiversity arks. Nat. Sustain. 2018, 1, 725–727. [Google Scholar] [CrossRef]
  12. Enkerlin-Hoeflich, E.C.; Hogan, K.M. Red-crowned Parrot (Amazona viridigenalis), version 1.0. Birds World 2020. [Google Scholar] [CrossRef]
  13. Kiacz, S.; Shackelford, C.E.; Henehan, A.K.; Brightsmith, D.J. History, status, and productivity of the Red-crowned Amazon Amazona viridigenalis in the Lower Rio Grande Valley of Texas. Bird Conserv. Internatn. 2020, 31, 519–533. [Google Scholar] [CrossRef]
  14. Enkerlin-Hoeflich, E.C. Las Aves de México en Peligro de Extinción; 970900011X; UNAM, Instituto de Ecologia Comision Nacional para el Conocimiento y Uso de la Biodiversidad Fondo de Cultura Economica: Tlalpan, Mexico, 2000; pp. 222–230. [Google Scholar]
  15. Uehling, J.J.; Tallant, J.; Pruett-Jones, S. Status of naturalized parrots in the United States. J. Ornithol. 2019, 160, 1–15. [Google Scholar] [CrossRef]
  16. Garrett, K. Twenty-five years of persistence and change in the naturalized parrots of Southern California. In Proceedings of the North American Ornithological Conference VII, Virtual, 15 August 2020. [Google Scholar]
  17. Garcia-Gonzalez, C.; Garcia-Vazquez, E. Urban ponds, neglected Noah’s ark for amphibians. J. Herpetol. 2012, 46, 507–514. [Google Scholar] [CrossRef]
  18. Jokimäki, J.; Suhonen, J.; Kaisanlahti-Jokimäki, M.-L. Urban core areas are important for species conservation: A European-level analysis of breeding bird species. Landsc. Urban Plann. 2018, 178, 73–81. [Google Scholar] [CrossRef]
  19. Faeth, S.H.; Bang, C.; Saari, S. Urban biodiversity: Patterns and mechanisms. Ann. N. Y. Acad. Sci. 2011, 1223, 69–81. [Google Scholar] [CrossRef] [PubMed] [Green Version]
  20. Beninde, J.; Veith, M.; Hochkirch, A. Biodiversity in cities needs space: A meta-analysis of factors determining intra-urban biodiversity variation. Ecol. Lett. 2015, 18, 581–592. [Google Scholar] [CrossRef]
  21. Phillips, S.J.; Anderson, R.P.; Schapire, R.E. Maximum entropy modeling of species geographic distributions. Ecol. Model. 2006, 190, 231–259. [Google Scholar] [CrossRef] [Green Version]
  22. Pacifici, M.; Foden, W.B.; Visconti, P.; Watson, J.E.; Butchart, S.H.; Kovacs, K.M.; Scheffers, B.R.; Hole, D.G.; Martin, T.G.; Akçakaya, H.R. Assessing species vulnerability to climate change. Nat. Clim. Change 2015, 5, 215–224. [Google Scholar] [CrossRef]
  23. IUCN. The IUCN Red List of Threatened Species; Version 2020–2; IUCN: Cambridge, UK, 2020. [Google Scholar]
  24. Austin, M.P.; Van Niel, K.P. Improving species distribution models for climate change studies: Variable selection and scale. J. Biogeogr. 2011, 38, 1–8. [Google Scholar] [CrossRef]
  25. Pearson, R.G. Species’ distribution modeling for conservation educators and practitioners. Synth. Am. Mus. Nat. Hist. 2007, 50, 54–89. [Google Scholar]
  26. Wang, H.-H.; Wonkka, C.L.; Treglia, M.L.; Grant, W.E.; Smeins, F.E.; Rogers, W.E. Species distribution modelling for conservation of an endangered endemic orchid. AoB Plants 2015, 7, plv039. [Google Scholar] [CrossRef] [Green Version]
  27. Randklev, C.R.; Wang, H.-H.; Groce, J.E.; Grant, W.E.; Robertson, S.; Wilkins, N. Land use relationships for a rare freshwater mussel species endemic to central Texas. J. Fish Wildl. Manag. 2015, 6, 327–337. [Google Scholar] [CrossRef] [Green Version]
  28. Bellard, C.; Bertelsmeier, C.; Leadley, P.; Thuiller, W.; Courchamp, F. Impacts of climate change on the future of biodiversity. Ecol. Lett. 2012, 15, 365–377. [Google Scholar] [CrossRef] [Green Version]
  29. Sohl, T.L. The relative impacts of climate and land-use change on conterminous United States bird species from 2001 to 2075. PLoS ONE 2014, 9, e112251. [Google Scholar] [CrossRef]
  30. Wang, H.-H.; Wonkka, C.L.; Treglia, M.L.; Grant, W.E.; Smeins, F.E.; Rogers, W.E. Incorporating local-scale variables into distribution models enhances predictability for rare plant species with biological dependencies. Biodivers. Conserv. 2019, 28, 171–182. [Google Scholar] [CrossRef]
  31. Illán, J.G.; Gutiérrez, D.; Wilson, R.J. The contributions of topoclimate and land cover to species distributions and abundance: Fine-resolution tests for a mountain butterfly fauna. Glob. Ecol. Biogeogr. 2010, 19, 159–173. [Google Scholar] [CrossRef]
  32. Martin, Y.; Van Dyck, H.; Dendoncker, N.; Titeux, N. Testing instead of assuming the importance of land use change scenarios to model species distributions under climate change. Glob. Ecol. Biogeogr. 2013, 22, 1204–1216. [Google Scholar] [CrossRef]
  33. Mainali, K.; Hefley, T.; Ries, L.; Fagan, W. Matching expert range maps with species distribution model predictions. Conserv. Biol. 2020, 34, 1292–1304. [Google Scholar] [CrossRef]
  34. Sullivan, B.L.; Wood, C.L.; Iliff, M.J.; Bonney, R.E.; Fink, D.; Kelling, S. eBird: A citizen-based bird observation network in the biological sciences. Biol. Conserv. 2009, 142, 2282–2292. [Google Scholar] [CrossRef]
  35. Dickinson, J.L.; Zuckerberg, B.; Bonter, D.N. Citizen science as an ecological research tool: Challenges and benefits. Annu. Rev. Ecol. Evol. Syst. 2010, 41, 149–172. [Google Scholar] [CrossRef] [Green Version]
  36. Abellán, P.; Tella, J.L.; Carrete, M.; Cardador, L.; Anadón, J.D. Climate matching drives spread rate but not establishment success in recent unintentional bird introductions. Proc. Natl. Acad. Sci. USA 2017, 114, 9385–9390. [Google Scholar] [CrossRef]
  37. Hayes, K.R.; Barry, S.C. Are there any consistent predictors of invasion success? Biol. Invasions 2008, 10, 483–506. [Google Scholar] [CrossRef]
  38. Blair, R.B.; Launer, A.E. Butterfly diversity and human land use: Species assemblages along an urban grandient. Biol. Conserv. 1997, 80, 113–125. [Google Scholar] [CrossRef]
  39. Lemoine, N.; Bauer, H.G.; Peintinger, M.; Böhning-Gaese, K. Effects of climate and land-use change on species abundance in a central European bird community. Conserv. Biol. 2007, 21, 495–503. [Google Scholar] [CrossRef] [PubMed]
  40. Monterrubio-Rico, T.C.; Renton, K.; Ortega-Rodríguez, J.M.; Pérez-Arteaga, A.; Cancino-Murillo, R. The Endangered yellow-headed parrot Amazona oratrix along the Pacific coast of Mexico. Oryx 2010, 44, 602–609. [Google Scholar] [CrossRef] [Green Version]
  41. Molloy, S.W.; Burbidge, A.H.; Comer, S.; Davis, R.A. Using climate change models to inform the recovery of the western ground parrot Pezoporus flaviventris. Oryx 2020, 54, 52–61. [Google Scholar] [CrossRef] [Green Version]
  42. Fick, S.E.; Hijmans, R.J. WorldClim 2: New 1-km spatial resolution climate surfaces for global land areas. Int. J. Climatol. 2017, 37, 4302–4315. [Google Scholar] [CrossRef]
  43. CIESIN. Gridded Population of the World, Version 4 (GPWv4): Population Density, Revision 11; CIESIN: Palisades, NY, USA, 2018. [Google Scholar]
  44. Homer, C.; Dewitz, J.; Jin, S.; Xian, G.; Costello, C.; Danielson, P.; Gass, L.; Funk, M.; Wickham, J.; Stehman, S. Conterminous United States land cover change patterns 2001–2016 from the 2016 National Land Cover Database. ISPRS J. Photogramm. Remote Sens. 2020, 162, 184–199. [Google Scholar] [CrossRef]
  45. U.S. Geological Survey Gap Analysis Program. GAP/LANDFIRE National Terrestrial Ecosystems; U.S. Geological Survey: Reston, VA, USA, 2016. [Google Scholar] [CrossRef]
  46. Comer, P.; Faber-Langendoen, D.; Evans, R.; Gawler, S.; Josse, C.; Kittel, G.; Menard, S.; Pyne, M.; Reid, M.; Schulz, K. Ecological Systems of the United States: A Working Classification of US Terrestrial Systems; NatureServe: Arlington, VA, USA, 2003; p. 75. [Google Scholar]
  47. Homer, C.; Dewitz, J.; Yang, L.; Jin, S.; Danielson, P.; Xian, G.; Coulston, J.; Herold, N.; Wickham, J.; Megown, K. Completion of the 2011 National Land Cover Database for the conterminous United States–representing a decade of land cover change information. Photogramm. Eng. Remote Sens. 2015, 81, 345–354. [Google Scholar]
  48. Coulston, J.W.; Moisen, G.G.; Wilson, B.T.; Finco, M.V.; Cohen, W.B.; Brewer, C.K. Modeling percent tree canopy cover: A pilot study. Photogramm. Eng. Remote Sens. 2012, 78, 715–727. [Google Scholar] [CrossRef] [Green Version]
  49. Strubbe, D.; Matthysen, E. Establishment success of invasive ring-necked and monk parakeets in Europe. J. Biogeogr. 2009, 36, 2264–2278. [Google Scholar] [CrossRef]
  50. Davis, A.Y.; Malas, N.; Minor, E.S. Substitutable habitats? The biophysical and anthropogenic drivers of an exotic bird’s distribution. Biol. Invasions 2014, 16, 415–427. [Google Scholar] [CrossRef] [Green Version]
  51. Liu, X.; de Sherbinin, A.; Zhan, Y. Mapping Urban Extent at Large Spatial Scales Using Machine Learning Methods with VIIRS Nighttime Light and MODIS Daytime NDVI. Remote Sens. 2019, 11, 1274. [Google Scholar] [CrossRef] [Green Version]
  52. CIESIN. 2015 Urban Extents from VIIRS and MODIS for the Continental U.S. Using Machine Learning Methods; CIESIN: Palisades, NY, USA, 2019. [Google Scholar]
  53. Baldwin, R.A. Use of maximum entropy modeling in wildlife research. Entropy 2009, 11, 854–866. [Google Scholar] [CrossRef]
  54. Elith, J.; Kearney, M.; Phillips, S. The art of modelling range-shifting species. Methods Ecol. Evol. 2010, 1, 330–342. [Google Scholar] [CrossRef]
  55. West, A.M.; Kumar, S.; Brown, C.S.; Stohlgren, T.J.; Bromberg, J. Field validation of an invasive species Maxent model. Ecol. Inform. 2016, 36, 126–134. [Google Scholar] [CrossRef] [Green Version]
  56. Smith, A.B.; Godsoe, W.; Rodríguez-Sánchez, F.; Wang, H.-H.; Warren, D. Niche estimation above and below the species level. Trends Ecol. Evol. 2019, 34, 260–273. [Google Scholar] [CrossRef]
  57. Koralewski, T.E.; Wang, H.-H.; Grant, W.E.; Byram, T.D. Plants on the move: Assisted migration of forest trees in the face of climate change. For. Ecol. Manag. 2015, 344, 30–37. [Google Scholar] [CrossRef]
  58. Wisz, M.S.; Hijmans, R.; Li, J.; Peterson, A.T.; Graham, C.; Guisan, A.; NCEAS Predicting Species Distributions Working Group. Effects of sample size on the performance of species distribution models. Divers. Distrib. 2008, 14, 763–773. [Google Scholar] [CrossRef]
  59. Merow, C.; Smith, M.J.; Silander, J.A., Jr. A practical guide to MaxEnt for modeling species’ distributions: What it does, and why inputs and settings matter. Ecography 2013, 36, 1058–1069. [Google Scholar] [CrossRef]
  60. Hosmer, D.W., Jr.; Lemeshow, S.; Sturdivant, R.X. Applied Logistic Regression; John Wiley & Sons: Hoboken, NJ, USA, 2013; Volume 398. [Google Scholar]
  61. Elith, J.; Phillips, S.J.; Hastie, T.; Dudík, M.; Chee, Y.E.; Yates, C.J. A statistical explanation of MaxEnt for ecologists. Divers. Distrib. 2011, 17, 43–57. [Google Scholar] [CrossRef]
  62. Phillips, S.J. A brief tutorial on Maxent. ATT Res. 2005, 190, 231–259. [Google Scholar]
  63. Phillips, S.J.; Anderson, R.P.; Dudík, M.; Schapire, R.E.; Blair, M.E. Opening the black box: An open-source release of Maxent. Ecography 2017, 40, 887–893. [Google Scholar] [CrossRef]
  64. O’Donnell, M.S.; Ignizio, D.A. Bioclimatic Predictors for Supporting Ecological Applications in the Conterminous United States; U.S. Geological Survey: Reston, VA, USA, 2012; p. 691. [Google Scholar]
  65. Feng, X.; Park, D.S.; Liang, Y.; Pandey, R.; Papeş, M. Collinearity in ecological niche modeling: Confusions and challenges. Ecol. Evol. 2019, 9, 10365–10376. [Google Scholar] [CrossRef] [PubMed] [Green Version]
  66. Monterrubio-Rico, T.C.; Charre-Medellín, J.F.; Pacheco-Figueroa, C.; Arriaga-Weiss, S.; de Dios Valdez-Leal, J.; Cancino-Murillo, R.; Escalona-Segura, G.; Bonilla-Ruz, C.; Rubio-Rocha, Y. Distribución potencial histórica y contemporánea de la familia Psittacidae en México. Rev. Mex. Biodivers. 2016, 87, 1103–1117. [Google Scholar] [CrossRef] [Green Version]
  67. Kamp, J.; Sheldon, R.D.; Koshkin, M.A.; Donald, P.F.; Biedermann, R. Post-Soviet steppe management causes pronounced synanthropy in the globally threatened Sociable Lapwing Vanellus gregarius. Ibis 2009, 151, 452–463. [Google Scholar] [CrossRef]
  68. Winter, R.; Mantilla-Contreras, J.; Schmidt, S. Usage of buildings in the life cycle of two endangered Rhinolophus species in the Mediterranean region: Implications for roost protection. Eur. J. Wildl. Res. 2020, 66, 38. [Google Scholar] [CrossRef] [Green Version]
  69. Renton, K.; Salinas-Melgoza, A.; Rueda-Hernández, R.; Vázquez-Reyes, L.D. Differential resilience to extreme climate events of tree phenology and cavity resources in tropical dry forest: Cascading effects on a threatened species. For. Ecol. Manag. 2018, 426, 164–175. [Google Scholar] [CrossRef]
  70. White, T.H.; Abreu, W.; Benitez, G.; Jhonson, A.; Lopez, M.; Ramirez, L.; Rodriguez, I.; Toledo, M.; Torres, P.; Velez, J. Minimizing potential allee effects in psittacine reintroductions: An example from Puerto Rico. Diversity 2021, 13, 13. [Google Scholar] [CrossRef]
  71. Kowarik, I. Time lags in biological invasions with regard to the success and failure of alien species. In Plant Invasions—General Aspects and Special Problems; SPB Academic Publishing: Amsterdam, The Netherlands, 1995; pp. 15–38. [Google Scholar]
  72. Hitch, A.T.; Leberg, P.L. Breeding distributions of North American bird species moving north as a result of climate change. Conserv. Biol. 2007, 21, 534–539. [Google Scholar] [CrossRef] [PubMed]
  73. Sol, D.; Duncan, R.P.; Blackburn, T.M.; Cassey, P.; Lefebvre, L. Big brains, enhanced cognition, and response of birds to novel environments. Proc. Natl. Acad. Sci. USA 2005, 102, 5460–5465. [Google Scholar] [CrossRef]
  74. Colautti, R.I.; Grigorovich, I.A.; MacIsaac, H.J. Propagule pressure: A null model for biological invasions. Biol. Invasions 2006, 8, 1023–1037. [Google Scholar] [CrossRef] [Green Version]
  75. Habibzadeh, N.; Storch, I.; Ludwig, T. Differential habitat associations in peripheral populations of threatened species: The case of the Caucasian grouse. Ecol. Res. 2019, 34, 309–319. [Google Scholar] [CrossRef]
  76. Peterson, M.L.; Doak, D.F.; Morris, W.F. Incorporating local adaptation into forecasts of species’ distribution and abundance under climate change. Glob. Chang. Biol. 2019, 25, 775–793. [Google Scholar]
  77. Olson, L.E.; Bjornlie, N.; Hanvey, G.; Holbrook, J.D.; Ivan, J.S.; Jackson, S.; Kertson, B.; King, T.; Lucid, M.; Murray, D. Improved prediction of Canada lynx distribution through regional model transferability and data efficiency. Ecol. Evol. 2021, 11, 1667–1690. [Google Scholar] [CrossRef] [PubMed]
  78. Boria, R.A.; Blois, J.L. The effect of large sample sizes on ecological niche models: Analysis using a North American rodent, Peromyscus maniculatus. Ecol. Model. 2018, 386, 83–88. [Google Scholar] [CrossRef]
  79. Ancillotto, L.; Strubbe, D.; Menchetti, M.; Mori, E. An overlooked invader? Ecological niche, invasion success and range dynamics of the Alexandrine parakeet in the invaded range. Biol. Invasions 2016, 18, 583–595. [Google Scholar] [CrossRef]
  80. Mori, E.; Cardador, L.; Reino, L.; White, R.L.; Hernández-Brito, D.; Le Louarn, M.; Mentil, L.; Edelaar, P.; Pârâu, L.G.; Nikolov, B.P. Lovebirds in the air: Trade patterns, establishment success and niche shifts of Agapornis parrots within their non-native range. Biol. Invasions 2020, 22, 421–435. [Google Scholar] [CrossRef]
  81. Pereira, P.F.; Barbosa, A.M.; Godinho, C.; Salgueiro, P.A.; Silva, R.R.; Lourenço, R. The spread of the red-billed leiothrix (Leiothrix lutea) in Europe: The conquest by an overlooked invader? Biol. Invasions 2020, 22, 709–722. [Google Scholar] [CrossRef]
  82. Stohlgren, T.J.; Barnett, D.; Flather, C.; Fuller, P.; Peterjohn, B.; Kartesz, J.; Master, L.L. Species richness and patterns of invasion in plants, birds, and fishes in the United States. Biol. Invasions 2006, 8, 427–447. [Google Scholar] [CrossRef] [Green Version]
  83. Strubbe, D.; Jackson, H.; Groombridge, J.; Matthysen, E. Invasion success of a global avian invader is explained by within-taxon niche structure and association with humans in the native range. Divers. Distrib. 2015, 21, 675–685. [Google Scholar] [CrossRef]
  84. Pigot, A.L.; Owens, I.P.; Orme, C.D.L. The environmental limits to geographic range expansion in birds. Ecol. Lett. 2010, 13, 705–715. [Google Scholar] [CrossRef]
  85. Socolar, J.B.; Epanchin, P.N.; Beissinger, S.R.; Tingley, M.W. Phenological shifts conserve thermal niches in North American birds and reshape expectations for climate-driven range shifts. Proc. Natl. Acad. Sci. USA 2017, 114, 12976–12981. [Google Scholar] [CrossRef] [PubMed] [Green Version]
  86. Bellard, C.; Thuiller, W.; Leroy, B.; Genovesi, P.; Bakkenes, M.; Courchamp, F. Will climate change promote future invasions? Glob. Change Biol. 2013, 19, 3740–3748. [Google Scholar] [CrossRef]
  87. Hogue, T.S.; Pincetl, S. Are you watering your lawn? Science 2015, 348, 1319–1320. [Google Scholar] [CrossRef]
  88. Mini, C.; Hogue, T.; Pincetl, S. Estimation of residential outdoor water use in Los Angeles, California. Landsc. Urban Plann. 2014, 127, 124–135. [Google Scholar] [CrossRef]
  89. Mayer, P.W.; Martien, L.; Hayden, M.; Funk, A.; Kramer-Duffield, M.; Davis, R.; Henderson, J.; Raucher, B.; Gleick, P.; Heberger, M. California Single Family Water Use Efficiency Study; Aquacraft, Inc. Water Engineering and Management: Boulder, CO, USA, 2011. [Google Scholar]
  90. Mini, C.; Hogue, T.S.; Pincetl, S. Patterns and controlling factors of residential water use in Los Angeles, California. Water Policy 2014, 16, 1054–1069. [Google Scholar] [CrossRef]
  91. Meseck, K.A. Habitat Distribution for Non-Native Amazona viridigenalis within San Diego County Using Maxent Predictive Model. Master’s Thesis, San Diego State University, San Diego, CA, USA, 2013. [Google Scholar]
  92. Neck, R.W. Expansion of Red-crowned Parrot, Amazona viridigenalis, into southern Texas and changes in agricultural practices in northern Mexico. Bull. Tex. Ornithol. Soc. 1986, 19, 6–12. [Google Scholar]
  93. Garrett, K.L. Introducing change: A current look at naturalized bird species in western North America. In Trends and Traditions: Avifaunal Change in Western North America. Studies of Western Birds 3; Shuford, W.D., Gill, R.E., Jr., Handel, C.M., Eds.; Western Field Ornithologists: Camarillo, CA, USA, 2018; pp. 116–130. [Google Scholar]
  94. Duncan, R.P.; Blackburn, T.M.; Sol, D. The Ecology of Bird Introductions. Annu. Rev. Ecol. Evol. Syst. 2003, 34, 71–98. [Google Scholar] [CrossRef]
  95. Vall-Llosera, M.; Cassey, P. Leaky doors: Private captivity as a prominent source of bird introductions in Australia. PloS ONE 2017, 12, e0172851. [Google Scholar] [CrossRef] [Green Version]
  96. Olah, G.; Butchart, S.H.M.; Symes, A.; Guzmán, I.M.; Cunningham, R.; Brightsmith, D.J.; Heinsohn, R. Ecological and socio-economic factors affecting extinction risk in parrots. Biodivers. Conserv. 2016, 25, 205–223. [Google Scholar] [CrossRef]
  97. Meager, J.J.; Schlacher, T.A.; Nielsen, T. Humans alter habitat selection of birds on ocean-exposed sandy beaches. Divers. Distrib. 2012, 18, 294–306. [Google Scholar] [CrossRef] [Green Version]
  98. Goddard, M.A.; Dougill, A.J.; Benton, T.G. Why garden for wildlife? Social and ecological drivers, motivations and barriers for biodiversity management in residential landscapes. Ecol. Econ. 2013, 86, 258–273. [Google Scholar] [CrossRef]
  99. Wood, E.M.; Esaian, S. The importance of street trees to urban avifauna. Ecol. Appl. 2020, 30, e02149. [Google Scholar] [CrossRef] [PubMed]
  100. Kuruneri-Chitepo, C.; Shackleton, C.M. The distribution, abundance and composition of street trees in selected towns of the Eastern Cape, South Africa. Urban For. Urban Green. 2011, 10, 247–254. [Google Scholar] [CrossRef] [Green Version]
  101. Chalker-Scott, L. Nonnative, noninvasive woody species can enhance urban landscape biodiversity. Arboric. Urban For. 2015, 41, 173–185. [Google Scholar] [CrossRef]
  102. Pena, J.C.d.C.; Martello, F.; Ribeiro, M.C.; Armitage, R.A.; Young, R.J.; Rodrigues, M. Street trees reduce the negative effects of urbanization on birds. PLoS ONE 2017, 12, e0174484. [Google Scholar] [CrossRef] [PubMed] [Green Version]
  103. Schlaepfer, M.A.; Sax, D.F.; Olden, J.D. The potential conservation value of non-native species. Conserv. Biol. 2011, 25, 428–437. [Google Scholar] [CrossRef]
  104. Runde, D.; Pitt, W.; Foster, J. Population ecology and some potential impacts of emerging populations of exotic parrots. In Proceedings of the Managing Vertebrate Invasive Species 2007, Fort Collins, CO, USA, 7–9 August 2007; pp. 338–360. [Google Scholar]
  105. Nosil, P.; Egan, S.P.; Funk, D.J. Heterogeneous genomic differentiation between walking-stick ecotypes:“isolation by adaptation” and multiple roles for divergent selection. Evol. Int. J. Org. Evol. 2008, 62, 316–336. [Google Scholar] [CrossRef]
Figure 1. Maxent predicted high-quality, medium-quality, and unsuitable habitat for Red-crowned Parrots (Amazona viridgenalis) in (a) California, (b) Florida, and (c) Texas. High-quality habitat is shaded dark green, medium-quality habitat is shaded medium green, and unsuitable habitat is shaded light green. Current Red-crowned Parrot presence is outlined in a dashed black line, and urbanized areas are outlined in solid black. Only the areas within each state that contain medium or high-quality habitat are shown.
Diversity 15 00878 g001aDiversity 15 00878 g001b
Figure 2. Response curves characterizing the probability of Red-crowned Parrot (Amazona viridigenalis) presence versus human population density from each of the four models. The response curves were created by Maxent using only human Population Density as a predictor variable. Solid lines represent the average response of five replicate models and dashed lines represent the mean ± one standard deviation.
Diversity 15 00878 g002
Figure 3. Response curves characterizing the probability of Red-crowned Parrot (Amazona viridigenalis) presence versus mean Annual Temperature from each of the four models. The response curves were created by Maxent using only mean Annual Temperature as a predictor variable. Solid lines represent the average response of five replicate models.
Diversity 15 00878 g003
Table 1. Combined model area predictions of high-quality, medium-quality, and unsuitable habitat for Red-crowned Parrots (Amazona viridigenalis) in each state. The percentage of the state that each predicted habitat type covers is also included.
Predicted High Quality (km2)% of StatePredicted Medium Quality (km2)% of StatePredicted Unsuitable (km2)% of State
California82502%17,4894.30%383,66194%
Texas15230.20%56230.80%677,20899%
Florida16901.20%48543.30%139,11796%
Total11,463 27,966 1,199,986
Table 2. Model predictions of Red-crowned Parrot (Amazona viridigenalis) habitat availability using single-state models and the percent of the state that each habitat type covers. State models predicted only unsuitable habitat outside of their own state.
Predicted High Quality (km2)% of StatePredicted Medium Quality (km2)% of StatePredicted Unsuitable (km2)% of State
California79992%14,5773.60%386,82494%
Texas14860.20%45460.70%678,32299%
Florida19861.40%17221.20%141,95397%
Disclaimer/Publisher’s Note: The statements, opinions and data contained in all publications are solely those of the individual author(s) and contributor(s) and not of MDPI and/or the editor(s). MDPI and/or the editor(s) disclaim responsibility for any injury to people or property resulting from any ideas, methods, instructions or products referred to in the content.

