Article

Landscape and Marine Environmental Factors Jointly Regulate the Intertidal Species Richness and Community Structure in the Islands of South Korea

1
Department of Forestry Resources, Kookmin University, 77 Jeongneung Rd, Seongbukgu, Seoul 02707, Republic of Korea
2
Department of Climate Technology Convergence (Biodiversity and Ecosystem Functioning Major), Kookmin University, 77 Jeongneungro, Seongbukgu, Seoul 02707, Republic of Korea
3
Department of Forestry, Environment, and System, Kookmin University, 77 Jeongneungro, Seongbukgu, Seoul 02707, Republic of Korea
*
Author to whom correspondence should be addressed.
Diversity 2023, 15(7), 826; https://doi.org/10.3390/d15070826
Submission received: 12 May 2023 / Revised: 28 June 2023 / Accepted: 29 June 2023 / Published: 30 June 2023

Abstract

:
Most studies on island biogeography have focused on the terrestrial taxa; however, there are few studies on the drivers of diversity and community structure of intertidal organisms on islands. We evaluated the effect of landscape and marine environmental factors on the species richness (SR), functional diversity (FD), and community structure (SES.MFD) of intertidal invertebrates among the overall, inhabited, and uninhabited islands. Using the data on the intertidal organisms from 78 islands in South Korea, we implemented variable selection and piecewise structural equation modeling to determine the causal relationships between the SR, FD, and SES.MFD with four landscapes (i.e., island area, coastline length, distance from the mainland, and structural connectivity) and three marine environment factors (i.e., mean annual sea surface temperature variation, wind speed, and evapotranspiration). The coastline length had a positive effect on the SR and SES.MFD in the overall islands including inhabited and uninhabited islands. The SR and FD were negatively affected by the variation in sea surface temperature. The relative importance of the landscape and marine environmental factors differed between the inhabited and uninhabited islands. That is, the inhabited islands were mainly affected by the coastline length, whereas uninhabited islands were regulated by marine environmental factors. Our results demonstrated that the biotic factors of the island intertidal ecosystems are controlled by the interactions between the biotic and various environmental factors. Moreover, the results emphasize that the water stress on the intertidal organisms due to climate change may lead to a loss of biodiversity and functional clustering.

1. Introduction

Research on the theory of island biogeography (TIB), which analyzes and interprets the effects of the environmental factors related to the biodiversity of island ecosystems using distinctive environmental conditions, is being actively conducted worldwide [1,2,3]. According to the TIB, species richness (SR) is determined by the island area and degree of isolation from the mainland and is a biogeographic field that predicts species colonization or extinction [4]. In isolated island ecosystems, identification of the mechanisms of speciation, migration, and extinction based on the TIB is a significant research subject. Recently, to clearly understand the community assembly processes of island ecosystems, comprehensive analyses and studies on the phylogenetic (evolutionary relationships between species), functional (key functional traits for the growth, reproduction, and survival of species) community structure (SES.MFD), and taxonomic diversity such as the SR are being emphasized [5,6]. However, these studies have mainly concentrated on terrestrial taxa such as plants, birds, and insects [7,8]. There are few studies based on the TIB regarding organisms living in the intertidal zone [9], which is an important transition area that connects the terrestrial and marine ecosystems located at the edge of the island.
The habitat environment of the intertidal zone ecosystem shows extreme differences in moisture and temperature due to the strength of waves and the dual situation of being submerged in the sea (high tide) and exposed to the air and sun (ebb tide) [10,11,12]. For this reason, Wethey et al. [13] determined that the intertidal zone ecosystems show patterns similar to that of forest ecosystems in which the flora changes with elevation, but unlike forests, the intertidal zone ecosystems have steep vertical environmental gradients that occur over a relatively small scale of less than 10 m. In addition, it was concluded that this steep environmental gradient was determined by the duration and timing of the exposure to air and sun according to the movement of the tide [13]. Therefore, many organisms that have adapted to this zone are vertically classified according to complex functional traits reflecting the competition for habitat space, ability to avoid predators, and resistance to desiccation. For example, organisms living in the higher intertidal zones have shells and functional traits that allow them to move to avoid desiccation and evade predators. On the other hand, organisms in the lower intertidal zone have functional traits that firmly fix their bodies to the ground to withstand wave energy and occupy stable habitats [14]. This means that not only the landscape factors of the island but also the sea surface factors that directly impact the island and moisture factors should be considered together when determining the relationship between the SR and SES.MFD of the intertidal organisms.
Inhabited and uninhabited islands show ecological differences due to the differences in the island area and degree of isolation [9]. Uninhabited islands are relatively small and isolated compared to inhabited islands [15]. Therefore, the ecosystem of the uninhabited islands is more vulnerable to natural disturbances than the inhabited islands, which are vulnerable to artificial disturbances due to human activities [9]. On the other hand, inhabited islands that are relatively large and not isolated compared to uninhabited islands are less vulnerable to natural disturbances but are known to be more vulnerable to artificial disturbances due to human influence [9]. Despite these differences, studies on the biodiversity and SES.MFD of islands are mainly conducted on uninhabited islands or analyzed as integrated data of the inhabited and uninhabited islands [1,9]. In the intertidal zone ecosystems, there is no study on the effect of the differences in the characteristics between the inhabited and uninhabited islands on biodiversity and SES.MFD [16].
To date, there have been many studies on island biogeography targeting the various habitats and taxa. However, previous studies have some limitations [17,18]. (1) There is a lack of studies on island biogeography targeting the intertidal ecosystem, which is an important transition zone between terrestrial and marine ecosystems. (2) Although species dwelling within the intertidal zone are greatly affected by the marine environmental factors such as moisture stress due to the evaporation of seawater and sea surface factors as well as landscape factors, there are no studies considering the functional diversity (FD) and community structure of the intertidal organisms. (3) There are a lack of studies and interpretations of the differences in species diversity and SES.MFD patterns in the intertidal zone ecosystems between the inhabited and uninhabited islands with different characteristics. The purpose of this study was to overcome these limitations: we evaluated the complex relationships of the landscape (i.e., island area, coastline length, distance from the mainland, and structural connectivity) and marine environmental factors such as evapotranspiration and sea surface factors (i.e., sea surface temperature and wind speed) of the islands on the SR, FD, and SES.MFD of the invertebrates dwelling within the intertidal zone of islands distributed in the Hallyeo National Marine Park (HNM), South Korea. In addition, the difference in the effects of the environmental factors on the SR, FD, and SES.MFD in the intertidal zone ecosystems was analyzed between the overall, inhabited, and uninhabited islands. We predict that species richness in the intertidal zone will show similar results with the TIB (i.e., species richness increases with island area). In addition, it is predicted that the properties of environmental factors, which are controlled by SR, FD, and SES.MFD, of intertidal organisms on inhabited and uninhabited islands will be different. The results of this study are expected to present a complex ecosystem model for the island’s intertidal zone.

2. Materials and Methods

2.1. Study Area

South Korea is the fourth most island-rich country in the world with a total of 3358 islands, including 2876 uninhabited and 482 inhabited islands [19]. The islands distributed along the southern and western coastline of South Korea are inhabited by species endemic to South Korea, including various terrestrial and marine organisms, and play a role as a stopover point for migratory birds [20]. Accordingly, they are recognized as ecologically important regions and were designated as a protected region by the United Nations Educational, Scientific, and Cultural Organization in 2009. In addition, the Korean Ministry of Environment established three National Marine Parks including the Dadohae National Marine Park, HNM, and Taeanhaean National Park to systematically manage and conserve the island regions and coastal ecosystems. The HNM, which is the study area, has a total of 100 islands, including 71 uninhabited and 29 inhabited islands [21]. There are 4383 species of flora and fauna, including four species of endangered wildlife as designated by the Ministry of Environment of the Republic of Korea as class I, such as Neofinetia falcata, Haliaeetus albicilla, and Falco peregrinus, and 20 species of endangered wildlife of class II, such as Orobanche filicicola and Nannophya pygmaea. In addition, it is known as a paradise for wildlife, with 118 species endemic to Korea, such as Kamimuria coreana and Zoarchias uchidai [22].
In this study, we used the distribution data of the marine organisms from the report titled, “2016 Hallyeo National Marine Park on the survey of uninhabited and inhabited islands” which was conducted by the HNM Eastern Management Office from March to October 2016 through field research and literature review ([21]; Tables S1 and S2). The marine organism data used in this study are presence–absence data (Table S1). Data for all the islands were collected with the following protocol. After anchoring a ship on each island, the appearance of species was investigated along the coastline. In the case of islands where ships could not be anchored, a ship was used to investigate the appearance of species along the coastline [21]. Of the 82 islands in the report, 78 islands (22 inhabited and 56 uninhabited) were used for the analysis in this study (Figure 1) and the islands without marine organisms or with missing independent factor values (i.e., landscape and marine environmental factors) were excluded.

2.2. Species Richness, Funational Diversity, and Community Structure Factors

We calculated the SR, FD, and SES.MFD for each island using the marine organism distribution data. SR was calculated as the sum of the number of species distributed on each island (Table S1).
To analyze the FD and SES.MFD of the marine organisms distributed in HNM, 22 trait data of six functional categories that are known to be important functional traits for survival, habitat, and resource competition of the marine organisms were collected from the related references (Table 1). Among the factors representing the functional traits, body form is a trait that represents the morphological characteristics of organisms and reflects life cycle strategies, dispersal, and ecological adaptability, such as adapting to extreme environmental stress in the intertidal zone and resisting predation [23]. Regarding the structural size, the body or shell length was used as a trait showing superiority in space and resource use competition between species [6].
A guild is a concept often used in the evaluation and management of the environment since it was first defined as “a group of species that use the same resources in a similar way” [24]. Accordingly, we selected the dietary composition, habitat preference (feeding site), and main feeding behavior (feeding method) to analyze the functional traits for food resources, energy requirements, and trophic levels. The mobility of the marine organisms was divided into stationary and mobile organisms [25].
To produce a functional dendrogram for the calculation of the FD and SES.MFD, principal coordinate analysis (PCoA) was performed after calculating the Gower’s distance between all species using the functional trait data of the 79 species. Five axes of the derived PCoA were selected to generate a functional tree for the functional traits (Figures S1–S3). The FD and SES.MFD were quantified from the generated functional tree. The FD was defined as the total branch length connecting the basal node to the terminal end of the species on an island [26]. After calculating the average functional distance from the functional dendrogram, the SES.MFD was calculated using the following equation:
S E S . M F D = M F D o b s m e a n   M F D r a n d S T D r a n d
where MFDobs indicates the mean functional distance between all species observed in an island and mean MFDrand and STDrand represent the mean MFD and standard deviation for 1000 randomly selected hypothetical communities. The 1000 random communities were generated using a random shuffling method from the functional dendrogram consisting of 79 species [27,28]. Since this method randomizes the functional relatedness of species to each other while maintaining the community matrix of the observed species, the SR, occupancy, and spatial distribution within the randomized community maintain fixed values [27]. The SES.MFD derived as a result value indicates a negative or positive value. A negative SES.MFD value indicates that functionally similar species form the island community (clustering), while a positive value indicates that functionally distant species form the island community (overdispersion). All species classification and trait data were extracted from the species list and information from the National Institute of Biological Resources [29] and the National Biodiversity Center [30] of the Ministry of Environment of Korea (Table S3). The SR, FD, and SES.MFD of each island were calculated using the picante package in R version 4.1.3. The species list and functional traits of the intertidal organisms in the study islands are provided in Tables S1 and S2.

2.3. Landscape and Marine Environmental Factors

To analyze the relative importance of the landscape and marine environmental factors such as the moisture and sea surface factors in the SR, FD, and SES.MFD of the intertidal zone of each island, the island area, coastline length, distance from the mainland, and island structural connectivity were calculated as the landscape factors [16]. In addition, evapotranspiration (ET), which affects the water stress of intertidal organisms, wind speed (WS), which indicates the height and strength of waves, and the mean annual sea surface temperature variation (SST_STD) were used as marine environmental factors [31,32]. The island area (ha) and coastline length (km) were calculated using the national basic spatial data provided by the National Geographic Information Institute. The distance from the mainland (km) was measured using ArcGIS 10.5 (Esri, Redlands, CA, USA) as the shortest distance between the island edge and the boundary of the mainland. To quantify the structural connectivity, we followed the previously reported method by Aggemyr et al. [33] which incorporates the island area and degree of isolation. Since there is information on the size and distance of all potential sources of a species, this method was appropriate for highly fragmented habitats [33,34]. We used five buffer distances (i.e., 500, 1000, 2000, 3000, and 4000 m) to assess the effect of the structural connectivity on the plant richness of each island. Consequently, all islands within a buffer were involved in the calculation. The structural connectivity was calculated using the following equation:
C i = i = 1 n W A j W d j A j   w h e r e   W A j = A j A l   a n d   W D j = k d i j r ,
where Aj and A l are the area of the island j and the area of all the surrounding islands within the buffer radius r (500, 1000, 2000, 3000, and 4000 m). The dij is the Euclidean distance between the islands i and j and k is a constant set to 0.01 [33].
The ET and WS of each island were analyzed by utilizing the data obtained from the world WS and ET (resolution of 1 km) from Worldclim (https://www.worldclim.org/, accessed on 5 April 2023), a world climate data provider. The SST_STD was analyzed by utilizing the data obtained (resolution of 1 km) from the Climate Data Store (https://cds.climate.copernicus.eu/, accessed on 8 April 2023), which provides global marine environment data obtained from NOAA satellite sensors. The data on the biodiversity and environmental factors are provided in Table S3.

2.4. Statistical Analysis

We used piecewise structural equation modeling (pSEM), which is known to be the most suitable analysis method, to express the causal relationship between various factors [35]. Using this, the effects and causal relationships of the landscape, moisture, and sea surface factors on the SR, FD, and SES.MFD of the intertidal organisms was established. We implemented pSEM analysis based on the conceptual model (Figure 2). To avoid the multicollinearity between each environmental factor, Pearson’s correlation analysis was performed to remove the highly correlated variables (|r| > 0.7). As a result, the island area and coastline length, which represent the area effects, showed a high correlation of 0.94, therefore the coastline length, which can directly represent the area of the intertidal zone, was selected (Tables S4–S6). In addition, we removed the other connectivity indices except for the connectivity of the 2000 m radius because of the strong correlations between the structural connectivity values of the 500, 1000, 2000, 3000, and 4000 m radius. To implement the conceptual model for the relationship between the environmental and biodiversity factors of each island, the multicollinearity effect of each model was evaluated using a variance inflation factor (VIF) [36]. We excluded the distance from the mainland based on the results of the VIF analysis (Table S7).
The effect of spatial autocorrelation was evaluated by utilizing a generalized least squares (GLS) model [37]. The geographic coordinates of each island were set as the spatial influences in the GLS model and the spatial and non-spatial models were compared. The fit of the spatial and non-spatial models was estimated using the Akaike Information Criterion (AIC) and the effect of the spatial autocorrelation was determined (Table S8). Therefore, we combined the geographic coordinates in pSEMs to account for the spatial autocorrelation. The model fit of pSEM was evaluated using Fisher’s C statistic, p-values, and AIC values. All the factors used in this study were normalized by log transformation to increase the linearity and normality and all the transformed factors were standardized to unify the units of the variables. The pSEM was performed using the piecewiseSEM package in R version 4.1.3 [38,39].

3. Results

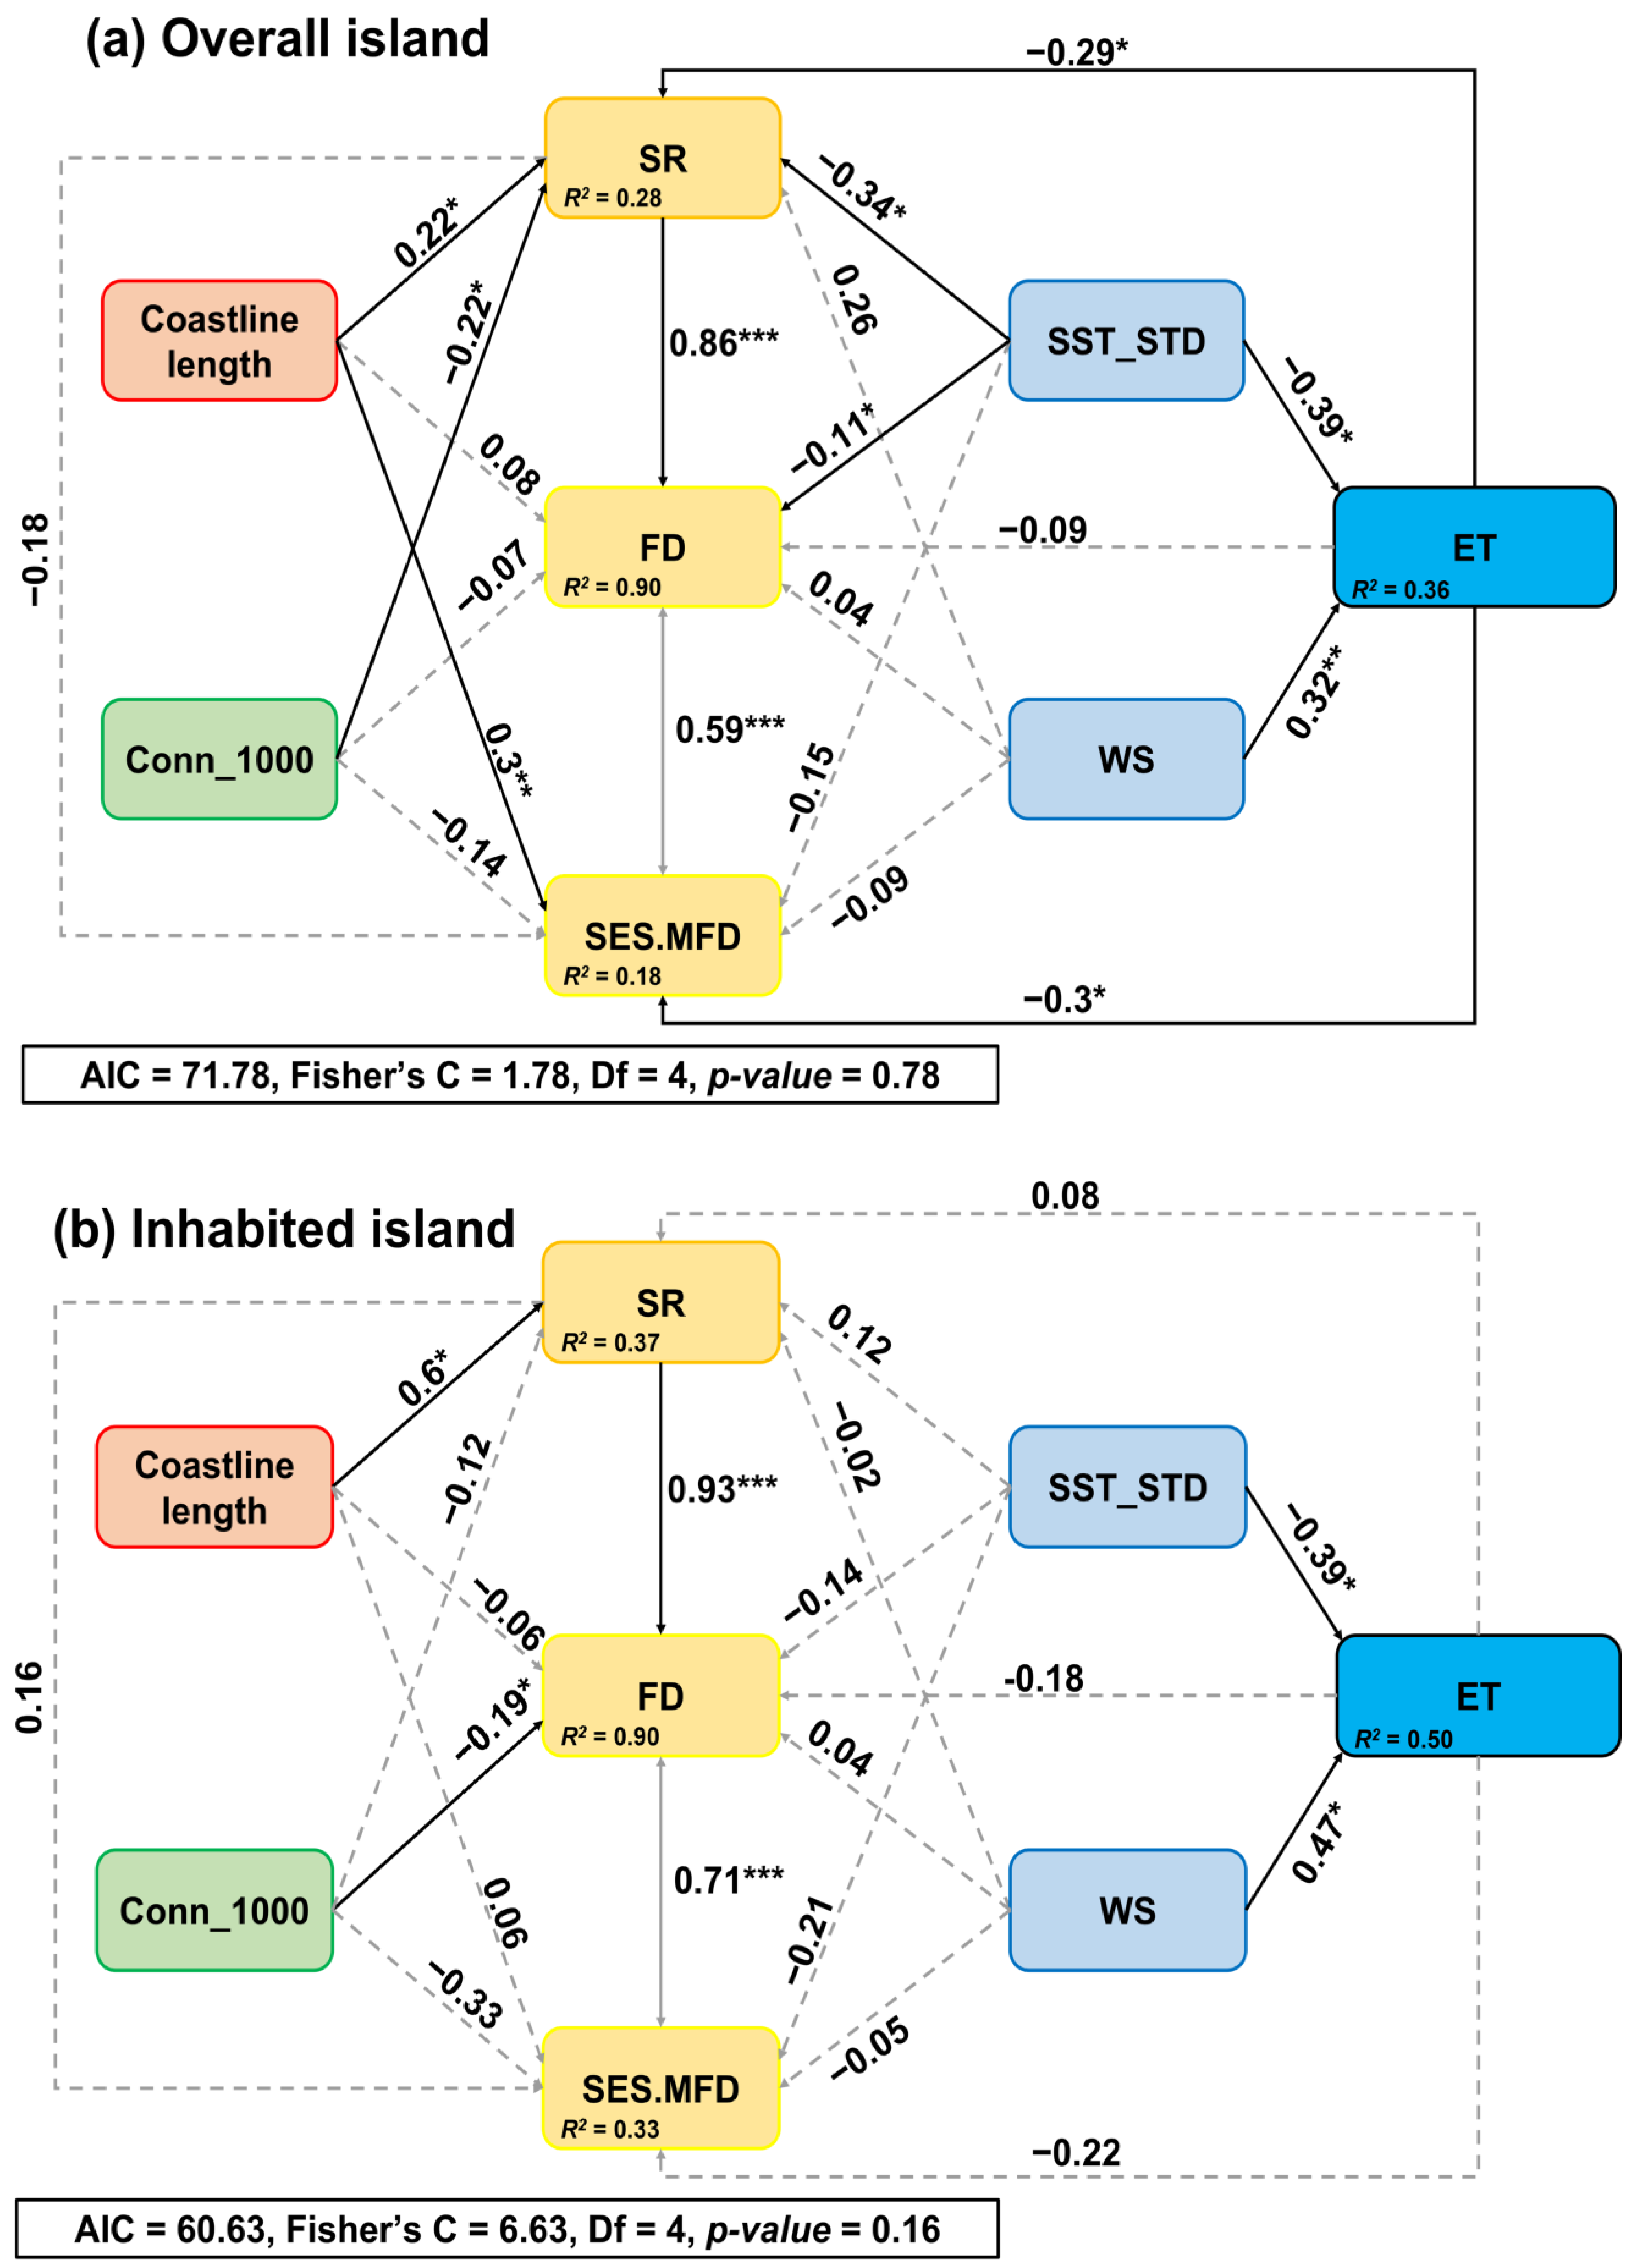
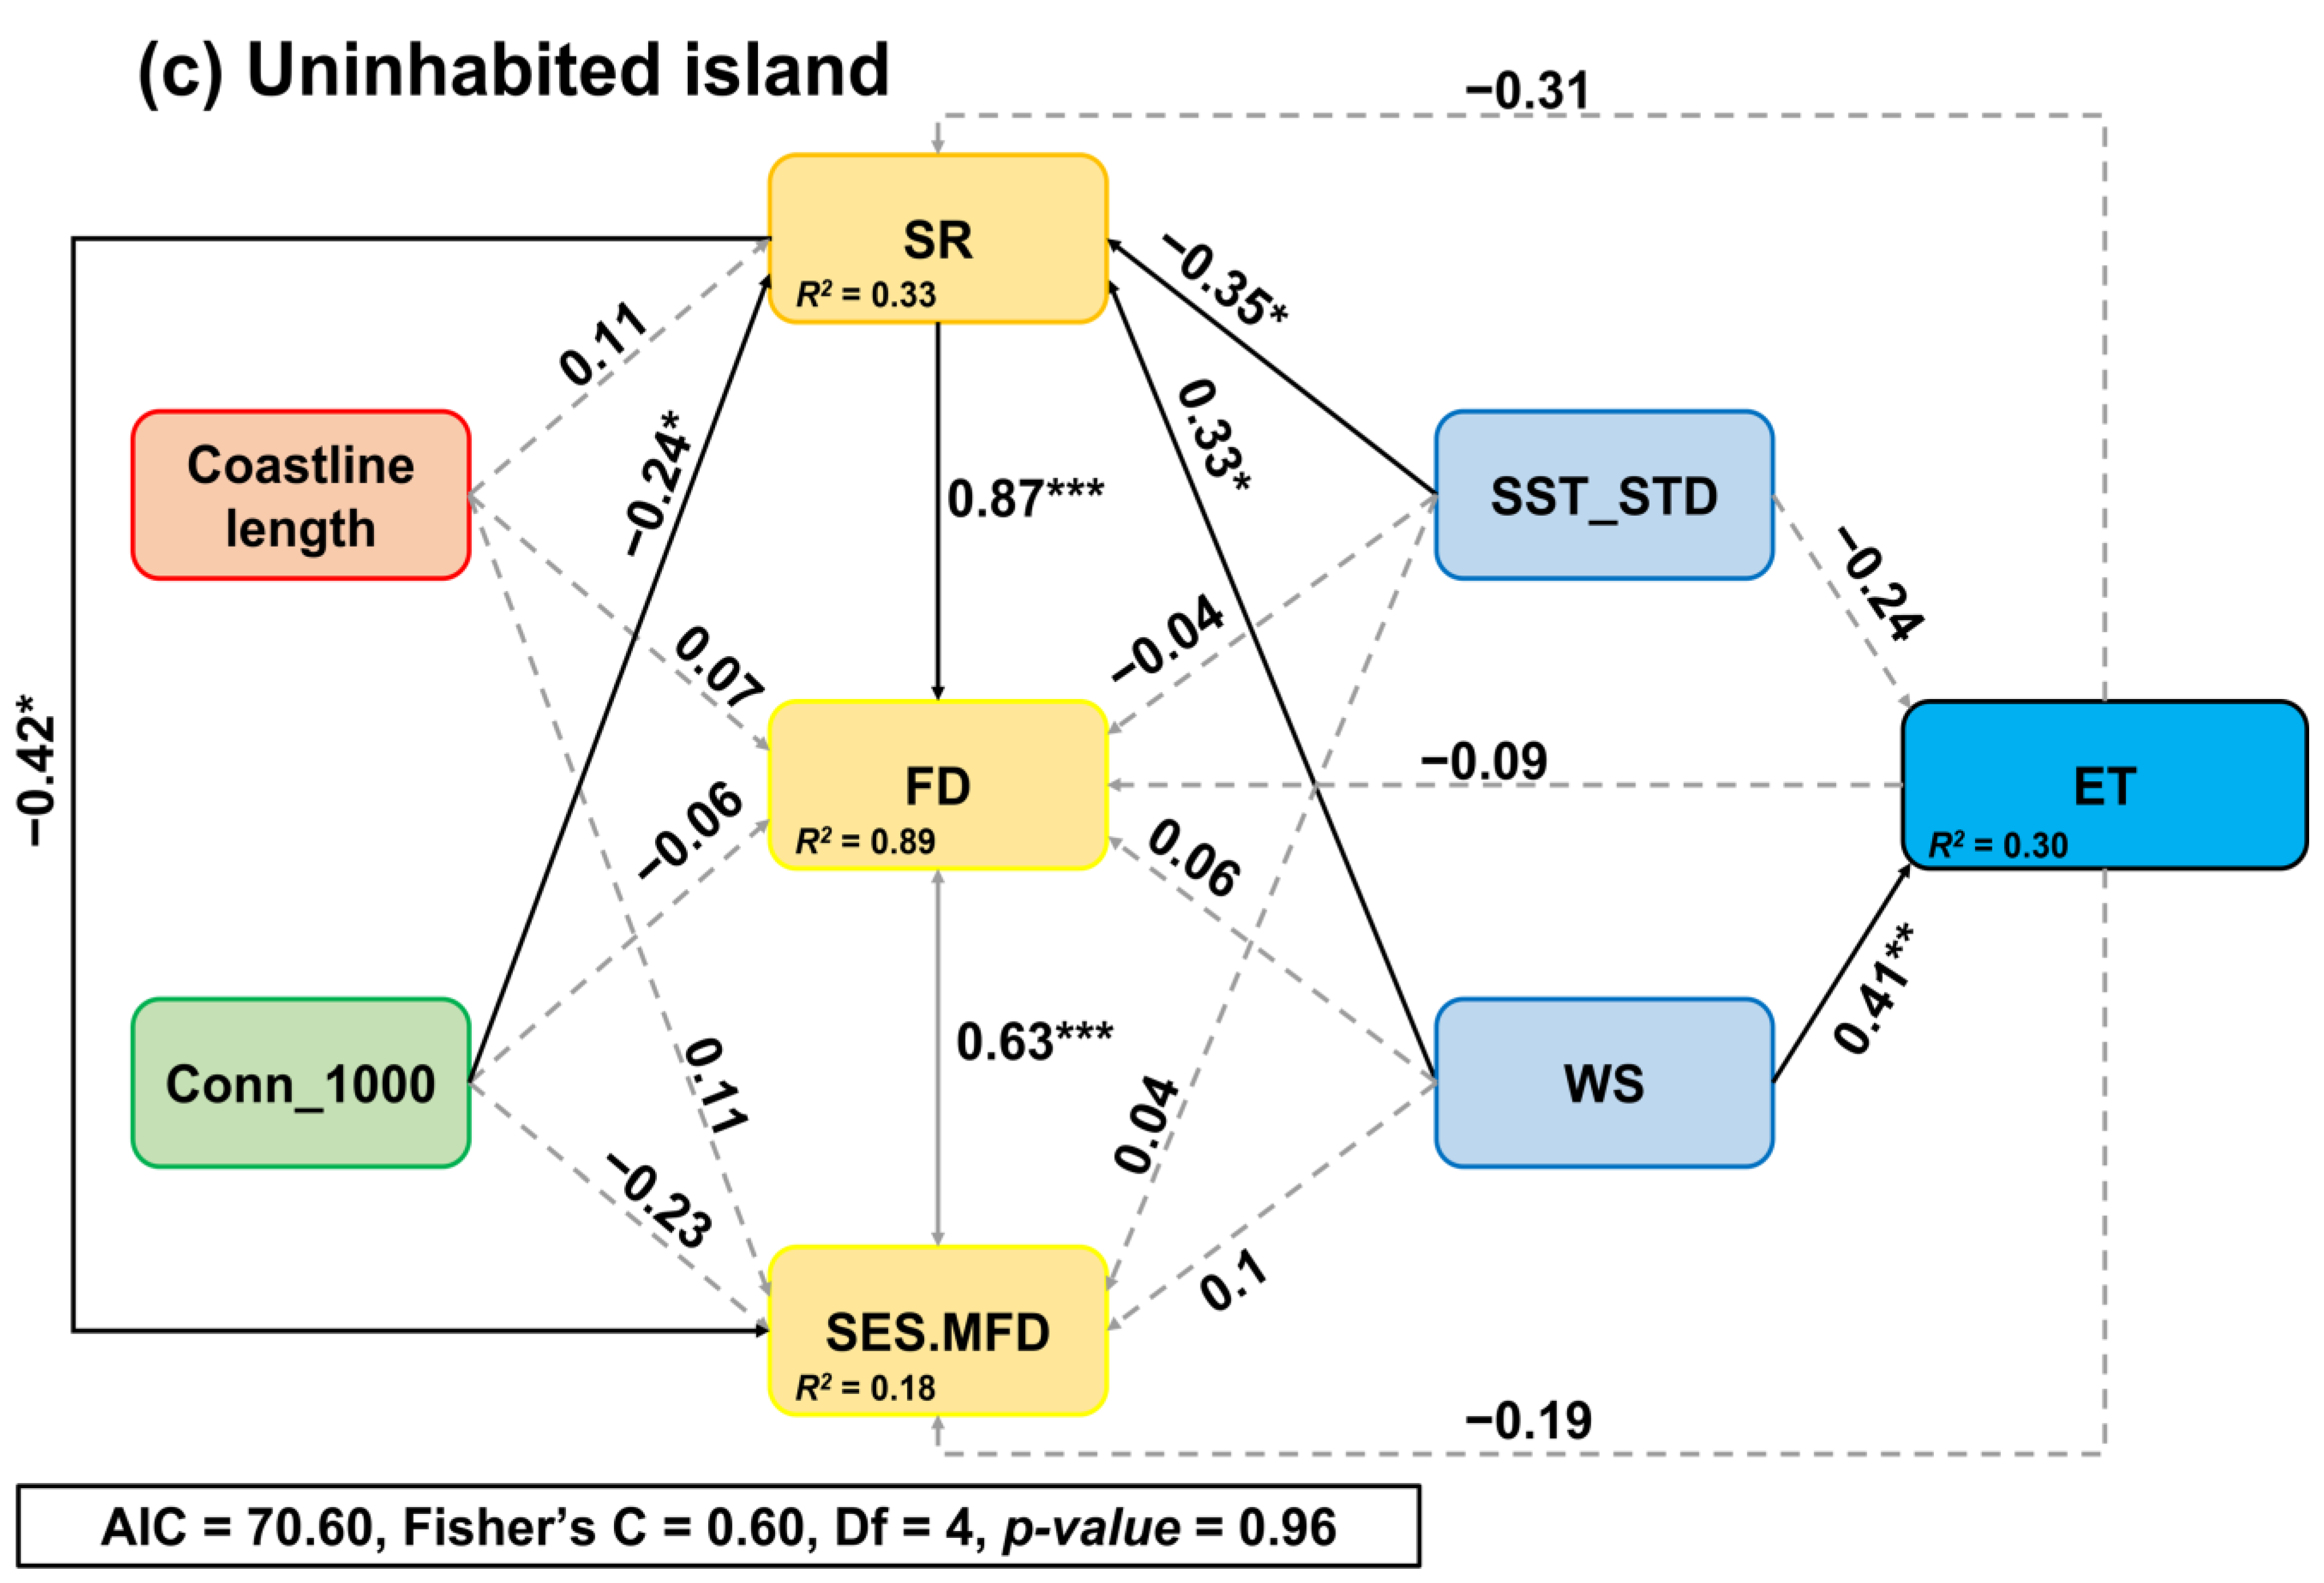
The result of the pSEM of the overall islands (Figure 3a; Table S9) indicated that the factors which directly affected the SR were the coastline length (β = 0.217, p = 0.036), structural connectivity (β = –0.223, p = 0.034), SST_STD (β = –0.336, p = 0.012), and ET (β = –0.294, p = 0.039). The FD was directly influenced by the SST_STD (β = –0.111, p = 0.021) and SR (β = 0.857, p ≤ 0.001). The SES.MFD was directly influenced by the coastline length (β = 0.301, p = 0.010) and ET (β = –0.297, p = 0.044). In other words, when the coastline length increased and ET decreased, the functional affinity was farther away and the groups of traits were more diversely distributed.
From the results of the pSEM of the inhabited islands (Figure 3b; Table S10), the only factor that directly affected the SR was the coastline length (β = 0.602, p = 0.015). In addition, the FD was directly influenced by the structural connectivity (β = −0.188, p = 0.048) and SR (β = 0.928, p ≤ 0.001). On the other hand, the SES.MFD was not directly affected by any environmental factors.
As for the results of the pSEM of the uninhabited island (Figure 3c; Table S11), the SR was directly influenced by the structural connectivity (β = −0.244, p = 0.044), SST_STD (β = −0.354, p = 0.024), and WS (β = 0.329, p = 0.021). There were no environmental factors that directly affected the FD and SES.MFD.
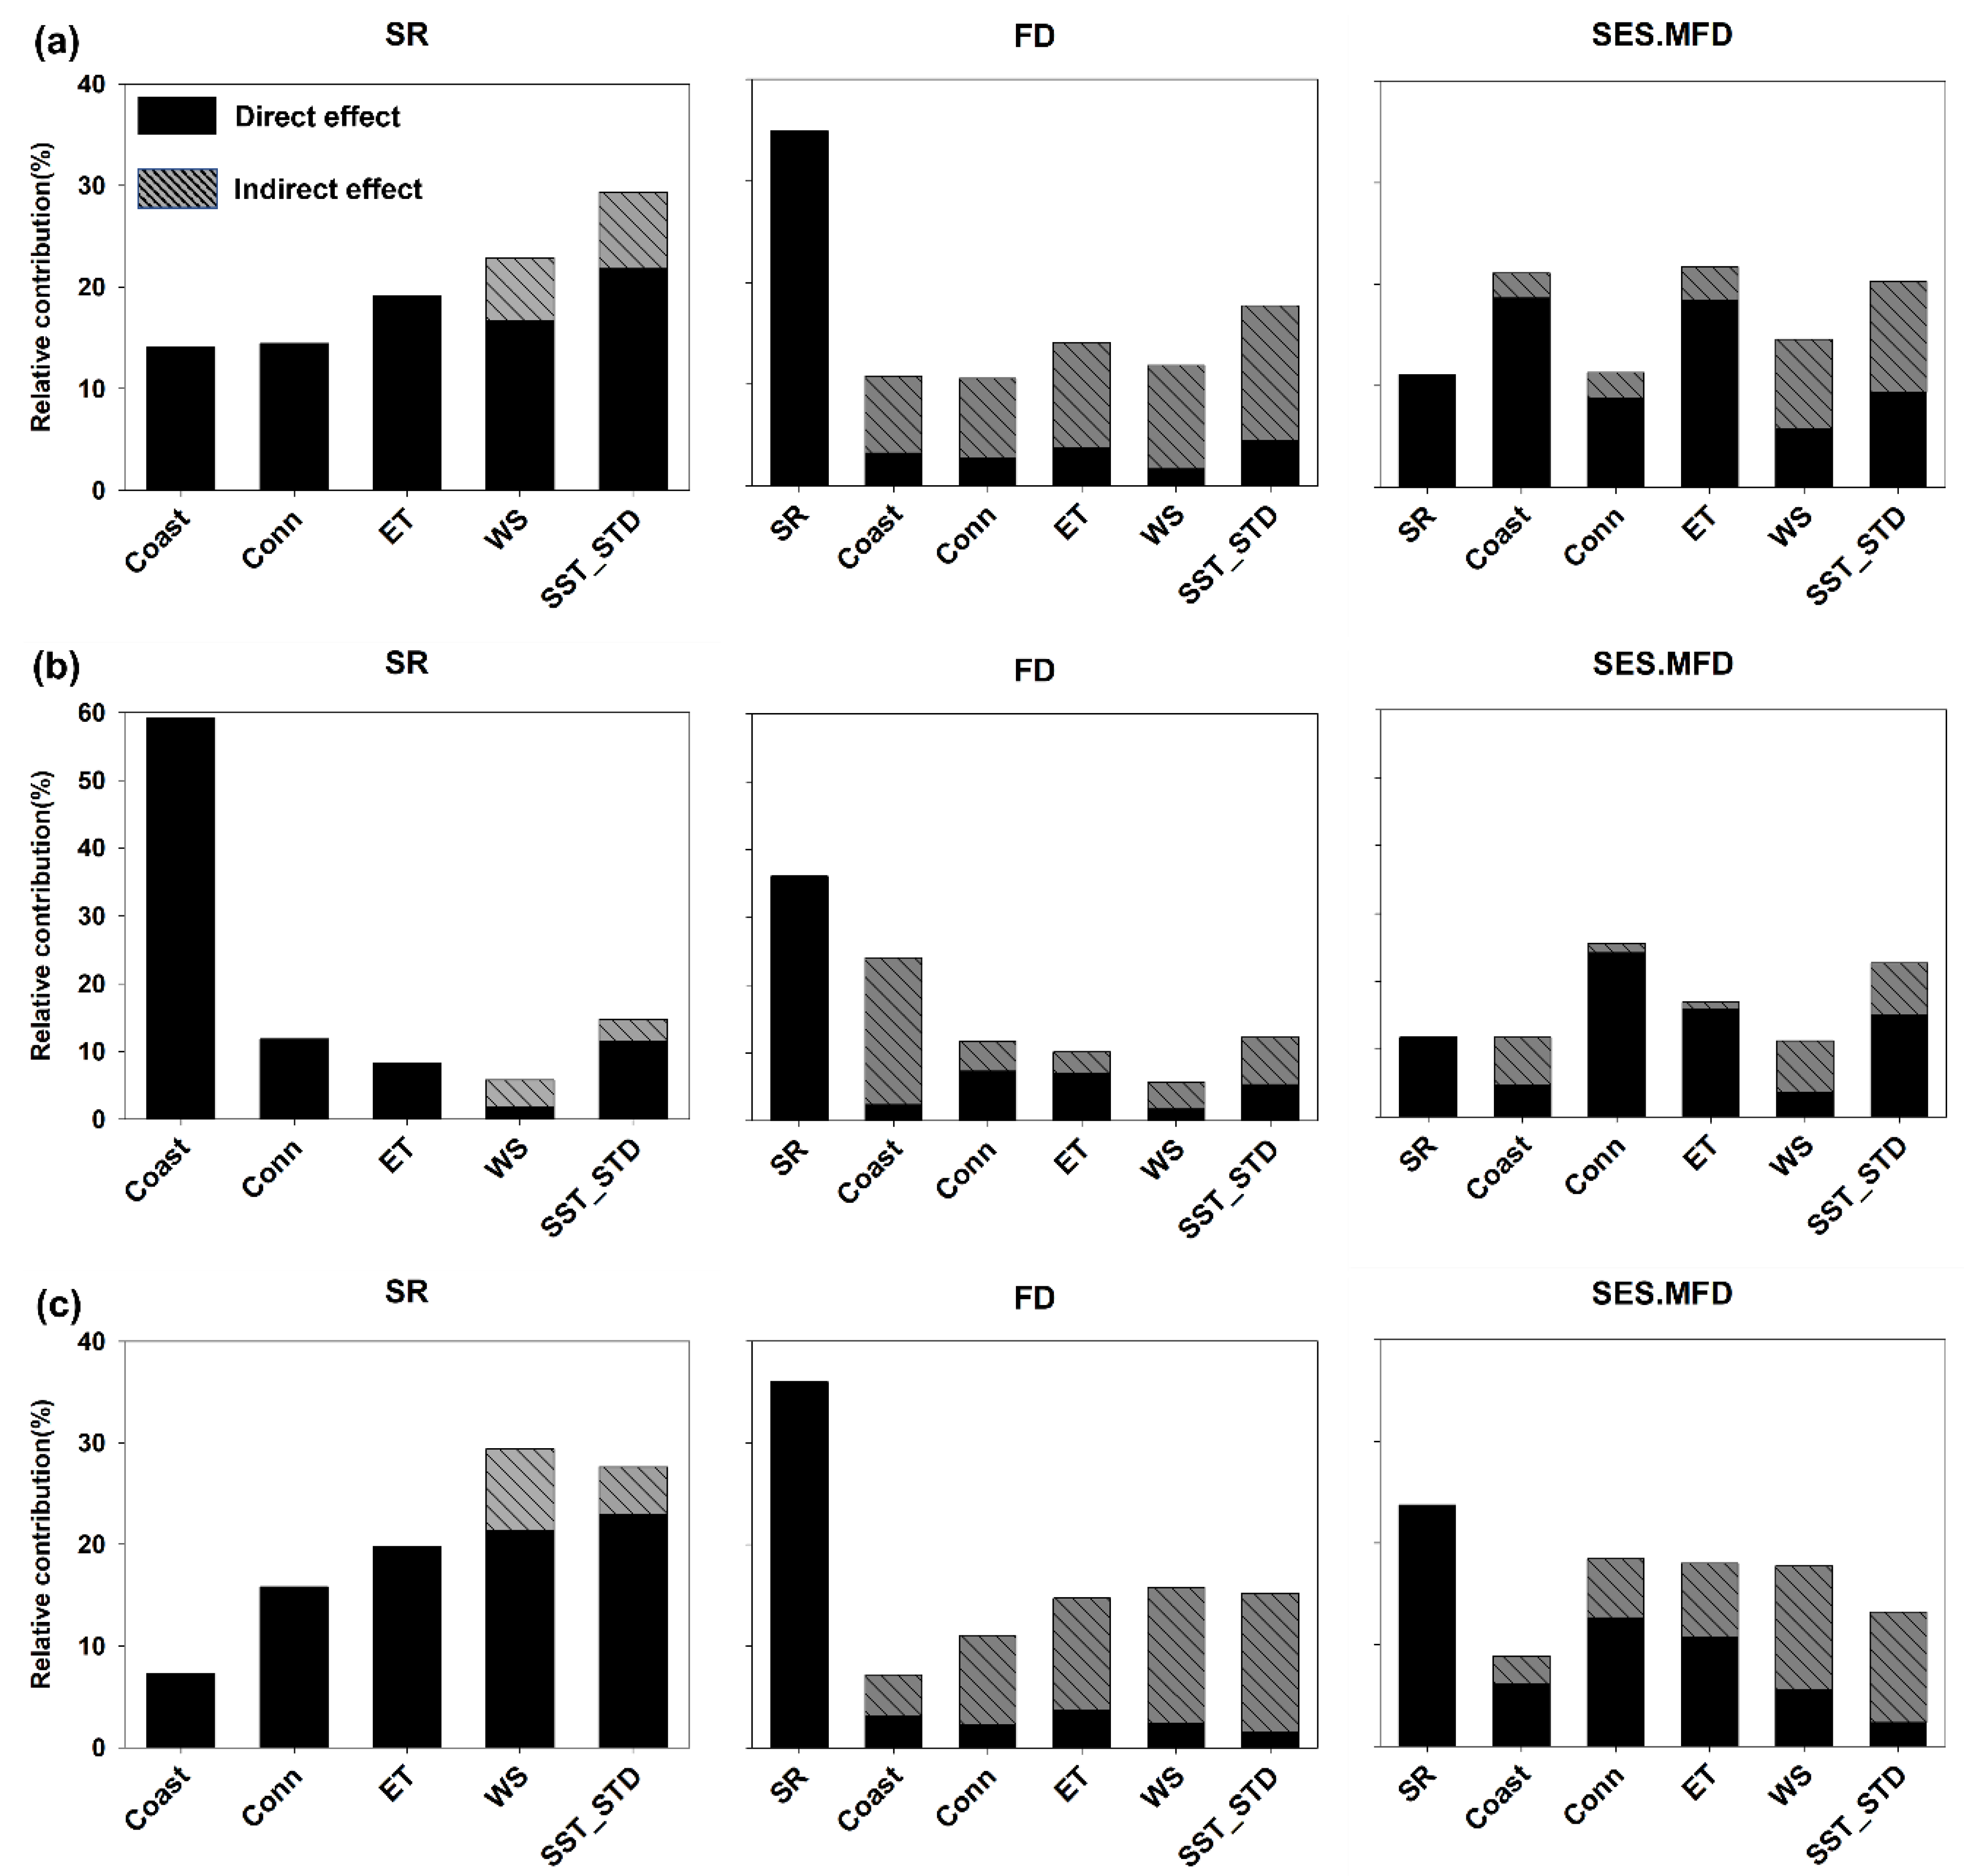
From the results of the relative importance of the environmental factors for the intertidal biodiversity (Figure 4) the ET, SST_STD, and WS influenced the SR by more than 70% in the overall and uninhabited islands. However, in the inhabited islands, the SR was mainly regulated by the coastline length and structure connectivity, which accounted for more than 70% of the total variation. In the case of the FD, the SR was the most important variable for all the island groups and the indirect effects of the environmental factors were stronger than the direct effects. The SES.MFD was controlled by the direct and indirect effects of the coastline length and ET in the overall islands and accounted for more than 50% of the variation. The structure connectivity and SR were the most important factors for the SES.MFD in the inhabited and uninhabited islands, respectively. In addition, we found similar results from the bivariate relationship analyses and multi-model inference tests (Figure 5 and Figure S4)

4. Discussion

Many previous studies on island ecosystems have predominantly focused on the terrestrial taxa including plants and birds [1,6]. Studies on intertidal organisms have mainly focused on simple quantitative indicators at the SR level or the status of species distribution, whereas studies on the FD and SES.MFD reflecting environmental adaptation filtering are few [13,40]. This study was conducted to overcome the limitations of these previous studies and comprehensively evaluate the ecological mechanisms of the community assembly processes of the invertebrates in the intertidal zones of the island regions. As a result, we found that the relative importance and contribution of the island landscape, moisture, and sea surface factors to the SR, FD, and SES.MFD of invertebrates in the intertidal zone differed (Figure 3). In addition, by comparing the inhabited and uninhabited islands with the different environmental conditions, we found that the relative importance of the environmental factors controlling the SR, FD, and SES.MFD in the intertidal zone were different (Figure 4). Below, we describe the ecological mechanisms related to the formation of the SR, FD, and SES.MFD in the intertidal zone and drivers between the inhabited and uninhabited islands.

4.1. Drivers of SR of the Intertidal Organisms across Overall Islands

We found that many environmental factors are involved in controlling the SR in the intertidal zone (Figure 3a; Table S9). In addition, the degree of contribution of each environmental factor to the SR was different (Figure 4a). Many previous studies, including the TIB by MacArthur and Wilson (1967), emphasized the area effect on the SR and found that the larger the island area, the more species there were [16,18]. This study also demonstrated a positive relationship between the SR of the intertidal organisms and island coastline length, which reflects the area effect of an island, suggesting that the area effect of the TIB also appears in the ecosystem of the intertidal zone. In particular, intertidal organisms require habitats with different characteristics, such as sand, rocks, and tidal flats [15]. Therefore, it is recognized that an increase in the horizontal habitat availability due to the increased island area, such as in the sampling effect [41] and habitat heterogeneity theory [42], contributed greatly to the increase in SR within the coastline.
The degree of island isolation in the TIB is an important landscape factor that determines the SR [5]. Most of the previous studies on the TIB showed that the SR increased when the structural isolation was lower [43,44]. This is related to the migration and colonization of species. The more potentially habitable islands around an island, the higher the possibility of overcoming the dispersal filtering for colonization and potential species establishment [45]. Kim and Lee [1] and Lee et al. [16] demonstrated that the SR of woody plants increased as the island structural connectivity increased. However, the results of this study showed a negative relationship between structural connectivity and the SR of the intertidal organisms (Figure 3a; Table S9). This can be interpreted in relation to the distribution between the islands within the study area. Most of the islands in HNM are distributed close to the mainland (average 2.09 km). In addition, most of the islands are centered around Hansando, which has the largest area among the study islands at 1482.8 ha, and is shaped like an archipelago (Figure 1, Table S12). Therefore, in this study, it is possible that factors related to island isolation, such as structural connectivity and distance from the mainland, are offset due to the close distance between the islands. In a previous study on the bird taxa in HNM, the structural connectivity did not affect the SR or showed a negative effect it due to these geographical conditions [46]. In addition, most of the recent studies on the TIB conducted in the Korean Peninsula reported that the SR was not controlled by the degree of isolation due to the stepping-stone effect of the distribution of the islands [16,47].
The intertidal zone is an extreme ecosystem that undergoes continuous rapid change [12]. Intertidal organisms are affected by environmental filtering for dryness, temperature, and wave energy, as well as competition for physical space [13]. These environmental factors determine the vertical diversity and habitat heterogeneity of the intertidal zone, which ultimately determines the SR [14]. In this study, the intertidal SR decreased as the ET and SST_STD increased (Figure 3a; Table S9). In addition, it was shown that it was more greatly influenced by the moisture and sea surface factors than the island landscape factors (Figure 4a).
When exposed to air, the intertidal organisms begin to lose water by evaporation. To tolerate this stress, it is necessary to have a body system that can withstand water loss or a mechanism that can minimize water loss until external water is available [31]. Intertidal organisms that do not have this mechanism or have a low critical point are unable to adapt to a relatively dry environment and become degraded and extinct [31].
The sea surface temperature does not have a large temperature change due to the inherent property of water with a high specific heat [48]. However, the intertidal zone is regularly exposed to the atmosphere and even a small temperature fluctuation can have a fatal effect on the intertidal organisms with an ectotherm [49]. In South Korea, the temperature differences between summer and winter are large, freezing occurs in some cases, and a daily temperature difference of 20 °C can occur in the intertidal zone [13,50]. To overcome these extreme conditions, intertidal organisms have developed behavioral mechanisms such as life cycles (avoiding seasons or times of day that are unfavorable for survival) or avoiding the detrimental environment (avoiding physical spaces in which survival is unfavorable), but these extreme environments can also cause organisms to escape their lethal limits [31].
According to the Climate Change Report, it is predicted that the SST will gradually rise in the future and the annual SST_STD will also be significantly different [51]. Our results showed that the higher the SST_STD, the more negatively affected the SR is of the intertidal organisms. A negative effect on the SR due to climate change will eventually lead to effects on the FD and SES.MFD. In other words, as climate change progresses, the SR, FD, and SES.MFD of the intertidal organisms may gradually decrease in South Korea. Our results suggest that the SR in the intertidal zone, which is located at the forefront of climate change in that sea levels rise and sea temperatures change, can be used as an indicator of climate change [52].

4.2. Drivers of FD and SES.MFD of Intertidal Organisms across Overall Islands

The FD, as quantified by Faith’s previously reported method, was shown to be strongly influenced by the SR (Figure 3a; Table S9). In addition, the relative importance of the environmental factors on the FD also showed a high indirect effect via the SR (Figure 4a). In general, the FD is a diversity index quantified for the functional traits of species appearing in a community and has different attributes from the SR [26,53]. However, our results indicate that an increase in the SR lead to an increase in the FD in the studied islands. These results suggest that the SR can potentially be used as a proxy for FD [28,54].
On the other hand, the SES.MFD did not show a significant relationship with the SR (Figure 3a; Table S9). This indicates that the SR and SES.MFD cannot be used as substitutes for each other. In addition, the SES.MFD was influenced by the positive and negative effects of the island coastline length and ET, respectively. In other words, the longer the coastline length, the farther away the functional affinity was (i.e., intertidal organisms with completely different functional traits formed the community) and the closer it is in a dry environment (i.e., intertidal organisms with similar functional traits formed the community). The effect of the island area on the SES.MFD was interpreted by the following three scenarios [6]: (a) when the functional relationship recedes with the increasing area, (b) when the functional relationship becomes closer as the area increases, and (c) when area and SES.MFD are not related [6]. Scenarios (a) and (b) result in selective extinction in which a population with a specific functional trait goes extinct according to the changes in area, but in case (c), it indicates random extinction ignoring the functional trait of the species and area of the island [55,56]. Selective extinction occurs in (a) and (b) as the absolute habitat area and niche decrease [57,58]. That is, the SES.MFD was determined by the extinction of species with characteristics that cannot adapt to a specific environment (i.e., environmental filtering; [59]) and the SES.MFD was determined according to the result of the resource competition regardless of the characteristics (i.e., competition exclusion [60]). This study shows the results for scenario (a) and it was judged that the factor determining the SES.MFD in the intertidal zone was affected more by environmental filtering than competition between species. In particular, the relative importance of ET was high and it appears that the more exposed to the dry environment, the closer the functional affinity is to the species with functional traits that can adapt thereto.

4.3. Drivers of the Intertidal SR, FD, and SES.MFD between the Inhabited and Uninhabited Islands

In general, uninhabited islands with a smaller area than inhabited islands are known to be vulnerable to natural disturbances [61]. In addition, the possibility of the extinction of a species due to sudden environmental changes is also higher than that of the inhabited islands [9]. Interestingly, the results of this study show that the SR of the intertidal organisms on the inhabited and uninhabited islands is influenced by opposite environmental factors (Figure 3b,c, Tables S10 and S11). It can be interpreted that the key factors related to these results are the area difference between the inhabited (average area: 171.75 ha; coastline: 45.4 km) and uninhabited islands (average area: 5.11 ha; coastline: 1.18 km; Table S13). The SR of the inhabited islands appears to only be strongly positively influenced by the coastline length and horizontal habitat availability, but not by the marine environmental factors such as ET, SST_STD, and WS. On the other hand, in determining the SR of the uninhabited islands, other environmental factors except for the coastline length, influence the SR with a mechanism similar to the results of the overall islands.
In particular, the WS representing the wave energy shows a positive relationship with the SR and has the greatest importance for SR (Figure 3c and Figure 4c). In the intertidal zone, wave action plays a more direct and indirect role in the organisms and community composition compared to other marine habitats [15]. Among them, the role of “expanding the limit of the intertidal zone” extends the limit line of the intertidal zone toward the center of the island by splashing to areas where the water cannot reach by only tidal action [31]. This increases the vertical diversity and area of the intertidal habitats, thereby increasing the range and diversity of organisms. The uninhabited islands with a small area can have a greater effect on wave action than inhabited islands [14,61]. These results suggest that the intertidal ecosystem of the uninhabited islands is more likely to turn over fluidly depending on the wave energy, moisture, and temperature rather than the absolute island area. Both the inhabited and uninhabited FDs are strongly influenced by the SR. In previous studies, the FD was used as a sub- or potential factor of SR [62]. Our results support the findings of the previous studies which indicated that the FD increases as the SR increases [28,54].
On the other hand, the SES.MFD showed differences between the inhabited and uninhabited islands. The SES.MFD of the inhabited islands was not controlled by any factor, whereas the SES.MFD of the uninhabited islands was negatively affected by the SR. This indicates that as the SR of an island increases, the SES.MFD is formed with species of similar functional groups [46]. That is, should a species migrate and settle on an island, there is a high probability that a specific functional group will become extinct while the functional group that is advantageous for adapting to the environment will survive [6]. These results can be interpreted as the environmental filtering effect exerts a stronger influence on the uninhabited islands than on the inhabited islands and supports the results of previously reported studies that uninhabited islands are more vulnerable to natural disturbances than inhabited islands [61].

5. Conclusions

Our results show that the SR, FD, and SES.MFD in the intertidal ecosystems of islands are complexly influenced by various environmental factors. Although there were limitations in the evaluation of the isolation effect due to the geopolitical characteristics of the HNM (i.e., close distance between the islands in the HNM), the intertidal ecosystem was also consistent with the results of other studies on the traditional TIB in terms of the area effect. In addition, we found that the factors related to the environmental stresses of moisture, temperature, and wave energy are powerful drivers for the determination of the SES.MFD of the intertidal organisms. The SES.MFD of the intertidal organisms became closer as the length of the coastline became shorter. Taken together, these results suggest that the SES.MFD of the intertidal ecosystems is mainly determined by environmental filtering. The results of our study also suggest that the SES.MFD analysis reflecting the functional traits as a measurement of biodiversity is essential for the general understanding of the island and intertidal ecosystems. In addition, it is emphasized that the marine environment factors such as WS, ET, and SST as well as the absolute island area should be considered in the conservation and management strategies of the intertidal biodiversity of islands. Finally, in intertidal ecosystems with multi-step complex food chains, studying the relationships between the various taxa (e.g., birds, plants, and fish) that have relationships such as prey, predation, symbiosis, and habitat provision is required [63]. Therefore, when monitoring and managing marine organisms in the intertidal zone, the terrestrial biota living in the intertidal zone should also be considered, and thus additional research on these should be conducted.

Supplementary Materials

The following supporting information can be downloaded at: https://www.mdpi.com/article/10.3390/d15070826/s1. Supporting Tables: Table S1. Species list of intertidal organisms observed in Hallyeo National Marine Park, South Korea. Abbreviations: I, inhabited island; U, uninhabited island. * Note: Table S1 was prepared in a different file (i.e., Excel file) with Table S2 and S3. The tables could not be included in this Supplementary Materials file due to the large file size. Table S2. Functional traits of intertidal organisms observed in Hallyeo National Marine Park, South Korea. Table S3. The data set used in this study. Abbreviations: Area, island area; Coast, coastline length; Distance, distance from the mainland; Conn_500, connectivity 500 m; Conn_1000, connectivity 1000 m; Conn_2000, connectivity 2000 m; Conn_3000, connectivity 3000 m; Conn_4000, connectivity 4000 m; SST_STD, sea surface temperature standard deviation; WS, wind speed; ET, evapotranspiration; SR, species richness; FD, functional diversity; SES.MFD, standardized effect size of mean pairwise functional distance; I, inhabited island; U, uninhabited island. Table S4. Pearson’s correlation coefficient among the environmental factors of the overall islands. Significant correlations are shown in bold (p < 0.05). Abbreviations for the factors are shown in Table S3. Significance levels are * p < 0.05, ** p < 0.01, and *** p < 0.001. Table S5. Pearson’s correlation coefficient among the environmental factors of the inhabited islands. Significant correlations are shown in bold (p < 0.05). Abbreviations for the factors are shown in Table S3. Significance levels are * p < 0.05, ** p < 0.01, and *** p < 0.001. Table S6. Pearson’s correlation coefficient among the environmental factors of the uninhabited islands. Significant correlations are shown in bold (p < 0.05). Abbreviations for the factors are shown in Table S3. Significance levels are * p < 0.05, ** p < 0.01, and *** p < 0.001. Table S7. The results of multicollinearity evaluation using variance inflation factor (VIF). Abbreviations for the factors are shown in Table S3. Table S8. Summary of the generalized least-squares (GLS) models of the relationships among intertidal biodiversity, community structure, and environmental factors in the overall, inhabited, and uninhabited islands used in the structural equation models to explain the influence of spatial autocorrelation. Abbreviations for the factors are shown in Table S3. Table S9. The direct, indirect, and total effects of the landscape and marine environment factors on species richness, function diversity, and community structure of the overall islands are based on structural equation models (Figure 3a). Significant effects of predictors are indicated in bold (p < 0.05). Abbreviations for the factors are shown in Table S3. Table S10. The direct, indirect, and total effects of landscape and marine environment factors on species richness, function diversity, and community structure of the inhabited islands based on structural equation models (Figure 3b). Significant effects of predictors are indicated in bold (p < 0.05). Abbreviations for the factors are shown in Table S3. Table S11. The direct, indirect, and total effects of landscape, and marine environment factors on species richness, function diversity, and community structure of the uninhabited islands based on structural equation models (Figure 3b). Significant effects of predictors are indicated in bold (p < 0.05). Abbreviations for the factors are shown in Table S3. Table S12. Summary data of all variables for the 78 islands in this study. Abbreviations for the factors are shown in Table S3. Table S13. Summary data of all variables for the 22 inhabited and 56 uninhabited islands in this study. Abbreviations for the factors are shown in Table S3. Supporting Figures: Figure S1. Functional trees of the intertidal species used to quantify functional diversity and community structure in overall islands in this study. Figure S2. Functional trees of the intertidal species used to quantify functional diversity and community structure in inhabited islands in this study. Figure S3. Functional trees of the intertidal species used to quantify functional diversity and community structure in uninhabited islands in this study. Figure S4. Standardized parameter estimates represent the effect size (circle) with the standard error (bar) of the landscape and marine environmental factors for biodiversity and community structure in intertidal zones of (a) overall, (b) inhabited, and (c) uninhabited islands. The closed and open circles indicate significant and non-significant relationships, respectively. Abbreviations for the factors are shown in Table S3.

Author Contributions

Conceptualization: M.-K.L. and C.-B.L.; Data collection and curation: M.-K.L.; Funding acquisition: C.-B.L.; Methodology: M.-K.L., Y.-J.L. and C.-B.L.; Analysis: M.-K.L. and Y.-J.L.; Supervision: C.-B.L.; Writing, review, and editing: M.-K.L., Y.-J.L. and C.-B.L. All authors have read and agreed to the published version of the manuscript.

Funding

This study was conducted with the support of the R&D program for Forest Science Technology (project no. 2019150C10-2323-0301 and project no. 2021346B10-2323-CD01) provided by Korea Forest Service (Korea Forestry Promotion Institute).

Institutional Review Board Statement

Not applicable.

Data Availability Statement

The datasets generated during and/or analyzed during this study are available from Supplementary Material S1.

Acknowledgments

We thank Hyung Seok Shim and Hae-In Lee of the Biodiversity and Ecosystem Functioning Laboratory of the Department of Forest Resources, Kookmin University, for their valuable support.

Conflicts of Interest

The authors have no competing interests to declare.

Abbreviations

Conn_1000, structure connectivity 1000 m; SST_STD, sea surface temperature standard deviation; WS, wind speed; ET, evapotranspiration; SR, species richness; FD, functional diversity; SES.MFD, standardized effect size of mean pairwise functional distance (community structure).

References

  1. Negoita, L.; Fridley, J.D.; Lomolino, M.V.; Mittelhauser, G.; Craine, J.M.; Weiher, E. Isolation-driven functional assembly of plant communities on islands. Ecography 2016, 39, 1066–1077. [Google Scholar] [CrossRef]
  2. Auffret, A.G.; Aggemyr, E.; Plue, J.; Cousins, S.A. Spatial scale and specialization affect how biogeography and functional traits predict long-term patterns of community turnover. Funct. Ecol. 2017, 31, 436–443. [Google Scholar] [CrossRef]
  3. Ottaviani, G.; Keppel, G.; Marcantonio, M.; Mucina, L.; Wardell-Johnson, G. Woody species in resource-rich microrefugia of granite outcrops display unique functional signatures. Austral Ecol. 2019, 44, 575–580. [Google Scholar] [CrossRef]
  4. MacArthur, R.H.; Wilson, E.O. The Theory of Island Biogeography; Princeton University Press: Princeton, NJ, USA, 1967; Volume 1. [Google Scholar]
  5. Si, X.; Cadotte, M.W.; Zeng, D.I.; Baselga, A.; Zhao, Y.; Li, J.; Wu, Y.; Wang, S.; Ding, P.; Meiri, S. Functional and phylogenetic structure of island bird communities. J. Anim. Ecol. 2017, 86, 532–542. [Google Scholar] [CrossRef] [PubMed] [Green Version]
  6. Si, X.; Cadotte, M.W.; Davies, T.J.; Antonelli, A.; Ding, P.; Svenning, J.C.; Faurby, S. Phylogenetic and functional clustering illustrate the roles of adaptive radiation and dispersal filtering in jointly shaping late—Quaternary mammal assemblages on oceanic islands. Ecol. Lett. 2022, 25, 1250–1262. [Google Scholar] [CrossRef]
  7. Davidar, P.; Yoganand, K.; Ganesh, T. Distribution of forest birds in the Andaman islands: Importance of key habitats. J. Biogeogr. 2001, 28, 663–671. [Google Scholar] [CrossRef] [Green Version]
  8. Chi, Y.; Sun, J.; Fu, Z.; Xie, Z. Spatial pattern of plant diversity in a group of uninhabited islands from the perspectives of island and site scales. Sci. Total Environ. 2019, 664, 334–346. [Google Scholar] [CrossRef]
  9. Avila, S.P.; Melo, C.; Berning, B.; Sá, N.; Quartau, R.; Rijsdijk, K.F.; Ramalho, R.S.; Cordeiro, R.; De Sá, N.C.; Pimentel, A.; et al. Towards a ‘sea-level sensitive’ dynamic model: Impact of island ontogeny and glacio-eustasy on global patterns of marine island biogeography. Biol. Rev. 2019, 94, 1116–1142. [Google Scholar] [CrossRef]
  10. Wu, P.; Zhang, H.; Singh, N.; Tang, Y.; Cai, Z. Intertidal zone effects on occurrence, fate and potential risks of microplastics with perspectives under COVID-19 pandemic. Chem. Eng. J. 2022, 429, 132351. [Google Scholar] [CrossRef]
  11. Somero, G.N. Linking biogeography to physiology: Evolutionary and acclimatory adjustments of thermal limits. Front. Zool. 2005, 2, 1. [Google Scholar] [CrossRef] [Green Version]
  12. Stickle, W.B.; Carrington, E.; Hayford, H. Seasonal changes in the thermal regime and gastropod tolerance to temperature and desiccation stress in the rocky intertidal zone. J. Exp. Mar. Biol. Ecol. 2017, 488, 83–91. [Google Scholar] [CrossRef]
  13. Wethey, D.S.; Brin, L.D.; Helmuth, B.; Mislan, K.A.S. Predicting intertidal organism temperatures with modified land surface models. Ecol. Model. 2011, 222, 3568–3576. [Google Scholar] [CrossRef]
  14. National Oceanic and Atmospheric Administration. What Is the Intertidal Zone? The Intertidal Zone Is the Area Where the Ocean Meets the Land between High and Low Tides, 2023. Available online: https://oceanservice.noaa.gov/facts/intertidal-zone.html (accessed on 4 April 2023).
  15. Kim, H.H.; Lee, C.B. On the relative importance of landscape variables to plant diversity and phylogenetic community structure on uninhabited islands, South Korea. Landsc. Ecol. 2021, 36, 209–221. [Google Scholar] [CrossRef]
  16. Lee, M.K.; Lee, H.S.; Lee, H.I.; Lee, S.W.; Lee, Y.J.; Lee, C.B. Relative importance of landscape and climate factors to the species diversity of plant growth forms along an East Asian Archipelago. Forests 2022, 13, 218. [Google Scholar] [CrossRef]
  17. Davison, J.; Moora, M.; Öpik, M.; Ainsaar, L.; Ducousso, M.; Hiiesalu, I.; Jairus, T.; Johnson, N.; Jourand, P.; Kalamees, R.; et al. Microbial island biogeography: Isolation shapes the life history characteristics but not diversity of root-symbiotic fungal communities. ISME J. 2018, 12, 2211–2224. [Google Scholar] [CrossRef] [PubMed]
  18. Li, S.P.; Wang, P.; Chen, Y.; Wilson, M.C.; Yang, X.; Ma, C.; Lu, J.; Chen, X.; Wu, J.; Shu, W.; et al. Island biogeography of soil bacteria and fungi: Similar patterns, but different mechanisms. ISME J. 2020, 14, 1886–1896. [Google Scholar] [CrossRef]
  19. Cho, Y.H.; Kim, Y.J.; Lim, H.M.; Han, Y.G.; Choi, M.J.; Nam, S.H. A faunistic study of insects of uninhabited islands in the Docho-myeon, Sinan-gun, Jeollanam-do. Korean J. Environ. Ecol. 2011, 25, 673–684. [Google Scholar]
  20. Lee, H.J.; Cho, K.M.; Hong, S.K.; Kim, J.E.; Kim, K.W.; Lee, K.A.; Moon, K.O. Management plan for UNESCO Shinan Dadohae Biosphere Reserve (SDBR), Republic of Korea: Integrative perspective on ecosystem and human resources. J. Ecol. Environ. 2010, 33, 95–103. [Google Scholar] [CrossRef] [Green Version]
  21. Hallyeo National Marine Park. A Report of Hallyeo Haesang National Marine Park (Tongyeong and Geoje) on the Fact-Finding Survey Uninhabited and Inhabited Islands; Hallyeo National Marine Park Eastern Management Office: Namhae-gun, Republic of Korea, 2016. [Google Scholar]
  22. Korea National Park. Hallyeo Haesang National Marine Park and Taean Coastal National Park Are A Paradise for Wildlife; Korea National Park: Seoul, Republic of Korea, 2015. [Google Scholar]
  23. Dong, J.Y.; Zhao, L.; Yang, X.; Sun, X.; Zhang, X. Functional trait responses of macrobenthos to anthropogenic pressure in three temperate intertidal communities. Front. Mar. Sci. 2021, 8, 756814. [Google Scholar] [CrossRef]
  24. Root, R.B. The niche exploitation pattern of the blue-gray gnatcatcher. Ecol. Monogr. 1967, 37, 317–350. [Google Scholar] [CrossRef]
  25. Emery, K.A.; Kramer, V.R.; Schooler, N.K.; Michaud, K.M.; Madden, J.R.; Hubbard, D.M.; Miller, R.J.; Dugan, J.E. Habitat partitioning by mobile intertidal invertebrates of sandy beaches shifts with the tides. Ecosphere 2022, 13, e3920. [Google Scholar] [CrossRef]
  26. Faith, D.P. Conservation evaluation and phylogenetic diversity. Biol. Conserv. 1992, 61, 1–10. [Google Scholar] [CrossRef]
  27. Swenson, N.G.; Erickson, D.L.; Mi, X.; Bourg, N.A.; Forero-Montaña, J.; Ge, X.; Howe, R.; Lake, J.K.; Liu, X.; Ma, K.; et al. Phylogenetic and functional alpha and beta diversity in temperate and tropical tree communities. Ecology 2012, 93, S112–S125. [Google Scholar] [CrossRef] [Green Version]
  28. Chun, J.H.; Lee, C.B. Partitioning the regional and local drivers of phylogenetic and functional diversity along temperate elevational gradients on an East Asian peninsula. Sci. Rep. 2018, 8, 2853. [Google Scholar] [CrossRef] [PubMed] [Green Version]
  29. National Institute of Biological Resources. Biodiversity of the Korean Peninsula, 2011. Available online: https://species.nibr.go.kr/ (accessed on 9 March 2023).
  30. National Biodiversity Center. National List of Species, 2018. Available online: https://www.kbr.go.kr/ (accessed on 10 March 2023).
  31. Hong, J.S.; Yoon, S.K. Marine Biology; Lifescience: Seoul, Republic of Korea, 1995. [Google Scholar]
  32. Hwang, P.A.; Teague, W.J.; Jacobs, G.A.; Wang, D.W. A statistical comparison of wind speed, wave height, and wave period derived from satellite altimeters and ocean buoys in the Gulf of Mexico region. J. Geophys. Res. Oceans 1998, 103, 10451–10468. [Google Scholar] [CrossRef] [Green Version]
  33. Aggemyr, E.; Auffret, A.G.; Jädergård, L.; Cousins, S.A. Species richness and composition differ in response to landscape and biogeography. Landsc. Ecol. 2018, 33, 2273–2284. [Google Scholar] [CrossRef] [Green Version]
  34. Spanowicz, A.G.; Jaeger, J.A. Measuring landscape connectivity: On the importance of within-patch connectivity. Landsc. Ecol. 2019, 34, 2261–2278. [Google Scholar] [CrossRef]
  35. Grace, J.B. Structural Equation Modeling and Natural Systems; Cambridge University Press: Cambridge, UK, 2006. [Google Scholar]
  36. Graham, M.H. Confronting multicollinearity in ecological multiple regression. Ecology 2003, 84, 2809–2815. [Google Scholar] [CrossRef] [Green Version]
  37. Legendre, P.; Legendre, L. Numerical Ecology; Elsevier: Amsterdam, The Netherlands, 2012. [Google Scholar]
  38. Lefcheck, J.S. piecewiseSEM: Piecewise structural equation modelling in r for ecology, evolution, and systematics. Met. Ecol. Evol. 2016, 7, 573–579. [Google Scholar] [CrossRef]
  39. R Core Team. R: A Language and Environment for Statistical Computing; R Foundation for Statistical Computing: Vienna, Austria, 2021. [Google Scholar]
  40. Portugal, A.B.; Carvalho, F.L.; de Macedo Carneiro, P.B.; Rossi, S.; de Oliveira Soares, M. Increased anthropogenic pressure decreases species richness in tropical intertidal reefs. Mar. Environ. Res. 2016, 120, 44–54. [Google Scholar] [CrossRef]
  41. Chase, J.M.; Knight, T.M. Scale-dependent effect sizes of ecological drivers on biodiversity: Why standardised sampling is not enough. Ecol. Lett. 2013, 16, 17–26. [Google Scholar] [CrossRef] [PubMed]
  42. Portillo, J.T.D.M.; Ouchi-Melo, L.S.; Crivellari, L.B.; de Oliveira, T.A.L.; Sawaya, R.J.; Duarte, L.D.S. Area and distance from mainland affect in different ways richness and phylogenetic diversity of snakes in Atlantic Forest coastal islands. Ecol. Evol. 2019, 9, 3909–3917. [Google Scholar] [CrossRef] [PubMed]
  43. Zhao, J.M.; Zhou, L.Z. Area, isolation, disturbance and age effects on species richness of summer waterbirds in post-mining subsidence lakes, Anhui, China. Avian Res. 2018, 9, 8. [Google Scholar] [CrossRef] [Green Version]
  44. Itescu, Y.; Foufopoulos, J.; Pafilis, P.; Meiri, S. The diverse nature of island isolation and its effect on land bridge insular faunas. Glob. Ecol. Biogeogr. 2020, 29, 262–280. [Google Scholar] [CrossRef]
  45. Wang, D.; Zhao, Y.; Tang, S.; Liu, X.; Li, W.; Han, P.; Zeng, D.; Yang, Y.; Wei, G.; Kang, Y.; et al. Nearby large islands diminish biodiversity of the focal island by a negative target effect. Anim. Ecol. 2022, 92, 492–502. [Google Scholar] [CrossRef]
  46. Lee, M.K.; Lee, S.W.; Lee, Y.J.; Lee, H.I. On the relative importance of landscape variables to bird diversity and community structure in Hallyeo Haesang National Marine Park. J. Nat. Res. 2021, 12, 145–158. [Google Scholar] [CrossRef]
  47. Choi, S.W.; An, J.S.; Yang, H.S. Effect of island geography on plant species on uninhabited islands in southeastern South Korea. Korean J. Environ. Ecol. 2015, 38, 451–459. [Google Scholar] [CrossRef] [Green Version]
  48. Levitus, S.; Antonov, J.; Boyer, T. Warming of the world ocean, 1955–2003. Geophys. Res. Lett. 2005, 32, L02604. [Google Scholar] [CrossRef] [Green Version]
  49. Jones, S.J.; Lima, F.P.; Wethey, D.S. Rising environmental temperatures and biogeography: Poleward range contraction of the blue mussel, Mytilus edulis L., in the western Atlantic. J. Biogeogr. 2010, 37, 2243–2259. [Google Scholar] [CrossRef]
  50. Scrosati, R.A. Low winter extremes in intertidal temperature in Nova Scotia in the absence of an ice foot. Front. Mar. Sci. 2022, 8, 2113. [Google Scholar] [CrossRef]
  51. IPCC Climate Change. The Physical Science Basis, Contribution of Working Group 1 to the Sixth Assessment Report of the Intergovernmental Panel on Climate Change; Cambridge University Press: Cambridge, UK, 2021. [Google Scholar]
  52. Mieszkowska, N. Intertidal Indicators of Climate and Global Change; Elsevier: Amsterdam, The Netherlands, 2021. [Google Scholar]
  53. Ding, Z.; Feeley, K.J.; Wang, Y.; Pakeman, R.J.; Ding, P.P. Patterns of bird functional diversity on land-bridge island fragments. J. Anim. Ecol. 2013, 82, 781–790. [Google Scholar] [CrossRef] [PubMed]
  54. Qian, H.; Hao, Z.; Zhang, J. Phylogenetic structure and phylogenetic diversity of angiosperm assemblages in forests along an elevational gradient in Changbaishan, China. J. Plant Ecol. 2014, 7, 154–165. [Google Scholar] [CrossRef] [Green Version]
  55. Emerson, B.C.; Gillespie, R.G. Phylogenetic analysis of community assembly and structure over space and time. Trends Ecol. Evol. 2008, 23, 619–630. [Google Scholar] [CrossRef]
  56. Whittaker, R.J.; Rigal, F.; Borges, P.A.; Cardoso, P.; Terzopoulou, S.; Casanoves, F.; Pla, L.; Guilhaumon, F.; Ladle, R.J.; Triantis, K.A. Functional biogeography of oceanic islands and the scaling of functional diversity in the Azores. Proc. Natl. Acad. Sci. USA 2014, 111, 13709–13714. [Google Scholar] [CrossRef] [Green Version]
  57. MacArthur, R.; Levins, R. The limiting similarity, convergence, and divergence of coexisting species. Am. Nat. 1967, 101, 377–385. [Google Scholar] [CrossRef]
  58. Purvis, A.; Agapow, P.M.; Gittleman, J.L.; Mace, G.M. Nonrandom extinction and the loss of evolutionary history. Science 2000, 288, 328–330. [Google Scholar] [CrossRef] [Green Version]
  59. Bregman, T.P.; Lees, A.C.; Seddon, N.; MacGregor, H.E.; Darski, B.; Aleixo, A.; Bonsall, M.B.; Tobias, J.A. Species interactions regulate the collapse of biodiversity and ecosystem function in tropical forest fragments. Ecology 2015, 96, 2692–2704. [Google Scholar] [CrossRef] [PubMed] [Green Version]
  60. Helmus, M.R.; Savage, K.; Diebel, M.W.; Maxted, J.T.; Ives, A.R. Separating the determinants of phylogenetic community structure. Ecol. Lett. 2007, 10, 917–925. [Google Scholar] [CrossRef]
  61. Chi, Y.; Shi, H.; Wang, Y.; Guo, Z.; Wang, E. Evaluation on island ecological vulnerability and its spatial heterogeneity. Mar. Pollut. Bull. 2017, 125, 216–241. [Google Scholar] [CrossRef]
  62. Mensah, S.; Veldtman, R.; Assogbadjo, A.E.; Glèlè-Kakaï, R.; Seifert, T. Tree species diversity promotes aboveground carbon storage through functional diversity and functional dominance. Ecol. Evol. 2016, 6, 7546–7557. [Google Scholar] [CrossRef]
  63. Jung, H.J. Marine Ecology; Seoul National University Press: Seoul, Republic of Korea, 2022. [Google Scholar]
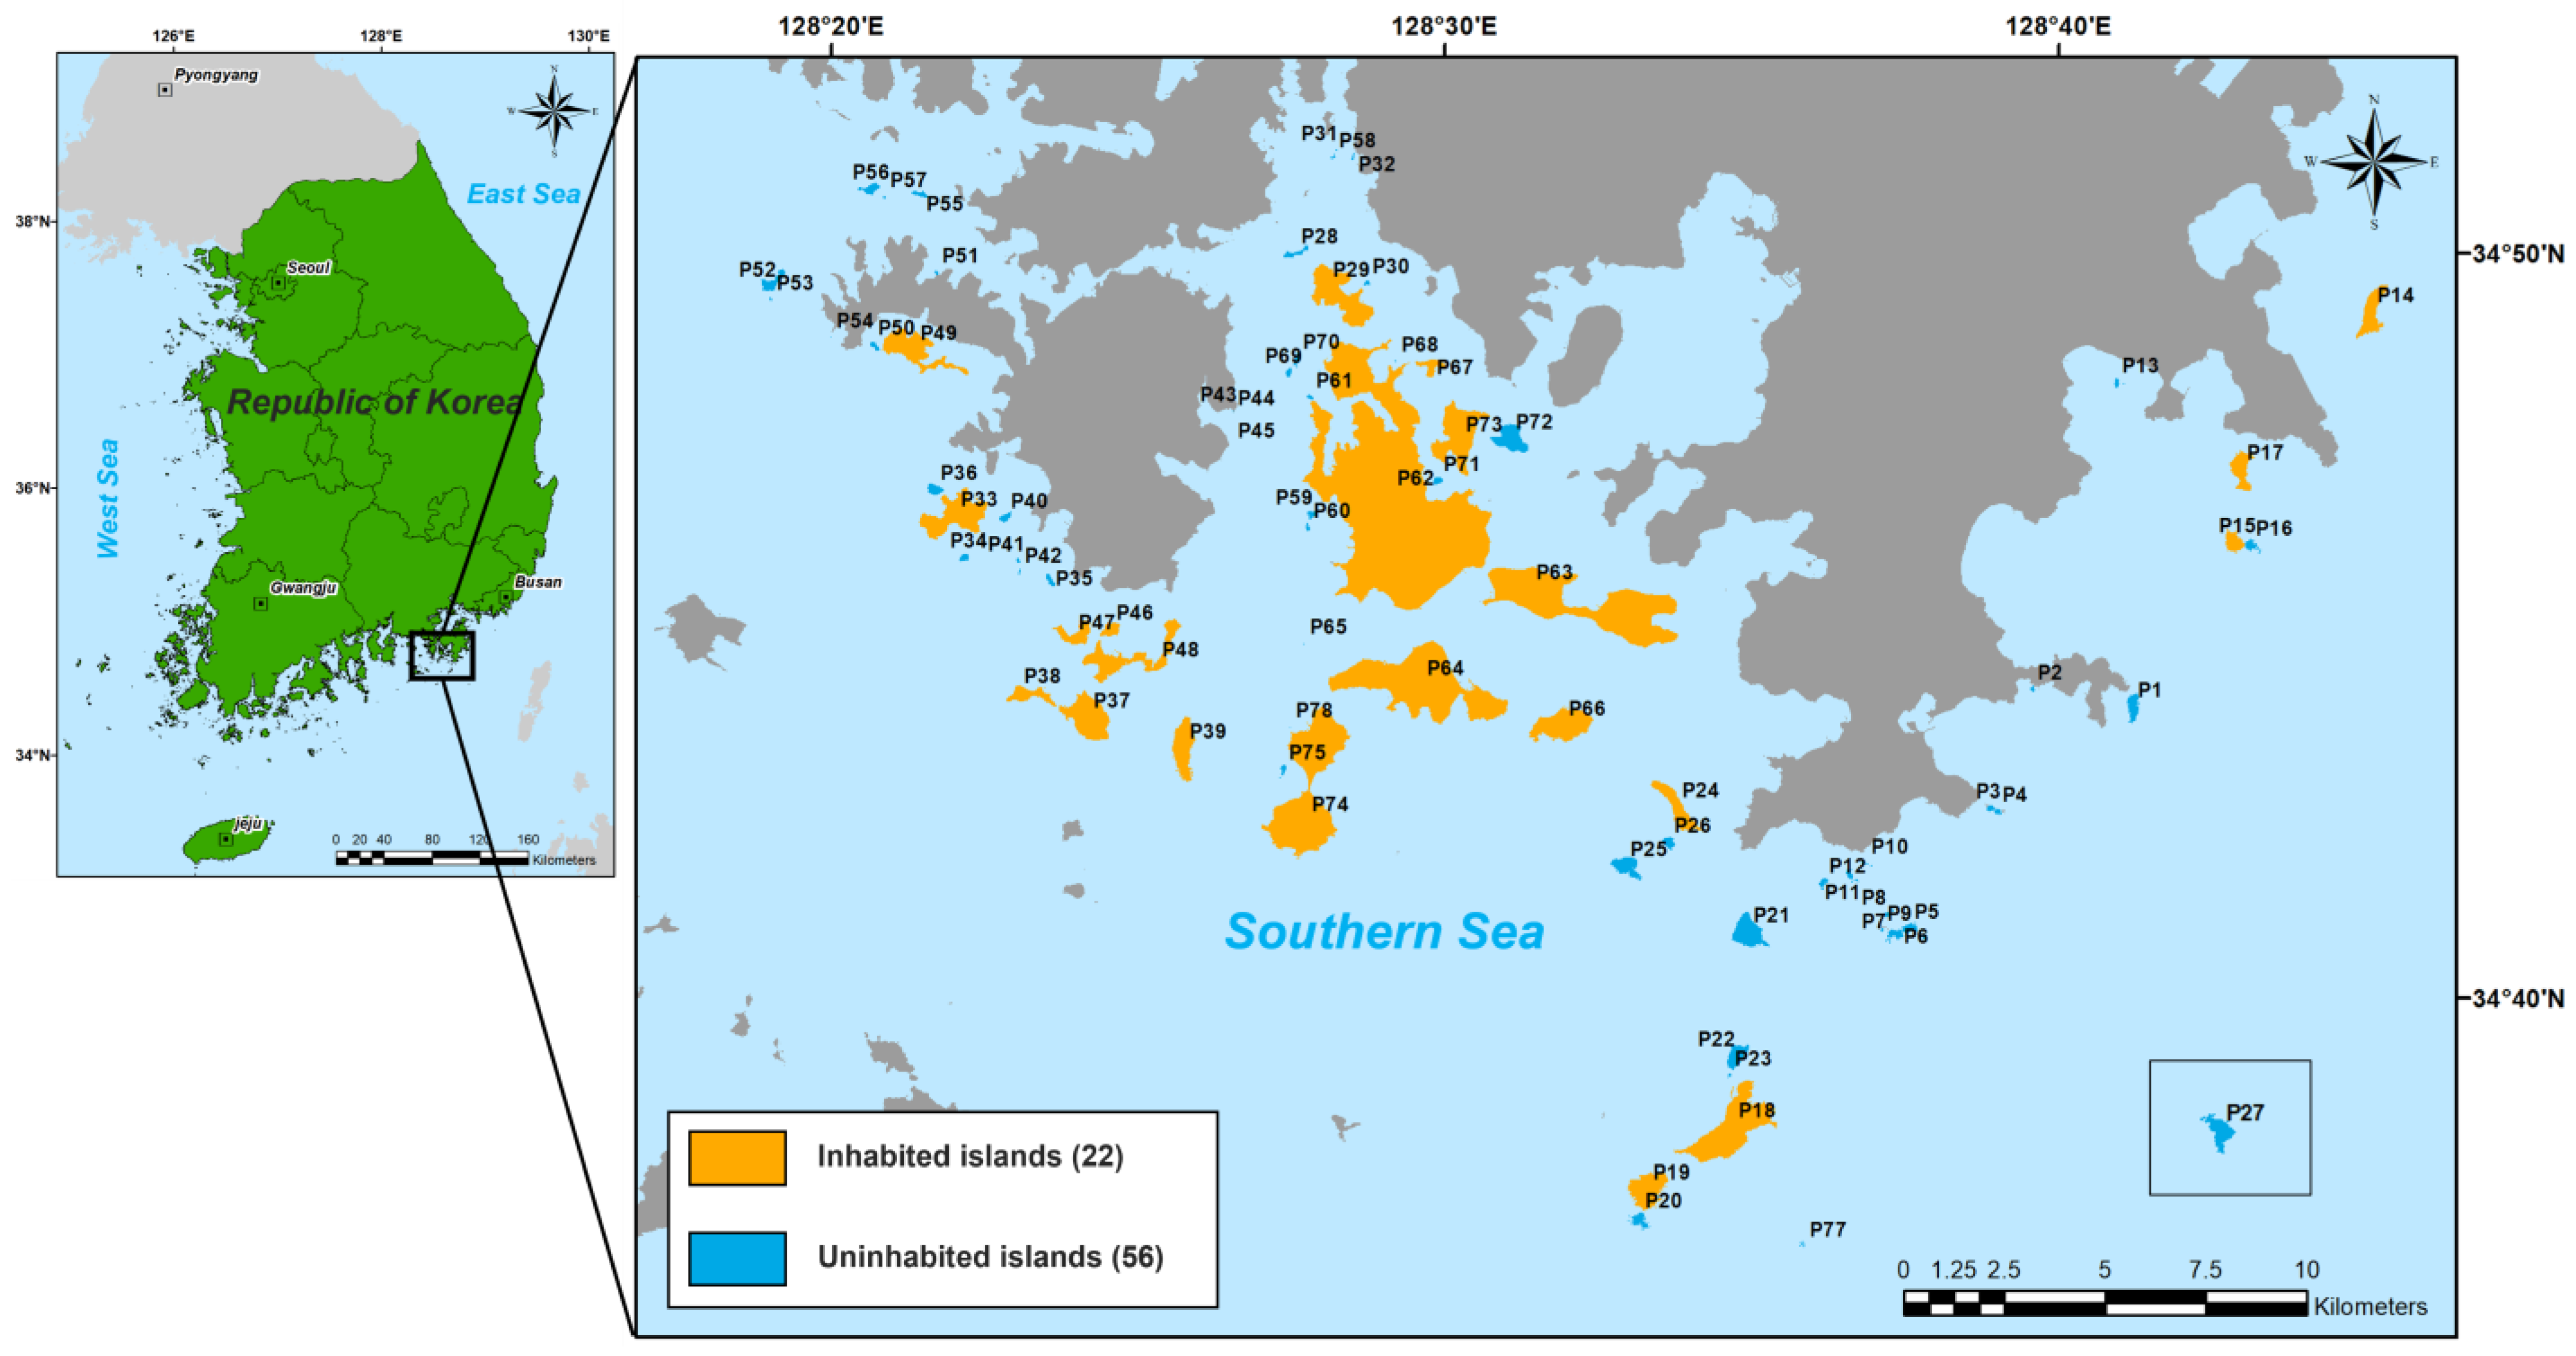
Figure 1. Location of the study islands of the Hallyeo National Marine Park, South Korea.
Diversity 15 00826 g001
Figure 2. Conceptual model of how the landscape and marine environmental factors affect the species richness, functional diversity, and community structure of the intertidal zones in the island of the Hallyeo National Marine Park, South Korea.
Diversity 15 00826 g002
Figure 3. Structural equation models accounting for the effects of the landscape and marine environmental factors on the intertidal SR, FD, and SES.MFD of the (a) overall, (b) inhabited, and (c) uninhabited islands of the Hallyeo National Marine Park. Black solid and gray dashed arrows represent significant (p < 0.05) and non-significant (p > 0.05) paths, respectively. The gray two-way arrow indicates the covariance between two variables. Standardized coefficients are shown for each path and covariance. Statistics to evaluate the goodness of fit for the structural equation models are provided. Abbreviations: Conn_1000, structure connectivity 1000 m; SST_STD, sea surface temperature standard deviation; WS, wind speed; ET, evapotranspiration; SR, species richness; FD, functional diversity; SES.MFD, standardized effect size of mean pairwise functional distance (community structure); AIC, Akaike Information Criterion; Fisher’s C, Fisher chi-square; Df, degrees of freedom.
Diversity 15 00826 g003aDiversity 15 00826 g003b
Figure 4. Relative contributions of multiple predictors on the intertidal SR, FD, and SES.MFD in the (a) overall, (b) inhabited, and (c) uninhabited islands of the Hallyeo National Marine Park, South Korea. The relative contribution was calculated as the ratio between the parameter estimate of the predictor and the sum of all parameter estimates and expressed as a percentage. Abbreviations: Conn, structure connectivity; SST_STD, sea surface temperature standard deviation; WS, wind speed; ET, evapotranspiration; SR, species richness; FD, functional diversity; SES.MFD, standardized effect size of mean pairwise functional distance (community structure).
Diversity 15 00826 g004
Figure 5. Bivariate relationships between the intertidal SR, FD, and SES.MFD and environmental factors in the (a) overall, (b) inhabited, and (c) uninhabited islands of the Hallyeo National Marine Park, South Korea. Solid lines in the scatter plots represent significant relationships.
Diversity 15 00826 g005
Table 1. Functional traits used to quantify the functional diversity and community structure in this study.
Functional
Category
Functional TraitUnitData Source
Structure sizeBody or shell sizemmNational Institute of Biological Resources, South Korea (2011)
Body formCylindrical-
Crustacean
Cnidaria
Bullate/Saccate
Bivalved/Gastropod
Vermiform
Radial
Dietary compositionSuspended plankton%National Biodiversity Center, South Korea (2018)
Seaweed (vegetable)
Aquatic animal
Dead organisms
Foraging behaviorMasticatory eating%
Filter feeding
Suction feeding
Perforation feeding
Habitat preferenceRocky intertidal zone%
Tidal flat intertidal zone
Gravel, Sand intertidal zone
Subtidal zone
Supralittoral zone
MobilityMovable-
Immovable
Disclaimer/Publisher’s Note: The statements, opinions and data contained in all publications are solely those of the individual author(s) and contributor(s) and not of MDPI and/or the editor(s). MDPI and/or the editor(s) disclaim responsibility for any injury to people or property resulting from any ideas, methods, instructions or products referred to in the content.