Article

Biodiversity during Pre and Post Hula Valley (Israel) Drainage

MIGAL, Scientific Research Institute, P.O. Box 831, Kiryat Shmone 11016, Israel
Diversity 2023, 15(6), 758; https://doi.org/10.3390/d15060758
Submission received: 9 May 2023 / Revised: 29 May 2023 / Accepted: 3 June 2023 / Published: 8 June 2023

Abstract

:
The natural ecosystem of the Hula Valley (Israel) comprising shallow old lake Hula, swamps and partly cultivated land was altered by drainage. The drained area was converted for agricultural development. The natural wetland–lake ecosystem was demolished. A reduction in biodiversity and a negative impact on the downstream Lake Kinneret water quality were predicted. Forty years later, a reclamation project was implemented aimed at renovation of the hydrological conditions, and agricultural development was improved. The recorded inventory of plants, birds and fish pre- and post-drainage and reclamation was comparatively evaluated resulting in an indication of Biodiversity Index (BDI) and Species Richness (SR) enhancement in the present. It is suggested that the resulting increase in ecological habitat varieties suitable for terrestrial, semi-aquatic and aquatic organisms enhanced the biodiversity. Nevertheless, it is not impossible that the newly created conditions which enhanced the biodiversity require a risk assessment to ensure the long-term sustainability of the integration of agriculture and nature.

1. Introduction

Ecosystem fertility is dependent on nutrient and water availability which are the drivers of the system of production. The anthropogenic and natural maintenance of ecosystem products such as biodiversity, species richness, agriculture, recreation or eco-tourism is significantly affected by management. The appropriate management might be natural, without human intervention, or anthropogenic, or a combination of both. The management of the Hula Valley, a part of the Lake Kinneret drainage basin, represents an integration of human and natural dependence. The involvement of climate conditions recently became critical. The hydrological extremism resulting from climate change is ranged between water scarcity and profusion. Therefore, the integration between key factors of the economic benefits of agricultural crop production, and protection of the Kinneret’s water quality and biodiversity, is crucial for the management design of the Hula Valley. The availability of nutrients controls the production of the Hula Valley ecosystem whilst a significant part of the nutrient sources are external and they are transported by water. Consequently, the impact of regional hydrology is critical for the migrated nutrient supply and the maintenance of biodiversity and agricultural development. If inappropriate anthropogenic intervention is carried out, the desirable ecosystem services such as biodiversity, agricultural income and protection of the lake’s water quality are interfered with. The results of the study of the consequences of the drainage of the Hula Valley, followed by the reclamation project, from regional hydrology through nutrient dynamics showed a richness in species of flora and fauna. This paper aspires to be a follow-up on the change in species richness as affected by the Hula drainage.

2. Background

2.1. Geology and Hydrology

The Kinneret drainage basin area is 2730 km2 of which the Hula Valley is about 200 km2. The major water source feeding Lake Kinneret’s headwaters is the rocky karst springs of Mount Hermon. The area of the Mount Hermon range (789 km2) is an uplifted massif of Jurassic and Lower Cretaceous limestone comprising the highest altitude (peak 2814 MASL) of the watershed. The central part of the drainage basin, the Hula Valley (70–90 MASL), is covered by deposited sediments 1000–1500 m in thickness. The water input into Lake Kinneret comes through three major headwater rivers, the Hatzbani (Snir), Banyas (Hermon), and Dan, and several other smaller rivers merging into one as the River Jordan and crossing the Hula Valley. The Jordan contributes about 65% of the Kinneret water budget. Until the mid-1950s the Hula Valley was covered by the shallow old Lake Hula and swampy wetlands. During the 1950s, the Hula Valley was drained and converted into arable land suitable for agricultural development. Lake Kinneret is located below sea level in the northern part of the Syrian-African Graben in northern Israel. The Hula Valley is part of the Lake Kinneret watershed which significantly affects Lake Kinneret’s water quality. Kinneret, the only natural freshwater lake in Israel, is a body of water with multipurpose utilization: water supply, fishery, recreation, and intra- and international tourism. The ecological relationship between the Hula Valley and Lake Kinneret is of national and international concern. The climate of the Kinneret drainage basin is sub-tropical, where the winter is short, wet, and cold and the summer is long, dry, and hot. The rainfall regime in the catchment varies between 900 mm/y in the north and 500 mm/y in the southern part. Lake Kinneret’s waters are conveyed along 130 km from the northern to the southern part of the country for domestic and agricultural supply and underground aquifer recharge. The Lake Kinneret water balance is dependent on climate (rainfall and consequent river discharge), water consumption (pumping withdrawal), and evaporation.

2.2. Hula Drainage

Prior to the 1950s, the Hula Valley was covered by swampy wetlands and old Lake Hula. Then, the Hula Valley was drained and the ecosystem was modified from a natural wetland habitat to agricultural land use development. Prior to the 1950s, most of this area was not cultivated, malaria was common, and water loss by evapotranspiration was significant. The anxious search for agricultural income resources and assurance of the national water supply in the northern part of the newly created state of Israel initiated the national project of the Hula Drainage. The implementation of this project has been accompanied by research and monitoring of the ecological trait aimed at crop harvest improvement. Forty years after drainage and agricultural development, it has seen inappropriate irrigation and cultivation methods and enhanced deterioration of the peat soil quality, accompanied by heavy dust storms, subsidence of the soil surface, blocking of drainage canals, underground fires, and rodent (Microtus socialis) outbreaks. Consequently, the Hula Reclamation Project (HRP) was implemented (1994–2006). Before the drainage, nitrogen was flushed from the Hula Valley downstream into Lake Kinneret, which was mostly ammonium, and after the drainage, it was modified to nitrate due to peat soil oxidation. Domestic and dairy raw sewage produced by local residents was removed from the Kinneret inputs, stored in reservoirs, and reused, and fish ponds in the valley were restricted from 1700 to 3.5 ha. The hydrological system and irrigation method over the entire valley was modified. The implementation of the HRP resulted in a successful 70-year (1953–2023) mega-ecological-agricultural anthropogenic project in the Hula Valley and the biotic natural species richness was changed. Moreover, eco-tourism has been established by the creation of the shallow Lake Agmon-Hula and open uncultivated fields around, enabling optimal regulation of visits by the public and in particular bird watchers. Pollutant effluents from Lake Agmon-Hula were found to be minor. That infrastructure has attracted numerous bird flocks followed annually by thousands of recreational and bird-watching visitors. Income for the landowners has improved whereas costly maintenance for crop protection required partial deportation of the damaging migratory birds. The Hula drainage and the HRP are two of the greatest ecological projects carried out in Israel since the late 1950s. The Hula Project involved enhanced collaboration between nature authorities, water managers, landowners, regional municipalities and nature conservationists. As part of the nature conservation achieved after the Hula drainage, a comparative evaluation of the biotic species richness of the ecological community in the Hula Valley was carried out. Species richness is also considered as species diversity. In fact, the Hula Valley ecosystem is a constructed wetland including natural and anthropogenic components. Therefore, its maintenance depends upon the cooperation between farming, nature conservation and water quality protection, and monitoring continuity in this fragile ecosystem is imperative.

3. Material and Methods

This mega-ecological project included the construction of the shallow Lake Agmon-Hula enabling the control of nutrient migration from the Hula Valley to protect Lake Kinneret’s water quality, and the introduction of plants and fish and reconstruction of the hydrological system to improve public tourism. Nevertheless, Climate Change Conditions (CCC) significantly affected the water balance of Lake Agmon-Hula and the Kinneret ecosystems.
Pre- and Post-drainage Land-Use-Land-Cover in the Hula Valley is given in Table 1 [1].
For the evaluation of Species Richness Distribution and the Biodiversity Index before and after the drainage in the Hula Valley the following parameters were considered:
  • Aves: Israeli part of the Kinneret drainage basin—199.2 × 10³ ha [1].
  • Plants: Hula Project land—5.9 × 10³ ha (Table 1).
  • Fish: Water-covered land—0.6 × 10³ ha (Table 1).
  • Data Sources
  • Institutional:
  • Kinneret Limnological Laboratory, IOLR, (LKDB): Information about Lake Kinneret [2].
  • Hula Reclamation Project (HRP): MIGAL-Scientific Research Institute, Keren Kayemeth LeIsrael (KKL), National Water Authority: Information about Hula Valley in Annual Reports: Hydrological, Climatological and Nutrients dynamics, Animal and Plant distribution [3,4].
  • Lake Kinneret and its Drainage Basin Authority [5]: Information about anthropogenic activity in the Hula Valley.
    Books:
  • Lake Kinneret, Monographiae Biologicae Vol 32 [6];
    Lake Kinneret, Chapter 1, The Lake [7];
  • Different Kinneret [8];
  • Agriculture, Recreation, Water Quality and Nature Protection in the Hula Valley, Israel. 70 years of a Mega-ecological Project, Springer Geography [9];
  • The Role of Red Lines” in Safeguarding the Sea of Galilee (Lake Kinneret) [10];
  • Israel Water Resources, Chapter on Hydrology and Environmental Sciences, Yad Ben-Zvi Press, Jerusalem [11];
  • Lake Hula. Israeli Academy of Sciences and Humanities, Jerusalem [12]
  • Hula Project Monitoring Summarized Report, Long-Term Analysis, National Water Authority, Jewish National Fund (KKL), Farmers of the Peat Soil Convention; Project No. 4501334109, ref. [13]
The number of recorded species of vascular plants, avifauna, and fish before and after the drainage was compiled from [12,13]. Species Richness values were evaluated from group (bird, plant, fish) species numbers which were normalized per aerial unit of 102 ha. The area for each group was evaluated from data given in Table 1: from the group species number, the Biodiversity Index was calculated as the ratio between the group species number divided by the total species number.

4. Results

Ecological Changes Post Drainage

4.1. Regional Hydrology

Prior to the 1990s, the mean annual discharge that was measured in the Huri station [14] included 653 × 106 m3 per year (mcm/y) of which 80% was contributed by the major headwaters and 20% by springs welling on the eastern and western slopes of the Hula valley. It is therefore concluded that the total water flow capacities as measured in the south end of the Hula Valley (Huri station on the Jordan flow route) were not changed after the Hula drainage, the totals being 655 and 653 mcm/y before and after the drainage, respectively (Figure 1). The mean annual of “other” resources (the Golan Heights and Eastern Upper and Lower Galilee) contributed 212 × 106 m3 /year [14].
A report on the Hula Valley surface water balance that was published before the drainage [15] is given (106 m3/year):
  • Total Gain—655
  • Inflows—630
  • Rainfall—25
  • Total Loss—655
  • Outflows—595
  • Lake
  • Evaporation—25
  • Swamps
  • Evapotranspiration—35
Nevertheless, as of the mid-1980s the impact of Climate Change Conditions (CCC) was mild, whilst later the impact was enhanced. Therefore, discussion about the modification of the biodiversity in the Hula Valley should indicate the impact of both the Hula drainage and CCC. Moreover, the CCC level is developed bilaterally, with dryness and wetting. Exemplification for recent (2018–2023) CCC is given as river discharges (m/s) at the winter end (1 April) and the annual mean during 2018–2023 (Table 2) [16].
The Dan River discharge portion (%) in the total capacity of the headwaters ranges between (max.-–min.) 51.5–34.6%. Moreover, the relative contribution of the Dan River is higher when the River Jordan (Huri) discharge is lower (lower rainfall).
Prior to the Hula Drainage (1957), the valley was permanently partly covered by swampy wetlands comprised of open surface swamps and covered by dense vegetation, mostly Cyperus papyrus and partly Phragmites australis. Degraded plant biomass was accumulated as bottom sediments creating the peat. About 1300–1400 ha of the valley was occupied by the shallow (mean depth 1.5 m) Lake Hula. Reduced geochemical conditions were dominant over the majority of the wetland. A belt of seasonal water covered the northern wetland boundary. These ecological conditions created the optimal background for the development of a very rich biodiversity. During the 1950s the unique ecosystem of the Hula Valley was devasted and the land was converted to agricultural development before being reclaimed during the early 1990s accompanied by the enhancement of nature protection and the development of ecotourism, including plant introduction and the protection of bird sites. Twenty years later, routine monitoring documented results confirming changes in biotic assemblages. Nevertheless, independently the northern part of the Great Syrian-African Rift Valley including the Hula region was exposed to Climate Change Conditions (CCC). Consequently, a survey of hydrological system changes, including the nutrient migrations from the Hula Valley into Lake Kinneret and biotic biodiversity dynamics was carried out and concluded tentatively with a definition of the anthropogenic and CCC impacts.
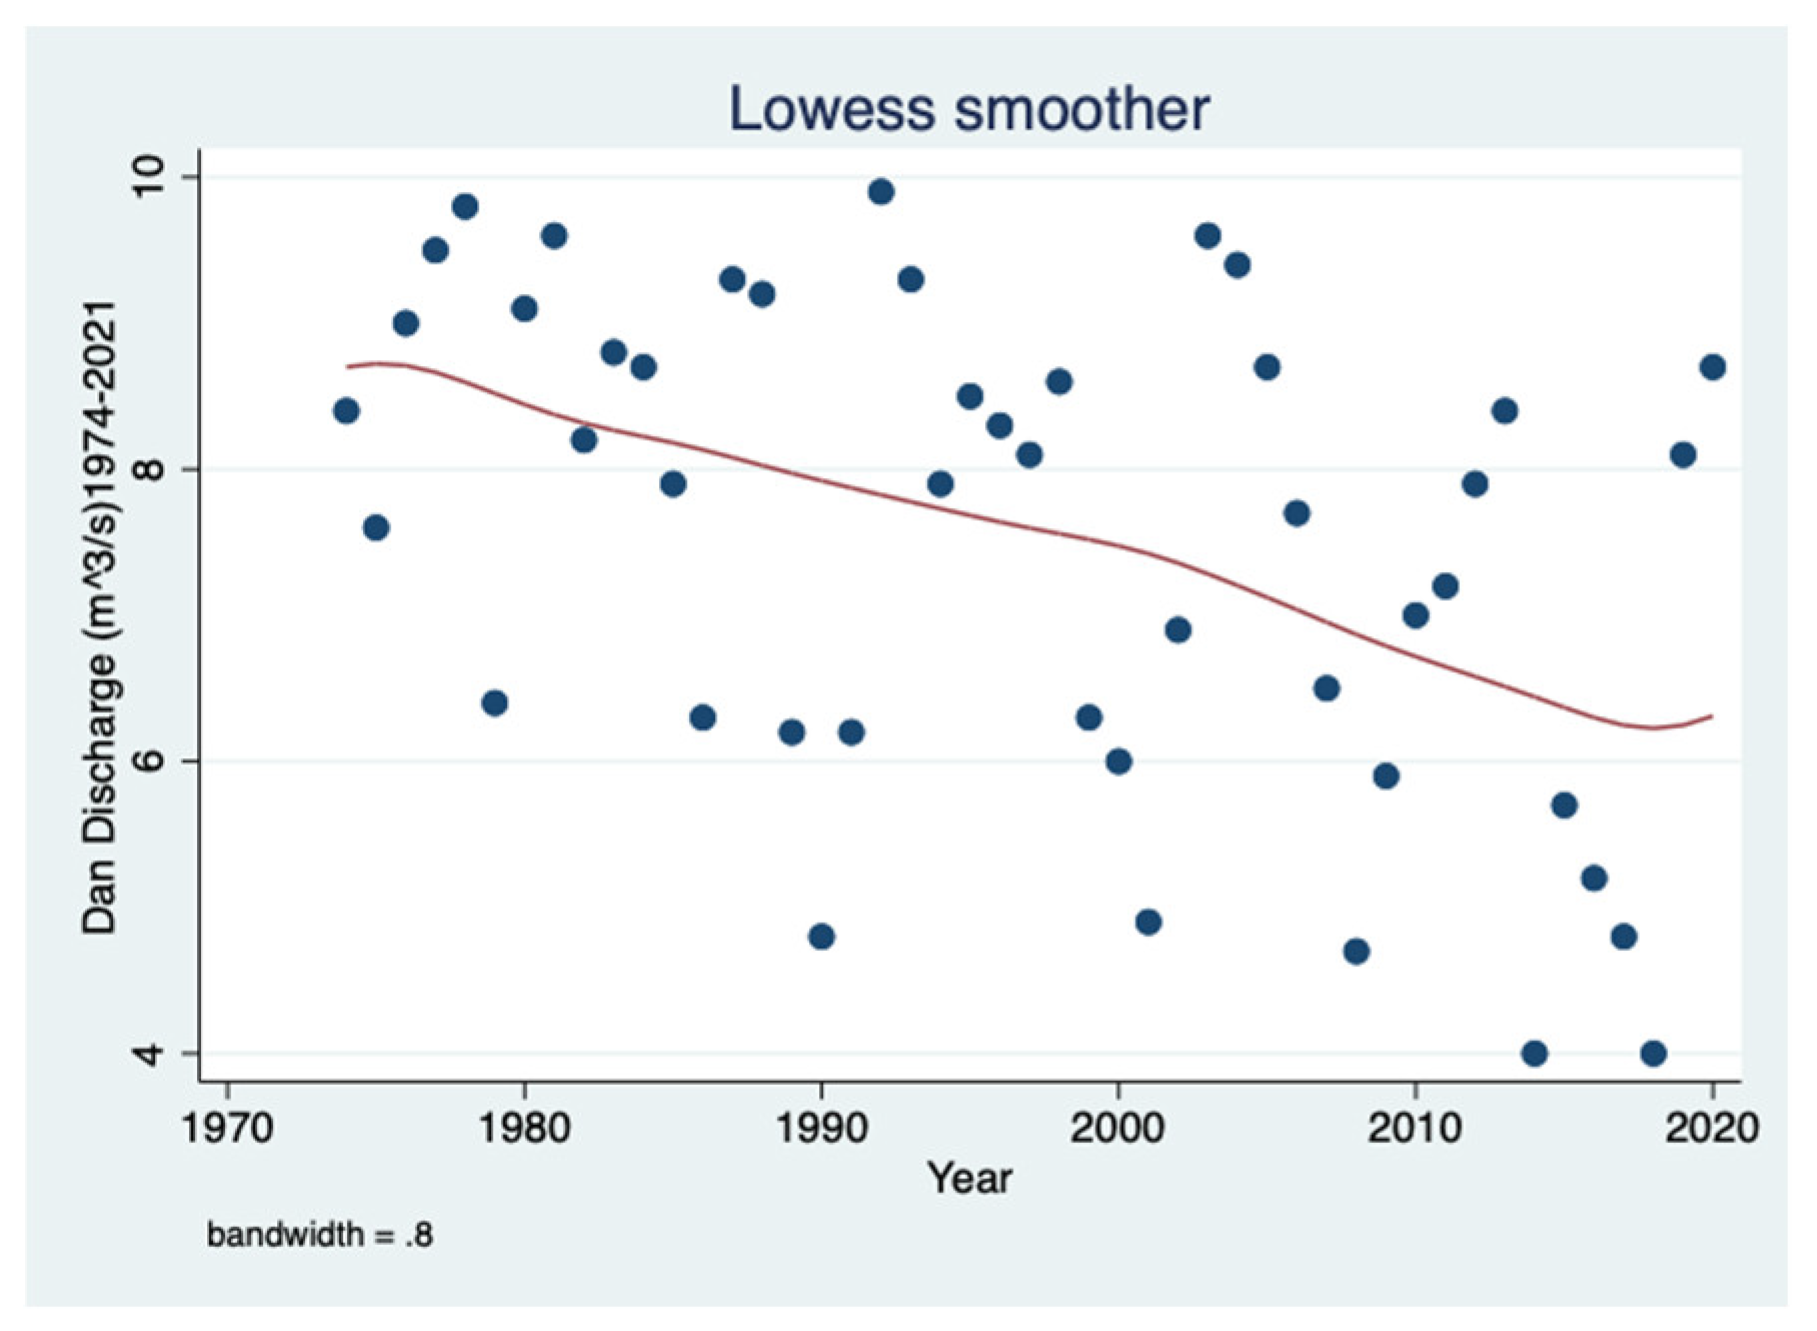
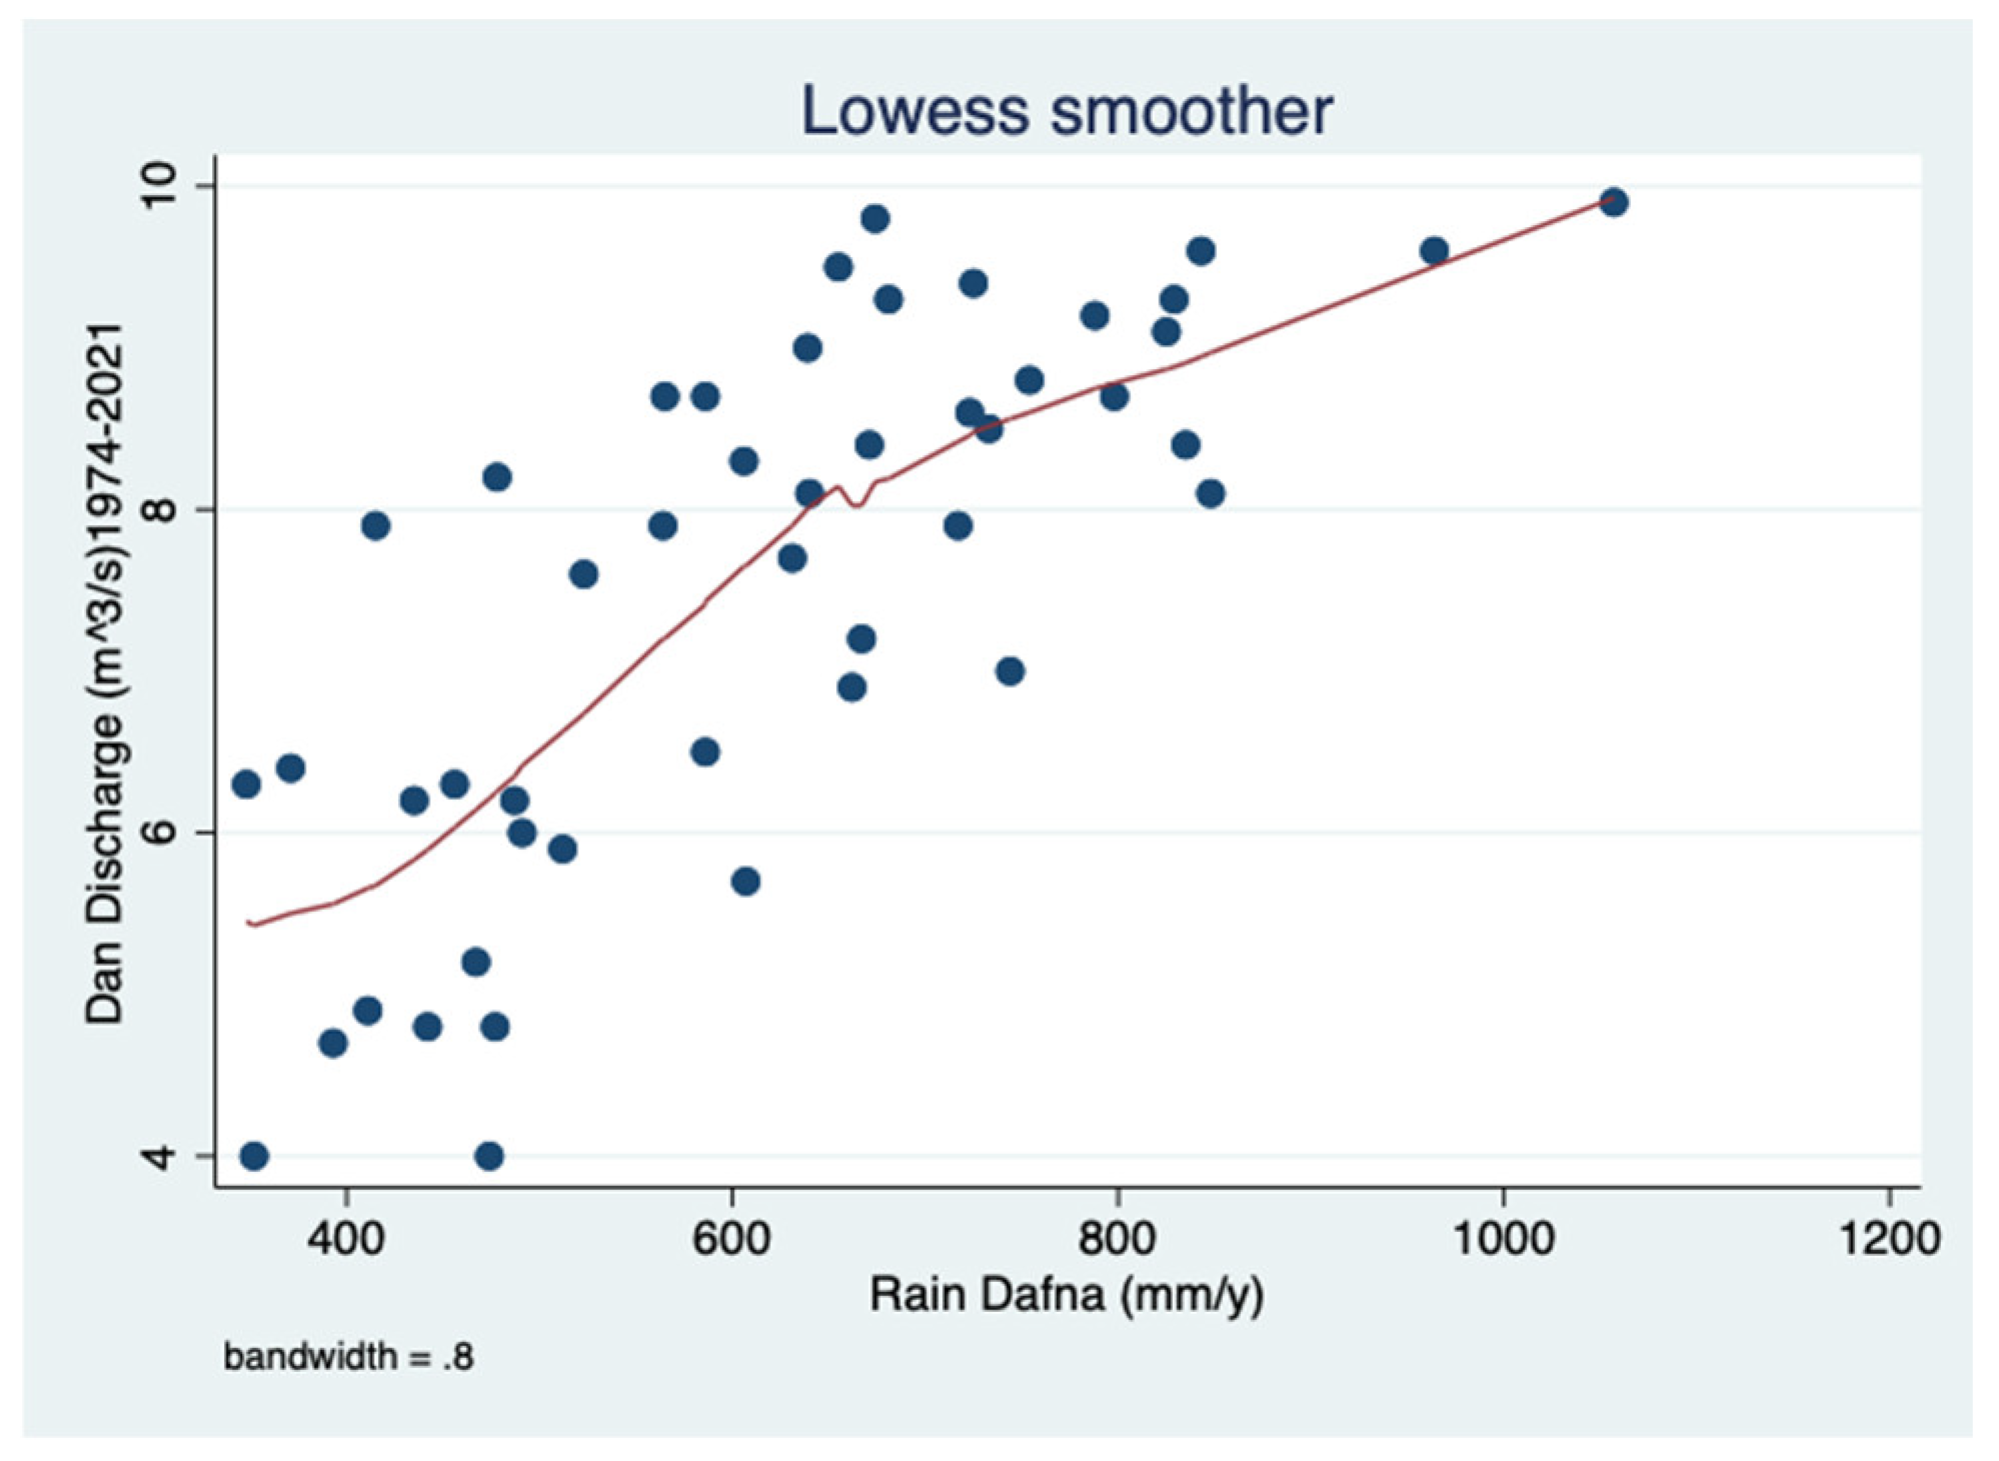
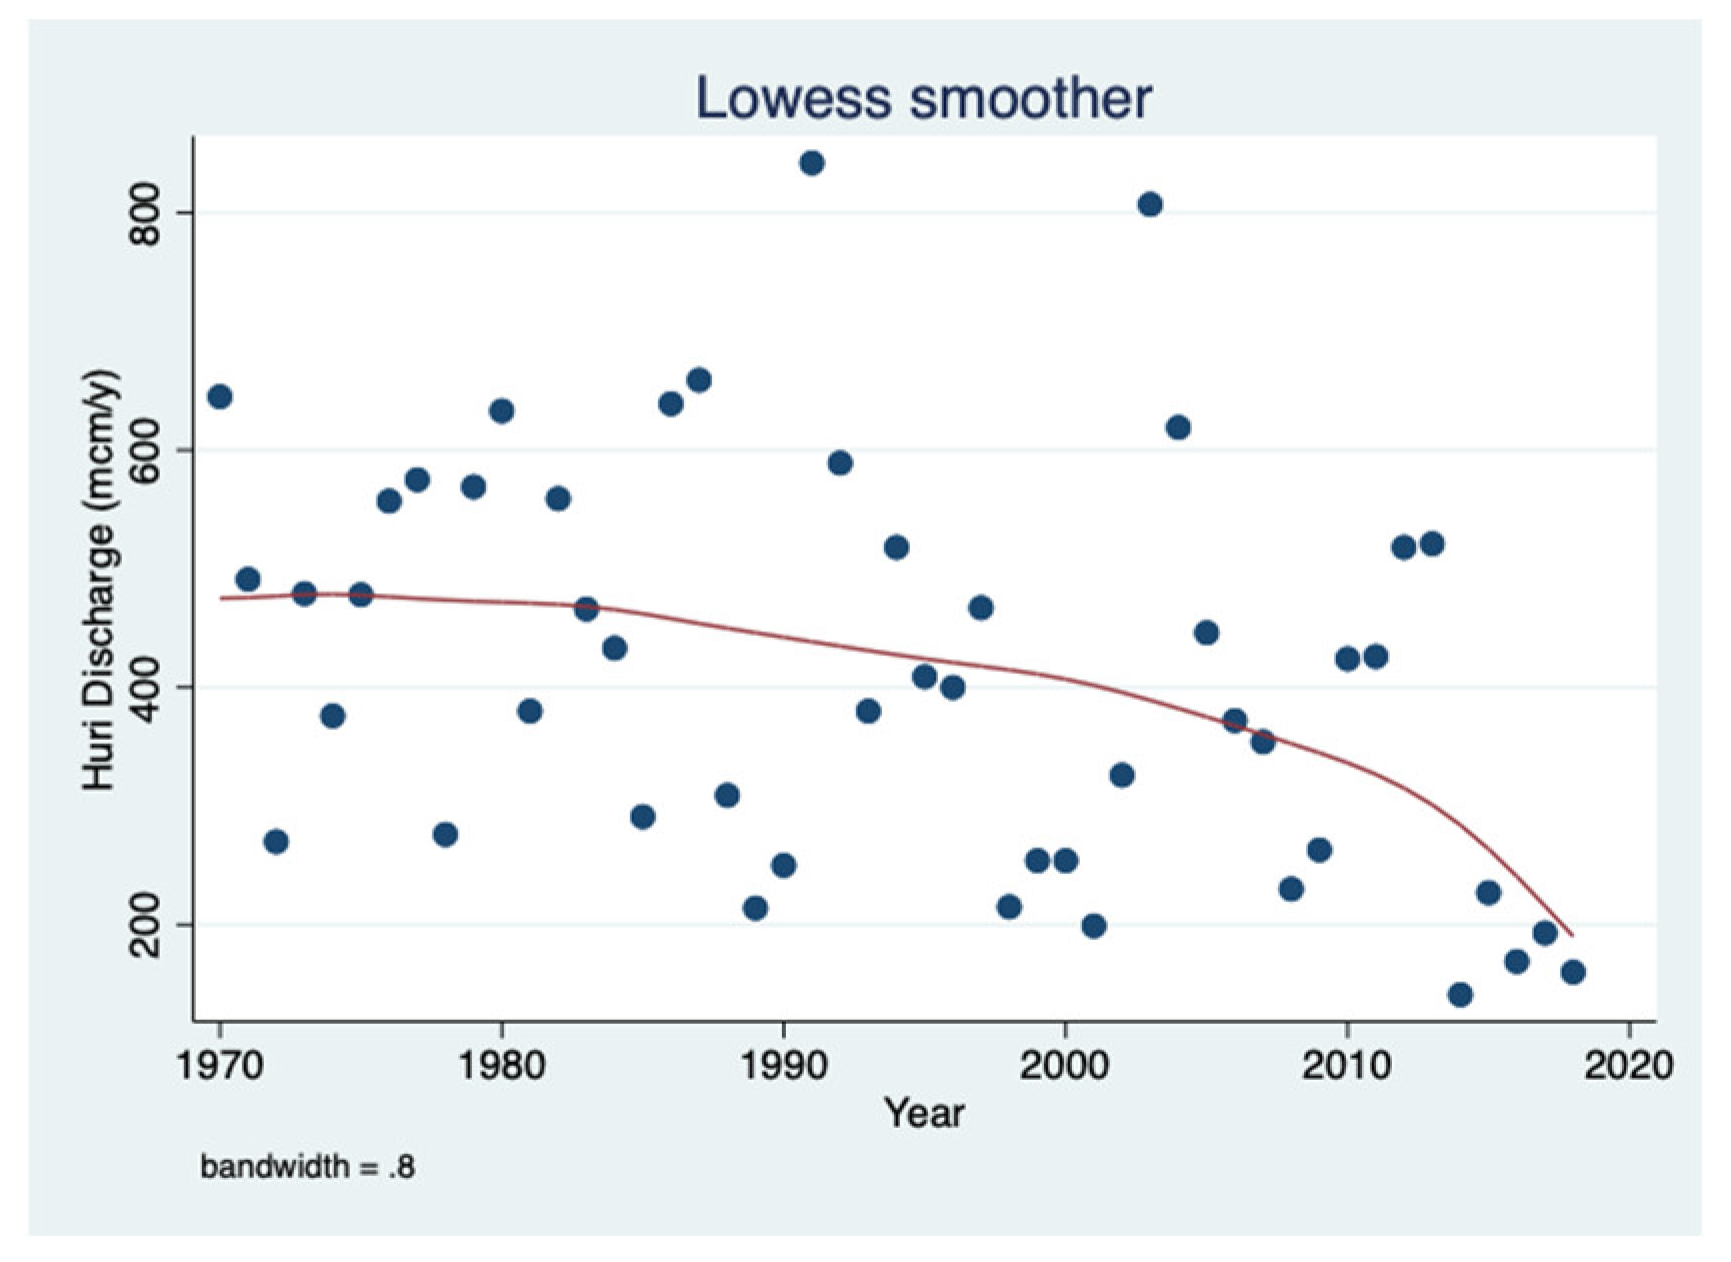
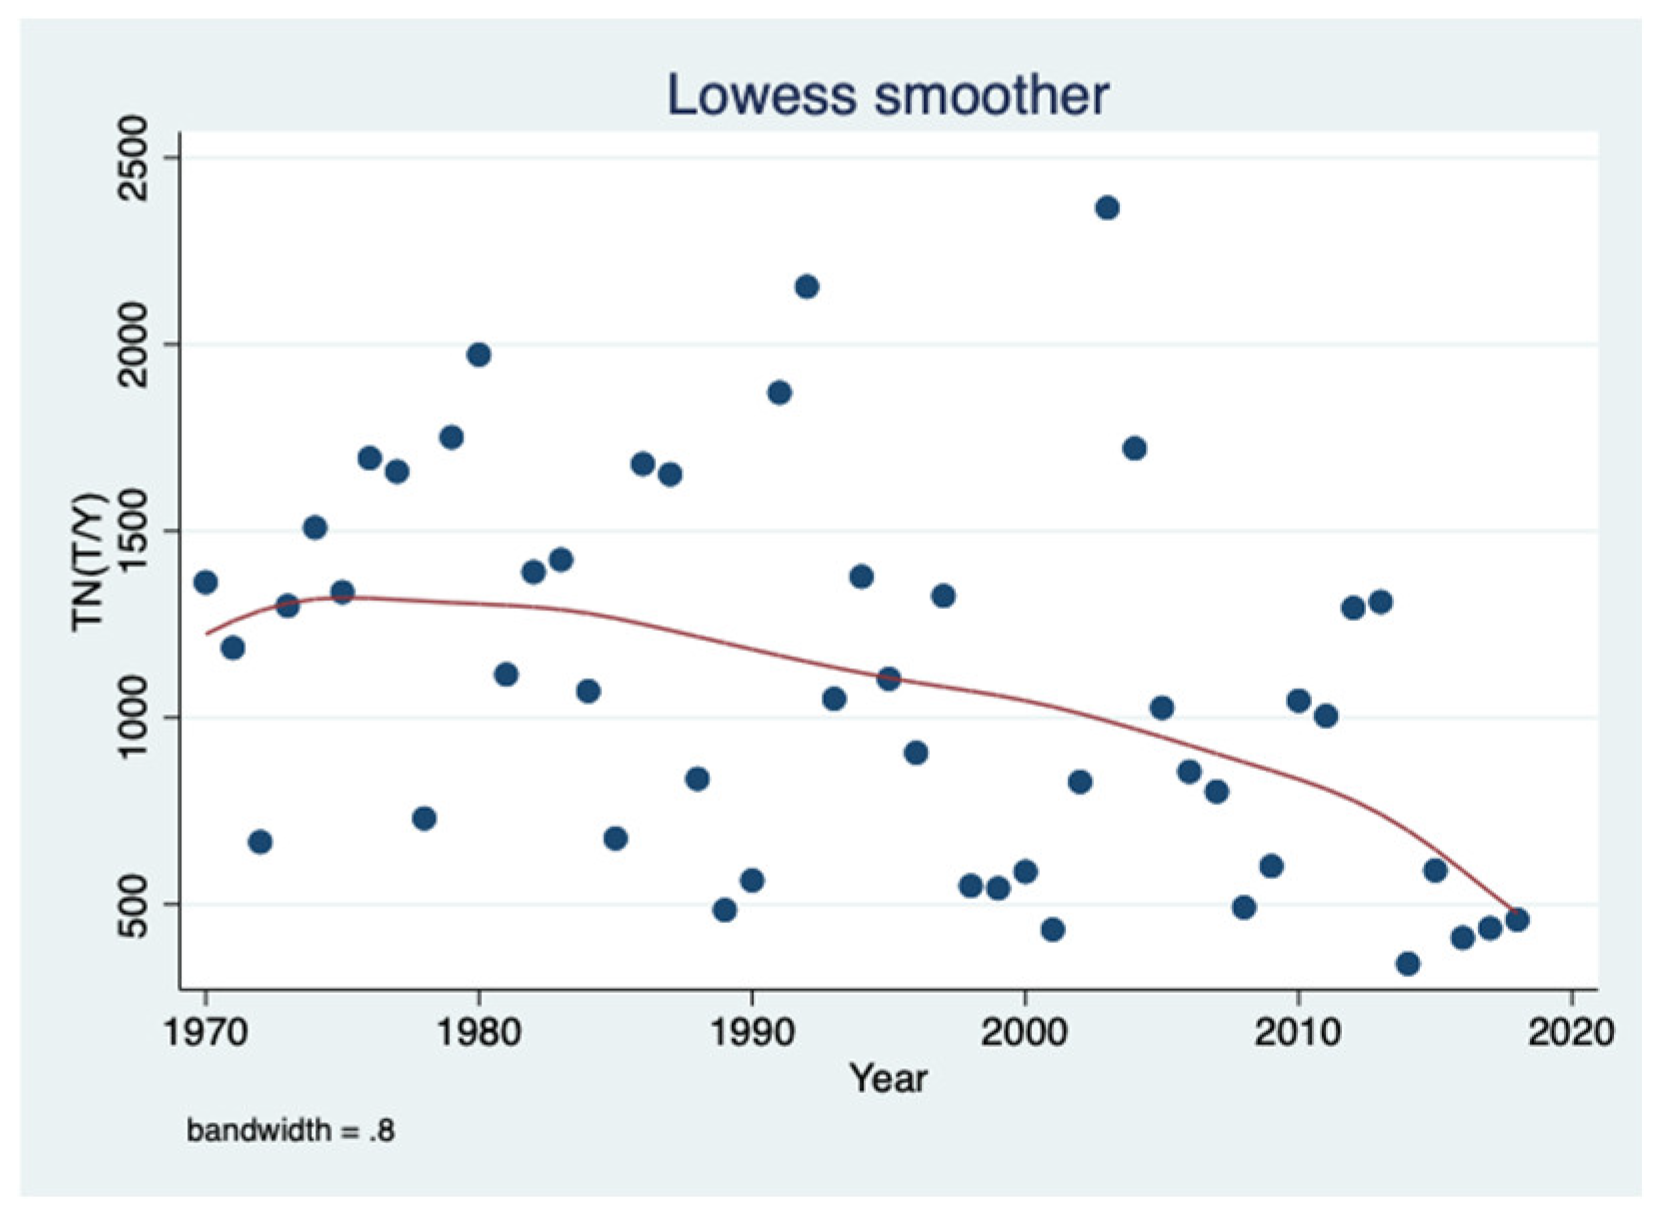
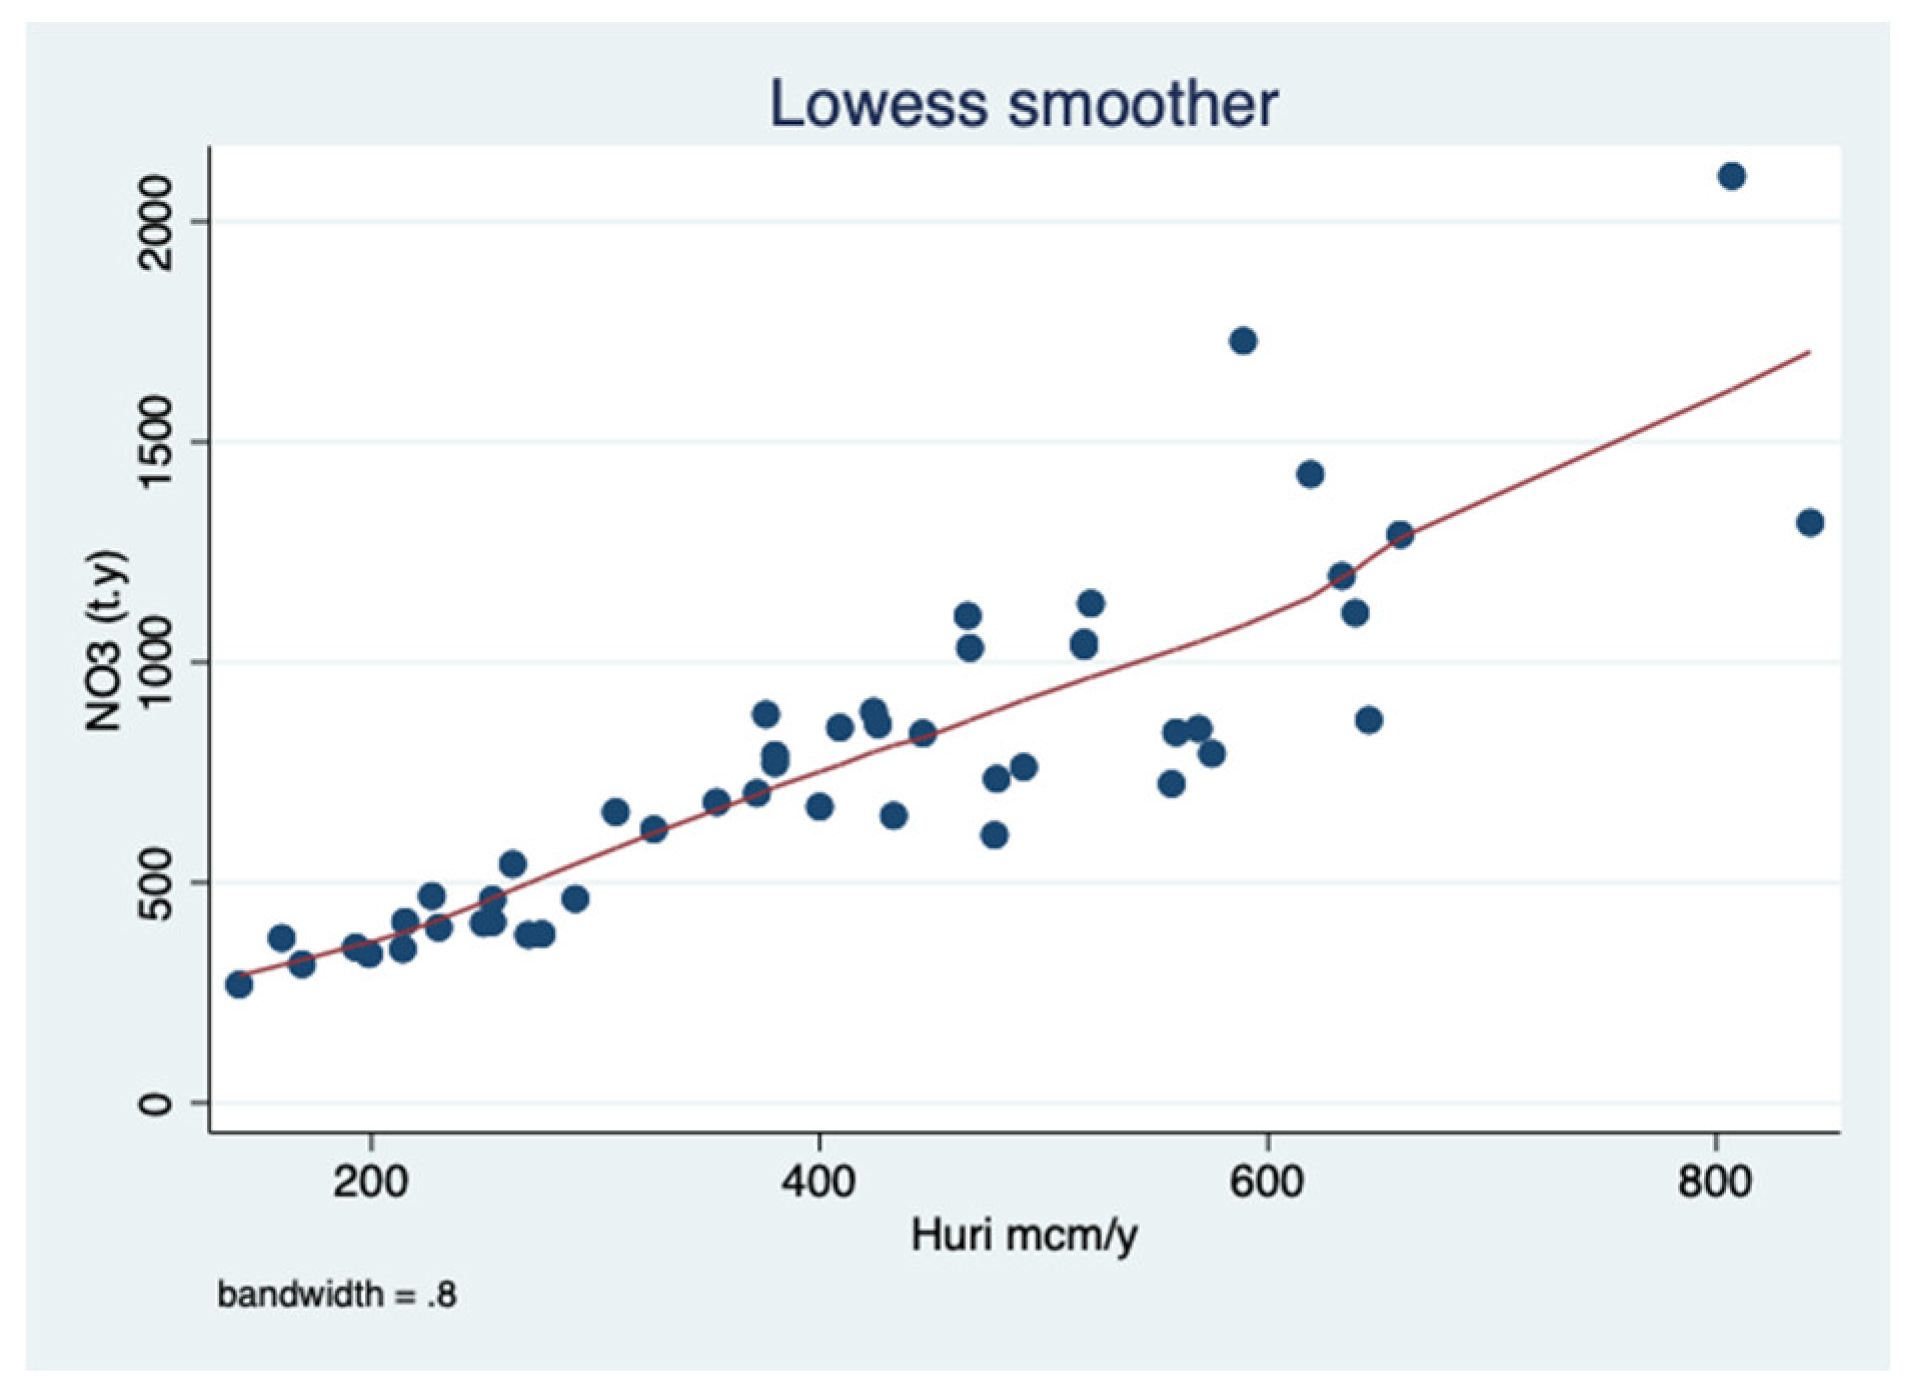
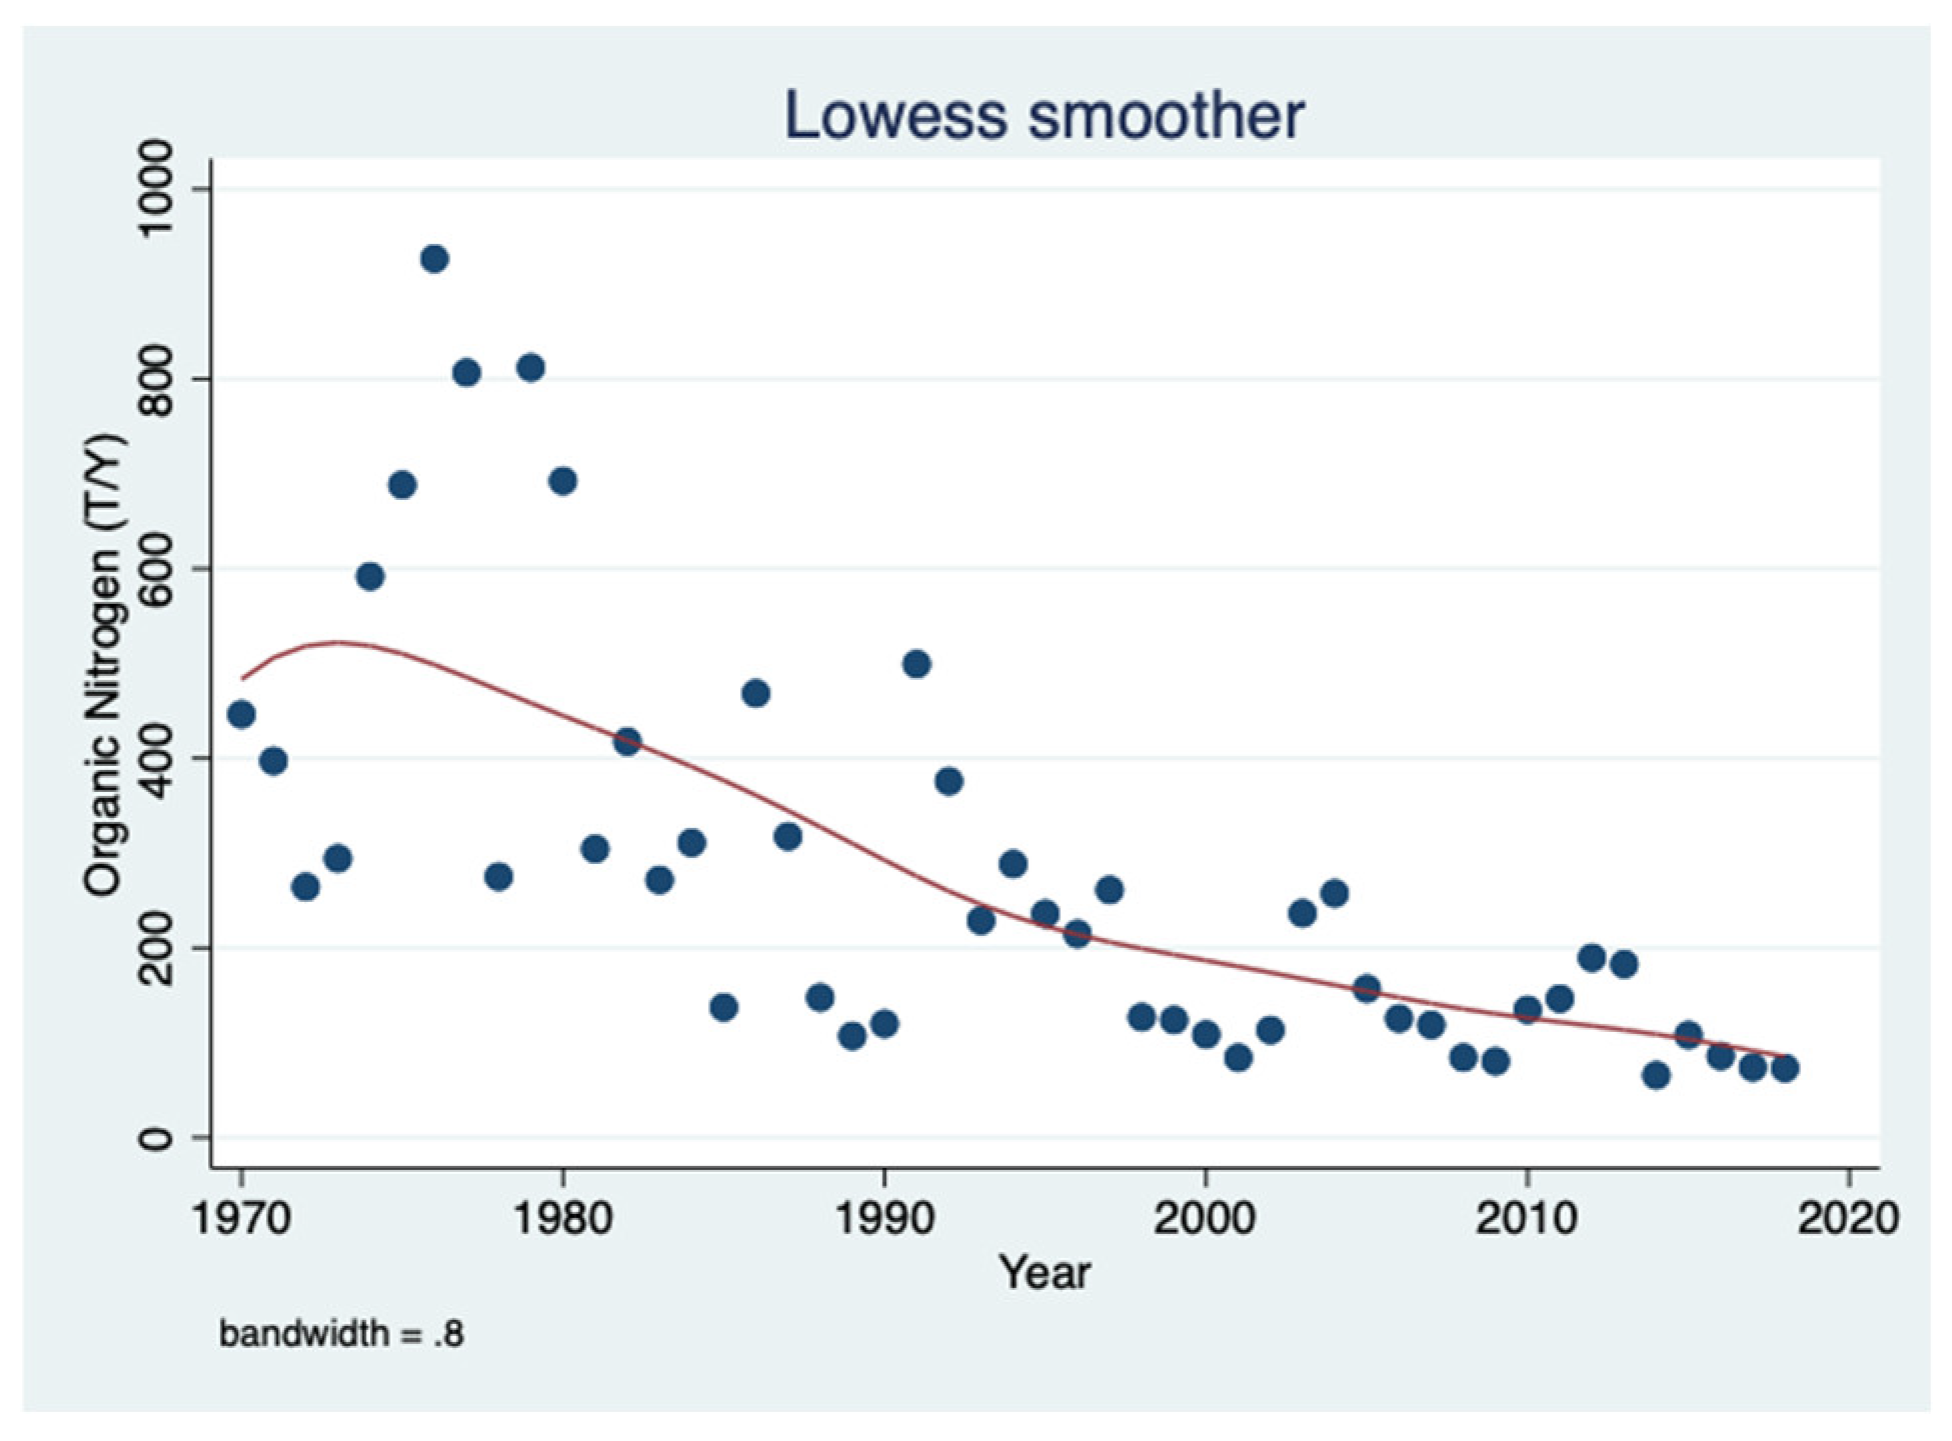
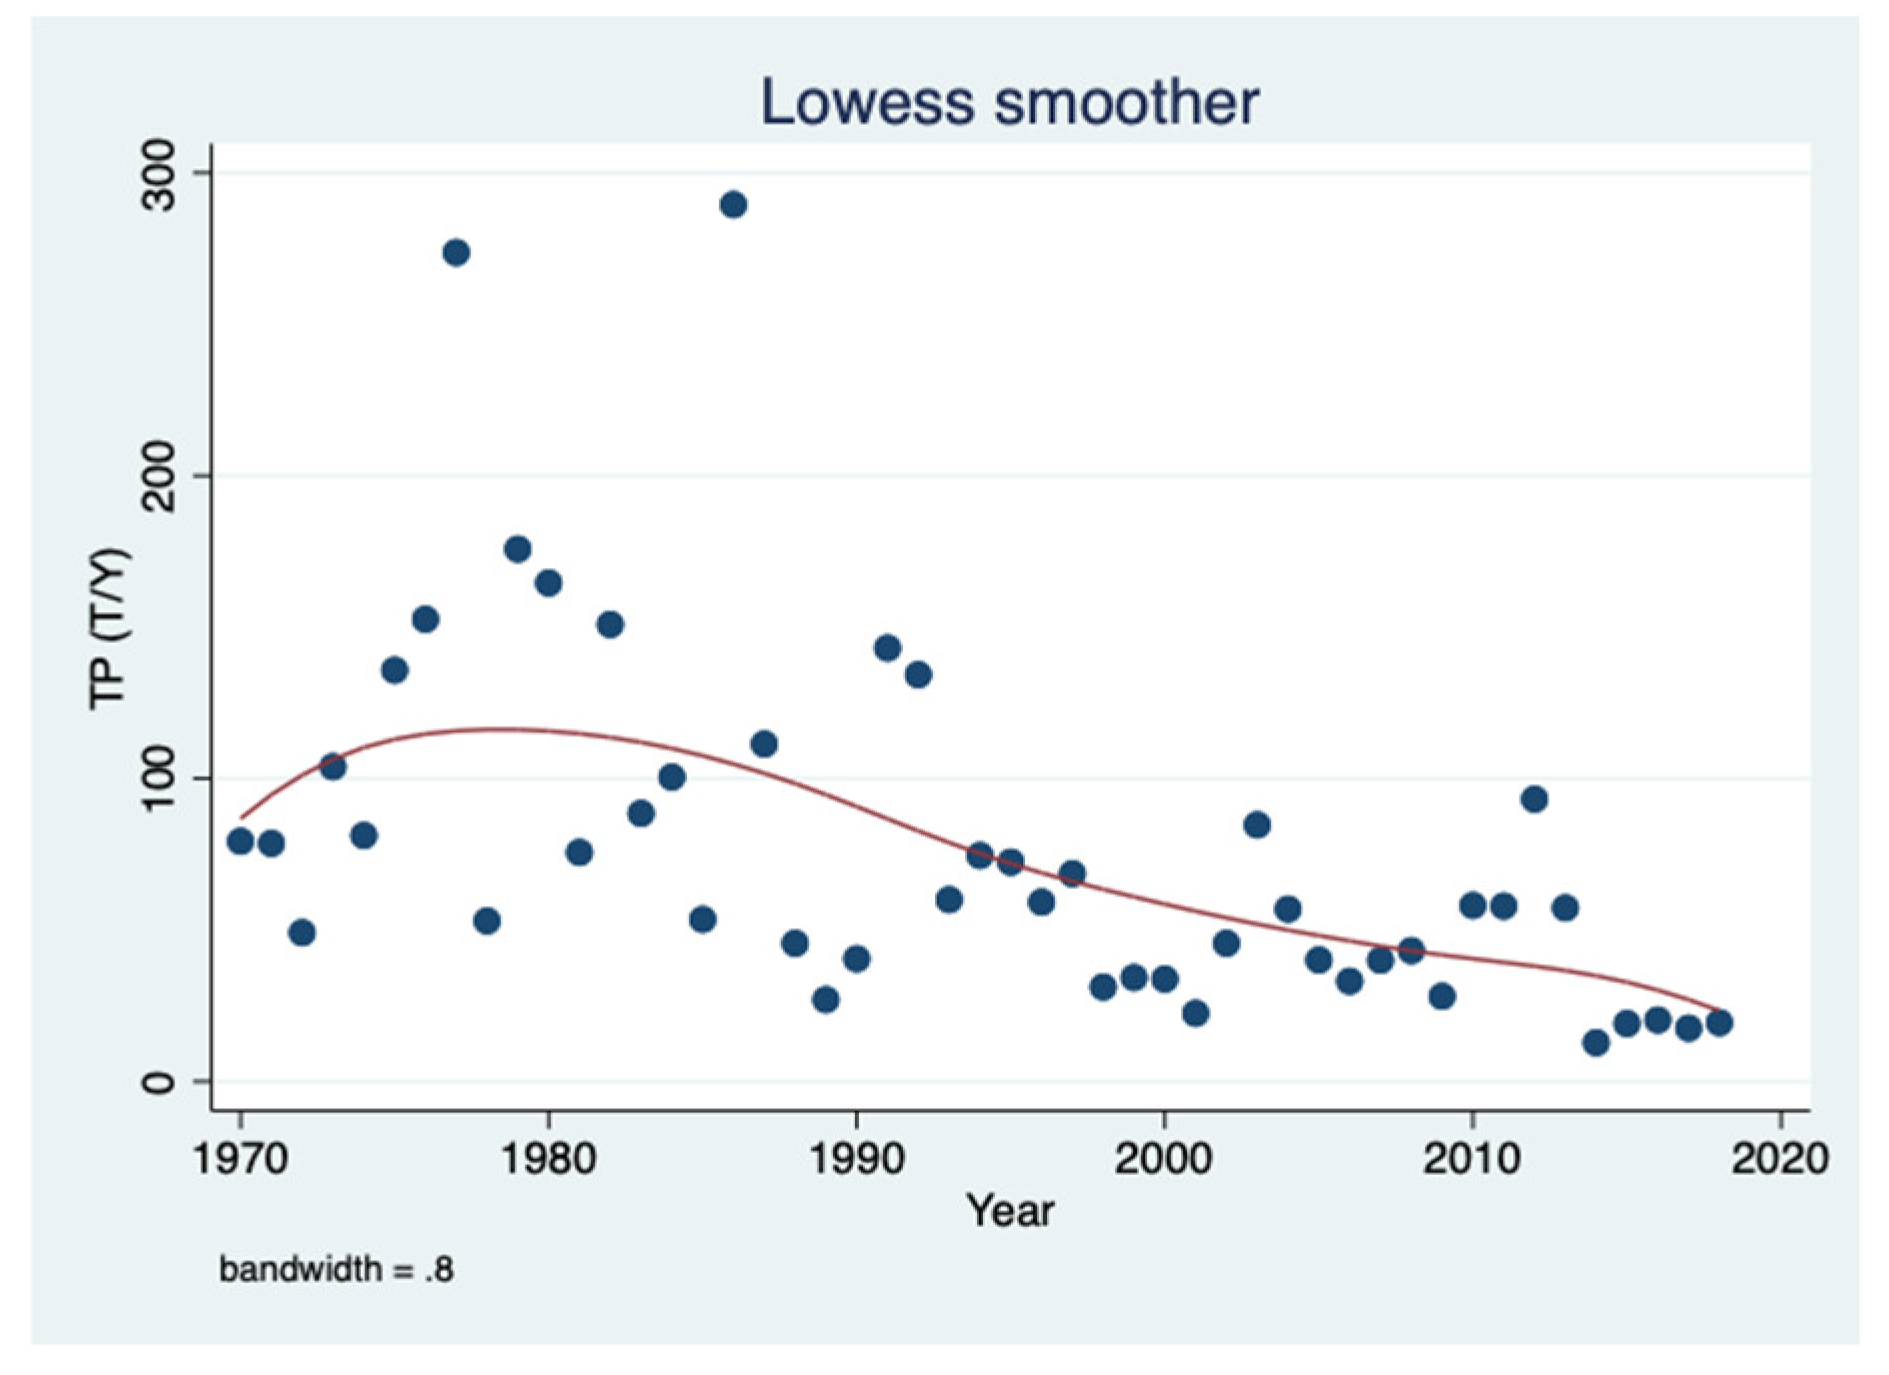
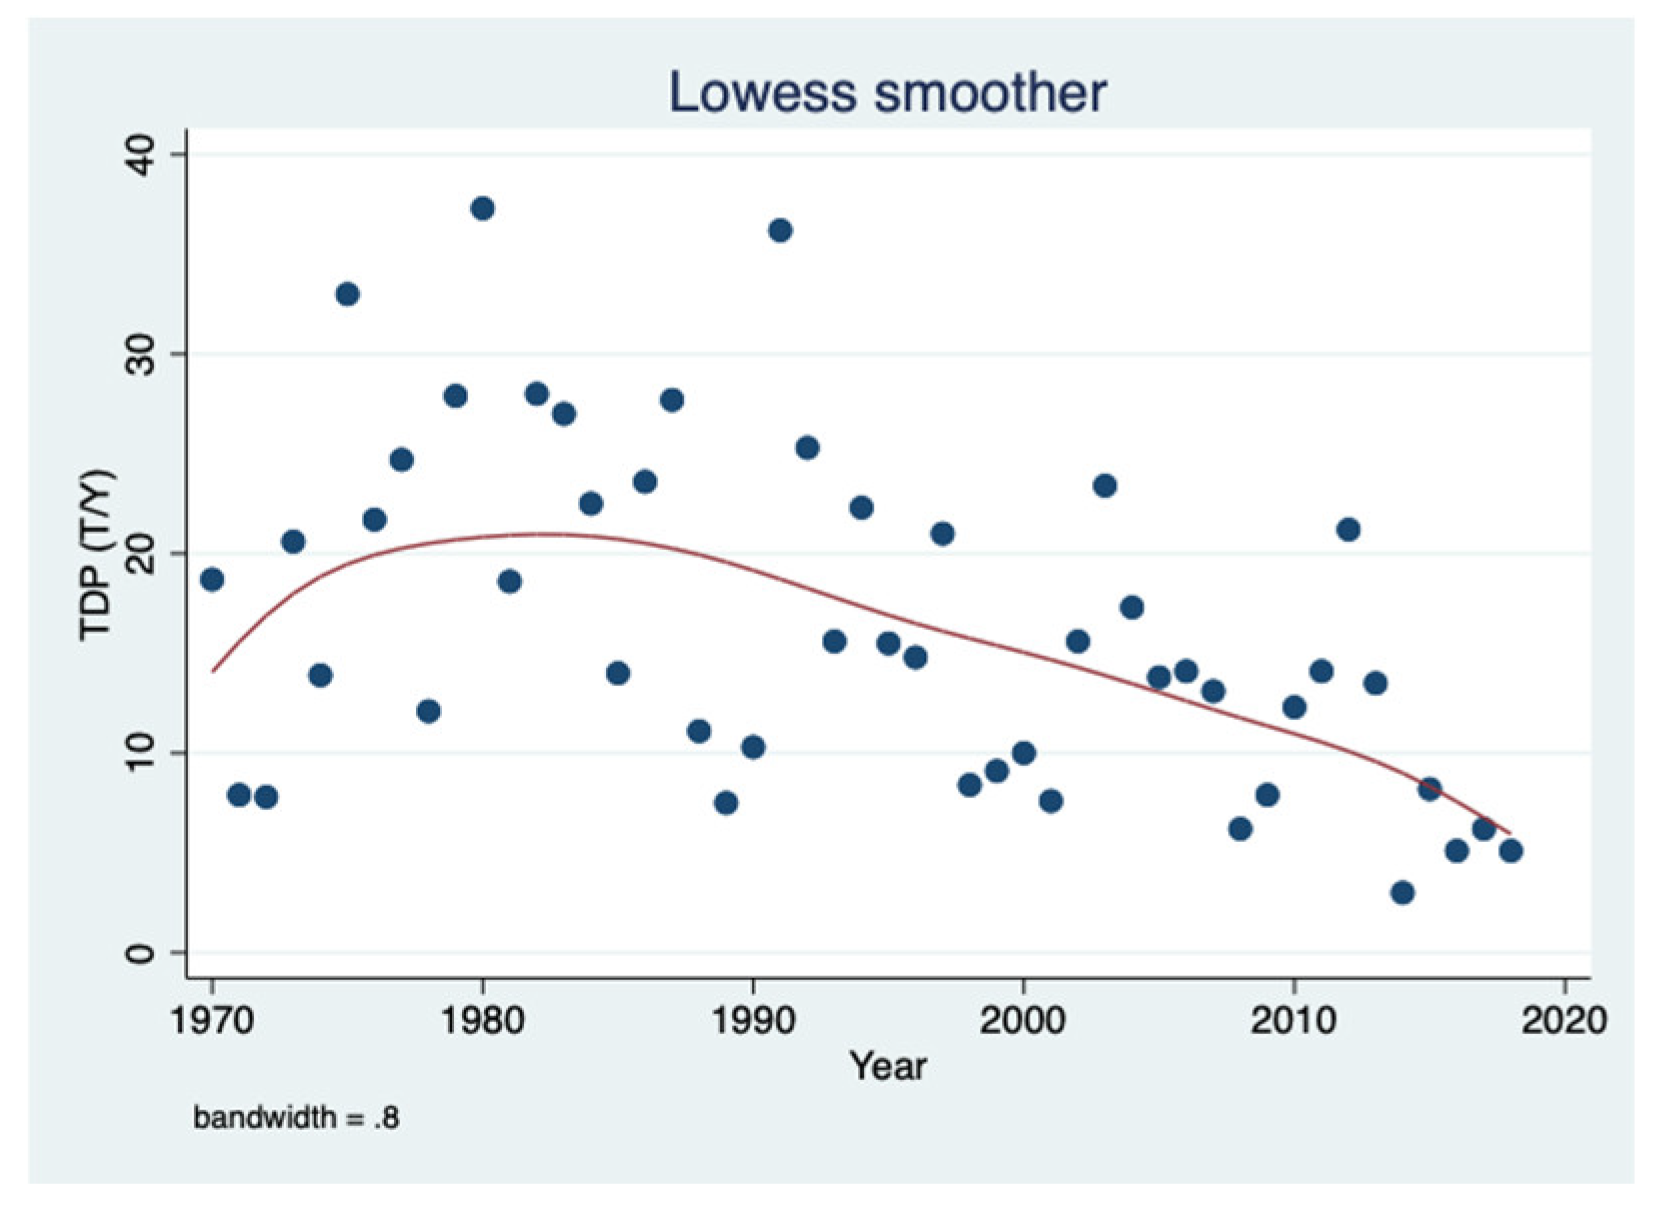
The results given in Figure 1, Figure 2, Figure 3, Figure 4, Figure 5, Figure 6, Figure 7, Figure 8, Figure 9, Figure 10 and Figure 11 represent the hydrological and nutrient migration traits pre- and post- Hula drainage which are mostly dependent on climate conditions: Figure 2 indicates a temporal decline in the discharge of the major headwater, the Dan, and its relation to rainfall (Figure 4). Similarity between Rivers Dan and Jordan (Figure 3), and the relation of River Jordan discharge to rainfall (Figure 1) and its temporal decline (Figure 5). That decline in discharge was followed by a reduction in nutrient migration from the drainage basin into Lake Kinneret (Figure 6, Figure 7, Figure 8, Figure 9, Figure 10 and Figure 11). These changes in hydrological and nutrient dynamics resulted from Climate Change Conditions (CCC) and were not significantly affected by the Hula drainage. Post-drainage, the hydrological system structure of water flow through the Hula Valley was modified from widespread wetlands to 90 km drainage and two major canals. This change in the regional hydrological capacities and flow pattern caused a significant modification of the water cover area, aquatic and semi-aquatic flora and fauna, and migratory species and density distribution. Moreover, anthropogenic management of raw sewage removal into reservoirs and of fishpond construction, and later restrictions during the 1980s, resulted in diminishing inputs of organic nitrogen (Figure 8) and ammonium (Figure 9) and attracted aquatic and semi-aquatic fauna and flora. Implementation of the Hula Reclamation Project (HRP) not only increased peat soil moisture by the improvement in irrigation methods and elevation of the GWT (Ground Water Table) but also enhanced the richness of biological species.
Figure 1, Figure 2, Figure 3 and Figure 4: Temporal (1970–2018) changes in the Dan river discharge and its relation to the rainfall regime, and the Jordan river discharge.
Figure 5, Figure 6 and Figure 7: Temporal (1970–2018) changes in Jordan river discharge and Total Nitrogen (TN and nitrate (NO3) migration through the Jordan discharge.
Figure 8, Figure 9, Figure 10 and Figure 11: Temporal (1970–2018) changes of nutrient (Organic Nitrogen, Ammonium, Total Phosphorus, Total Dissolved Phosphorus).

4.2. Underground Water Table after Drainage

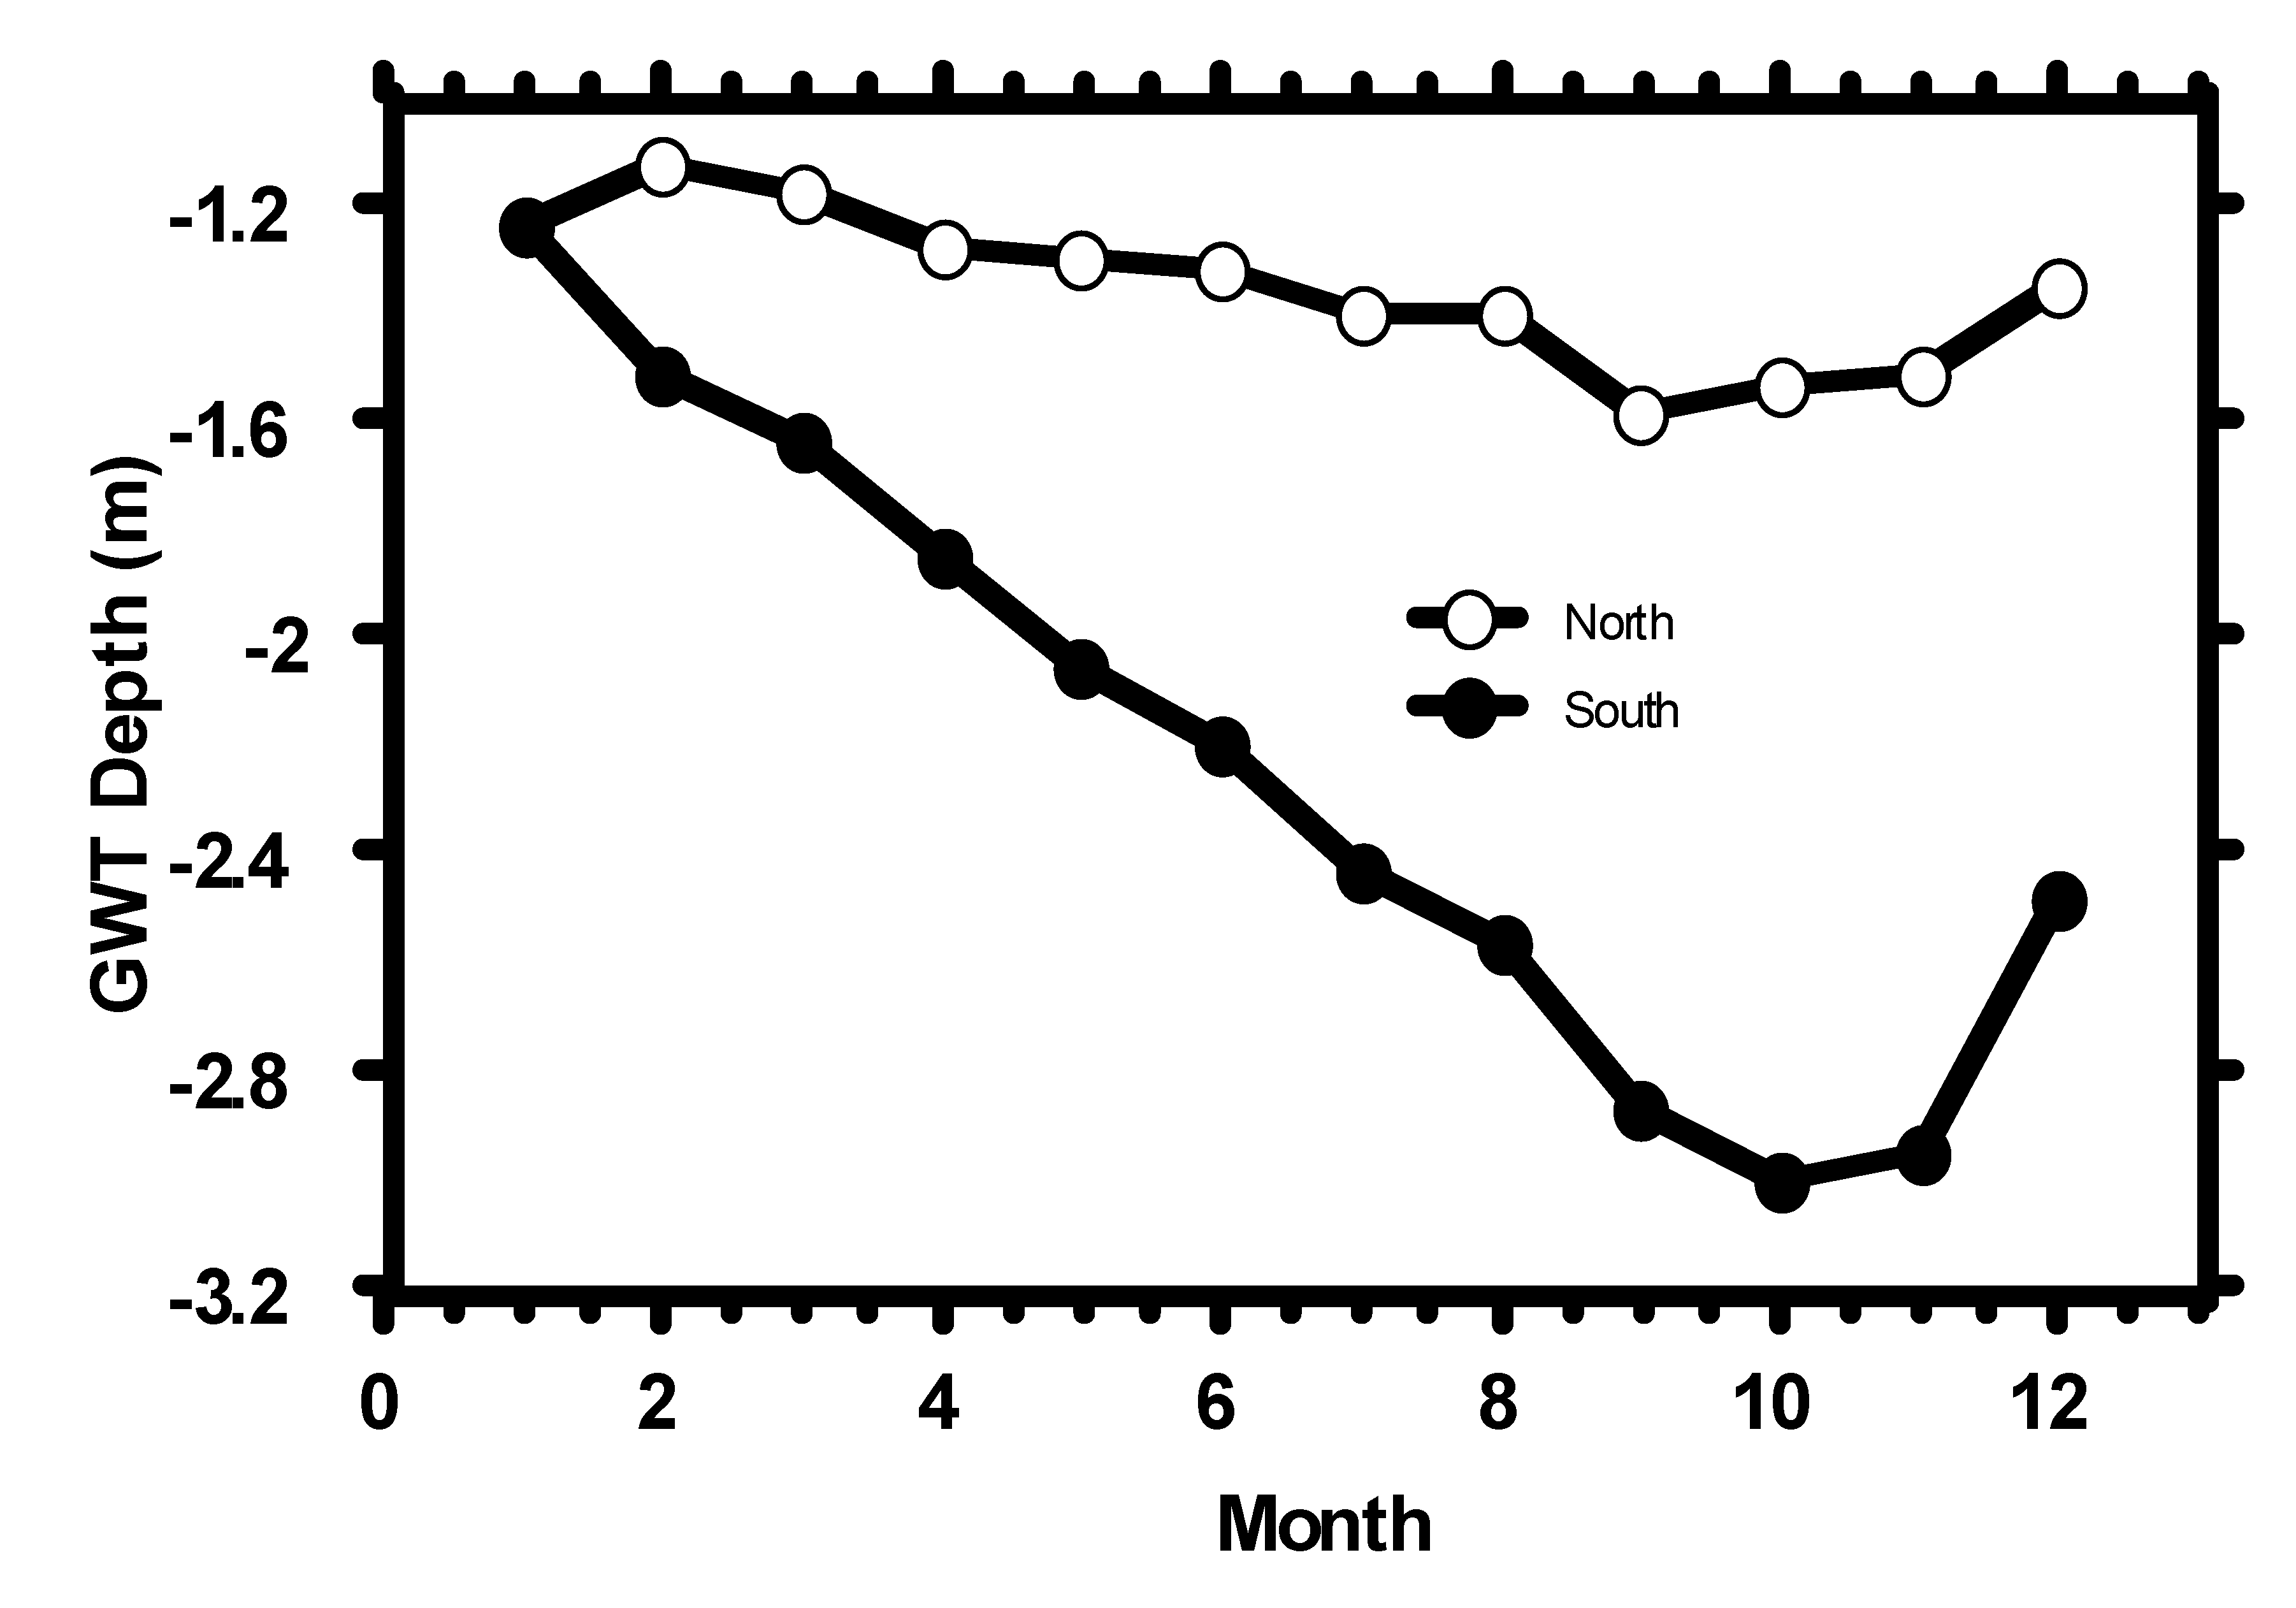
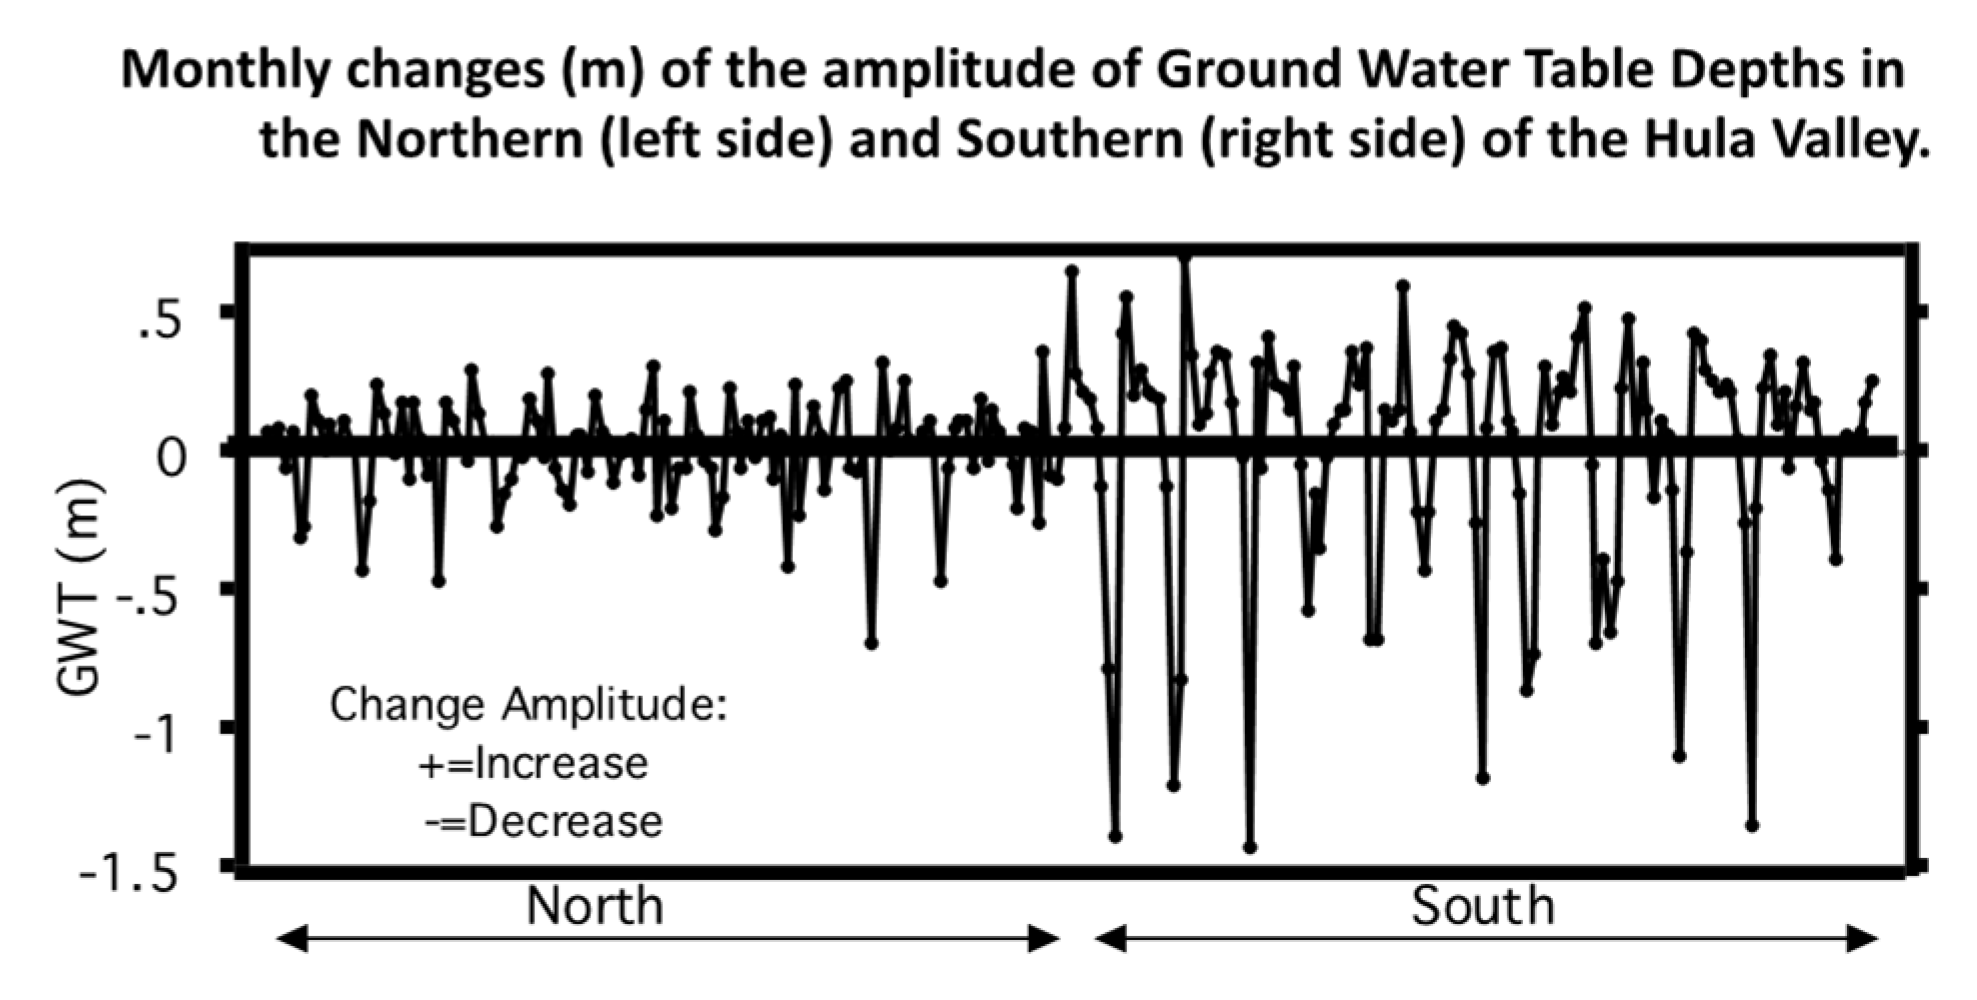
No data are available about Ground Water Table (GWT) seasonal and temporal changes before the drainage. Annual changes in the water level in the old Lake Hula ranged between 1.0–1.5 accompanied by a fluctuating inundation range of the swampy wetlands between 21 km2 in summer and 60 km2 in winter (Dimentman et al., 1992). Significant higher concentrations of nutrients (TDP, PO4, NH4, TDN) in the northern part of the Hula Valley were indicated. It is suggested that the accumulation of nutrients (except nitrates) in the southern part of the underground occurs by horizontal migration of nutrient-rich water from north to south supported by vertical infiltration through the southern mineral soil. The underground water migration through the preferential water pathways probably enhances two types of process: (1) an erosive impact resulting in the significantly higher Particulate—P concentration in the south, and (2) horizontal underground flow from the north which accumulates in the south. The increase in nutrient concentrations is also enhanced by GWT decline in the southern underground (Figure 5) waters and water loss through evapotranspiration in the southern marl soil and vegetation cover of deep-rooted trees (orchards). The amplitude of the seasonal fluctuations of the GWT in the south is greater than in the north (Figure 12 and Figure 13).
The driving force of these differences between the north and the south of the Hula Valley is the gradient of hydraulic pressure and the higher volumetric preferential space for water migration in the southern mineral soil in the valley. The potential impact of the change in the soil and the underground trait after drainage on the species richness of the flora and fauna in the Hula Valley is obvious.

4.3. Ecotourism Development

The Hula Reclamation Project (HRP) included 500 ha of the Hula Valley designated as eco-tourism infrastructure through the creation of the shallow Lake Agmon-Hula (82 ha surface area, 0.2 m mean depth) and its close vicinity as “Safari” land. The aim was the construction of an attractive location for permanent aquatic and semi-aquatic fowls as well as for migratory stop-over birds. Moreover, the creation of complex habitats was proposed as an infrastructure for mammals and introduced vegetation. In other words, the aim was to enhance the post-drainage integration of biotic biodiversity with agricultural development and hydrological tools for the protection of Lake Kinneret’s water quality. Surprisingly, the consequences were a great success accompanied by partially unexpected results which required an ad hoc solution. Large (about 300 different species) winter–spring and summer–fall populations consisting of 1000s of aquatic, semi-aquatic and terrestrial birds have landed in this eco-site, mostly in winter–spring–early summer, and more than 500 × 103 visitors and bird-watchers per annum have come for sightseeing in this renovated habitat. Some of the birds stayed 4–5 winter months and some just 2–3 weeks twice a year, on their southern winter migration or northern spring migration. The most attractive birds in the vast flocks were, among others, storks (Ciconia sp.), pelicans (Pelecanus sp.), and cranes (Grus sp.). There were also smaller groups and gatherings of aquatic birds, among others, mallards/ducks/shovelers (Anas spp.), shelducks (Tadorna sp.), ibis (Plegadis sp.), kingfishers (Alcedo spp.), cormorants (Phalacrocorax spp.), gulls (Larus spp.), common coots (Fulica sp.) common moorhens (Gallinula sp.) and semi-aquatic or terrestrial species of egrets (Egretta sp, Bulbulcus sp.), herons (Ardea spp.), eagles (Aquila spp.), pratincoles (Glareola sp.), bee-eaters (Merops spp.), and barn owls (Tyto sp.).
Conceptual management of Lake Kinneret and the Hula Valley prior to the Hula Drainage (1957) and the construction of the National Water Carrier (NWC) (1964) was not implemented as a multi-purpose approach. The state engagement through national analysis of water (L. Kinneret) and land (Hula Valley) utilization initiated during the early 1950s resulted in the Hula drainage and the construction of the NWC and their ecological relations were indicated. The second step of anthropogenic intervention in the management of the Hula Valley was carried out by the HRC during 1994–2005, whilst recently we have been facing an increase in the frequency and magnitude of extreme weather events (dryness and wetting) due to CCC. Although significant ecological modifications have occurred in the Hula Valley, the biodiversity of vertebrate fauna does not represent fundamental fluctuations. The Hula Valley monograph [12] has indicated an inventory of 30 families and 132 bird species within a record composed of 524 reports and scientific publications during 1853–1991. Based on the annual reports of the Hula Project Monitor Program (1994–2018) a briefly summarized record of the avifauna is as follows: during 1994–1996, 180 bird species were recorded of which 28% were permanent, 24% were summer nesters, 43% were nesting in summer, and 4% were migrators. However, 10 species that were recorded as nesting before the Hula Drainage were not documented as nesters after the drainage. During 2005, 204 species were recorded; in 2014–2015 160 species were recorded with similar numbers in 2013–2014 whilst during 2017–2018 117 species were recorded. Conclusively, the enhancement of bird biodiversity after the Hula drainage is not impossible.
Nevertheless, one of the crucial newly-established compartments created a contradiction: crane project management. The massive stop-over visit of cranes in the Hula valley was initiated in the early period following the drainage.
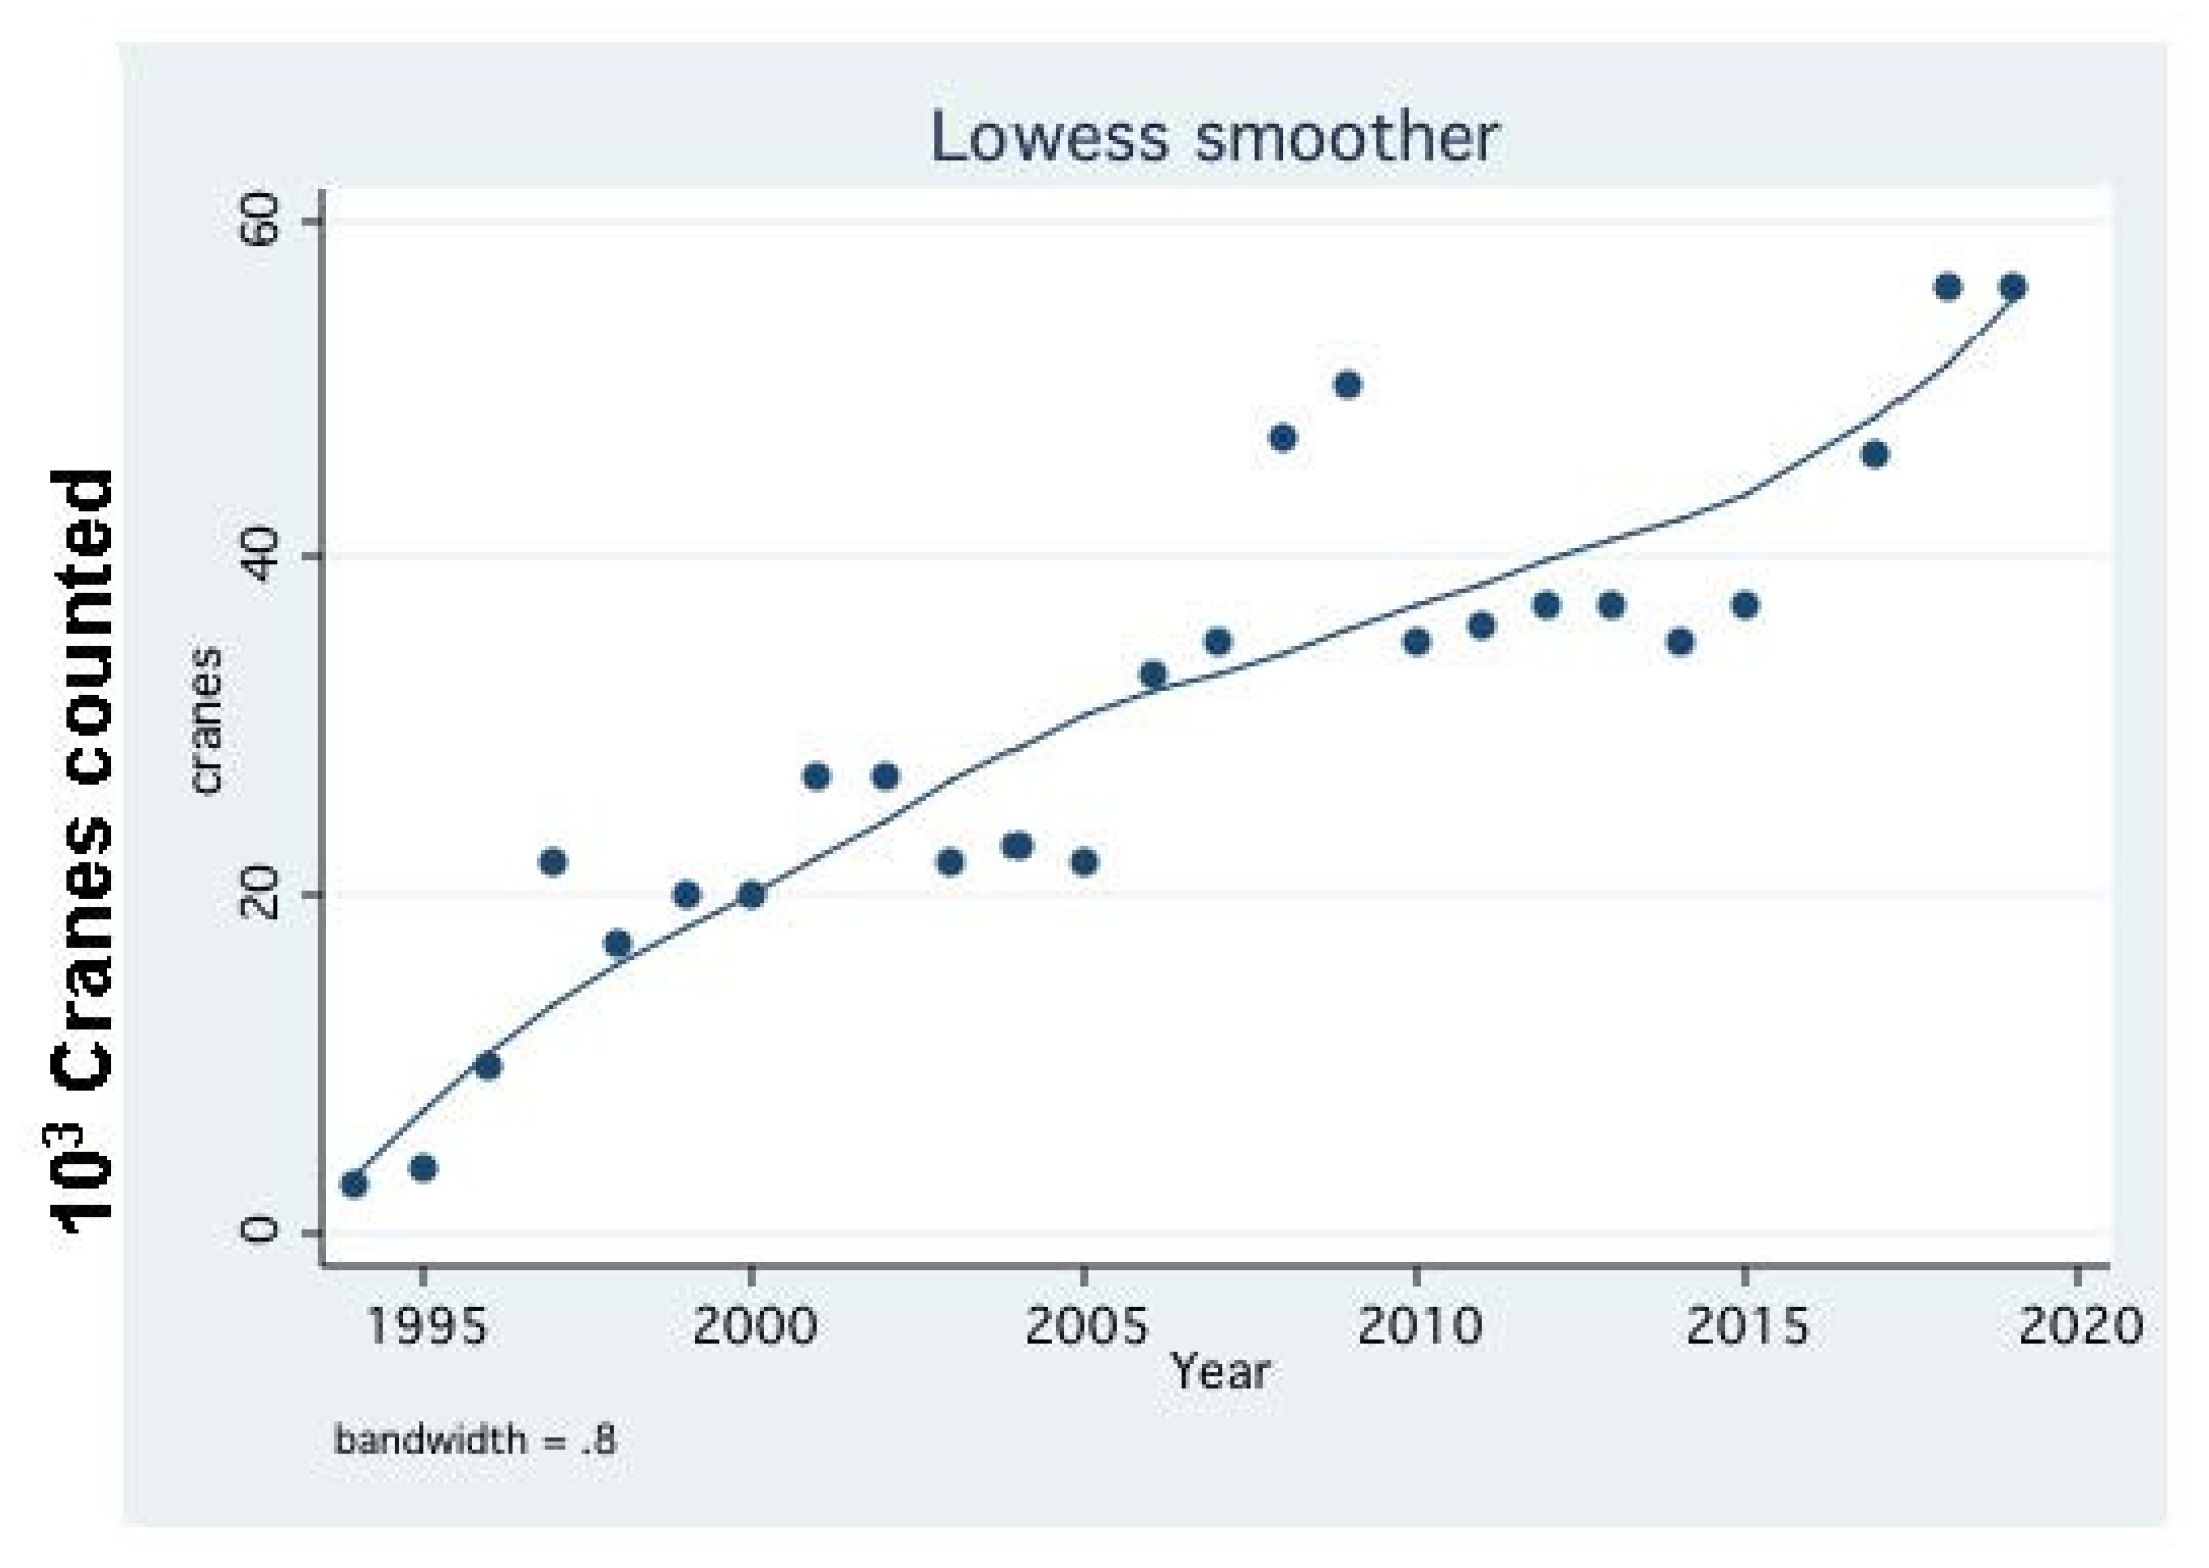
The land surface of Israel is not very big (22,600 km2). Nevertheless, an exceptional richness in avifaunal species exists as the result of its geographical-climatological location. Israel is a geographical junction between three continents: Europe, Asia, and Africa. About 540 bird species have been documented in Israel, of which 450 are migratory including 170 ephemeral transients. About 500 million birds cross Israel twice a year, flying south during the fall, and north during the spring. These include white storks, raptors and cranes [17]. Along the north-south migration route, Israel serves as a terrestrial bottle-neck bridge between Euro-Asia and Africa limited between aquatic (marine) and desert barriers on both sides. The utilization of the Hula Valley by winter migrators such as cranes, pelicans, cormorants, storks, and others, is favored as a supportive stopover location with an efficient protected food supply. Bird migration is maintained through two perpendicular route directions, north-south and east-west. Nevertheless, the winter stopover of over 50,000 cranes (Figure 14) requires two ecological components: (1) effective night-roosting shelter sites due to the presence of diurnal and nocturnal predator mammalians in the Hula Valley: the Egyptian mongoose (Herpestes ichneumon), red fox/silver fox (Vulpes vulpes), gray wolf/timber wolf (Canis lupus), golden jackal/common jackal (Canis aureus), jungle cat (Felis chaus), and striped hyena (Hyaena hyaena); and (2) available food resources. The distribution of predator mammalians in the Hula Valley was significantly enhanced after the Hula drainage because these animals are terrestrial and 80% of the land surface was water covered. Moreover, a terrestrial component of the biodiversity such as cranes landing on the ground was not scarce before the drainage as well as before the reclamation project. Lake Agmon-Hula supports suitable sites for night refuges for the birds and sites for tourists and bird watchers to enjoy the spectacle, and the agricultural crops, especially peanuts, made an efficient food source for the birds. Consequently, the Hula drainage and the reclamation project provided food and night refuge resulting in the enhancement of the biodiversity. Although the cranes provided an amazingly attractive sight, the challenge of minimizing conflicts with agricultural crop damage creates a complicated and expensive challenge. The winter attraction of cranes in the Hula Valley is an achievement where costly compensation was found between conflicts of interest. It is possible that the drainage of the Hula valley which expanded the terrestrial land surface within the modified ecosystem, accompanied by the newly created shallow Lake Agmon-Hula, upgraded the biotic biodiversity and probably also the population density. Among aquatic mammalians, Lutra lutra were observed but not routinely documented before the drainage. Nevertheless, feces of Lutra lutra have routinely been monitored after the drainage.
It is suggested that the density and duration of stopover of the migratory birds in the Hula Valley prior to the drainage were smaller and shorter, respectively. Though the Hula Valley drainage was aimed at protecting the water quality in Lake Kinneret, the role of nutrient contribution by birds is critical. Due to the precise documentation of crane population density, arrival and leaving time, night roosting and nutrient defecation rate, their potential contribution of phosphorus through effluents can be approximated. Multiannual (1994–2018) monthly means of the TP concentration (ppb) in the effluent of Lake Agmon-Hula are given in Table 3.
An unexpected result of the renovation in the agricultural crop composition was the new stopover of thousands of cranes which had never been known before.The migratory crane stopover and nocturnal roosting in Lake Agmon-Hula initiated a study of the phosphorus content in the lake.
During winter-spring months (1–6) (cranes are present during months 11,12,1,2,3) the mean concentration is 223.1 ppb whilst the average for summer-fall months is 307.2 ppb (38% higher) due to the degradation of submerged vegetation (Table 3).

4.4. Species Richness

The results of Species Richness Distribution (SRD) for plants, [17,18,19,20,21,22,23,24,25,26,27,28], birds [29,30,31,32,33,34], and fish [35,36] are given as the number of species per 102 ha [17,18,19,20,21,22,23,24,25,26,27,28] and Biodiversity Index (BDI) given as the ratio between group (plant, bird, fish) and total species number Before (BEF) and After (AFT) drainage are given in Table 4:
Prior to the Hula drainage 132 bird species belonging to 30 families were documented in the Hula Valley whilst, as of the early 1990s, only 3 species were not recorded after the drainage [12]. During the post-drainage era, the avifaunal richness indicated during 1994, 1995 and 1996 consisted of a total number of recorded species of 135, 120, and 153, respectively. During 1996–2005, 2014–2015, and 2017–2018 the number of recorded bird species was 209, 117, and 161, respectively [32,33,34].

4.5. Vascular Plant Species Richness

A compilation of the pre-drainage studies about vascular plant distribution in the Hula Valley [17,18,19,20,21,22,23,24,25,26,27,28] initiated a list of 53 named species as documented by Zohary and Orshansky (1947). They [17] defined different types of Hula Valley vegetation as 9 plant associations. The only complete Hula Valley monograph compiled by [12] includes named lists of invertebrate and vertebrate fauna.
Post-drainage documentation of vascular plant species composition in the Hula Valley during 1994–1996 was published by [26]) and later in annual reports of the Hula Reclamation Project monitoring program [27,28]. The following results were indicated:
  • 1994–1996: 74 species [26].
  • 1996–2005: 115 species [27].
  • 2008–2018: 147 species [28] including 35 invaders of which 11 cause a deterioration in local vegetation.

4.6. Unwanted Plant Species (Included in Grand Total Name List)

Post-drainage, with renovated agricultural crops and crane feeding management with imported corn seeds, the Hula Valley was a destination for invasive plants and animals. Natural invasion by rodents and the introduction of nutria were followed by anthropogenic enhancement of invasion by 35 exotic plant species of which 24 and 11 are regional and country intruders, respectively [13]. It is not clear yet how many of these plants are weeds but some of them obviously are.

4.7. Fish Species Richness

The number of fish species recorded in the Hula Valley before drainage varied between 16–19 (6 families) [12,35] of which 2 species were not recorded after drainage. During the post-drainage era, 8 fish species were recorded of which 2 were exotics [36], and later during 1997–2008 14 species were documented (5 families) [35].

4.8. Amphibian Species Richness

In all, 4 species were recorded before drainage whilst one of them, Discoglossus nigriventer, was claimed as extinct shortly after documentation although surprisingly a new study indicated its reappearance [37,38].

4.9. Mammalian Rodent Species Richness

A post-drainage invader species became very abundant after drainage, creating an agricultural nuisance. Microtus socialis and another species, Arvicola terrestris, were indicated by the identification of their bones in the regurgitations of barn owls. These species had never been observed alive or dead [39].

4.10. Reptilian Species Richness

Two native species of turtle and one native water snake were documented before and after drainage.

4.11. Mammalian Species Richness

A documented species list of mammalians observed in the Hula Valley represents a rather high richness level. Nevertheless, periodical routine and documented quantitative observational monitoring is not available for comparative evaluation of the pre- and post-drainage era.
The History of Mammalian Species Richness list in the Hula Valley includes the following:
Herpestes ichneumon, Vulpes vulpes, Canis lupus, Canis aureus, Felis chaus, Hyaena hyaena, Lutra lutra, Meles meles, Melivora capensis, Martes foina, Vormela peregusna, Lepus capensis, Myocastor coypus, Sus scrofa, Hystrix and Microtus socialis, of which only one, Myocastor coypus, is exotic [40].
During the pre-drainage period, most of the valley was covered by water which prevented foraging and predation by most of the mammalians in the Hula valley. During the post-drainage era, reported observational quantitative monitoring was carried out mostly for Myocastor coypus, Lepus capensis, Lutra lutra (feces), Sus scrofa, and Canis aureus [13]. The mammalian distribution and species richness of the population in the Hula Valley was modified in response to aquatic land-cover changes created by the drainage. During the pre-drainage period, mammals were commonly found outside the valley whilst after drainage they populated the terrestrial land within the valley more densely, with the aim of foraging and chasing prey.

5. Discussion

The majority of the water supply to Lake Kinneret comes from three principal headwaters, (the Banias, Hazbany, and Dan) of which the Dan’s capacity comprises 50%. Long-term precise monthly discharge data are available for the River Dan only. Prior to the drainage of the Hula Valley (1957), most of the water supply to Lake Kinneret flowed through the Hula Valley permanently covering 78% (59 km2) of the peat soil cover of the valley of which the old Lake Hula covered 14 km2 (24%) and 32 km2 (54%) was made up of swampy wetlands; 13 km2 (22%) were partly (winter-spring) water covered. After the Hula Valley drainage, water-covered swampy wetlands and partly water-covered areas declined to 6 km2 (10%). Moreover, about 90% of the total capacity of the headwaters was transferred into two major canals, western and eastern. The total area of the Kinneret drainage basin is 273 × 103 ha whilst 199.2 × 10³ (73%) is Israeli territory [1].
The Hula Valley was drained 65 years ago and the HRP was implemented 27 years ago. These anthropogenic interventions into a stable and long-term naturally-existing ecosystem were predicted to cause ecological modifications. Immediately after the completion of the drainage, warnings about the consequent deterioration of the Lake Kinneret water quality were publicized. The Hula valley has undergone anthropogenic changes and Climate Change Conditions (CCC): The anthropogenic intervention was the Hula drainage and Hula Reclamation Project and the CCC events were drought (2014–2018) and a heavy rainfall regime (2019–2022). Among the headwaters, River Dan is dominant and its discharge fluctuations and consequently those of the River Jordan significantly affected nutrient migrations. Therefore, major public attention was aimed at the impact of the Hula drainage on Lake Kinneret’s water quality.
The focus of the publicized warnings pointed mostly to two major consequences of the Hula drainage: (1) the potential enhancement of nitrate migration from the drained Hula towards Lake Kinneret accompanied by the deterioration of water quality; and (2) the loss of natural aquatic habitats and diminishment of the species richness of flora and fauna [12]. Moreover, the newly-created ecological system initiated the establishment of the Israeli Society of Nature Protection. Nevertheless, it was confirmed that, in contrast to the predicted deterioration caused by surplus nitrate, the Kinneret’s trophic status was converted from phosphorus to nitrogen limitation. Moreover, the species richness of plants and birds was enhanced. As a result of the Hula drainage, the majority of the migrated nitrogen into Lake Kinneret is nitrate which replaced ammonium which was the principal component before drainage. On the other hand, the phosphorus resources which are partly external and partly lake bottom sediments were not highly affected by the drainage, except through dust storms. During July 1994, an outbreak of N2-fixer cyanobacterium (Harmful Cyanobacteria: HFCB) [2] was for the first time recorded in Lake Kinneret. The source of HFCB inoculum was suspected to be in Lake Agmon-Hula but this theory was rejected because hydrological networks were not yet established. The vast stock of sulfate in the peat soil, its migration, and mass balances in Lake Agmon-Hula confirmed heavy load inputs into Lake Kinneret, while previous studies confirmed its advantageous suppression of N2-fixer cyanobacterium bloom formation. The friendly ecological relationship between Hula Valley and Lake Kinneret was confirmed by the low (<10%) capacity of nutrient migration from the Hula Valley into Lake Kinneret. The beneficial management of agriculture and protection of Lake Kinneret’s water quality was predicted and continuously improved. Soil conditions immediately after the drainage deteriorated and were then improved by the HRP accompanied by protection of the water quality in Lake Kinneret [1]. The natural old Hula Valley ecosystem can never be rehabilitated and agricultural land use exists and will continue. Although the natural source was demolished by the drainage, national and regional eco-service accompanied by partial nature reclamation came at its expense. The structure of the hydrological system within the Hula Valley was changed and improved when a new shallow lake, Agmon-Hula was created, and thereby it has been confirmed that the species richness of vascular plants and birds has increased. This can be attributed to the enhancement of a mixture of aquatic, semi-aquatic and terrestrial habitats resulting from the drainage and HRP. The HRP included local plant introduction accompanied by balanced relations between man and the environment-initiated enhancement of species richness. The advantages of ecological modification, drainage and reclamation (RHP) are confirmed by the increase in species richness and economic beneficiaries of the Hula [12,13,17,23,26]. Post-drainage, the ecological character of the Hula Valley has been converted from wetlands to agro-natural habitats, the composition of the nutrient complex has changed, and the hydrological structure has been modified but ecological complexity has been protected. The Hula drainage did not save water as predicted and the newly constructed system and water transfer through the valley have been strictly protected. Similar water capacity was conveyed through the valley before and after the drainage as limited by natural CCC. Nevertheless, it has resulted in habitat changes and enlarged species richness.
The role of permanent or seasonal environmental aquatic and semi-aquatic habitats and water scarcity for migratory birds is globally well known [41,42,43]. Shallow and deep lakes, reservoirs, and permanently or seasonally inundated wetlands and puddles as well as agricultural food source dynamics are globally known eco-parameters which affect bird migration. The Hula drainage case study has become more frequently relevant globally as well [41]. A case study of alternate wetting and drying conditions impacting on wetland conditions which is closely related to the study of pre- and post-drainage in the Hula valley was earlier documented [41].
The Hula drainage and a global trend of wetlands conversion to agricultural management accompanied by a reduction in faunal biodiversity (BDI) looks incompatible. The global trend is BDI decline whilst in the post-drainage Hula it has increased. The suggested reason for that is the creation of varieties of aquatic and semi-aquatic habitats within the management program of eco-tourism development. Examples are the eco-tourism complex of “Agmon-Hula” and the Hula reservation. Therefore, the Hula drainage and the destruction of its wetlands did not result in BDI decline. The “Agmon-Hula” site is located within the Hula Project demarcation and the Hula Reservation at the southern end is attached to the “Agmon-Hula” site. The Hula drainage might be considered as a guiding programmer for the global trend of enhanced requirements for the improvement of food production and to tackle water scarcity. The Hula drainage and eco-tourism case is a lesson that wetland destruction accompanied by habitat creation could be beneficial for food production and natural biodiversity.

6. Epilogue

The Hula drainage and the Hula Reclamation Project implementation created an increase in variable ecological habitats, where terrestrial and semi-aquatic local ecosystems are included. Enhancement of food (prey and foraging) sources attracted birds and mammals into the Hula valley. The implementation of the HRP enhanced the stopover of migratory birds and roosting in Lake Agmon-Hula, and attracted the aquatic foragers nutria. Nevertheless, the use of agricultural crops (peanuts and others) as crane food and the daily feeding of unlimited corn seeds are costly, which requires compensation arrangements. The ecological establishment of such a mega project as the Hula drainage requires a risk assessment for nature. Crane feeding might also attract unwanted birds such as starlings and ravens. Crop damage by cranes was integrated within the administrative frame of the Hula valley management. Fish were introduced which might be attractive for pelicans and cormorants but are potentially damaging for aquaculture and Lake Kinneret fisheries. Moreover, it is not impossible that crane feeding will cause a change of migration route behavior and eco-tourism management might be unaffordable.

Funding

This research received no external funding.

Institutional Review Board Statement

Not applicable.

Informed Consent Statement

Not applicable.

Data Availability Statement

Not applicable.

Acknowledgments

My sincere thanks are given to Ch. Dimentman, and H.C. Bromely who co-authored with the late F.D. Por the unique volume of Lake Hula, a valuable source of information on pre-drainage Hula; Field assistance, scientists and sponsors (Migal-Scientific Research Institute, National Water Authority, and Keren Kayemeth LeIsrael) of the Hula Project Monitoring Program. Anonymous reviewers and the editor for the improvement of the manuscript.

Conflicts of Interest

The author declares no conflict of interest.

References

  1. Gophen, M.; Meron, M.; Levin-Orlov, V.; Tsipris, Y.; Peres, M. Climate Change, Regional Water Balance and Land Use Policy, in the Watershed of Lake Kinneret (Israel). Open J. Ecol. 2020, 10, 200–224. [Google Scholar] [CrossRef]
  2. LKDB-1969-2021; Haifa Data Base, Water Level Record in Annual Report 1969–2021. Kinneret Limnological Laboratory, IOLR Co. Ltd.: Migdal, Israel, 2021. (In Hebrew)
  3. Mekorot, National Water Company. 1986–2018, Interim Report Water, Salt, and Energy Balances for Lake Kinneret, 2019/20; Mekorot: Tel Aviv, Israel, 2020; 41p. (In Hebrew) [Google Scholar]
  4. Hydrological Service. Hydrological Status, Surface Water, and Ground Water Table in Monthly Reports; National Water Authority, Department of Surface Water, Hydrology, Hydrometeorology, Hydrometry, Conservation of Northern Water Resources: Tel-Aviv, Israel, 2022. (In Hebrew) [Google Scholar]
  5. TAHAL. Water Planning in Israel (1960–1988); Monitoring and Salt and Water Balances Evaluation in Lake Kinneret; Annual Reports; TAHAL: Tel-Aviv, Israel, 1988. (In Hebrew) [Google Scholar]
  6. Serruya, C. Lake Kinneret Monographiae Biologicae; Dr. W. Junk Publishers: The Hague, The Netherlands, 1978; Volume 32, 501p. [Google Scholar]
  7. Gophen, M. Chapter, Part 1: The Lake in: Lake Kinneret; Ministry of Defense—Israel and Kinneret Authority: Tel Aviv, Israel, 1992; 159p, ISBN 965-05-0623-3. [Google Scholar]
  8. Gophen, M. Different Kinneret; MIGAL: Qiryat Shmona, Israel, 2019; 158p, ISBN 978-965-92758-2-3. (In Hebrew) [Google Scholar]
  9. Gophen, M. Agriculture, Recreation, Water Quality and-Nature-Protection-in the-Hula-Valley, Israel: 70 Years-of-a-Mega-Ecological-Project; Springer: Berlin/Heidelberg, Germany, 2023; 243p, ISBN 978-3-031-23411-8. [Google Scholar]
  10. Feitelson, E.; Gazit, T.; Fischhendler, I. The Role of “Red Lines” in Safeguarding the Sea of Galilee (Lake Kinneret); The Jerusalem Institute for Israeli Studies: Jerusalem, Israel, 2005; 75p, (In Hebrew; English Abstract). [Google Scholar]
  11. Gvirtzman, H. Israel Water Resources, Chapter in Hydrology and Environmental Sciences; Yad Ben-Zvi Press: Jerusalem, Israel, 2002; 278p. (In Hebrew) [Google Scholar]
  12. Dimentman, C.; Bromley, H.J.; Por, F.D. Lake Hula; Fauna Palaestina-The Fauna et Flora Palaestina Committee Series; Israeli Academy of Sciences and Humanities: Jerusalem, Israel, 1992; 170p. [Google Scholar]
  13. Barnea, I.; Kaplan, D. Hula Project Monitoring Summarized Report, Long-Term Analysis; Project No. 4501334109; National Water Authority, Jewish National Fund (KKL): Podgorica, Montenegro, 2020; 232p. (In Hebrew) [Google Scholar]
  14. Mero, F. Chapter: The Water Balance of Lake Kinneret. In Lake Kinneret, Monographiae Biologicae; Seruya, C., Ed.; Dr. W. Junk Publishers: The Hague, The Netherlands, 1978; Volume 32, pp. 99–103. [Google Scholar]
  15. Neuman, J. On the water balance of Lake Huleh and the Huleh Swamps 1942\43–1946\47. Isr. Explor. J. 1955, 5, 49–58. [Google Scholar]
  16. Reshef, G. Monthly Report: HIS/07/2023 Hydrological Status: Surface Waters; National Ground Water Table Systems; National Ground Water Association: Westerville, OH, USA, 2023. (In Hebrew) [Google Scholar]
  17. Zohary, M.; Orshansky, G. The Vegetation of the Huleh Plain. Palest. J. Bot. Jerus. Ser. 1947, 4, 90–104. [Google Scholar]
  18. Zohary, M. Flora Palaestina; The Israeli Academy of Sziendes and Humanities: Jerusalem, Israel, 1966; Volumes 1 and 2. [Google Scholar]
  19. Zohary, M. Vegetation of Israel and Adjacent areas. In Brihefte zum, Tubinger, Atlas des Vndern Orients; Blum, H., Frey, W., Eds.; Dr. Ludwing Reichert Verlag: Weisbaden, Germany, 1982; pp. 146–160. [Google Scholar]
  20. Zohary, M.; Orshan, G.; Muhsam, H.V.; Lewin, M. Weight estimate of the papyrus culms growing in the Hula marshes. Bull. Res. Coun. 1955, 5C, 35–45. [Google Scholar]
  21. Jones, R.F. Report of Percy Sladen Expedition to Lake Huleh: A contribution the study of the Fresh—Waters of Palestine. Part I: The plant ecology of the district. J. Ecol. 1940, 28, 357–376. [Google Scholar] [CrossRef]
  22. Jones, R.F.; Washbourn, R. Report of the Percy Sladen Expedition to Lake Huleh: A contribution the study of the Fresh—Waters of Palestine—Part II: The Flora. J. Bot. Lond. 1940, 78, 273–283. [Google Scholar]
  23. Kaplan, D. Instability in Newly Established Wetlands? Trajectories of Flporistic Change in the Re-Flooded Hula Peatland, Northern Israel; Mires and Peat Volume 9 (2011/12) Article 5, 1–10. Available online: https://www.mires-and-peat.net/ (accessed on 9 May 2023).
  24. Openheimer, H.R. An account of the vegetationof the Huleh swamps. Palaestine journal of Botany. Rehovot. Ser. 1938, 2, 34–39. [Google Scholar]
  25. Washbourn, R.; Jones, R.F. Percy Sladen Expedition to Lake Huleh: Palestine. Proc. Lin. Soc. Lond. 1937, 149, 97–99. [Google Scholar] [CrossRef]
  26. Kaplan, D.; Oron, T.; Gutman, M. Development of Macrophitic Vegetation in the Agmon Wetland of Israel by Spontaneous Colonization and Reintroduction; Wetlands Ecology and Management, Kluwer Academic Publishers: Alphen aan den Rijn, The Netherlands, 1998; Volume 6, pp. 143–150. [Google Scholar]
  27. Kaplan, D.; Meron, M. 2006, Chapter: The flora of the Agmon and adjacent areas. In Annual Report 2005, Hula Reclamation Project, Migal-Scientific Research Institute, US Forestry Service International Project; Gophen, M., Ed.; Jewish National Fund (KKL), National Water Authority: Migal, Israel, 2005; pp. 74–89. [Google Scholar]
  28. Or, Y. I. Chapter: Long-term (2007–2018) study of the vegetation monitoring in the Hula valley. In Hula Reclamation Project Annual Report 2008–2018, National Water Authority; Barnea, I., Kaplan, D., Eds.; Project No. 4501334109; Jewish National Fund (KKL) and the Peat-land Convention Farmers Organization: Jerusalem, Israel, 2020; pp. 101–132. (In Hebrew) [Google Scholar]
  29. Shirihai, H.; Dovrat, E.; Christie, A. (Eds.) The Birds of Israel: A Complete Avifauna and Bird Atlas of Israel; Academic Press Limited: London, UK, 1996; ISBN 10:0126402558/13:0126402551. [Google Scholar]
  30. Svenson, L.; Grant, P.; Mullaney, K.; Zetterstrom, D. Bird Guide, Hebrew Edition; Printed in Israel; Hakibbutz Hameuchad Publishers: Bnei Brak, Israel, 2003; 408p. [Google Scholar]
  31. Alon, D.; Yom-Tov, Y. 1999–2001, Cranes in the Hula Valley; Gophen, M., Ed.; Hula Project Annual Reports; Water Authority, Agriculture Ministry, and Jewish National Foundation (KKL): Kiryat Shmonbe, Israel, 2001; pp. 72–86. [Google Scholar]
  32. Labinger, Z.; Alon, D. Chapter: Avifauna. In Annual Report 2005, Hula Reclamation Project, Migal-Scientific Research Institute, US Forestry Service International Project; Gophen, M., Ed.; Jewish National Fund (KKL), National Water Authority: Jerusalem, Israel, 2006; pp. 44–73. [Google Scholar]
  33. Agmon, S.; Levi, A.; Labinger, Z. Chapter: Monitoring Avi fauna in the Hula Valley. In Hula Reclamation Project Annual Report 2008–2018; Barnea, I., Kaplan, D., Eds.; Project No. 4501334109; Jewish National Fund (KKL) and the Peat-land Convention Farmers Organization: Jerusalem, Israel, 2020; pp. 149–170, 171–212. (In Hebrew) [Google Scholar]
  34. Labinger, Z.; Shani, I.; Alon, D.; Agmon, S.; Levi, A. Chapters (1) Annual (2017–2018) Report S. Agmon and A. Levi (149–169); (2) Birds Monitoring in Hula Project-(2014–2015), (3) Z. Labinger (170–212); Water Level and Site Management influence on Waterbirds; Birds Monitor Hula Project. In Hula Project Monitoring Program Conclusive Summary 2008–2018; Barnea, I., Kaplan, D., Eds.; Tel Hai College, National Water Authority and Keren Kayemet Le'Israel (NJF): Migal, Israel, 2020; pp. 149–212. [Google Scholar]
  35. Kroitman, Y.; Barnea, I. The composition of fish communities in lake Agmon-Hula and Hula Valley canals. In Hula Reclamation Project Annual Report 2008–2018, National Water Authority; Project No. 4501334109; Jewish National Fund (KKL) and the Peat-land Convention Farmers Organization: Jerusalem, Israel, 2020; pp. 133–148. (In Hebrew) [Google Scholar]
  36. Degani, G.; Yehuda, Y.; Jackson, J.; Gophen, M. Temporal variation in fish community structure in a newly created wetland (Lake Agmon) in Israel. Ecol. Manag. 1998, 6, 151–157. [Google Scholar]
  37. Mendelssohn, H.; Steinitz, H. A New Frog from Palestine; Copeia: Ann Arbor, MI, USA, 1943; pp. 231–233. [Google Scholar]
  38. Biton, R.; Geffen, E.; Vences, M.; Cohen, O.; Bailon, S.; Rabinovich, R.; Malka, Y.; Oron, T.; Boistel, R.; Brumfeld, V.; et al. The rediscovered Hula painted frog is a living fossil. Nat. Commun. 2013, 4, 1–6. [Google Scholar] [CrossRef] [PubMed] [Green Version]
  39. Comay, O.; Weisbrood, L.; Dayan, T. Predictive modelling in Paleoenvironmental reconstruction: Manot Cave, Israrl. J. Hum. Evol. 2021, 160, 1–5. [Google Scholar] [CrossRef] [PubMed]
  40. Arbel, A. MAPA's Dictionary of Mammals: The complete Guide for Mammals in Israel; MAP-Mapping and Maps Publishing Publisher: Tel Aviv, Israel, 2008; 438p. (In Hebrew) [Google Scholar]
  41. Battisti, C.; Cento, M.; Circosta, A.; Coppola, M.; Muratore, S. Resurrecting seasonal dynamics in waterbirds after wetland restoration: Before-after monitoring highlights the role of a single dominant species. Wetl. Ecol. Manag. 2023, 31, 203–211. [Google Scholar] [CrossRef] [PubMed]
  42. Francesca, C.; Battisti, C.M.C.; Sorace, A. Effect of winter water stress on the breeding bird assemblage of a remnant wetland in central Italy. Rev. D’ecol. Terre Vie 2009, 64, 61–72. [Google Scholar]
  43. Zalidis, G.C.; Gerakis, A. Evaluating Sustainability of Watershed Resources Management through Wetland Functional Analysis. Environ. Manag. 1999, 24, 193–207. [Google Scholar] [CrossRef] [PubMed]
Figure 1. Trend of changes (Lowess Smoother, 0.8 bandwidth). of the regression between annual (1974–2021) mean discharge (mcm/y) of the River Jordan and rainfall capacity (mm/y) measured near the source of the Dan (Dafna);(Linear Regression: r2 = 0.6158; p = 0.0054).
Diversity 15 00758 g001
Figure 2. Temporal Trend of Changes (Lowess Smoother, 0.8 bandwidth) of annual (1974–2021) mean discharge (m3/s) of River Dan; (Linear Regression: r2 = 0.2125; p = 0.0011).
Diversity 15 00758 g002
Figure 3. Trend of changes (Lowess Smoother, 0.8 bandwidth) of the regression between annual (1974–2021) mean discharge (m3/s) of River Dan and Jordan River annual discharge (mcm; 106 m3/year); (Linear Regression: r2 = 0.3217; p < 0.0001).
Diversity 15 00758 g003
Figure 4. Trend of changes (Lowess Smoother, 0.8 bandwidth) of the regression between annual (1974–2021) mean discharge (m3/s) of river Dan measured near the source of the Dan (Dafna) and rainfall capacity (mm/y). (Linear regression: r2 = 0.5818; p < 0.0001).
Diversity 15 00758 g004
Figure 5. Temporal Trend of changes (Lowess Smoother, 0.8 bandwidth) of River Jordan discharge (mcm/y; 106 m3/year) (Huri Station) during 1970–2018; (Linear Regression: r2 = 0.1512; p = 0.0083).
Diversity 15 00758 g005
Figure 6. Temporal Trend of changes (Lowess Smoother, 0.8 bandwidth) of annual load of Total Nitrogen (TN) (Ton/Year) measured in River Jordan discharge (Huri Station) during 1970–2018; (Linear Regression: r2 = 0.1793; p = 0.0024).
Diversity 15 00758 g006
Figure 7. Trend of changes (Lowess Smoother, 0.8 bandwidth) of the regression between annual load of Nitrate (NO3) (Ton/Year) and annual discharge of the River Jordan measured in Huri Station during 1970–2018; (Linear Regression: r2 = 0.7574; p < 0.0001).
Diversity 15 00758 g007
Figure 8. Temporal Trend of changes (Lowess Smoother, 0.8 bandwidth) of annual load of Organic Nitrogen (Ton/Year) measured in the River Jordan (Huri Station) during 1970–2018; (Linear Regression: r2 = 0.4888; p < 0.0001).
Diversity 15 00758 g008
Figure 9. Temporal Trend of changes (Lowess Smoother, 0.8 bandwidth) of annual load of Ammonium (NH4) (Ton/Year) measured in River Jordan discharge (Huri Station) during 1970–2018; (Linear Regression: r2 = 0.2952; p < 0.0001).
Diversity 15 00758 g009
Figure 10. Temporal Trend of changes (Lowess Smoother, 0.8 bandwidth) of annual load of transported Total Phosphorus (TP) (Ton/Year) measured in River Jordan discharge (Huri Station) during 1970–2018; (Linear Regression: r2 = 0.2957; p < 0.0001).
Diversity 15 00758 g010
Figure 11. Temporal Trend of changes (Lowess Smoother, 0.8 bandwidth) of annual load (Ton/Year) of Total Dissolved Phosphorus measured in river Jordan discharge (Huri Station) during 1970–2018; (Linear Regression: r2 = 0.2372; p = 0.0004).
Diversity 15 00758 g011
Figure 12. Monthly means (2002–2014) of the depth of Ground Water Table below the soil surface, in 14 drills in the northern and southern parts of the Hula Valley.
Diversity 15 00758 g012
Figure 13. Monthly changes (m) of the amplitude of Ground Water Table Depths in the northern (left) and southern (right) sides of the Hula Valley.
Diversity 15 00758 g013
Figure 14. Temporal (1994–2018) changes of maximal counts of the wintering crane population in the Hula Valley (LOWESS Smoother, Bandwidth 0.8).
Diversity 15 00758 g014
Table 1. Land-use-land-cover of 59 km2 of the Hula Valley previously (<1958) covered by seasonally flooded, permanently swampy wetland and old Lake Hula. Numbers are km2 and %. Historical events of anthropogenic intervention: 1952–1957 Hula Drainage and conversion to agricultural management; 1989–1995—Hula project implementation.
Used-Cover Type19491958197619862010
Water14 (24%)001 (2%)1 (2%)
Swamps32 (54%)4 (7%)4 (7%)2 (3%)4 (7%)
Flooded13 (22%)0000
Field Crops035 (59%)46 (79%)34 (58%)40 (68%)
Uncultivated010 (17%)-8 (14%)3 (5%)
Other05 (8.5%)2 (3%)6 (10%)4 (7%)
Orchards002 (3%)5 (8%)6 (9%)
Fish Ponds05 (8.5%)3 (8%)3 (5%)1 (2%)
Total5959595959
Table 2. Discharge (m3/s) of Kinneret Headwaters (Snir, Hermon, Dan, River Jordan at Huri) and the Golan Heights on the 1st of April and annual mean during 2018–2023.
YearHeadwaters AprilHeadwaters
Annual
Golan Heights AprilGolan Heights AnnualJordan (Huri)
20187.32.40.710.718
201917.75.92.152.1524
2020206.71.531.5324
20213.44.50.520.5215.8
202221.47.11.61.631
202312 0.810.8115.5
Table 3. Monthly averages (1994–2018) of TP concentration (ppb) in the Lake Agmon-Hula effluent. During months 11,12,1,2,3, cranes are present in the valley whilst during the other months cranes are absent.
MonthTP (ppb)
1222
2258
3232
4183
5222
6222
7204
8317
9473
10279
11325
12245
Table 4. The results of Species Richness Distribution (SRD) for plants, birds and fish.
PeriodBirdsPlantsFish
Bef-SRD2.20.92.95
Bef-BDI3.60.150.49
Aft-SRD3.11.92.3
Aft-BDI0.420.260.32
Disclaimer/Publisher’s Note: The statements, opinions and data contained in all publications are solely those of the individual author(s) and contributor(s) and not of MDPI and/or the editor(s). MDPI and/or the editor(s) disclaim responsibility for any injury to people or property resulting from any ideas, methods, instructions or products referred to in the content.