

Effects of Climate Events on Abundance and Distribution of Major Commercial Fishes in the Beibu Gulf, South China Sea

 ,
,  , and
, and 
Abstract
Highlights
- The abundance of most of fish stocks in the Beibu Gulf continued to decline over the last 15 years.
- Environmental variations caused by climate events can episodically enhance the abundance of certain fish stocks.
- Warming may be the reason of northward shifts in distribution of most fishes.
Abstract
1. Introduction
2. Data and Method
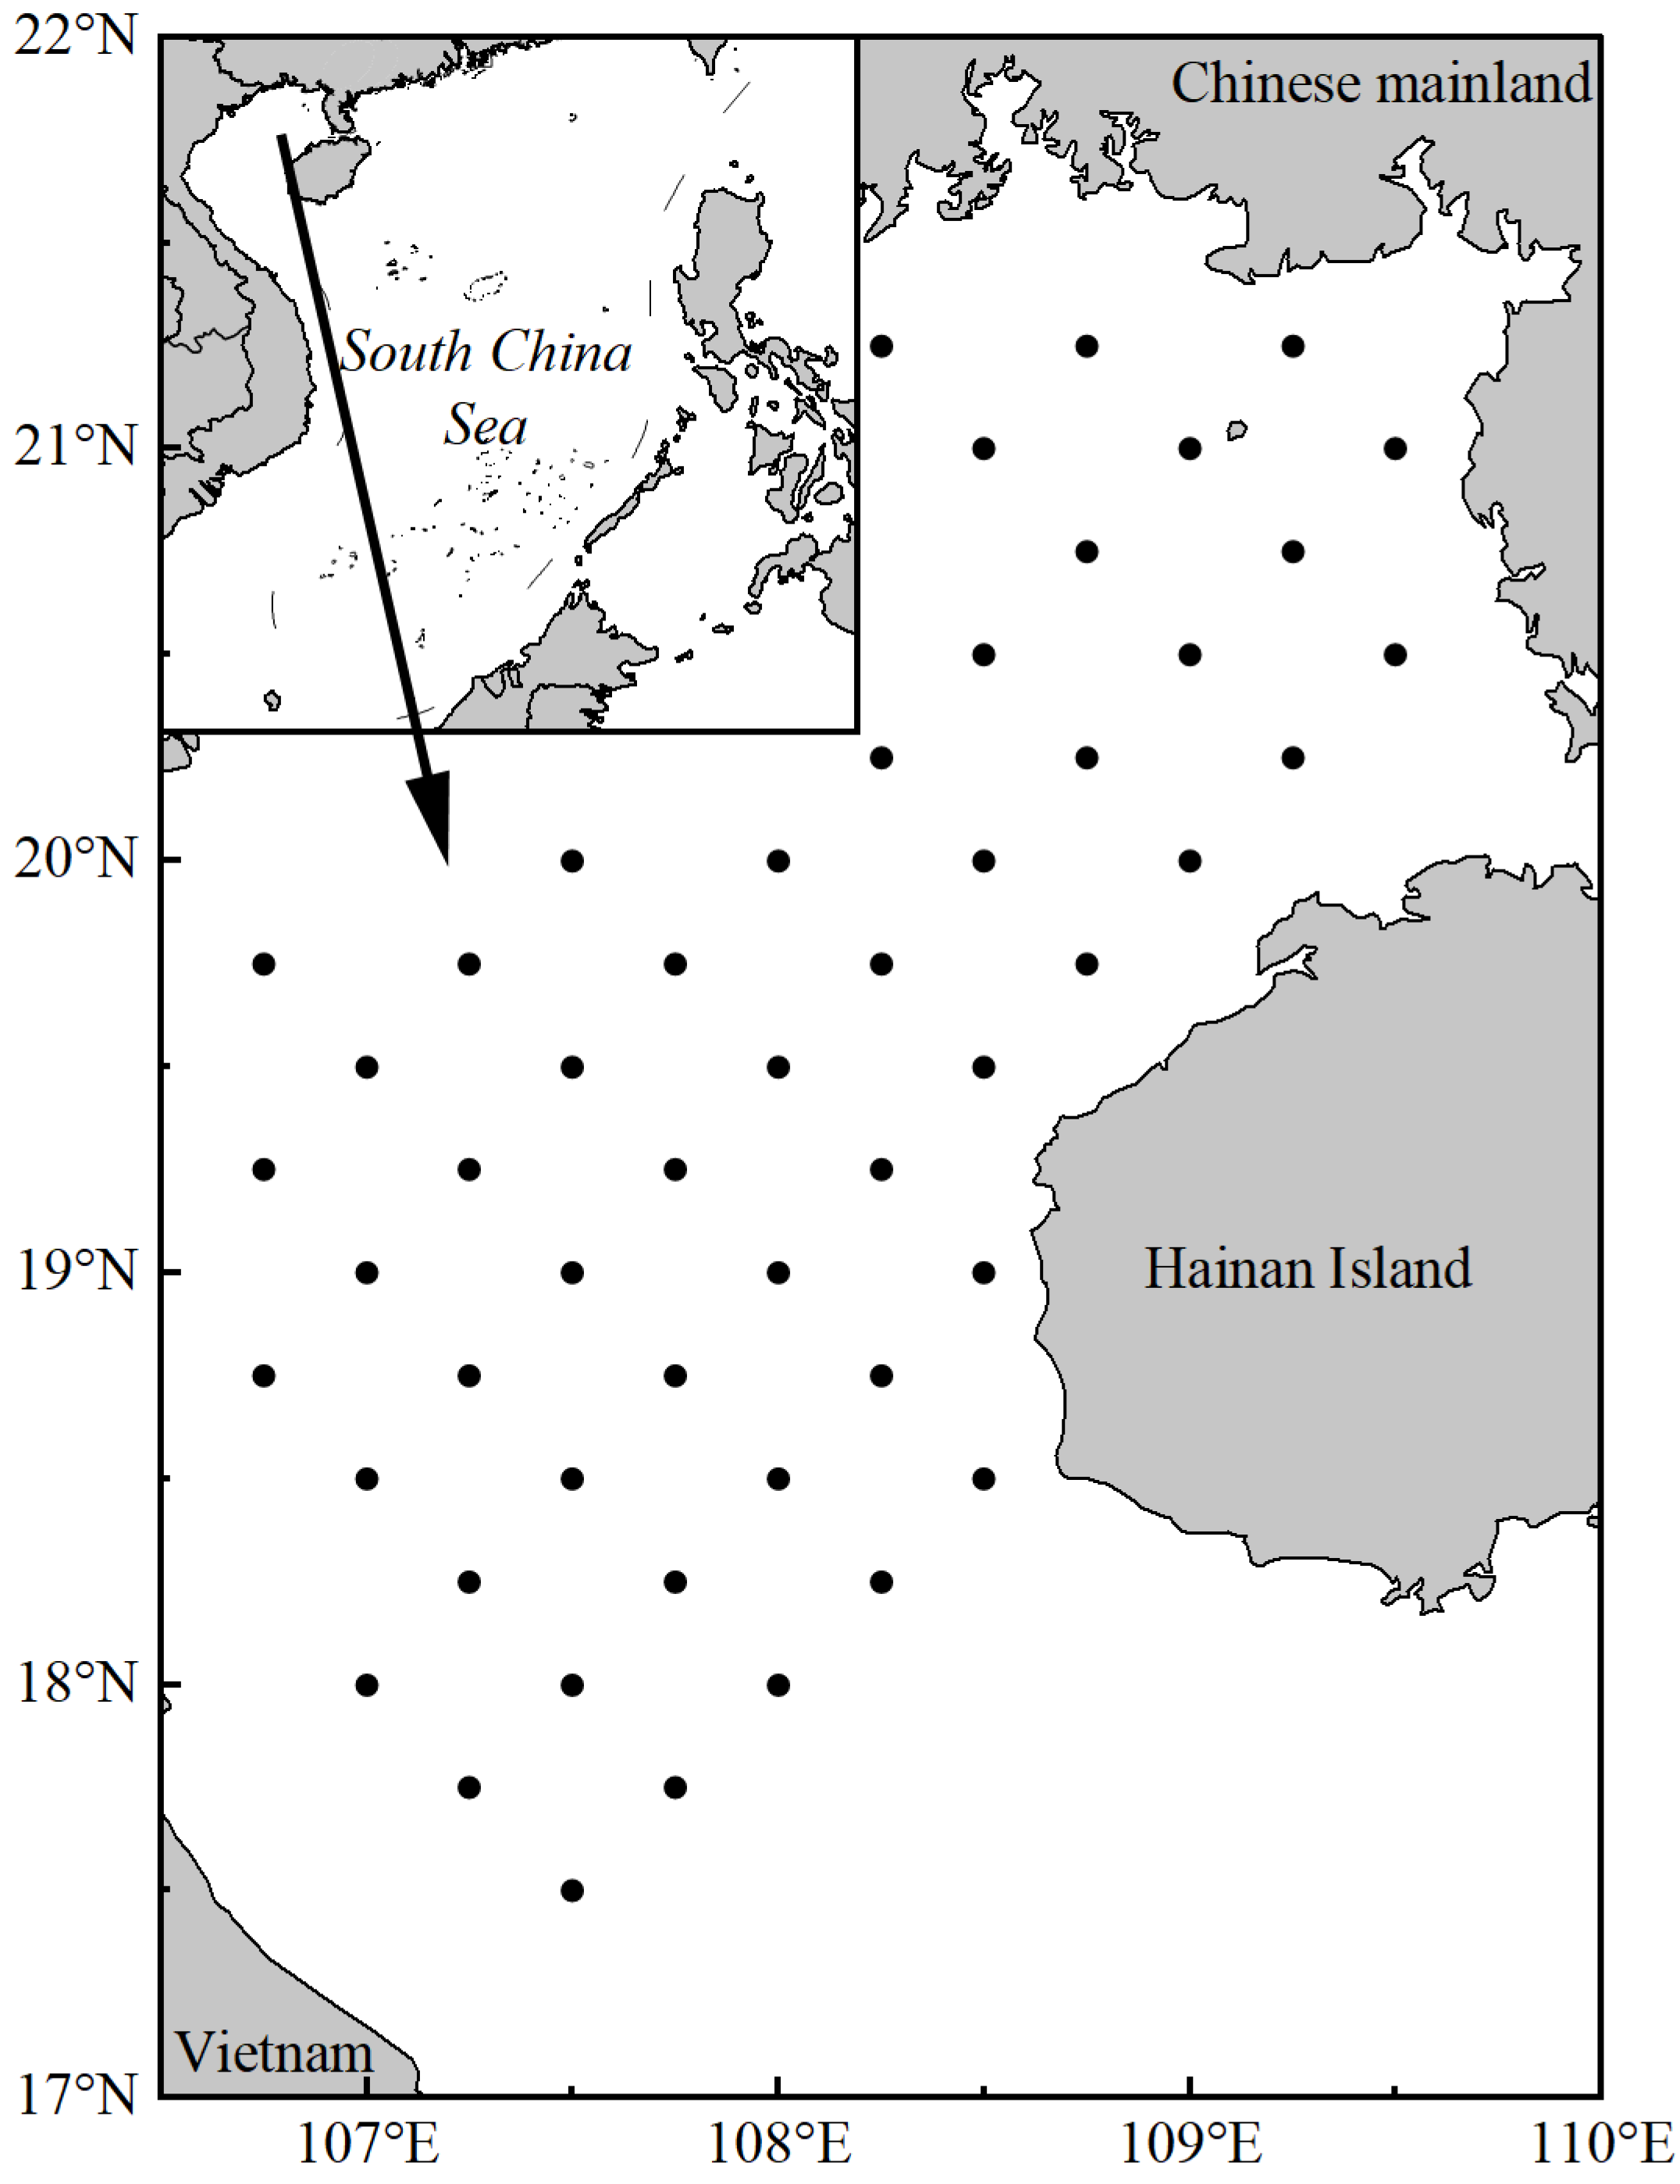
2.1. Study Site
2.2. Sampling Protocol and Equipment
2.3. Data Sources
2.4. Data Processing
2.5. Data Analysis
3. Results
3.1. Environmental Effects on Fish Abundance
3.2. Changes in the Fish Abundance and Environmental Variables over Time Series
3.3. Climate Effects on Gravity Center
4. Discussion
Author Contributions
Funding
Data Availability Statement
Conflicts of Interest
References
- McLean, D.L.; Langlois, T.J.; Newman, S.J.; Holmes, T.H.; Birt, M.J.; Bornt, K.R.; Bond, T.; Collins, D.L.; Evans, S.N.; Travers, M.J.; et al. Distribution, abundance, diversity and habitat associations of fishes across a bioregion experiencing rapid coastal development. Estuar. Coast. Shelf Sci. 2016, 178, 36–47. [Google Scholar] [CrossRef]
- Stepanenko, M.A.; Gritsay, E.V. Eastern Bering Sea pollock recruitment, abundance, distribution and approach to fishery management. Fish. Sci. 2014, 80, 151–160. [Google Scholar] [CrossRef]
- Sundstrom, S.M.; Angeler, D.G.; Barichievy, C.; Eason, T.; Garmestani, A.; Gunderson, L.; Knutson, M.; Nash, K.L.; Spanbauer, T.; Stow, C.; et al. The distribution and role of functional abundance in cross-scale resilience. Ecology 2018, 99, 2421–2432. [Google Scholar] [CrossRef] [PubMed]
- Stenevik, E.K.; Sundby, S. Impacts of climate change on commercial fish stocks in Norwegian waters. Mar. Policy 2007, 31, 19–31. [Google Scholar] [CrossRef]
- Berkeley, S.A.; Hixon, M.A.; Larson, R.J.; Love, M.S. Fisheries Sustainability via Protection of Age Structure and Spatial Distribution of Fish Populations. Fisheries 2004, 29, 23–32. [Google Scholar] [CrossRef]
- Burden, M.; Fujita, R. Better fisheries management can help reduce conflict, improve food security, and increase economic productivity in the face of climate change. Mar. Policy 2019, 108, 103610. [Google Scholar] [CrossRef]
- McGowan, J.A.; Cayan, D.R.; Dorman, L.M. Climate-Ocean Variability and Ecosystem Response in the Northeast Pacific. Science 1998, 281, 210–216. [Google Scholar] [CrossRef] [PubMed]
- Lehodey, P.; Alheit, J.; Barange, M.; Baumgartner, T.; Beaugrand, G.; Drinkwater, K.; Fromentin, J.-M.; Hare, S.R.; Ottersen, G.; Perry, R.I.; et al. Climate Variability, Fish, and Fisheries. J. Clim. 2006, 19, 5009–5030. [Google Scholar] [CrossRef]
- McPhaden, M.J.; Zebiak, S.E.; Glantz, M.H. ENSO as an integrating concept in earth science. Science 2006, 314, 1740–1745. [Google Scholar] [CrossRef]
- Klein, S.A.; Soden, B.J.; Lau, N.-C. Remote Sea Surface Temperature Variations during ENSO: Evidence for a Tropical Atmospheric Bridge. J. Clim. 1999, 12, 917–932. [Google Scholar] [CrossRef]
- Wang, C.; Wang, W.; Wang, D.; Wang, Q. Interannual variability of the South China Sea associated with El Niño. J. Geophys. Res. Ocean. 2006, 111. [Google Scholar] [CrossRef]
- Liu, Q.; Feng, M.; Wang, D. ENSO-induced interannual variability in the southeastern South China Sea. J. Oceanogr. 2011, 67, 127–133. [Google Scholar] [CrossRef]
- Jiang, N.; Zhu, C. Asymmetric Changes of ENSO Diversity Modulated by the Cold Tongue Mode Under Recent Global Warming. Geophys. Res. Lett. 2018, 45, 506–512, 513. [Google Scholar] [CrossRef]
- Wang, S.-Y.; L’Heureux, M.; Yoon, J.-H. Are Greenhouse Gases Changing ENSO Precursors in the Western North Pacific? J. Clim. 2013, 26, 6309–6322. [Google Scholar] [CrossRef]
- Yoon, J.-H.; Wang, S.Y.S.; Gillies, R.R.; Kravitz, B.; Hipps, L.; Rasch, P.J. Increasing water cycle extremes in California and in relation to ENSO cycle under global warming. Nat. Commun. 2015, 6, 8657. [Google Scholar] [CrossRef]
- Cai, W.; Santoso, A.; Wang, G.; Yeh, S.-W.; An, S.-I.; Cobb, K.M.; Collins, M.; Guilyardi, E.; Jin, F.-F.; Kug, J.-S.; et al. ENSO and greenhouse warming. Nat. Clim. Chang. 2015, 5, 849–859. [Google Scholar] [CrossRef]
- Lough, J.M.; Anderson, K.D.; Hughes, T.P. Increasing thermal stress for tropical coral reefs: 1871-2017. Sci. Rep. 2018, 8, 6079. [Google Scholar] [CrossRef]
- Lin, I.-I.; Camargo, S.J.; Patricola, C.M.; Boucharel, J.; Chand, S.; Klotzbach, P.; Chan, J.C.L.; Wang, B.; Chang, P.; Li, T.; et al. ENSO and tropical cyclones. In El Niño Southern Oscillation in a Changing Climate; Wiley: Hoboken, NJ, USA, 2020; pp. 377–408. [Google Scholar]
- Barnard, P.L.; Short, A.D.; Harley, M.D.; Splinter, K.D.; Vitousek, S.; Turner, I.L.; Allan, J.; Banno, M.; Bryan, K.R.; Doria, A. Coastal vulnerability across the Pacific dominated by El Nino/Southern oscillation. Nat. Geosci. 2015, 8, 801–807. [Google Scholar] [CrossRef]
- Philip, S.Y.; Collins, M.; van Oldenborgh, G.J.; van den Hurk, B.J.J.M. The role of atmosphere and ocean physical processes in ENSO in a perturbed physics coupled climate model. Ocean Sci. 2010, 6, 441–459. [Google Scholar] [CrossRef]
- Timmermann, A.; An, S.-I.; Kug, J.-S.; Jin, F.-F.; Cai, W.; Capotondi, A.; Cobb, K.M.; Lengaigne, M.; McPhaden, M.J.; Stuecker, M.F. El Niño–southern oscillation complexity. Nature 2018, 559, 535–545. [Google Scholar] [CrossRef]
- Corno, G.; Karl, D.M.; Church, M.J.; Letelier, R.M.; Lukas, R.; Bidigare, R.R.; Abbott, M.R. Impact of climate forcing on ecosystem processes in the North Pacific Subtropical Gyre. J. Geophys. Res. 2007, 112. [Google Scholar] [CrossRef]
- Duque-Herrera, A.-F.; Helenes, J.; Flores-Trujillo, J.-G.; Ruiz-Fernández, A.-C.; Sánchez-Cabeza, J.-A. Dinoflagellate cysts and ENSO-PDO climate forcing in the southern Gulf of California. Palaeogeogr. Palaeoclimatol. Palaeoecol. 2020, 560, 110055. [Google Scholar] [CrossRef]
- Gonzalez-Pestana, A.; Alfaro-Shigueto, J.; Mangel, J.C. A review of high trophic predator-prey relationships in the pelagic Northern Humboldt system, with a focus on anchovetas. Fish. Res. 2022, 253, 106386. [Google Scholar] [CrossRef]
- Yu, W.; Wen, J.; Chen, X.; Liu, B. El Niño–Southern Oscillation impacts on jumbo squid habitat: Implication for fisheries management. Aquat. Conserv. Mar. Freshw. Ecosyst. 2021, 31, 2072–2083. [Google Scholar] [CrossRef]
- Sprogis, K.R.; Christiansen, F.; Wandres, M.; Bejder, L. El Nino Southern Oscillation influences the abundance and movements of a marine top predator in coastal waters. Glob. Chang. Biol. 2018, 24, 1085–1096. [Google Scholar] [CrossRef]
- Cheal, A.J.; Delean, S.; Sweatman, H.; Thompson, A.A. Spatial synchrony in coral reef fish populations and the influence of climate. Ecology 2007, 88, 158–169. [Google Scholar] [CrossRef]
- Taylor, M.H.; Wolff, M.; Mendo, J.; Yamashiro, C. Changes in trophic flow structure of Independence Bay (Peru) over an ENSO cycle. Prog. Oceanogr. 2008, 79, 336–351. [Google Scholar] [CrossRef]
- Bertrand, A.; Lengaigne, M.; Takahashi, K.; Avadi, A.; Poulain, F.; Harrod, C. El Niño Southern Oscillation (ENSO) Effects on Fisheries and Aquaculture; Food & Agriculture Organization: Rome, Italy, 2020; Volume 660. [Google Scholar]
- Ma, S.; Liu, Y.; Li, J.; Fu, C.; Ye, Z.; Sun, P.; Yu, H.; Cheng, J.; Tian, Y. Climate-induced long-term variations in ecosystem structure and atmosphere-ocean-ecosystem processes in the Yellow Sea and East China Sea. Prog. Oceanogr. 2019, 175, 183–197. [Google Scholar] [CrossRef]
- Yin, J.; Xu, J.; Xue, Y.; Xu, B.; Zhang, C.; Li, Y.; Ren, Y. Evaluating the impacts of El Nino events on a marine bay ecosystem based on selected ecological network indicators. Sci. Total Environ. 2021, 763, 144205. [Google Scholar] [CrossRef]
- Su, L.; Xu, Y.; Qiu, Y.; Sun, M.; Zhang, K.; Chen, Z. Long-Term Change of a Fish-Based Index of Biotic Integrity for a Semi-Enclosed Bay in the Beibu Gulf. Fishes 2022, 7, 124. [Google Scholar] [CrossRef]
- Quoc Khanh, N.; Duc Phu, T.; Trong Luong, N.; Opoku-Acheampong, A.A. Appropriate Fishing Depths for Squid Longline Fishery in the Gulf of Tonkin, Vietnam; Secretariat, Southeast Asian Fisheries Development Center: Bangkok, Thailand, 2013. [Google Scholar]
- Sun, D. A Study on Fishery Resources and Sustainable Fishery Development in the Beibu Bay; Ocean University of China: Qingdao, China, 2008. [Google Scholar]
- Chen, Z.; Xu, S.; Qiu, Y.; Lin, Z.; Jia, X. Modeling the effects of fishery management and marine protected areas on the Beibu Gulf using spatial ecosystem simulation. Fish. Res. 2009, 100, 222–229. [Google Scholar] [CrossRef]
- Zhang, K.; Cai, Y.; Liao, B.; Jiang, Y.; Sun, M.; Su, L.; Chen, Z. Population dynamics of threadfin porgy Evynnis cardinalis, an endangered species on the IUCN red list in the Beibu Gulf, South China Sea. J. Fish Biol. 2020, 97, 479–489. [Google Scholar] [CrossRef] [PubMed]
- Rong, Z.; Liu, Y.; Zong, H.; Cheng, Y. Interannual sea level variability in the South China Sea and its response to ENSO. Glob. Planet. Chang. 2007, 55, 257–272. [Google Scholar] [CrossRef]
- Liu, K.; Xu, K.; Zhu, C.; Liu, B. Diversity of Marine Heatwaves in the South China Sea Regulated by ENSO Phase. J. Clim. 2022, 35, 877–893. [Google Scholar] [CrossRef]
- Supari; Tangang, F.; Salimun, E.; Aldrian, E.; Sopaheluwakan, A.; Juneng, L. ENSO modulation of seasonal rainfall and extremes in Indonesia. Clim. Dyn. 2017, 51, 2559–2580. [Google Scholar] [CrossRef]
- Zhou, L.-T.; Tam, C.-Y.; Zhou, W.; Chan, J.C. Influence of South China Sea SST and the ENSO on winter rainfall over South China. Adv. Atmos. Sci. 2010, 27, 832–844. [Google Scholar] [CrossRef]
- Fan, Y.; Fan, K.; Xu, Z.; Li, S. ENSO–South China Sea summer monsoon interaction modulated by the Atlantic Multidecadal Oscillation. J. Clim. 2018, 31, 3061–3076. [Google Scholar] [CrossRef]
- Zhou, W.; Chan, J.C.L. ENSO and the South China Sea summer monsoon onset. Int. J. Climatol. 2007, 27, 157–167. [Google Scholar] [CrossRef]
- Chen, J.-M.; Li, T.; Shih, C.-F. Fall Persistence Barrier of Sea Surface Temperature in the South China Sea Associated with ENSO. J. Clim. 2007, 20, 158–172. [Google Scholar] [CrossRef]
- Wu, R.; Chen, W.; Wang, G.; Hu, K. Relative contribution of ENSO and East Asian winter monsoon to the South China Sea SST anomalies during ENSO decaying years. J. Geophys. Res. Atmos. 2014, 119, 5046–5064. [Google Scholar] [CrossRef]
- Zhang, K.; Li, M.; Li, J.; Sun, M.; Xu, Y.; Cai, Y.; Chen, Z.; Qiu, Y. Climate-induced small pelagic fish blooms in an overexploited marine ecosystem of the South China Sea. Ecol. Indic. 2022, 145, 109598. [Google Scholar] [CrossRef]
- Zhang, X.; Vincent, A.C.J. China’s policies on bottom trawl fisheries over seven decades (1949–2018). Mar. Policy 2020, 122, 104256. [Google Scholar] [CrossRef]
- Sparre, P. Introduction to tropical fish stock assessment. Part 1. Manual. FAO Fish. Tech. Paper. 1998, 306, 1–407. [Google Scholar]
- Liaw, A.; Wiener, M. Classification and regression by random Forest. R News 2002, 2, 18–22. [Google Scholar]
- Breiman, L. Random forests. Mach. Learn. 2001, 45, 5–32. [Google Scholar] [CrossRef]
- Yu, W.; Yi, Q.; Chen, X.; Chen, Y. Climate-driven latitudinal shift in fishing ground of jumbo flying squid (Dosidicus gigas) in the Southeast Pacific Ocean off Peru. Int. J. Remote Sens. 2017, 38, 3531–3550. [Google Scholar] [CrossRef]
- Brander, K.M. Global fish production and climate change. Proc. Natl. Acad. Sci. USA 2007, 104, 19709–19714. [Google Scholar] [CrossRef]
- Su, L.; Chen, Z.; Zhang, K.; Xu, Y.; Xu, S.; Wang, K. Decadal-Scale Variation in Mean Trophic Level in Beibu Gulf Based on Bottom-Trawl Survey Data. Mar. Coast. Fish. 2021, 13, 174–182. [Google Scholar] [CrossRef]
- Larocque, S.M.; Johnson, T.B.; Fisk, A.T. Trophic niche overlap and abundance reveal potential impact of interspecific interactions on a reintroduced fish. Can. J. Fish. Aquat. Sci. 2021, 78, 765–774. [Google Scholar] [CrossRef]
- Huang, Y.; Huang, M. Implementation of the Sino-Vietnamese Fishery Agreement: Mainly Chinese Perspective. Beijing Law Rev. 2013, 4, 103–119. [Google Scholar] [CrossRef]
- Tian, H.; Liu, Y.; Tian, Y.; Jing, Y.; Liu, S.; Liu, X.; Zhang, Y. Advances in the use of nighttime light data to monitor and assess coastal fisheries under the impacts of human activities and climate and environmental changes: A case study in the Beibu Gulf. Mar. Policy 2022, 144, 105227. [Google Scholar] [CrossRef]
- Sun, M.; Li, Y.; Chen, Y. Unveiling unselective fishing in China: A nationwide meta-analysis of multispecies fisheries. Fish Fish. 2022, 24, 142–158. [Google Scholar] [CrossRef]
- Pinsky, M.L.; Byler, D. Fishing, fast growth and climate variability increase the risk of collapse. Proc. Biol. Sci. 2015, 282, 20151053. [Google Scholar] [CrossRef] [PubMed]
- Courtois, P.; Hu, X.; Pennelly, C.; Spence, P.; Myers, P.G. Mixed layer depth calculation in deep convection regions in ocean numerical models. Ocean. Model. 2017, 120, 60–78. [Google Scholar] [CrossRef]
- Olivar, M.P.; Beckley, L.E. Latitudinal variation in diversity and abundance of mesopelagic fishes associated with change in oceanographic variables along 110°E, south-east Indian Ocean. Deep. Sea Res. Part II Top. Stud. Oceanogr. 2022, 198, 105053. [Google Scholar] [CrossRef]
- Choi, C.Y.; An, K.W.; An, M.I. Molecular characterization and mRNA expression of glutathione peroxidase and glutathione S-transferase during osmotic stress in olive flounder (Paralichthys olivaceus). Comp. Biochem. Physiol. Part A Mol. Integr. Physiol. 2008, 149, 330–337. [Google Scholar] [CrossRef]
- Kannad, A.; Goodkin, N.F.; Samanta, D.; Murty, S.A.; Ramos, R.D.; Smerdon, J.E.; Gordon, A.L. Drivers of Coral Reconstructed Salinity in the South China Sea and Maritime Continent: The Influence of the 1976 Indo-Pacific Climate Shift. J. Geophys. Res. Ocean. 2022, 127, e2021JC017787. [Google Scholar] [CrossRef]
- Rijnsdorp, A.D.; Peck, M.A.; Engelhard, G.H.; Möllmann, C.; Pinnegar, J.K. Resolving the effect of climate change on fish populations. ICES J. Mar. Sci. 2009, 66, 1570–1583. [Google Scholar] [CrossRef]
- Jamaludin, N.A.; Mohd-Arshaad, W.; Mohd Akib, N.A.; Zainal Abidin, D.H.; Nghia, N.V.; Nor, S.M. Phylogeography of the Japanese scad, Decapterus maruadsi (Teleostei; Carangidae) across the Central Indo-West Pacific: Evidence of strong regional structure and cryptic diversity. Mitochondrial DNA A DNA Mapp. Seq. Anal. 2020, 31, 298–310. [Google Scholar] [CrossRef]
- Kamaruzzaman, Y.N.; Mustapha, M.A.; Ghaffar, M. Impacts of Sea Temperature Rise on Rastrelliger kanagurta Potential Fishing Grounds in the Exclusive Economic Zone (EEZ) Off South China Sea. Sains Malays. 2021, 50, 3467–3479. [Google Scholar] [CrossRef]
- Liu, X.; Wang, J.; Zhang, Y.; Yu, H.; Xu, B.; Zhang, C.; Ren, Y.; Xue, Y. Comparison between two GAMs in quantifying the spatial distribution of Hexagrammos otakii in Haizhou Bay, China. Fish. Res. 2019, 218, 209–217. [Google Scholar] [CrossRef]
- Zhao, H.; Feng, Y.; Dong, C.; Li, Z. Spatiotemporal distribution of Decapterus maruadsi in spring and autumn in response to environmental variation in the northern South China Sea. Reg. Stud. Mar. Sci. 2021, 45, 101811. [Google Scholar] [CrossRef]
- Hassan, R.; Bidin, R. Management of Small Pelagic Fishery Resources in the South China Sea and Andaman Sea Areas; Secretariat, Southeast Asian Fisheries Development Center: Bangkok, Thailand, 2014. [Google Scholar]
- Ma, W.; Gao, C.; Qin, S.; Ma, J.; Zhao, J. Do Two Different Approaches to the Season in Modeling Affect the Predicted Distribution of Fish? A Case Study for Decapterus maruadsi in the Offshore Waters of Southern Zhejiang, China. Fishes 2022, 7, 153. [Google Scholar] [CrossRef]
- Heino, M.; Dieckmann, U.; Godø, O.R. Measuring probabilistic reaction norms for age and size at maturation. Evolution 2002, 56, 669–678. [Google Scholar] [CrossRef]
- Kuparinen, A.; Cano, J.M.; Loehr, J.; Herczeg, G.; Gonda, A.; Merila, J. Fish age at maturation is influenced by temperature independently of growth. Oecologia 2011, 167, 435–443. [Google Scholar] [CrossRef]
- McMillan, J.R.; Dunham, J.B.; Reeves, G.H.; Mills, J.S.; Jordan, C.E. Individual condition and stream temperature influence early maturation of rainbow and steelhead trout, Oncorhynchus mykiss. Environ. Biol. Fishes 2011, 93, 343–355. [Google Scholar] [CrossRef]
- Longhurst, A.R.; Pauly, D. Ecology of Tropical Oceans; Elsevier: Amsterdam, The Netherlands, 1987. [Google Scholar]
- Crawshaw, L.I. Physiological and Behavioral Reactions of Fishes to Temperature Change. J. Fish. Res. Board Can. 1977, 34, 730–734. [Google Scholar] [CrossRef]
- Jakobsen, H.H.; Markager, S. Carbon-to-chlorophyll ratio for phytoplankton in temperate coastal waters: Seasonal patterns and relationship to nutrients. Limnol. Oceanogr. 2016, 61, 1853–1868. [Google Scholar] [CrossRef]
- Stasko, A.D.; Swanson, H.; Majewski, A.; Atchison, S.; Reist, J.; Power, M. Influences of depth and pelagic subsidies on the size-based trophic structure of Beaufort Sea fish communities. Mar. Ecol. Prog. Ser. 2016, 549, 153–166. [Google Scholar] [CrossRef]
- Townsend, D.W.; Cammen, L.M. Potential Importance of the Timing of Spring Plankton Blooms to Benthic-Pelagic Coupling and Recruitment of Juvenile Demersal Fishes. Biol. Oceanogr. 1988, 5, 215–228. [Google Scholar] [CrossRef]
- Baba, K.; Sugawara, R.; Nitta, H.; Endou, K.; Miyazono, A. Relationship between spat density, food availability, and growth of spawners in cultured Mizuhopecten yessoensis in Funka Bay: Concurrence with El Niño Southern Oscillation. Can. J. Fish. Aquat. Sci. 2009, 66, 6–17. [Google Scholar] [CrossRef]
- Yen, K.-W.; Lu, H.-J. Spatial–temporal variations in primary productivity and population dynamics of skipjack tuna Katsuwonus pelamis in the western and central Pacific Ocean. Fish. Sci. 2016, 82, 563–571. [Google Scholar] [CrossRef]
- Baudron, A.R.; Needle, C.L.; Rijnsdorp, A.D.; Tara Marshall, C. Warming temperatures and smaller body sizes: Synchronous changes in growth of North Sea fishes. Glob. Chang. Biol. 2014, 20, 1023–1031. [Google Scholar] [CrossRef] [PubMed]
- Chu, X.; Dong, C.; Qi, Y. The influence of ENSO on an oceanic eddy pair in the South China Sea. J. Geophys. Res. Ocean. 2017, 122, 1643–1652. [Google Scholar] [CrossRef]
- Dang, X.; Bai, Y.; Gong, F.; Chen, X.; Zhu, Q.; Huang, H.; He, X. Different Responses of Phytoplankton to the ENSO in Two Upwelling Systems of the South China Sea. Estuaries Coasts 2021, 45, 485–500. [Google Scholar] [CrossRef]
- Gao, J.; Wu, G.; Ya, H. Review of the circulation in the Beibu Gulf, South China Sea. Cont. Shelf Res. 2017, 138, 106–119. [Google Scholar] [CrossRef]
- Mustamäki, N.; Jokinen, H.; Scheinin, M.; Bonsdorff, E.; Mattila, J. Seasonal shifts in the vertical distribution of fish in a shallow coastal area. ICES J. Mar. Sci. 2016, 73, 2278–2287. [Google Scholar] [CrossRef]
- Xu, Y.; Zhang, T.; Zhou, J. Historical Occurrence of Algal Blooms in the Northern Beibu Gulf of China and Implications for Future Trends. Front. Microbiol. 2019, 10, 451. [Google Scholar] [CrossRef]
- Lluch-Belda, D.; Lluch-Cota, D.B.; Lluch-Cota, S.E. Changes in marine faunal distributions and ENSO events in the California Current. Fish. Oceanogr. 2005, 14, 458–467. [Google Scholar] [CrossRef]
- Victor, B.C.; Wellington, G.M.; Robertson, D.R.; Ruttenberg, B.I. The effect of the El Niño–Southern Oscillation event on the distribution of reef-associated labrid fishes in the eastern Pacific Ocean. Bull. Mar. Sci. 2001, 69, 279–288. [Google Scholar]
- Bell, R.J.; Richardson, D.E.; Hare, J.A.; Lynch, P.D.; Fratantoni, P.S. Disentangling the effects of climate, abundance, and size on the distribution of marine fish: An example based on four stocks from the Northeast US shelf. ICES J. Mar. Sci. 2015, 72, 1311–1322. [Google Scholar] [CrossRef]
- Perry, A.L.; Low, P.J.; Ellis, J.R.; Reynolds, J.D. Climate change and distribution shifts in marine fishes. Science 2005, 308, 1912–1915. [Google Scholar] [CrossRef]
- Wilson, S.K.; Depcyznski, M.; Fisher, R.; Holmes, T.H.; Noble, M.M.; Radford, B.T.; Rule, M.; Shedrawi, G.; Tinkler, P.; Fulton, C.J. Climatic forcing and larval dispersal capabilities shape the replenishment of fishes and their habitat-forming biota on a tropical coral reef. Ecol. Evol. 2018, 8, 1918–1928. [Google Scholar] [CrossRef]


| Cruise No. | Sampling Date (Month-Year) | Seasons | Climate Events | Sampling Station Numbers |
|---|---|---|---|---|
| 1 | January 2006 | Winter | La Niña | 51 |
| 2 | April 2006 | Spring | Normal | 52 |
| 3 | July 2006 | Summer | Normal | 52 |
| 4 | October 2006 | Autumn | El Niño | 51 |
| 5 | January 2007 | Winter | El Niño | 52 |
| 6 | April 2007 | Spring | Normal | 52 |
| 7 | July 2007 | Summer | La Niña | 52 |
| 8 | October 2007 | Autumn | La Niña | 52 |
| 9 | January 2008 | Winter | La Niña | 51 |
| 10 | July 2008 | Summer | Normal | 52 |
| 11 | January 2009 | Winter | La Niña | 52 |
| 12 | July 2009 | Summer | El Niño | 52 |
| 13 | January 2010 | Winter | El Niño | 52 |
| 14 | July 2010 | Summer | La Niña | 52 |
| 15 | January 2011 | Winter | La Niña | 52 |
| 16 | July 2011 | Summer | La Niña | 52 |
| 17 | January 2012 | Winter | La Niña | 52 |
| 18 | July 2012 | Summer | Normal | 52 |
| 19 | January 2013 | Winter | Normal | 52 |
| 20 | July 2013 | Summer | Normal | 52 |
| 21 | July 2014 | Summer | Normal | 52 |
| 22 | October 2014 | Autumn | El Niño | 38 |
| 23 | January 2015 | Winter | El Niño | 52 |
| 24 | April 2015 | Spring | El Niño | 38 |
| 25 | July 2016 | Summer | La Niña | 38 |
| 26 | November 2016 | Autumn | La Niña | 38 |
| 27 | January 2017 | Winter | Normal | 38 |
| 28 | April 2017 | Spring | Normal | 38 |
| 29 | April 2018 | Spring | La Niña | 38 |
| 30 | September 2018 | Autumn | El Niño | 37 |
| 31 | April 2019 | Spring | El Niño | 38 |
| 32 | September 2019 | Autumn | Normal | 33 |
| 33 | April 2020 | Spring | Normal | 38 |
| 34 | September 2020 | Autumn | La Niña | 35 |
| Common Name | Family | Scientific Name | Habitat | Price Category |
|---|---|---|---|---|
| Pacific rudderfish | Centrolophidae | Psenopsis anomala | Benthopelagic | Very high |
| Big-head pennah croaker | Sciaenidae | Pennahia macrocephalus | Demersal | Medium |
| Largehead hairtail | Trichiuridae | Trichiurus lepturus | Benthopelagic | High |
| Red bigeye | Priacanthidae | Priacanthus macracanthus | Reef-associated | High |
| Threadfin porgy | Sparidae | Evynnis cardinalis | Reef-associated | Very high |
| Greater lizardfish | Synodontidae | Saurida tumbil | Reef-associated | Very high |
| Brushtooth lizardfish | Synodontidae | Saurida undosquamis | Reef-associated | Very high |
| Glowbelly | Acropomatidae | Acropoma japonicum | Demersal | Unknown |
| Sulphur goatfish | Mullidae | Upeneus sulphureus | Demersal | High |
| Japanese goatfish | Mullidae | Upeneus japonicus | Demersal | High |
| Golden threadfin bream | Nemipteridae | Nemipterus virgatus | Demersal | Very high |
| Yellowbelly threadfin bream | Nemipteridae | Nemipterus bathybius | Demersal | High |
| Japanese scad | Carangidae | Decapterus maruadsi | Pelagic | Very high |
| Japanese jack mackerel | Carangidae | Trachurus japonicus | Pelagic | High |
| Indian mackerel | Scombridae | Rastrelliger kanagurta | Pelagic | Very high |
| Species | R2 | Deviance Explained (%) | GCV | Approximate Significance of Smooth Terms | ||||
|---|---|---|---|---|---|---|---|---|
| Year | Chl-a | MLD | SSS | SST | ||||
| P. anomala | 0.303 | 29.7 | 1.3052 | *** | *** | ** | *** | *** |
| P. macrocephalus | 0.259 | 32.9 | 1.8712 | *** | *** | ns | *** | *** |
| T. lepturus | 0.240 | 21.3 | 1.1757 | *** | *** | *** | ** | ns |
| P. macracanthus | 0.259 | 32.2 | 0.7861 | * | *** | *** | *** | *** |
| E. cardinalis | 0.152 | 14.8 | 1.4088 | *** | *** | *** | *** | *** |
| S. tumbil | 0.174 | 18.6 | 1.1200 | * | *** | *** | *** | *** |
| S. undosquamis | 0.228 | 24.2 | 1.0546 | *** | *** | *** | *** | *** |
| A. japonicum | 0.241 | 25.3 | 2.4356 | * | ** | *** | *** | *** |
| U. sulphureus | 0.210 | 23.2 | 1.0214 | *** | ns | *** | *** | *** |
| U. japonicus | 0.049 | 13.2 | 0.6859 | ns | ** | *** | *** | *** |
| N. virgatus | 0.287 | 32.3 | 0.8922 | *** | ** | ** | *** | *** |
| N. bathybius | 0.139 | 27.9 | 0.6002 | *** | ** | ns | *** | ** |
| D. maruadsi | 0.235 | 26.2 | 1.4142 | *** | *** | *** | *** | *** |
| T. japonicus | 0.268 | 26.6 | 1.7240 | *** | *** | *** | *** | *** |
| R. kanagurta | 0.100 | 16.3 | 0.8901 | ** | *** | * | *** | ns |
Disclaimer/Publisher’s Note: The statements, opinions and data contained in all publications are solely those of the individual author(s) and contributor(s) and not of MDPI and/or the editor(s). MDPI and/or the editor(s) disclaim responsibility for any injury to people or property resulting from any ideas, methods, instructions or products referred to in the content. |
© 2023 by the authors. Licensee MDPI, Basel, Switzerland. This article is an open access article distributed under the terms and conditions of the Creative Commons Attribution (CC BY) license (https://creativecommons.org/licenses/by/4.0/).
Share and Cite
Hong, X.; Zhang, K.; Li, J.; Xu, Y.; Sun, M.; Wang, Y.; Xu, S.; Cai, Y.; Qiu, Y.; Chen, Z. Effects of Climate Events on Abundance and Distribution of Major Commercial Fishes in the Beibu Gulf, South China Sea. Diversity 2023, 15, 649. https://doi.org/10.3390/d15050649
Hong X, Zhang K, Li J, Xu Y, Sun M, Wang Y, Xu S, Cai Y, Qiu Y, Chen Z. Effects of Climate Events on Abundance and Distribution of Major Commercial Fishes in the Beibu Gulf, South China Sea. Diversity. 2023; 15(5):649. https://doi.org/10.3390/d15050649
Chicago/Turabian StyleHong, Xiaofan, Kui Zhang, Jiajun Li, Youwei Xu, Mingshuai Sun, Yuezhong Wang, Shannan Xu, Yancong Cai, Yongsong Qiu, and Zuozhi Chen. 2023. "Effects of Climate Events on Abundance and Distribution of Major Commercial Fishes in the Beibu Gulf, South China Sea" Diversity 15, no. 5: 649. https://doi.org/10.3390/d15050649
APA StyleHong, X., Zhang, K., Li, J., Xu, Y., Sun, M., Wang, Y., Xu, S., Cai, Y., Qiu, Y., & Chen, Z. (2023). Effects of Climate Events on Abundance and Distribution of Major Commercial Fishes in the Beibu Gulf, South China Sea. Diversity, 15(5), 649. https://doi.org/10.3390/d15050649