Abstract
An analysis of archival and literary materials, as well as recently collected data in coastal areas at 14 locations in the Eurasian seas showed that the diversity of biomass-dominating key bryozoan species is low, totaling 26 species, less than 1/15 of the total bryozoan fauna richness. Their number decreases eastward from 17 species with an average total biomass of >16 g/m2 in the Barents Sea to three species with an average biomass of about 3 g/m2 in the East Siberian Sea. In the Chukchi Sea, their number and average biomass increase to 10 species and ~12 g/m2, respectively. Average biomass strongly correlates with the number of species in each sea. Furthermore, variation in biomass is significantly correlated with the composition of bottom sediments and, in some locations, with depth. The marked decrease in the number of key species along the vector from Barents→Kara→Laptev→East Siberian Sea is due to a decline in the number of boreal and boreal–Arctic bryozoans of Atlantic origin. In contrast, the appearance of boreal and boreal–Arctic Pacific species is responsible for the increase in key species in the Chukchi Sea.
1. Introduction
Bryozoans, such as polychaetes, crustaceans and molluscs, are one of the most diverse taxonomic groups of the Arctic [1], but their role in the formation of the total zoobenthos bioresources in this region of the world ocean has been a matter of contention. Some workers believe that this entire group has only patchy distributed aggregations in the Arctic seas [2,3,4,5,6,7,8]. The results of the studies conducted over a broad timeframe, however, indicate that stable mass aggregations of bryozoans have existed in the Arctic seas over a long period of time [9,10,11,12,13]. Furthermore, some workers argue that bryozoans are one of the background groups that contribute significantly to the total biomass of zoobenthos communities on the continental shelf [12,13,14,15,16,17,18]. These diametrically opposed views on the importance of bryozoans in zoobenthos communities have provided a stimulus for quantitatively assessing the distribution and abundance of bryozoans on the continental shelf of the Barents Sea [19]. Mapping of then-available data showed that an increase in the total biomass of this group tended to coincide with sea regions having bottom sediments dominated by stones, gravel, and other coarse-grained fractions, a relationship confirmed by statistical analysis [19].
It was therefore established by the early 1990s that the distribution and abundance of bryozoans in the open part of the Barents Sea is highly variable and controlled by environmental parameters [11,14]. However, insufficient information about bryozoans in the coastal regions of seas where environmental parameters undergo the most abrupt changes hindered the identification of such patterns in shallow waters.
Several expeditions conducted by the Zoological Institute of the Russian Academy of Sciences in the 1970–2000s collected data on bryozoan biomass in the coastal regions of the Eurasian seas. Some of this information has been published, but the results presented in specialized studies on bryozoans were mostly concerned with their biogeographical and species composition [20,21,22,23,24]. Some observations on the quantitative representation of this group can be found in papers dealing with descriptions of benthic communities in general [25,26,27,28,29], but this information is insufficient to identify possible causes that can explain changes in the distribution and biomass of bryozoans.
The purpose of this study was to characterize the distribution and biomass of bryozoans in the Eurasian Arctic seas based on an integrated analysis of the available archival and literature data together with recently collected biomass data from surveys conducted in the upper littoral of the coastal regions. We hypothesize that both the diversity and biomass of key bryozoan species, species represented by a biomass >1 g/m2, must decrease eastward in parallel with similar changes in species richness of the overall bryozoan fauna and that the key bryozoan species that have originated in the Atlantic are replaced by Arctic or Pacific species.
2. Materials and Methods
2.1. Study Area
The study area covered 14 coastal localities in the five seas of the Arctic, which vary in their environmental conditions [30]: Barents, Kara, Laptev, East Siberian, and Chukchi (Figure 1). Three of these locations were situated in the Barents Sea. One of these, Yarnyshnaya Bay, lies in the south-western part of the sea and is greatly influenced by Atlantic waters carried from the west with the Murmansk near-shore current [31]. Sea water temperature in this bay is normally above zero throughout the year, with surface water warming to 7–9 °C in summer while not exceeding 4–5 °C deeper in the water column. Salinity in the bay is 33.4–34.5 psu, which is close to that in the ocean [32]. Bottom sediment composition varies greatly from the mouth to the head of the bay and from the littoral to deeper areas, ranging from stony bottoms to soft silty sands (Table 1) [33].
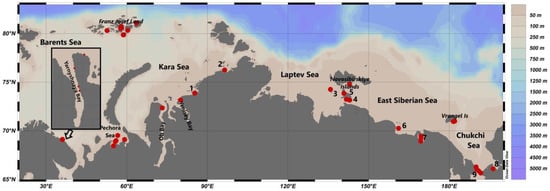
Figure 1.
Map of the study area. Sample locations indicated in red. Numbers on the map correspond to the names of locations. 1—Pyasina Bay; 2—Nordenskjold Archipelago; 3—Stolbovoy Island; 4—Large and Small Liakhovskiye Islands; 5—Bunge Land Island; 6—East Siberian Sea coastal area; 7—Chaun Bay; 8—Kotzebue Sound; 9—Bering Strait.

Table 1.
Sampling stations and environmental parameters in the study area. Sediment type: C, clay; M, mud; Ms, muddy sand; Fs, fine sand; S, sand; Sis, silt with shells; s, shells; SiS, silty sand; G, gravel; P, pebble; B, boulders; R, rock.
The second Barents Sea location is in the waters of the Franz Josef Land Archipelago (FJL), in particular off Hayes Island and the straits around it (Figure 1). Arctic waters influence this area with negative sea water temperatures throughout the year at depths below 5 m and a steady summer temperature of +2 °C in the surface water layers [30,32]. Bottom sediment composition at sampling sites varies from boulder-covered bottoms to silty sands or mixed gravel–sandy–clayey sediments in the upper littoral [25,33] (Table 1).
The third locality is in the south-eastern Barents Sea (Pechora Sea) near the mainland, in shallow waters with depths less than 27 m. It is influenced by transformed Atlantic waters desalinated by the runoff from the Pechora River and is characterized by sandy–fine-grained sandy–clayey sediments. The water is strongly mixed by winds and tidal currents. Negative temperatures persist throughout the entire water column in winter and warm to 5–8 °C during the summer [35].
Unlike the positions of the Barents Sea locations, all the Kara Sea ones are in its south. The first two are situated across the Ob’ and Yenisei gulfs with depths of up to 35 m. They are strongly affected by freshwater runoff from the Ob’ and Yenisei rivers. Consequently, the salinity in the near-bottom water layer does not exceed 21 psu [36]. The gradient of near-bottom water temperature ranges from −2 to −1 °C at depths as shallow as less than 5 m [36]. Because of the significant amount of organic and inorganic matter transported by rivers, the bottom sediments are relatively soft and consist primarily of fine-grained sand with river silt deposits [27].
The third and fourth locations are in the south-eastern part of the Kara Sea: Pyasina Bay and south of the Nordenskjold Archipelago. Coarse-grained rocks with a predominance of gravel comprise bottom sediments at both locations [33]. Water temperature gradients are similar to those in the Ob’ and Yenisei bays, but salinity is much higher and exceeds 32 psu (Table 1) [36].
The Laptev Sea includes three study areas within the Severnaya Zemlya Archipelago that have non-uniform habitats characterized by soft sandy–aleuritic deposits mixed with clay alternating with gravel–rocky ridges [26]. As in the Kara Sea, the near-bottom salinity varies greatly from 17 to 32.5 psu depending on depth and season of the year, reaching maximum values in winter [30]. Near-bottom water temperature in the southern part of the sea varies just within several degrees, ranging from −1.8 to 1 °C [30].
The habitats in the localities chosen for the East Siberian Sea are very similar to those in the Laptev Sea. They are characterized by the predominance of soft-bottom deposits alternating with coarse-grained rocks that are patchily distributed [33]. Near-bottom water temperatures usually remain subzero throughout the year, but the surface water layer in the shallow Chaun Bay sometimes warms up in summer to 10 °C. Salinity does not rise above 32 psu [37].
The combined impact of Arctic and Pacific water masses causes a greater variation in habitats across the Chukchi Sea [38] and determines the oceanographic parameters of the water column. Near-bottom temperatures in the southern localities of the Bering Strait are above zero throughout the year (3–5 °C), and salinity exceeds 32 psu. Bottom sediments are coarse grained [33]. The northern locality lies near Wrangel Island in waters that are typical of the Arctic: summer surface water temperature does not exceed 2 °C, and at depths below 5 m in summer and throughout the water column in winter, water temperature remains below zero. Salinity stays about 32 psu throughout the year. In Kotzebue Sound (Alaska Peninsula waters of the SE Chukchi Sea) and the coastal waters of the Chukchi Peninsula, the temperature regime of the coastal waters is close to that of Bering Strait, but the composition of bottom sediments varies, consisting primarily of silty sands with an admixture of stones [38].
2.2. Material
The dataset for this study was assembled from the authors’ own research, published literature [27,28,29], and from collections and data of catalogs of the Zoological Institute of the Russian Academy of Sciences (Saint Petersburg, Russia) archived from 1983 to 2014 and collected prior to the onset of steady warming of the Arctic, which began in 2010 [39]. The dataset included information on bryozoans from the 14 coastal localities in the Barents, Kara, Laptev, East Siberian, and Chukchi seas. In total, the material examined comprised 177 samples collected from 33 stations and 5 transects. Sampling depths ranged from the littoral to 55 m.
Sampling sites differed both in temperature and depth, as well as in the bottom sediment composition (Table 1). On transects, three replicates were collected at depths ranging from 5 to approximately 25 m with 0.1 m2 or 1 m2 quadrats using SCUBA with divers deployed from a rubber boat (Table 1). At the stations located far from shore (Figure 1), the material was collected from research vessels by van Veen (sampled surface: 0.1 m2) or a Russian modification of the Petersen grab called “Ocean” (sampled surface: 0.25 m2) grab samplers, or box core (sampled surface: 0.1 m2). Three replicate grab samples were taken at each station, washed through a 1 mm mesh sieve to remove the substrate, and then fixed with 4% formaldehyde in sodium tetraborate. In the laboratory, bryozoans were separated from the remaining substrate, identified, counted, weighed, and preserved in 75% ethanol. In some cases, colonies were not counted because flexible, bush-like colonies are often interlaced and clumped together in a dense mass, making their counting difficult.
Biomass was used to measure the abundance of all species. To determine biomass, bryozoans were removed from their substrate and weighed. Encrusting species firmly attached to substrates were scraped off and weighed. Bush-like bryozoans were detached at their point of attachment and weighed. All weights include colony exoskeletons. Among samples, species with a biomass >1 g/m2 were designated as key species in the bryozoan taxocenes. The number of colonies of each of these species was counted and used as a second estimate of abundance. In a few cases, colonies of matted bush-like species were interlaced, so the entire clump was treated as a single colony. The study used valid species names according to the World Register of Marine Species (WoRMS) (https://www.marinespecies.org, 20 March 2023 accessed). Information on the biogeographic affiliation of bryozoan species was taken from the literature [19,23,24,40,41].
2.3. Analytical Methods
Average total biomass, standard error (SE), and standard deviation (SD) were used to estimate variation among different seas and variation among individual masses of colonies of a species. The total average biomass of key bryozoan species in each sea was calculated as the sum of their weights among samples within a sea divided by the number of those samples. The average biomass of each key bryozoan species within each sea was calculated individually as the sum of its biomass among all locations divided by the total number of samples within a sea.
Relationships between the biomass and selected environmental variables were evaluated using the ridge multiple regression model that minimizes collinearity between the predictor variables. The analysis was performed using Statistica 6.0 (StatSoft Russia, Moscow, Russia). The Ocean data view (AWI) software package was used to draw a map of the study region.
The Chekanovsky–Sørensen similarity index (Cz) [42,43,44] was used to assess the similarity among samples using data of species presence/absence. For each resulting dendrogram, locations that were less than 50% similar were regarded as distinct. Faunistic differences were also evaluated using the pair-group method with arithmetic means [45,46,47]. Statistically significant differences (p < 0.05) within and among seas in the resulting groups of key species composition were evaluated using the one-way ANOSIM test (Primer 6) [48].
3. Results
3.1. Composition of Biomass-Ranked Key Bryozoan Species
In total, 26 bryozoan species were found in the coastal regions of the Eurasian seas, with their biomass in assemblages exceeding 1 g/m2 (Table 2). All species belong to the class Gymnolaemata, one-fifth of which are representatives of the order Ctenostomatida and lack the calcareous skeleton, while the remaining species belong to the order Cheilostomatida, whose colonies are calcified to a varying degree. The taxonomic diversity of biomass-ranked key bryozoan species ranged from three in the East Siberian Sea to 17 species in the Barents Sea (Figure 2). The diversity of key species in the regarded areas is influenced to a certain extent by the water temperature in the near-bottom layer because the correlation is very close to significant (Pearson correlation where R = 0.63; p = 0.05) (Figure 3).

Table 2.
Individual average biomass (g/m2) with standard deviation (B ± SD) and abundance (col/m2) with standard deviation (D ± SD), and biogeographic affiliation of biomass-dominating key bryozoan species within each Eurasian sea of the Arctic. A—Arctic species occurring in Arctic waters; B, At and BA, At—boreal and boreal–Arctic species of Atlantic origin occurring in the Atlantic Ocean and in the Atlantic waters in the Arctic; B, P and BA, P—boreal and boreal–Arctic species of Pacific origin occurring in Pacific Ocean and in Pacific waters in the Arctic; BA, ws—widespread boreal–Arctic species occurring in both Atlantic and Pacific Oceans.
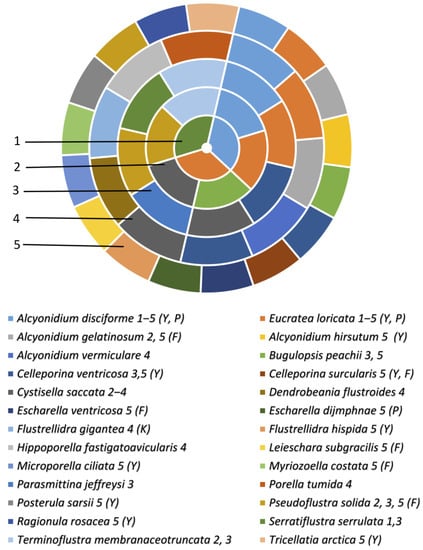
Figure 2.
Taxonomic composition of biomass-dominating key species in the coastal areas of the Eurasian Arctic seas. 1—the East Siberian Sea; 2—the Laptev Sea; 3—the Kara Sea; 4—the Chukchi Sea; 5—the Barents Sea. Letters near the species name in legend: Y—Yarnyshnaya Bay; F—Franz Josef Land area; P—Pechora Sea coastal area; K—Kotzebue Sound.
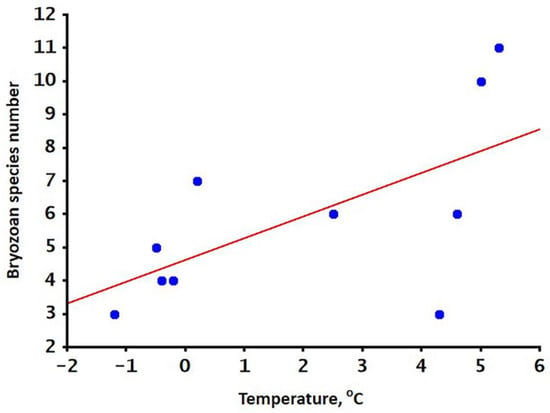
Figure 3.
Relationship between the near-bottom water temperature and the number of biomass-dominating key bryozoan species in the Eurasian Arctic seas.
The cluster analysis based on comparisons of Cz similarity indices on data of species presence/absence collected at different localities of the Barents Sea indicated the key bryozoan species composition in the south-western (Yarnyshnaya Bay), south-eastern (coastal areas of the Pechora Sea), and north-eastern (FJL) parts of this sea are distinct because the differences in similarity among them exceeded 60% (Figure 4).
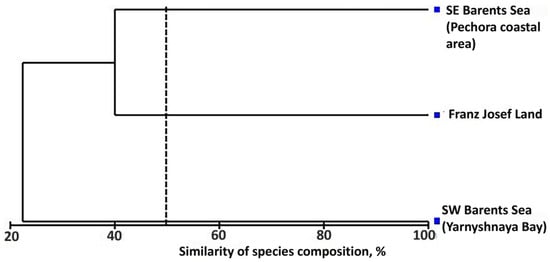
Figure 4.
Dendrogram of the similarity of the composition of biomass-dominating key bryozoan species between coastal localities within the Barents Sea. The vertical dashed line indicates 50% similarity.
Similar calculations based on such data collected in the Siberian seas and in each area of the Barents Sea (Figure 5) indicated high similarity (>50%) in key species composition in the Kara and Laptev seas and the SE Barents Sea of the study region. Therefore, these areas were united into a single group. Low similarity among the SW Barents, Franz Josef Land areas, and Chukchi and East Siberian Seas indicates distinct species composition. A statistically significant difference in key species composition between the FJL, SW Barents area, East Siberian and Chukchi seas, on the one side, and the complex of the SE Barents, Kara, and Laptev seas, on the other, was confirmed by the ANOSIM test (Global R = 0.84; p = 0.03).
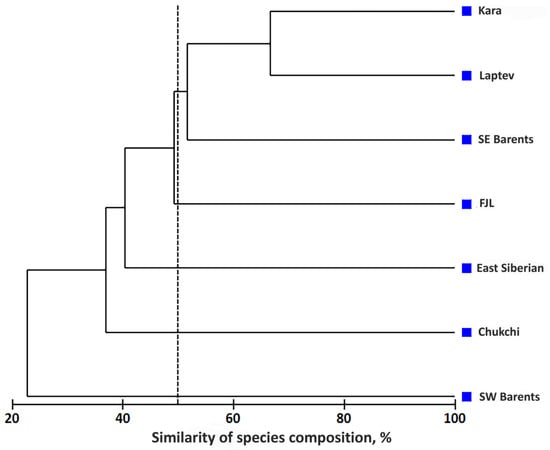
Figure 5.
Dendrogram of the similarity of the composition of biomass-dominating key bryozoan species in the coastal areas of the studied seas. The vertical dashed line indicates 50% similarity.
3.2. Biogeographic Composition of Biomass-Dominating Key Bryozoan Species
The key bryozoan species identified in this study belong to six biogeographic categories (Table 2). Some of these are autochthonous Arctic species and widely distributed boreal–Arctic species living not only in the Arctic, but also in temperate zones of the world ocean. There are also boreal–Arctic and boreal species of Atlantic origin distributed primarily in temperate latitudes of the Atlantic Ocean and in the regions influenced by the Atlantic water masses of the Arctic Basin, as well as boreal and boreal–Arctic species of Pacific origin living in the Arctic in the regions influenced by the Pacific waters.
The analysis of proportions of species with different biogeographic affinities suggests that in the Barents Sea, there is a large proportion of species of Atlantic origin, with a progressive eastward decrease in this proportion toward the Kara and then the Laptev seas. Among the key species of the Chukchi Sea, a fairly large proportion is represented by the Pacific bryozoans, while in the East Siberian Sea, these two biogeographic categories, both Atlantic and Pacific, are absent. The proportion of Arctic species increases gradually eastward from the Barents to the East Siberian Sea and then drops significantly in the Chukchi Sea (Table 2, Figure 6).
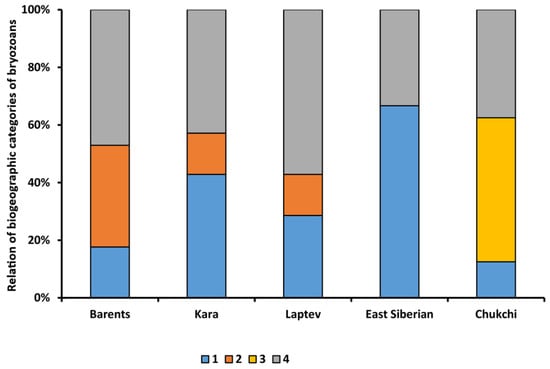
Figure 6.
Variation in the proportion of key in biomass bryozoan species of different biogeographic affiliation found in the coastal area within the study area. 1—Arctic species; 2—boreal and boreal–Arctic species of Atlantic origin; 3—boreal and boreal–Arctic species of Pacific origin; 4—widespread boreal–Arctic species.
3.3. Biomass Characteristics
The key biomass species showed fairly large variation in weights among samples within seas and in average values among seas. In the Barents Sea, the variation of this characteristic between different species was as large as two orders of magnitude ranging from 1.42 to 133.72 g/m2 (Table 2). In the Kara and Laptev seas, it differed by more than ten-fold varying from 1.09 to 17.18 g/m2, and in the East Siberian Sea, all dominant species had comparable average biomasses (1.77–5.60 g/m2). In the Chukchi Sea, variation in average individual biomasses rose again from 2.71 to 43.60 g/m2 (Table 2).
The total average biomass of all key bryozoan species calculated for each of the seas was also markedly variable ranging from 3.13 ± 2.14 to 16.67 ± 30.71 g/m2 (mean ± SE) (Figure 7). Its minimum value was observed in the East Siberian Sea, where it was comparable to that in the Laptev Sea (3.83 ± 3.24 g/m2), but in the Kara Sea the average biomass was already twice as high (6.09 ± 5.65 g/m2). The average biomass of the key species calculated for the Chukchi Sea was comparable to that in the Barents Sea, but was slightly lower (12.05 ± 2.72 g/m2).
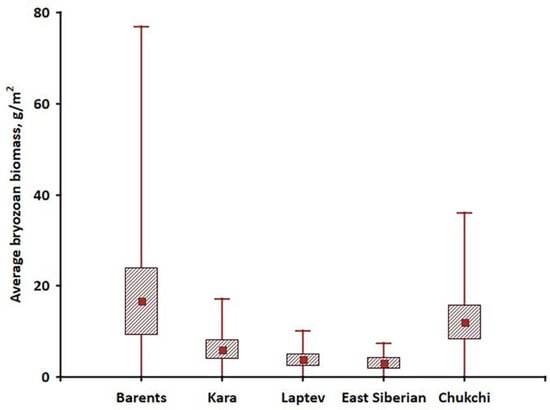
Figure 7.
Variations of average biomass of key bryozoan species in the coastal areas of the studied seas. Symbology: solid square, mean; box, standard error of the mean; capped lines, standard deviation.
The average biomass correlated fairly well with the number of key species that composed this biomass in each sea (Pearson correlation where R = 0.92; p < 0.05).
Of the environmental parameters examined in this study: depth, temperature, and grain-size distribution of bottom sediments, only the latter was a strong influence on variation in biomass for the dominant bryozoan species (Pearson correlation where R = 0.82; p = 0.03) (Figure 8). Depth and temperature did not have a significant effect on the characteristics of bryozoans in the coastal locations studied (R = 0.03; p = 0.07 and R = 0.17; p = 0.9, respectively) (Figure 9). The exception was the Pechora Sea, where the biomass showed a significant association with depth (Pearson correlation where R = 0.98; p = 0.02), a relationship that becomes only a trend for the waters around the FJL (Pearson correlation R = 0.71; p = 0.08) (Figure 9B,C).
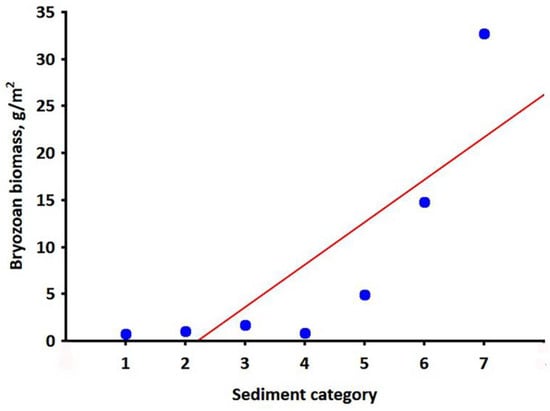
Figure 8.
Relationship between the bottom sediment composition and biomass of key bryozoan species in the coastal area of the Eurasian Arctic seas. 1—clay with sand and muddy sand; 2—silty sand and fine sand; 3—silty sand with shells; 4—sand, silt with gravel; 5—pebble, shells with mud; 6—pebble with shells and gravel with sand; 7—boulders, pebble, rocks.
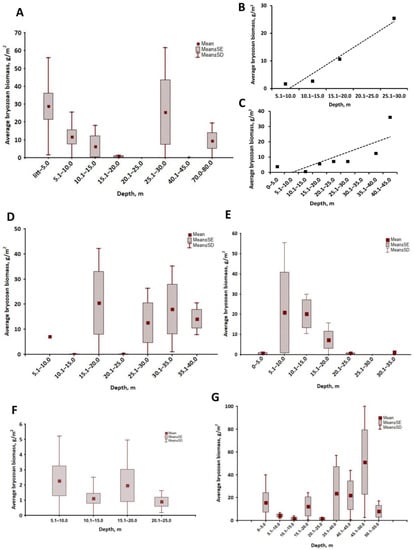
Figure 9.
Variation of total average biomass of key bryozoan species with depth in the studied areas. Barents Sea: (A)—SW (Yarnyshnaya Bay), (B)—SE (Pechora sea coastal area), (C)—NE (Franz Josef Land Archipelago area); (D)—the Kara Sea; (E)—the Laptev Sea; (F)—the East Siberian Sea; (G)—the Chukchi Sea.
4. Discussion
4.1. Diversity of Biomass-Dominating Key Bryozoan Species and Their Biogeographic Affiliation
Despite a long history of zoobenthos research in the Arctic, the faunistic composition and distribution of bryozoans in this region remain insufficiently studied, even though about 90% of the species inhabiting the seas in this region are currently known [49]. Previous studies in the Barents Sea have shown that only about 40–50 bryozoan species formed dense assemblages [19], which accounted for less than 10% of overall bryozoan species richness in the Arctic [50]. The diversity of species that contribute appreciably to the total zoobenthos biomass in the coastal waters was even much lower. Moreover, while the biomass-dominating species in the entire area of the sea comprised representatives of all orders of marine bryozoans (Cyclostomatida, Ctenostomatida, and Cheilostomatida) [19], those inhabiting the coastal areas lacked significant cyclostome assemblages.
Among the 26 biomass-dominating key species of bryozoans (with biomass exceeding 1 g/m2 in the Eurasian seas), the maximum number of species occurs in the shallow waters of the Barents Sea. In the Siberian seas, key species richness gradually decreases in parallel to that of the overall bryozoan fauna [50,51], reaching its minimum in the East Siberian Sea (three species). The Chukchi Sea, however, shows an increased number of biomass-dominating key species, again in line with a similar trend for the total species richness of the bryozoan fauna [50].
It is currently known that in the Eurasian sector of the Arctic, bryozoans are represented by two distinctly different faunistic complexes [51], and the exact composition of biomass-dominating key species is different in most seas. The exceptions are such typical Arctic seas as the Laptev and East Siberian seas, in which the composition of biomass-dominating species differs by no more than 47%. The similarity in composition of biomass-dominating key species in these seas is readily explained by similarity in habitats, in particular by the predominance of soft-bottom sediments in the coastal zone [33] together with persistent negative temperatures near the seafloor and decreased salinity [30].
Only two of the species designated as biomass-dominating key species, the Arctic Alcyonidium disciforme and the more widely distributed boreal–Arctic Eucratea loricata, form settlements with a biomass greater than 1 g/m2 in all seas of the study area. Some species, notably Alcyonidium gelatinosum, Cystisella saccata, Pseudoflustra solida, and Serratiflustra serrulata, form sufficiently dense assemblages in the shallow waters of two or three seas. However, most biomass-dominating key bryozoan species were reported from the coastal regions of only one sea.
It should be noted that dense assemblages in the coastal zone are formed both by eurybathic (for instance, the cheilostome Leieschara subgracilis, Posterula sarsi, Myriozoella costata, and Microporella ciliata, or the ctenostome Alcyonidium gelatinosum) and stenobathic forms. The latter include Alcyonidium hirsutum and Flustrellidra hispida, the obligate inhabitants of the littoral zone. It is noteworthy that differences in species composition between the biomass-dominating bryozoans were observed not only across seas, but also within a single sea. For instance, in the Barents Sea, the overlap in species composition of biomass-dominating bryozoans between different localities is less than 40%. The lack of settlements of species such as Microporella ciliata, Alcyonidium hirsutum, and Flustrellidra hispida in the northern and south-eastern parts of the seas and abundant occurrence of Myriozoella costata and Escharella ventricosa only in the shallow waters around the FJL and E. dijmphnae in the Pechora Sea are easily explainable by their different tolerance to temperature and salinity factors. The first three species are boreal in their biogeographic range and are unable to reproduce at negative water temperatures. The next two species are Atlantic boreal–Arctic in origin and reproduce successfully under a wider range of temperature regimes. However, they are very sensitive to desalination of the water column, which is typical for the Arctic water mass. E. dijmphnae belongs to the Arctic forms, which prefer lower salinities, are intolerant to temperatures higher than 4–5 °C, and reproduce at near-zero temperatures [19]. Biological requirements of each representative of the bryozoan fauna, including the presence of a short-lived lecithotrophic larva, are factors that cause a high degree of settlement aggregation of many bryozoan species. This conclusion is confirmed by observations of bryozoan settlements made in the littoral zone of the same bay at different years over a time period of 30–35 years. For instance, widely distributed E. loricata had dense settlements in Yarnyshnaya Bay both in 2014 [52] and 1982–1988 [53]. In contrast, the settlements of Alcyonidium hirsutum and Flustrellidra hispida, whose mean biomass in aggregations in the south-western part of the Barents Sea near the Kola peninsula had reached several hundred grams in the 1980s [53], were not reported in 2014 [52]. Given that the last two species belong to the boreal fauna [19], any influence of the steady warming of the Arctic that began in the 2010s [39] can be ruled out. These observations lead to the conclusion that the absence of these species in the material collected in 2014 is the result of differences in sampling, or otherwise, they have disappeared due to certain autoecological processes. It should be mentioned once again that some of the aforementioned species have aggregations that remain stable throughout a long time period. These species include Microporella ciliata, which was recorded in the south-western part of the Barents Sea, and Alcyonidium disciforme from the Pechora Sea, whose mass settlements had been found in these locations as early as the first half of the 20th century [10,11,54]. The latter species was previously categorized as dominant in the shallow-water zoobenthos communities of the Laptev Sea [55] and around the FJL [25]. In the 1970s, high biomass values were reported for A. gelatinosum in the vicinity of the FJL [25] and for Eucratea loricata near Wrangel Island (Chukchi Sea) [56]. The latter species was recently noted as biomass-dominating in the waters off West Spitsbergen [57].
The established biogeographic composition of the bryozoan fauna of the Arctic seas was formed in the geological past after the Quaternary glaciation as a result of the impact of Atlantic and Pacific waters characterized by different intensity inputs [19,51]. The observed differences in the biogeographic composition of key species in the coastal areas of regarded seas are a consequence of the preference for species with different biogeographic affiliations to water masses of a certain origin. In particular, boreal Atlantic species are found mainly in the areas of the modern influence of the Atlantic water masses and observed in the south-western part of the Barents Sea [31,32], and as this influence weakens and water masses transform by cooling, the proportion of boreal–Arctic Atlantic species with high biomass values also drops, gradually decreasing eastward to the Laptev Sea. This trend is accompanied by an increase in the proportion of Arctic elements among the biomass-dominant bryozoans; it is especially high in the shallow waters of the East Siberian Sea. In areas under the predominant influence of Arctic water masses [19,24,58], boreal species are absent. However, boreal–Arctic Atlantic species of bryozoans are still found in the coastal regions of the Kara Sea and the Laptev Seas. as well as in the Chaun Bay of the East Siberian Sea [22], where they do not form dense aggregations. In the Chukchi Sea, which is under the influence of the Pacific waters flowing into this sea across Bering Strait [37], a significant proportion of biomass-dominating species of bryozoans have a Pacific origin. Only the widely distributed boreo–Arctic species that make up about 40% of all key species do not show any propensity for waters of a certain origin. The variation in the biogeographic composition of biomass-dominating key species described in this study is predictably consistent with the trends observed for variation in the proportion of different biogeographic groups in the overall bryozoan fauna [19,23,24,57,58]. Boreal–Arctic Atlantic and Pacific species penetrated into the Siberian seas as a result of their dispersion in the geological past [50].
4.2. Biomass of Key Species
The average biomass of ctenostome bryozoan species that lack the calcareous skeleton is often one order of magnitude greater than the calcified cheilostome, a result that is mostly explained by the individual weight of the colony. For instance, in the coastal waters of the Kola Peninsula, the high biomass of the pancake-shaped colonies of A. hirsutum and F. hispida is the consequence of the high density of their colonies [53]. In contrast, the branching shrubby colonies of Alcyonidium gelatinosum and Flustrellidra gigantea that reach 15–20 cm in height and the ribbon-shaped colonies of A. vermiculare that grow up to 80 cm in height have a high biomass primarily because of their size despite the low number of colonies.
Previous studies focused on the biomass estimation of bryozoans that were conducted in the Barents Sea showed a significant variation in bryozoan biomass across this water body. The variation was statistically coupled with the structure of bottom sediments and the patchiness in the distribution of hard bottoms and mixed sediments [11,14,19]. It is the patchiness of bottom sediments and the extent of settlement aggregation of different bryozoan species that result in differences in quantitative estimations of bryozoans in different seas of the study region [2,3,4,5,6,9,10,14,15,16,17,18]. Another reason for the different reported biomass values of bryozoans in bottom communities was the use of collection tools with different surface areas. Locally aggregated assemblages of bryozoans can be efficiently sampled by grab samplers with a small area, while the use of trawls offered better chances in collecting colonies over a larger area of the seafloor covered with scattered stones and gravel.
The patchiness of bottom sediments prevented us from identifying any patterns of variation of bryozoan biomass with depth. However, in those regions that had uniform bottom sediments, such as the region located in the Pechora Sea, the relationship between the bryozoan biomass and depth was statistically significant. On the other hand, despite the apparent lack of any pattern in variation in biomass with depth, a feature common to the Siberian seas (Kara, Laptev, and East Siberian) and the south-eastern part of the Barents Sea, was a very slow growth of bryozoan colonies at depths of 0 to 5 m, where the seafloor is dominated by silty–clay sediments and water that contains a high concentration of inorganic particles due to the intensive erosion of the coastal permafrost [33,59]. The first factor limits the availability of substrates suitable for attachment, while the second has an adverse effect on the filter-feeding tentacular apparatus of bryozoans and inflicts injuries to the tentacles. These observations support the conclusion that depth is likely a secondary influence that indirectly affects bryozoan biomass through the structure of bottom sediments and some other factors such as water turbidity.
The average bryozoan biomass for the coastal regions was more than five times as great as the average biomass of this group previously reported for the open part of the Barents Sea [60]. This supports the idea that the proportion of bryozoans in the total zoobenthos biomass for the coastal regions can be much higher than the same proportion for the entire sea, which was previously reported to be approximately 4% [60].
It is currently impossible to determine the position that the bryozoans occupy among other biomass-forming groups of the zoobenthos in the coastal zone of the Siberian seas because of the lack of quantitative data in the literature [5,6,7,8]. The contribution of bryozoans to the total zoobenthos biomass in this region is probably even lower than is currently estimated, because the average bryozoan biomass is one order of magnitude lower there than in the Barents Sea.
A lower average bryozoan biomass in the coastal regions of the Siberian seas compared to the Barents and Chukchi Seas is the consequence of their harsher environmental conditions [30,36,37,59]. Subzero temperatures in the near-bottom water layer and a lower salinity, together with the predominance of fine-grained fractions in the bottom sediments of the Siberian seas, result in a decrease in the diversity of species dominating in biomass. This decline is a consequence of the elimination of less tolerant bryozoan species in this region of the Arctic and the lower rates of colony growth in widely tolerant bryozoans [19].
5. Conclusions
An integrated quantitative study of large-scale variation in bryozoan biomass in the Eurasian seas allowed the assessment of the distribution of dominant species, i.e., key biomass species, in the coastal zone of this Arctic region. It was shown that as the influence of Atlantic and Pacific waters weakens, boreal species are excluded from the fauna, and the density of colonies of Atlantic and Pacific boreal–Arctic bryozoans become lower. This is likely due to the limitation of their growth rates leading also to the decline in the diversity of key species. This brings about a decrease in the individual average biomass of each species and more generally in the average biomass of the whole group. Lower average biomass values in the coastal zone of the Siberian seas are directly related to the increase in the proportion of soft-bottom sediments in this region (Figure 10). The correspondence of bryozoan species with Atlantic and Pacific origin to the expansion of Atlantic and Pacific water masses in the geological past, respectively, indicates their relatively recent occupation of the studied seas.
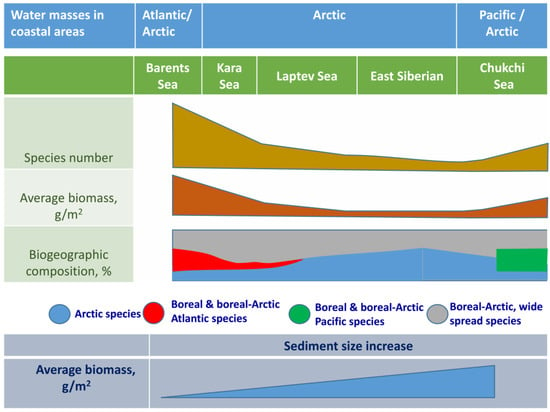
Figure 10.
Integrated scheme of large-scale variations of diversity among biomass-dominating key bryozoan species in the Eurasian Arctic Seas.
Author Contributions
Conceptualization, N.V.D.; data curation, N.V.D. and S.G.D.; formal analysis, N.V.D. and S.G.D.; methodology, N.V.D. and S.G.D.; project administration, N.V.D.; software, N.V.D. and S.G.D.; validation, N.V.D. and S.G.D.; visualization, N.V.D. and S.G.D.; writing—original draft, N.V.D.; writing—review and editing, N.V.D. and S.G.D. All authors have read and agreed to the published version of the manuscript.
Funding
This study was funded by the Ministry of Science and Higher Education of the Russian Federation (project ‘Taxonomy, biodiversity and ecology of invertebrates in Russian and adjacent waters of the World Ocean, continental water bodies and humid areas’ № 122031100275-4).
Institutional Review Board Statement
Not applicable.
Informed Consent Statement
Not applicable.
Data Availability Statement
The data are available on request from the corresponding author.
Acknowledgments
We are grateful to the employees of the Zoological Institute of RAS for their help in collecting some of the samples. We thank T. Trott and the reviewers for the thoughtful comments that improved the manuscript.
Conflicts of Interest
The authors declare no conflict of interest.
References
- Jørgensen, L.L.; Archambault, P.; Blicher, M.; Denisenko, N.; Guðmundsson, G.; Iken, K.; Roy, V.; Sørensen, J.; Anisimova, N.; Behe, C.; et al. Benthos. In State of the Arctic Marine Biodiversity; Barry, T., Price, C., Olsen, M., Christensen, T., Frederiksen, M., Eds.; Conservation of Arctic Flora and Fauna International Secretariat: Akureyri, Iceland, 2017; pp. 85–107. [Google Scholar]
- Brotskaya, V.F.; Zenkevich, L.A. Quantitative distribution of the bottom fauna of the Barents Sea. Proc. VNIRO 1939, 4, 3–150. (In Russian) [Google Scholar]
- Filatova, Z.F.; Zenkevich, L.A. Quantitative distribution of the bottom fauna of the Kara Sea. Trans. All Union Hydrobiol. Soc. 1957, 8, 3–62. (In Russian) [Google Scholar]
- Sirenko, B.I.; Bluhm, B.; Iken, K.; Crane, K.; Gladish, V. Some results of investigations of composition and quantitative distribution of epifauna in the Chukchi Sea. In Ecosystems and Biological Resources of the Chukchi Sea and Adjacent Areas; Sirenko, B.I., Ed.; Explorations of the Fauna of the Seas; ZIN RAS Press: St. Petersburg, Russia, 2009; Volume 64, pp. 200–212. [Google Scholar]
- Denisenko, S.G.; Sirenko, B.I.; Gagaev, S.Y.; Petriashhov, V.V. Bottom communities structure and spatial distribution in the East Siberian Sea at depth more than 10 m. In Fauna of the East Siberian Sea, Distribution Patterns and Structure of Bottom Communities; Sirenko, B.I., Denisenko, S.G., Eds.; Explorations of the Fauna of the Seas; ZIN RAS Press: St Petersburg, Russia, 2010; Volume 66, pp. 130–143. (In Russian) [Google Scholar]
- Galkin, S.V.; Vedenin, A.A. Macrobenthos of the Yenisey Bay and adjacent Kara Sea shelf. Oceanology 2015, 55, 668–676. [Google Scholar]
- Vedenin, A.A.; Galkin, S.V.; Kozlovskiy, V.V. Macrobenthos of the Ob Bay and adjacent Kara Sea shelf. Polar Biol. 2015, 38, 829–844. [Google Scholar] [CrossRef]
- Denisenko, S.G.; Grebmeier, J.M.; Cooper, L.W. Assessing bioresources and standing stock of zoobenthos (key species; high taxa; trophic groups) in the Chukchi Sea. Oceanography 2015, 28, 146–157. [Google Scholar] [CrossRef]
- Kuznetsov, V.V. Dynamic of the biocenosis of Microporella ciliata (Pallas) in the Barents Sea. Proc. Zool. Inst. USSR Ac. Sci. 1941, 7, 114–139. (In Russian) [Google Scholar]
- Zenkevich, L.A. Quantitative estimation of the bottom fauna of the Pechora region of the Barents and White Seas. Proc. Float. Mar. Sci. Inst. 1927, 2, 3–64. (In Russian) [Google Scholar]
- Denisenko, N.V. Structure and distribution of the bryozoan fauna of the south–eastern part of the Barents Sea. In Biogeocenoses of Glacial Shelfs of Western Arctic; Matishov, G.G., Tarasov, G.A., Denisenko, S.G., Galaktionov, K.V., Eds.; KSC RAS Press: Apatity, Russia, 1996; pp. 224–237. (In Russian) [Google Scholar]
- Denisenko, N.V. Fauna of bryozoans of Cheshskaya Bay: Its structure and distribution. In Current Benthos of the Barents and Kara Seas; Matishov, G.G., Denisov, V.V., Chinarina, A.D., Mitina, E.G., Anisimova, N.A., Eds.; KSC RAS Press: Apatity, Russia, 2000; pp. 203–219. (In Russian) [Google Scholar]
- Denisenko, N.V. Bryozoans (Bryozoa) of Yarnyshnaya Bay (Eastern Murman): Fauna, distribution, seasonal changes. In Current Benthos of the Barents and Kara Seas; Matishov, G.G., Denisov, V.V., Chinarina, A.D., Mitina, E.G., Anisimova, N.A., Eds.; KSC RAS Press: Apatity, Russia, 2000; pp. 219–227. (In Russian) [Google Scholar]
- Denisenko, N.V.; Denisenko, S.G.; Lehtonen, K.K.; Andersin, A.-B.; Sandler, H.R. Zoobenthos of the Cheshskaya Bay (southeastern Barents Sea): Spatial distribution and community structure in relation to environmental factors. Pol. Biol. 2007, 30, 735–746. [Google Scholar] [CrossRef]
- Filatova, Z.A. Quantitative estimation of the bottom fauna of the south–western part of the Barents Sea. Proc. PINRO 1938, 2, 3–58. (In Russian) [Google Scholar]
- Idelson, M. Materials on quantitative estimations of the bottom fauna of the Spitzbergen Bank (Barents Sea). Proc. Mar. Sci. Inst. 1938, 4, 27–46. (In Russian) [Google Scholar]
- Zatsepin, V.I. Communities of the bottom fauna of the Murman Coast of the Barents Sea. Part 2. Proc. All Union Hydrobiol. Soc. USSR 1962, 12, 245–344. (In Russian) [Google Scholar]
- Pergament, T.S. Benthos distribution in coastal zone of the Eastern Murman. Proc. Murmansk Mar. Station ZIN Ac. Sci. USSR 1957, 3, 75–89. (In Russian) [Google Scholar]
- Denisenko, N.V. Distribution and Ecology of Bryozoans of the Barents Sea; KSC RAS Press: Apatity, Russia, 1990. (In Russian) [Google Scholar]
- Androsova, E.I. Bryozoans (Bryozoa) in biocenoses of the Arctic Ocean (in the Franz Josef Land Archipelago area). In Biocenoses of Shelf of Franz Josef Land and Adjacent Waters; Golikov, A.N., Ed.; Explorations of the Fauna of the Seas; Nauka: Leningrad, Russia, 1977; Volume 14, pp. 194–204. (In Russian) [Google Scholar]
- Gontar, V.I. Bryozoans (Bryozoa) of the Laptev Sea and New Siberian Shoals. In Ecosystems of the New Siberian Shoals and Fauna of the Laptev Sea and Adjacent Waters of the Arctic; Golikov, A.N., Ed.; Explorations of the Fauna of the Seas; Nauka: Leningrad, Russia, 1990; Volume 37, pp. 130–138. (In Russian) [Google Scholar]
- Gontar, V.I. Distribution and ecology of bryozoans (Bryozoa) of Chaun Bay of the East Siberian Sea. In Ecosystems, the Flora and Fauna of Chaun Bay of the East Siberian Sea. Part 1; Golikov, A.N., Ed.; Explorations of the Fauna of the Seas; ZIN RAS Press: St Petersburg, Russia, 1994; Volume 47, pp. 144–147. (In Russian) [Google Scholar]
- Denisenko, N.V. Bryozoans of the Chukchi Sea and Bering Strait. In Fauna and Zoogeography of Benthos of the Chukchi Sea; Sirenko, B.I., Vasilenko, S.V., Eds.; Explorations of the Fauna of the Seas; ZIN RAS Press: St Petersburg, Russia, 2008; Volume 61, pp. 163–198. (In Russian) [Google Scholar]
- Denisenko, N.V. Bryozoans (Bryozoa) of the East Siberian Sea. In Fauna of the East Siberian Sea, distribution Patterns and Structure of Bottom Communities; Sirenko, B.I., Denisenko, S.G., Eds.; Explorations of the Fauna of the Seas; ZIN RAS Press: St Petersburg, Russia, 2010; Volume 66, pp. 89–129. (In Russian) [Google Scholar]
- Golikov, A.N.; Averintsev, V.G. Biocenoses of the upper regions of the shelf of the Franz Josef Land Archipelago and some regularities of their distribution. In Biocenoses of the Shelf of Franz Josef Land and the Fauna of Adjacent Waters; Golikov, A.N., Ed.; Explorations of the Fauna of the Seas; Nauka: Leningrad, Russia, 1985; Volume 14, pp. 5–54. (In Russian) [Google Scholar]
- Golikov, A.N.; Scarlato, O.A.; Averitsev, V.G.; Menshutkina, T.V.; Novikov, O.K.; Sheremetevsky, A.M. Ecosystems of the New Siberian Shoals, their distribution and function. In Ecosystems of the New Siberian Shoals and fauna of the Laptev Sea and Adjacent Waters of the Arctic; Golikov, A.N., Ed.; Explorations of the Fauna of the Seas; Nauka: Leningrad, Russia, 1990; Volume 37, pp. 4–79. (In Russian) [Google Scholar]
- Golikov, A.N.; Gagaev, S.Y.; Galtsova, V.V.; Golikov, A.A.; Dunton, K.; Menshutkina, T.V. Ecosystems and the flora and fauna of the Chaun Bay of the East–Siberian Sea. In Ecosystems, the Flora and Fauna of Chaun Bay of the East Siberian Sea. Part 1; Golikov, A.N., Ed.; Exploration of the Fauna of the Seas; ZIN RAS Press: St Petersburg, Russia, 1994; Volume 47, pp. 4–110. (In Russian) [Google Scholar]
- Golikov, A.N.; Anisimova, N.A.; Golikov, A.A.; Denisenko, N.V.; Kaptilina, T.V.; Menshutkin, V.V.; Menshutkina, T.V.; Novikov, O.K.; Panteleyeva, N.N.; Frolova, E.A. Bottom Communities and Biocenoses of the Yarnishnaya Inlet of the Barents Sea and Their Seasonal Dynamics; KSC RAS Press: Apatity, Russia, 1993. (In Russian) [Google Scholar]
- Luppova, E.N.; Anisimova, N.A.; Denisenko, N.V.; Frolova, E.A. The bottom biocenoses of Franz Josef Land. In The Environment and Ecosystems of Franz Josef Land (Achipelago and Shelf); Matishov, G.G., Ed.; KSC RAS Press: Apatity, Russia, 1993; pp. 118–142, (Translated into English). [Google Scholar]
- Dobrovolsky, A.D.; Zalogin, B.S. Seas of the USSR; Moscow State University Press: Moscow, Russia, 1982. (In Russian) [Google Scholar]
- Loeng, H. Features of the physical oceanographic conditions of the Barents Sea. Pol. Res. 1991, 10, 5–18. [Google Scholar] [CrossRef]
- Pisarev, S.V. Review of oceanographic condition of the Barents Sea. In System of the Barents Sea; Lisitsyn, A.P., Ed.; GEOS: Moscow, Russia, 2021; pp. 153–166. (In Russian) [Google Scholar]
- Kosheleva, V.A.; Yashin, D.S. Bottom Sediments of the Arctic Seas of Russia; VNII Oceangeologia Press: St Petersburg, Russia, 1999. (In Russian) [Google Scholar]
- Feder, H.M.; Jewett, S.C. Survey of the Epifaunal Invertebrates of Northern Sound, Southeastern Chukchi Sea, and Kotzebue Sound; Report of Institute of Marine Science No R78–1; University of Alaska Press: Fairbanks, AK, USA, 1978. [Google Scholar]
- Adrov, N.M.; Denisenko, G.S. Oceanographic characteristics of the Pechora Sea. In Biogeocenoses of Glacial Shelf of the Western Arctic Seas; Matishov, G.G., Tarasov, G.A., Denisenko, S.G., Denisov, V.V., Galaktionov, K.V., Eds.; KSC RAS Press: Apatity, Russia, 1996; pp. 166–179. (In Russian) [Google Scholar]
- Burenkov, V.I.; Vasilkov, A.P. The influence of runoff from land on the distribution of hydrologic characteristics of the Kara Sea. Oceanology 1994, 34, 591–599. [Google Scholar]
- Dudarev, O.V.; Semiletov, I.P.; Charkin, A.N.; Botsul, A.I. Deposition settings on the continental shelf of the East Siberian Sea. Trans. RAS 2006, 409, 822–827, (Translated into English). [Google Scholar] [CrossRef]
- Pisareva, M.N.; Pickart, R.S.; Iken, K.; Ershova, E.A.; Grebmeier, J.M.; Cooper, L.W.; Bluhm, B.A.; Nobre, C.; Hopcroft, R.R.; Hu, H.; et al. The relationship between patterns of benthic fauna and zooplankton in the Chukchi Sea and physical forcing. Oceanography 2015, 28, 68–83. [Google Scholar] [CrossRef]
- Karsakov, A.L.; Borovkov, V.A.; Sentyabov, E.V.; Ivshin, V.A.; Balyakin, G.G.; Abolmasova, Z.V. Oceanographic conditions in the sea of the North European basin and North Atlantic in 2014–2015 and their influence on distribution of commercially important fishes. In Environmental Conditions of Aquatic Biological Resources: Characteristics of Oceanographic Conditions in 2014–2015 in the Major Harvesting Areas of the Russian Fleet Operation; Trans. Russ. Federal Inst. Fish. Oceanogr.; VNIRO Press: Moscow, Russia, 2016; Volume 164, pp. 5–21. (In Russian) [Google Scholar]
- Gontar, V.I.; Denisenko, N.V. Arctic Ocean bryozoans. In The Arctic Seas. Climatology, Oceanography, Geology, and Biology; Herman, Y., Ed.; Van Nostrand Reinhold: New York, NY, USA, 1989; pp. 341–372. [Google Scholar]
- Denisenko, N.V.; Blicher, M.E. Bryozoan diversity, biogeographic patterns, and distribution in Greenland waters. Mar. Biodivers. 2021, 51, 73. [Google Scholar] [CrossRef]
- Czekanowski, J. Zur differential Diagnose der Neandertalgruppe. Korresp. Dtsch. Ges. Anthropol. 1909, 40, 44–47. [Google Scholar]
- Sørensen, T.A. A new method of establishing groups of equal amplitude in plant sociology based on similarity of species content and its application to analysis of vegetation on Danish commons. Kogelige Dan. Selsk. Biol. Skr. 1948, 622, 1–34. [Google Scholar]
- Magurran, A. Measuring Biological Diversity; Blackwell Publishing: Oxford, UK, 2004. [Google Scholar]
- Pesenko, Y.A. Rules and Methods of Quantitative Analyses in Faunistic Investigations; Nauka: Moscow, Russia, 1982. (In Russian) [Google Scholar]
- Pielou, E.C. The Interpretation of Ecological Data; John Wiley and Sons Inc.: New York, NY, USA, 1984. [Google Scholar]
- Gray, J.S.; Elliott, M. Ecology of Marine Sediments: Science to Management, 2nd ed.; Oxford University Press: London, UK, 2009. [Google Scholar]
- Clarke, K.R.; Warwick, R.M. Changes in Marine Communities: An Approach to Statistical Analysis and Interpretation, 2nd ed.; PRIMER-E: Plymouth, UK, 2001. [Google Scholar]
- Denisenko, N.V. Species richness and the level of knowledge of the bryozoan fauna of the Arctic region. Proc. Zool. Inst. Russ. Ac. Sci. 2020, 324, 353–363. [Google Scholar] [CrossRef]
- Denisenko, N.V. Species richness and distribution patterns of bryozoans of the Arctic region: List of bryozoan fauna. In Annals of Bryozoology 7: Aspects of History of Research of Bryozoans; Wyze Jackson, P.N., Spenser Jones, M.E., Eds.; International Bryozoology Association: Dublin, Ireland, 2022; pp. 121–143. [Google Scholar]
- Denisenko, N.V. Taxonomic structure and endemism of the bryozoan fauna in the Arctic region. Paleont. J. 2022, 56, 774–792. [Google Scholar] [CrossRef]
- Evseeva, O.Y.; Ishkulova, T.G.; Dvoretsky, A.G. Environmental drivers of an intertidal bryozoan community in the Barents Sea: A case study. Animals 2022, 12, 552. [Google Scholar] [CrossRef] [PubMed]
- Denisenko, N.V. Species composition and distribution of bryozoans in intertidal zone of some inlets of the Eastern Murman. In Benthos of the Barents Sea. Distribution, Ecology and Population Structure; Semenov, V.N., Averintsev, V.G., Galaktionov, K.V., Eds.; Kola Branch AS USSR Press: Apatity, Russia, 1984; pp. 71–79. (In Russian) [Google Scholar]
- Denisenko, S.G.; Denisenko, N.V.; Lehtonen, K.K.; Andersin, A.-B.; Laine, A.O. Macrozoobenthos of the Pechora Sea (SE Barents Sea): Community structure and spatial distribution in relation to environmental conditions. Mar. Ecol. Prog. Ser. 2003, 258, 109–123. [Google Scholar] [CrossRef]
- Petryashov, V.V.; Golikov, A.A.; Schmidt, M.; Rachor, E. Macrozoobenthoc of the Laptev Sea shelf. In Fauna and Ecosystems of the Laptev Sea and Adjacent Deep–Water Areas of the Arctic Basin. Part I; Sirenko, B.I., Ed.; Explorations of the Fauna of the Seas; ZIN RAS Press: St Petersburg, Russia, 2004; Volume 54, pp. 9–27. (In Russian) [Google Scholar]
- Golikov, F.N.; Sirenko, B.I.; Petriashev, V.V.; Gagaev, S.Y. Distribution of bottom communities in the Chukchi Sea from results of diving investigations. In Ecosystems and Bioresources of the Chukchi Sea and Adjacent Areas; Sirenko, B.I., Ed.; Explorations of the Fauna of the Seas; ZIN RAS Press: St Petersburg, Russia, 2009; Volume 64, pp. 56–62. (In Russian) [Google Scholar]
- Evseeva, O.Y.; Dvoretsky, A.G. Shallow–water bryozoan communities in a glacier fjord of West Svalbard; Norway: Species composition and effects of environmental factors. Biology 2023, 12, 185. [Google Scholar] [CrossRef]
- Denisenko, N.V. Bryozoans of the Kara Sea: Species diversity, changes, and peculiarities of biogeographic composition. Proc. Zool. Inst. Russ. Acad. Sci. 2021, 325, 217–234. (In Russian) [Google Scholar] [CrossRef]
- Prischepa, B.F. (Ed.) Ecosystem of the Kara Sea; PINRO Press: Murmansk, Russia, 2008. (In Russian) [Google Scholar]
- Denisenko, S.G. Biodiversity and Bioresources of Macrozoobenthos in the Barents Sea: Structure and Long–Term Changes; Nauka: St Petersburg, Russia, 2013. (In Russian) [Google Scholar]
Disclaimer/Publisher’s Note: The statements, opinions and data contained in all publications are solely those of the individual author(s) and contributor(s) and not of MDPI and/or the editor(s). MDPI and/or the editor(s) disclaim responsibility for any injury to people or property resulting from any ideas, methods, instructions or products referred to in the content. |
© 2023 by the authors. Licensee MDPI, Basel, Switzerland. This article is an open access article distributed under the terms and conditions of the Creative Commons Attribution (CC BY) license (https://creativecommons.org/licenses/by/4.0/).