Abstract
Land use changes by humans have eliminated more than half of the wetlands in Florida over the last 200 years, and additional losses are anticipated as a consequence of climate change and ongoing development activities that will accommodate a rapidly growing human population. Both spell danger for the biodiversity and ecosystem services in Florida, and data are needed to inform conservation priorities and actions concerning threatened or endangered wetland species. We modeled the projected distribution of an endangered epiphyte native to the forested wetlands in South Florida, Guzmania monostachia (Bromeliaceae), in response to changing climate and sea level conditions. We constructed ecological niche models (ENMs) under the present framework by using georeferenced occurrence points and projected them into the past and future under different scenarios. Our future climate-based ENMs predicted small losses in suitable habitat for G. monostachia in South Florida, with expansions into higher latitudes due to the warmer climate. In contrast, the models predicted a considerable, although non-detrimental, loss of suitable habitat due to rising sea levels. The combined results suggest that human activity is and will remain the largest threat to G. monostachia in Florida, and conservation efforts should focus on preserving existing habitats that will remain above sea level and explore possibilities for assisted migration.
1. Introduction
The wetlands of Florida are species-rich and home to a variety of rare and charismatic plant and animal species, including the locally endangered Guzmania monostachia (L.) Rusby ex Mez (West Indian tufted airplant). Unfortunately, over half of the original wetlands in Florida have already been lost to dramatic land use changes made by humans, and both anthropogenic climate change and rapidly growing human populations threaten additional losses to wetland biodiversity throughout the state. Given its already significantly contracted distribution, the risk of permanently losing the genetic diversity found within a few remaining, isolated populations of G. monostachia in Florida is dangerously high. Thus, it is imperative that we understand the potential factors that may contribute to additional habitat losses, as well as ecological or microclimate changes within the existing habitats where G. monostachia persists. This information will help identify critical areas for preservation and inform meaningful policies and practices for the conservation of G. monostachia now and into the distant future.
1.1. Guzmania monostachia in Florida
Guzmania is a member of the Bromeliaceae, a neotropical plant clade consisting of ca. 3140 species from 8 major lineages [1]. The group is placed in the Tillandsioideae, the largest clade within Bromeliaceae, which has an estimated stem age of 15.4 Ma and a proposed Andean origin [2,3]. In comparison to other Guzmania, G. monostachia has the broadest distribution, with populations in northern South America, Central America, the Caribbean, and South Florida [3]. Florida is home to 16 bromeliad species, all of which belong to the Tillandsioideae. Specimen records and historical observations suggest that many of these epiphytes were common throughout the forested freshwater wetlands of South Florida, where they thrived on the humid conditions and trees characterizing these habitats. However, bromeliads in South Florida have experienced rapid population declines recently due to human-related impacts such as habitat loss, poaching, and extensive damage by an invasive bromeliad-eating weevil from Mexico, Metamasius callizona Chevrolat, whose presence in Florida was first documented in 1989. Within its native range, M. callizona is known mainly as an occasional pest in shaded greenhouses, and observations of infestations on naturally occurring bromeliads are sparse [4]. In contrast, infestations on naturally occurring bromeliads in South Florida are common, and damage to individual plants is also more severe [5]. It is unclear why impacts to Floridian bromeliad populations have been so extensive, although a biological agent (e.g., a parasitoid wasp) may control populations of M. callizona within its native range [6].
Despite its inclusion on the Endangered and Threatened Species List for Florida, endangered conservation status, and rapidly declining plant numbers [7,8], basic research on G. monostachia is surprisingly lacking. Florida-based populations represent the northernmost limit of the species’ distribution range, but their evolutionary origin is unknown. Also lacking is information about the genetic identity, diversity, and population structure of the remaining populations and how these characteristics compare with those of other populations in the Americas and Caribbean. Morphological and observation-based evidence, including the close proximity of the gynoecium and androecium within a largely closed corolla, muted bract coloration, and apparent lack of pollinator visitation [9], suggests that Floridian plants may be exclusively autogamous and, consequently, genetically distinct, whereas outcrossing individuals with brighter flower color and hummingbird-mediated pollination have been observed in South America [10,11]. Autogamous breeding systems lead to reduced genetic diversity through inbreeding, increasing a population’s susceptibility to pests, pathogens, or environmental disturbances—for example, those resulting from climate change [12].
1.2. History of Ecosystems in Modern-Day Florida and Threats to Bromeliad Habitats
Florida is situated atop the shallow Florida Platform [13], a flat geological feature that includes the emergent portion that we currently recognize as the Florida peninsula, and a submerged portion known as the West Florida Escarpment, which extends westward by more than 160 km into the Gulf of Mexico from the modern-day coastline. The Florida Platform is composed primarily of limestone that was deposited by carbonate-producing marine organisms during the Mesozoic (190–66 Ma; [14]). During the Miocene (~23 Ma ago), a portion of the Florida platform was exposed by lower sea levels, allowing silica-based sediments from the eroding Appalachian Mountains to flow southward onto the newly exposed limestone [15]. The fluctuating sea levels that occurred from the Miocene to the present day (~23 Ma ago to present) further affected sediment deposition processes, with submerged and newly exposed areas accumulating more carbonate and sediment, respectively. Roughly one-third to one-half of the Florida Platform is above sea level today, but the extent of the emergent portion has varied through time as a result of changing climate and oceanographic events [13], shaping both its geological form and biota. The superposition of climatic events, global sea level dynamics, and changing soil composition across the Florida Platform contributed to major transitions in environments, affecting species compositions and ranges in space and time, as well as increases and decreases in the areas of suitable habitats.
Florida is the only state in the continental United States (US) that is characterized by subtropical ecosystems, and 17% of its wildlife species do not occur in other states [16]. Thus, Florida harbors unique biodiversity and habitats that are vital to conserve. In particular, the wetlands of Florida have great ecological importance, providing habitat for numerous plant and animal species, sequestering carbon, removing pollutants from flowing water, and mitigating potential flooding to surrounding areas by acting as sinks [17]. Despite their significance, these habitats have sustained considerable damage inflicted by humans. From 1780 to 1980, Florida lost 9.3 million acres of wetlands—the largest loss in the USA. Currently, Florida has only 54% of its original wetland coverage remaining [18], with losses primarily caused by the draining and filling of wetlands for agricultural land and urban development.
In addition to areas lost to human development activities, many remaining wetlands across Florida are significantly altered. The plant community composition of wetlands is heavily dependent on hydrologic regimes [19], and the draining and filling of some regions can drastically affect wetlands elsewhere in the state [20]. Climate change also has the potential to alter hydrologic regimes, perhaps with drastic consequences. For example, under various climate models, mean annual precipitation is expected to decrease in the Everglades, leading to drier conditions and a shift away from plant communities that depend on deeper and longer flooding periods [21].
In Florida, G. monostachia inhabits primarily two types of ecosystems: pop ash/pond apple sloughs on the west coast and tropical hardwood hammocks on the east coast (Figure 1). Pop ash/pond apple sloughs are wetland ecosystems that are unique to South Florida and dominated by Fraxinus caroliniana Mill. (pop ash) and Annona glabra (L.) (pond apple). These ecosystems are characterized by long hydroperiods of deep water and mucky soil [22]. Tropical hardwood hammocks are densely vegetated with evergreen tropical trees, including Bursera simaruba (L.) Sarg. (gumbo limbo), Coccoloba diversifolia Jacq. (pigeon plum), and Quercus virginiana Mill. (southern live oak), and they support a wide variety of epiphytes, including bromeliads and orchids. These hardwood hammocks are relatively small and disjunct, perched on limestone outcrops elevated by at least one meter above the surrounding valleys, and characterized by shallow soils [23]. In Florida, these hammocks are found as far north as Martin County, near Lake Okeechobee, but occur primarily in the south, from northern Miami-Dade County through the Everglades, along the Miami Rock Ridge, and the southern portion of the geological formation known as the Atlantic Coastal Ridge [24].
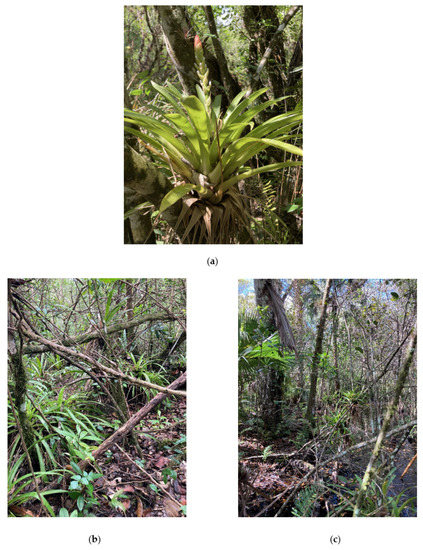
Figure 1.
Guzmania monostachia (a) in a tropical hardwood hammock habitat (b) and pop ash/pond apple slough (c).
Currently, six distinct populations of G. monostachia are known from five areas in Florida, and these populations are largely fragmented and disjunct (Figure 2). The area with the largest abundance of G. monostachia is the Fakahatchee Strand State Preserve, which is located in Collier County in southwest Florida. This preserve encompasses numerous pop ash/pond apple sloughs that host populations of G. monostachia. Prior to the introduction of M. callizona, the total estimated number of G. monostachia in Fakahatchee Strand exceeded 2 million individuals. However, only half that number are estimated to exist within the preserve today. Additionally, the preference of M. callizona for larger plants has led to a drastic shift in population demographics; the proportion of reproductively mature individuals within the population has been reduced from roughly 50% to only 10–20% today [25]. Adjacent to and east of the Fakahatchee Strand is Big Cypress National Preserve. The latter is home to two highly disjunct populations of G. monostachia, which are located at the extreme north and south ends of the preserve, respectively, and with nearly 2900 km2 of land between them. The northern population consists of roughly 200 individuals and is found within a drier pop ash/pond apple slough habitat that also contains cypress, whereas the southern population comprises approximately 1000 individuals and inhabits a more traditional pop ash/pond apple slough. A fourth area that includes G. monostachia is the Everglades National Park, which is home to a single population. The population is located on the east side of the park, within a tropical hardwood hammock that is only approximately 150 m in diameter. In stark contrast to the Fakahatchee Strand and Big Cypress populations, this population is currently in critical condition and includes only three individuals. The remaining populations are located in Fuchs and Meissner Hammock Preserve. These contiguous areas are located on the outskirts of Homestead and are surrounded by agricultural land and suburban housing. The larger Fuchs Hammock, which is historically known as Sykes Hammock, includes only three individuals of G. monostachia, while two individuals are present in the Meissner Hammock.
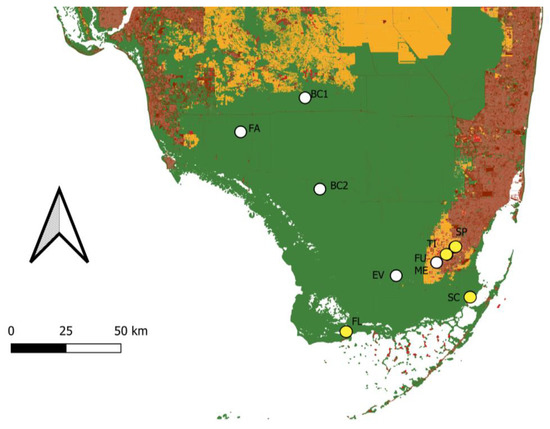
Figure 2.
Land cover map of south Florida with general localities of known populations of Guzmania monostachia. White points are populations that are still present. Yellow points are populations that have been extirpated. Areas in green are natural lands. Areas in orange are agricultural lands. Areas in light red are rural areas. Areas in dark red are urbanized areas. Map constructed by using data from the Florida Cooperative Land Cover Map version 3.5. Population identifiers: Fakahatchee Strand (FA), Northern Big Cypress (BC1), Southern Big Cypress (BC2), Everglades (EV), Fuchs Hammock (FU), Meissner Hammock (ME), Flamingo (FL), South of Cutler (SC), Timms Hammock (TI), Silver Palm Hammock (SP).
The populations identified above represent all known populations existing in Florida today. However, historical records identify at least four additional areas where G. monostachia once occurred. The plants are presumably extirpated from these areas today, highlighting the drastic range contraction that G. monostachia has experienced within the last hundred years [8]. Interestingly, the areas were largely unaffected by weevil activity, which points to urbanization and land conversions as the most probable causes of range contractions in this species [26]. Two of the four extirpated populations existed within what is now known as the Miami Metropolitan Area, a region of urbanized land stretching 161 km along the southeastern coast of Florida in Broward, Miami-Dade, and Palm Beach Counties. This statistical area includes several large cities, such as Miami, Fort Lauderdale, and West Palm Beach [27]. This urbanized region has expanded rapidly in recent decades and is one of the most populous human settlements in the world. From 1950 to 1995, over 2100 km2 of natural land within Broward, Miami-Dade, and Palm Beach counties was converted to urban use [28]. This urban expansion has continued in recent decades, albeit at a slower rate. For example, the Miami Metropolitan Area gained only 860 km2 of urban area between 1992 and 2016 [27]. While several hammocks that historically supported populations of G. monostachia remain as preserved and protected natural lands within the Miami Metropolitan Area today, their hydrology and microclimates have likely changed considerably as a consequence of increasing urbanization in the areas surrounding them. Development activities by humans are likely to have disrupted historical patterns of hydrological flow within these areas, and the hammocks no longer offer suitable habitat conditions for G. monostachia.
1.3. Conserving Bromeliads in Florida
The conservation of native bromeliads is critical, in part because of the important ecosystem services they provide. Water collected in the leaf bases of tank bromeliads such as G. monostachia, which are known as a “phytotelmata”, sustains life for a variety of organisms, including some invertebrates that exist solely on these plants. Thus, it may be appropriate to view individual bromeliads as ecosystems within ecosystems [29], and the loss of these plants could have cascading negative effects on the biodiversity within a given area. Additionally, Florida populations of G. monostachia represent the northernmost edge of an extensive distribution range, which is the most extensive of any Guzmania, and may harbor genetic diversity that is potentially important to the long-term survival of the species. Numerous studies show that populations occupying the periphery of species ranges are often genetically distinct from those closer to the center [e.g., [30,31]]. As global temperatures rise and species ranges shift toward the poles, these leading-edge gene pools could prove critical for the evolutionary or adaptive potential of the species [32]. Thus, the genetic diversity of G. monostachia in Florida is critical to investigate, ultimately to be able to generate meaningful conservation strategies.
Ecological niche models (ENM) make use of known species occurrence data, as well as data about the environments in which they occur, to reconstruct past and future distribution ranges [33]. By using data from paleoclimatic and future climate projections, ENMs can help generate species distribution models (SDMs) that hypothesize historical and future geographic species ranges. ENMs have become an important tool for conservation, enabling researchers to make predictions about the impacts of climate change on the geographic ranges of imperiled species [34,35]. Predictions about the future range and distribution of G. monostachia in Florida can inform effective conservation strategies, priorities, and actions that ensure the persistence of G. monostachia in Florida by pinpointing populations at risk of extirpation, areas that should be preserved as potential future habitats for the species, and other important elements in their associated plant communities. Paleohistorical projections of the distribution of G. monostachia can provide both insights into the historical interactions between climate changes and distribution ranges and context for interpretations of current range and distribution patterns. Studies show that climate and distribution range interactions are generally conserved over paleohistorical time, with periods of warmer climate shifting distribution ranges toward the pole, and periods of cooler climate shifting distribution ranges toward the equator [36].
In this study, we use ecological niche modeling to infer past and future distribution ranges of Florida G. monostachia based on paleohistorical, current, and projected climate data, as well as sea level changes. We analyze the extent to which these processes have affected the past ecosystem and examine how they may potentially impact G. monostachia populations in the future. The present study has three goals: (1) to infer the past and present ranges of G. monostachia in Florida and broadly determine the amount of suitable habitat, (2) to project climate data into the future under various climate change scenarios and determine their effects on areas of suitable habitat, and (3) to determine the potential impacts of projected sea level changes and their effects on areas of suitable habitat in the future.
2. Materials and Methods
2.1. Occurrence Data Compilation
We utilized a combination of GPS co-ordinates from field observations and georeferences from detailed locality information or historical maps on expert-vetted herbarium specimens (Table S1). The latter were made by using GEOLocate version 3.22 [37]. Because some occurrences (points) comprising the compiled dataset were within 1 km (30 s) of one another and exceeded the resolution of our chosen ecological variables (see below), we filtered the dataset with the “gridSample” function of the dismo R package [38] and retained only one point per 1 km grid cell. The filtering rarefied points to 1 km/30 arcsecond, producing a final set of occurrence co-ordinates for our analyses.
2.2. Ecological Variables Assembly
We obtained bioclimatic data from Worldclim V.2 at 30 arcsec (≈1 km2) resolution [39]. Additionally, we obtained 5 soil variables at 30 arcsec resolution from ISRC SoilGrids API, which we averaged in QGIS across 5 core depths [40,41]. The inclusion of soil data prevents the overestimation of suitable habitat based solely on climatological data [42]. Additionally, soil variables help reflect various land-cover and forest properties that are important to modeling epiphyte ranges, especially in areas where the climate is relatively homogeneous and the focal group is a substrate generalist [43,44,45]. We tested all 19 Bioclim and 5 SoilGrid variable layers for correlation in the training area of the model and used a Pearson’s correlation coefficient cutoff of ±0.8 to identify non-correlated layers for use in our analyses. For layers that were correlated with one another, we chose those that best captured climatic and edaphic factors relevant to G. monostachia [46].
We compiled eight variable layers capturing facets of climate and soil for the Mid-Holocene, present, 2050, and 2090. These comprised five Bioclim temperature and precipitation variables: bio1 (mean annual temperature), bio5 (maximum temperature of warmest month), bio9 (mean temperature of driest quarter), bio12 (annual precipitation), bio13 (precipitation of wettest month); and the three soil layers: clay percentage, pH, and organic carbon content. For the remainder of this paper, “environmental variables” will refer to both climatic and edaphic variables. We also obtained projected climatic data for 2050 and 2090 at Shared Socio-economic Pathways (SSP) 2-4.5 from Worldclim. We selected SSP 2-4.5 because it was determined to be the most plausible by the United Nations Intergovernmental Panel on Climate Change, given current moderate mitigation efforts and global policies regarding CO2 emissions, plus future advances in carbon-zero technologies [47]. Sea level rise (SLR) masks at one and two meters that were used in post-processing for SDM maps and range size calculations were from the Sea Level Scenario tool from the University of Florida Geoplan Center [48,49].
2.3. Ecological Niche Models
To establish the range and training area for our species of interest, we used a 1 km buffer around every point in our processed locality dataset by using the “gBuffer” function of the “rgeos” R package [50]. Short seed dispersal distances of ca. 80 cm have been documented for Guzmania monostachia [10]. Thus, the size of the buffer around each point was based on the dispersal potential and accessible area for a species with limited dispersal [51,52]. We edited these shapefiles to form continuous areas and produce the final shapefile [35,53].
Studies on SDMs for narrow-range species that utilize real and simulated data have indicated that the sum of environmental variables included for model creation is not a factor that increases the so-called “minimum required sample size”, which, in species with narrow ranges, may be as low as three to five unique points (also referred to as the “absolute minimum sample size”; [54]). Therefore, we followed McPherson et al. [55] for choosing a model training area that is comparative to the confirmed presence area of the assessed species so that at least 10% of the training area cells contain a locality point. We checked locality prevalence for our species of interest with the virtualspecies R package [56].
We produced ENMs by using the R package ENMeval V0.3.0 [57] in conjunction with MaxEnt V3.4.1k [58]. We selected ENMeval because it (1) allows for the partitioning of occurrence data by creating datasets for k-fold cross-validation, (2) builds an ensemble of models by using MaxEnt under different user-defined settings, and (3) simplifies selecting optimal model settings by providing multiple evaluation metrics. R random k-folds (=bins) were used for partitioning locality data and calculated four metrics to evaluate and select the best model: the area under the curve of the receiver-operating characteristic for test localities (AUCTEST), the difference between training and testing AUC (AUCDIFF), the delta-Akaike information criterion adjusted for small sample sizes (∆AICc), and the Continuous Boyce Index (CBI) calculated by using Ecospat V3.1. [59]. The resulting models were projected onto the training region or onto the whole of Florida to see if a suitable habitat hypothetically occurs north of the species’ current range. To determine the extent of model extrapolation and uncertainty, we ran a Multivariate Environmental Similarity Surfaces analysis (MESS; [60]) to find areas in our projections where extrapolation may occur for predicting areas of suitable habitat. SLR masks at one and two meters were applied after model creation and projection.
2.4. Identifying Areas of Suitable Habitat
We compared the predicted geographical ranges under both present and future conditions to evaluate changes in suitable habitat for G. monostachia. Overlap between the two scenarios was calculated by (1) comparing differences in size of suitable geographic area (km2), and (2) analyzing raster extent overlap between the present and future areas of suitable habitat by using Schoener’s D, a measure for which 0 indicates no similarity and 1 represents complete similarity [61]. We calculated the 5th and 10th percentile training presence (90 pct, 95 pct) and minimum training presence (MTP) to remove all areas with suitability lower than the suitability values for the 5%, 10%, and lowest predicted suitability value for an occurrence point. This means that 5% or 10% of the occurrence records found in the least suitable habitat do not occur in regions that are representative of the overall habitat of a species and, therefore, should be omitted [62]. The MTP calculation ensures that all locality points are found within the boundaries of the thresholded model because it assumes that the least suitable habitat in which the species is known to occur is the minimum suitability value [63]. By using these binary models, the area and zonal functions of the Raster package in R [64] were used to sum the area of each cell of the prediction raster that was considered suitable habitat. The cells were split into three groups: total suitable area currently, total suitable area in the future, and the ratio of suitable area in the present to the future. We divided the total area of projected suitable habitat in the future by the total area of suitable habitat in the present to quantify how much habitat a species is predicted to gain or lose under a climate change scenario. We then determined if our species was gaining (ratio > 1) or losing (ratio < 1) habitat. A recent report by The United States Geological Survey and National Oceanographic and Atmospheric Administration [48], which details SLR projections for the entire US coastline, states that the Southern Florida coastline can expect up to 7.08 feet (2.16 m) of SLR by the end of the century. Thus, to calculate range size changes while also considering future SLR, we used the above approach while incorporating two scenarios: an intermediate SLR of 1 m and the projected 2 m.
The approach outlined above calculates the probable distribution of suitable range for a species in the future while also considering the impacts of SLR on suitable habitat size. We measured how much of the present projected habitat will remain habitable, despite predicted climate change and SLR, and quantified how much of the current suitable habitat overlaps with the future projected suitability at several different scenarios. The area where both overlap represents habitat that will remain habitable from the present into the future. Additional new habitat may also become available in the future, allowing a species such as G. monostachia to expand its range northward in the Florida peninsula. However, even with the availability of a new suitable habitat in the future, a species may not be able to effectively disperse and establish there. Therefore, the appearance of new habitat in the future does not guarantee that a species will be present in the area.
3. Results
3.1. Occurrence Data
A total of 80 occurrence records were compiled for Guzmania monostachia in Florida (Table S1). After occurrences were filtered within each 1 km2 grid cell, 15 points were retained and used for our analyses. Due to the endangered status of G. monostachia and the potential for poaching-related threats to natural populations, only generalized locality data are provided in Table S1.
3.2. Ecological Niche Models
We used ΔAICc, CBI, and AUC scores to determine model performance. We used CBI specifically because of its ability to provide predicted-to-expected ratio curves that offer insights into model quality, specifically model robustness, habitat suitability resolution, and deviation from randomness [35]. CBI performs particularly well for presence-only based predictions and complements the typical methods of evaluation of presence/absence models [65]. The index ranges from −1 to 1. Values > 0 indicate that the model’s output is positively correlated with the true probability of presence. Values < 0 indicate that it is negatively correlated with the true probability of presence. ΔAICc differentiates between the AICc of a given model and the AICc of the model with the lowest AICc, allowing for ensemble model comparisons.
An ENM is determined to have performed well if its AUC > 0.7, ΔAICc < 2, and CBI is close to 1. We used CBI and ΔAICc to select the best model (Table S2). The CBI of the highest-scoring model was 0.917. Only two models had CBI scores lower than 0.7. The median ΔAICc was 7.64. The median training AUC was 0.8 ± 0.11. Regarding AUC scores, they should be interpreted together with other measures because sampling bias can negatively affect model quality by inflating model accuracy (by erroneously calculating higher AUC scores; [66]). MESS outputs for our species indicate that the future climates within the projection region are mostly within the parameters of the present training region, signifying sufficient reliability for model transferability between different scenarios (Figures S1–S3), with extrapolation affecting projections only in the northernmost part of the range of G. monostachia.
3.3. Changes in Suitable Habitat
The area of suitable habitat increased by 7% between the Mid-Holocene and the present day (Table 1; Figure 3). Gains occurred primarily in the central portion of southern Florida, and small amounts of suitable habitat were lost in the southeast portion of Florida in the Everglades. According to our 90 and 95% threshold analyses (Table 1), G. monostachia is predicted to lose suitable habitat as a result of climate change and sea level rise between the present day and 2090. Although losses affect primarily the southwest coastline and lower lying areas of the Everglades, they are almost exclusively due to sea level rise, rather than changes in climate (Figure 4).

Table 1.
Results from Species Distribution Models (SDMs) comparing past/present and present/future models with differing future sea level rise (SLR) projections for Guzmania monostachia, which are calculated with a 90 and 95% threshold.
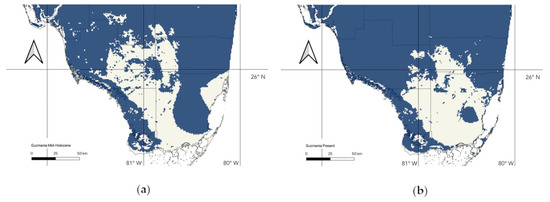
Figure 3.
Representation of 90% thresholded species distribution models of Guzmania monostachia in Florida during the Mid-Holocene (a) and for the present day (b). Areas in blue represent areas that contain habitat which is at least 90% suitable.
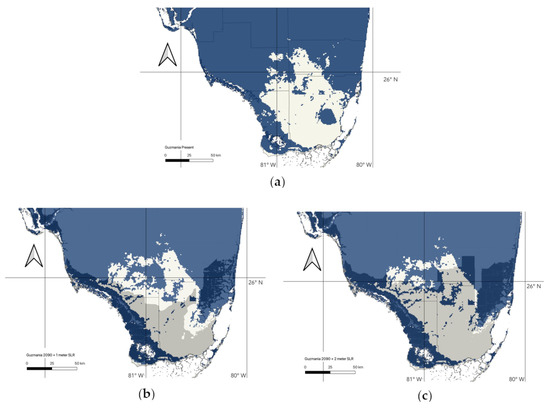
Figure 4.
Representation of 90% thresholded species distribution models of Guzmania monostachia and sea level rise model in Florida for the present day (a), 2090 with 1 m of sea level rise (b), and 2090 with 2 m of sea level rise (c). Areas in blue represent areas that contain habitat which is at least 90% suitable. Areas submerged by 1 m sea level rise are represented by the overlying darker color (dark blue over suitable habitat).
Without accounting for sea level rise, our models predict that G. monostachia would lose only 3% of its suitable habitat in South Florida (516.33 km2 of habitat with at least 90% suitability) between the present day and 2090. These habitat losses are projected to occur mostly along the southwest coast. However, under a projected sea level rise of 1 m for the same time period, G. monostachia is expected to lose roughly 25% of its suitable habitat (4542.24 km2 of habitat with at least 90% suitability, Figure 4b), which is focused along mainly the southwestern Florida coast and areas west of the Miami Rock Ridge. With 2 m of sea level rise, the projected loss of suitable habitat increases to almost 40% (6861.34 km2 of habitat with at least 90% suitability, Figure 4c), with almost the entirety of the Southern tip of Florida submerged. When we extend the area of our model to include all of Florida (Figure 5), rather than just the southern portion where G. monostachia currently occurs, we project that nearly all of Florida would be expected to harbor a suitable habitat by 2090, with a northward expansion.
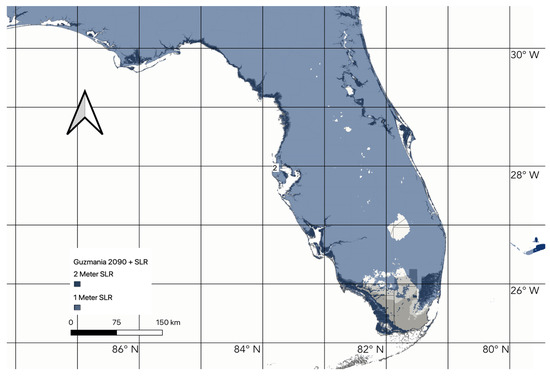
Figure 5.
Representation of 90% thresholded species distribution models of Guzmania monostachia and sea level rise model for 2090 with the model area expanded to cover all of Florida. Areas in blue represent areas that contain habitat which is at least 90% suitable. Areas submerged by 1 and 2 m sea level rise are represented by the overlying darker color (progressively darker blue over suitable habitat).
4. Discussion
4.1. Habitat Suitability in the Future under Climate Change
The amount of suitable habitat for Guzmania monostachia in Florida has changed, and it will continue to shift over time with future changes in climate. However, climate-related transitions and habitat losses may be inconsequential relative to other anthropogenic factors.
The only overall gain of habitat in Florida occurred between the Mid-Holocene and present day, with suitable habitat gained primarily in the central portion of southern Florida, with small amounts of suitable habitat lost in the Everglades (Figure 3). In comparison with changes that occurred in the past, the total amount of suitable habitat is projected to decrease small amounts from the present day to 2090, although the Everglades remain a distinct area marked by substantial habitat loss in both. Currently, the small suitable area in the Everglades is disjunct from the remainder of the available G. monostachia habitat, and the population there is already struggling, consisting of only three individuals. According to our projections, this disjunct habitat may be reduced to roughly half its current area by 2090, although it is expected to become less isolated as areas of additional suitable habitat become available in Southeast Florida (Figure 4). Alterations to hydrology are likely to drive major losses in the Everglades. The region is expected to experience decreases in mean annual precipitation, which will have a profound negative impact on its wetland vegetative communities [21]. However, based on climate alone, large amounts of suitable habitat for G. monostachia are expected to remain throughout South Florida.
When sea level rise is incorporated into our predictions, the scenarios for G. monostachia become bleaker. Under a prediction of 1 m of sea level rise, large areas of suitable habitat, especially on the west coast, are expected to retreat under water by 2090 (Figure 4b), making this region, which currently harbors 3 of the 6 known populations, inhospitable for G. monostachia. Under our worst-case scenario prediction of 2 m of sea level rise, nearly all of the southern tip of Florida will be submerged by 2090, resulting in a 40% reduction of suitable habitat (Figure 4c) and the loss of 5 of the 6 populations known today, the habitats of which will become submerged.
Based on our ENM that considers the entirety of Florida (Figure 5), nearly all of the state is predicted to harbor suitable habitat by 2090. This extensive northward range expansion suggests that a warmer climate will not negatively impact the persistence of G. monostachia in Florida. Conversely, it may facilitate northern migration. It is important to temper expectations on this front, however, especially since projecting an ENM onto geographic areas distant from the occurrence point data used in training the model could result in an overestimation of habitat suitability [67]. Our MESS analysis shows some moderate levels of model extrapolation in northern areas of the Florida peninsula (Figures S2 and S3), indicating that the model over-projects the likelihood of suitable habitat in some of this large area.
Our ENM for the current distribution shows large continuous areas of suitable habitat for G. monostachia in South Florida (Figure 4a), while known populations currently occupy only a few small, disjunct areas in this region (Figure 2). Our results demonstrate that, while ENMs are useful forecasting tools, they often fail to account for additional factors that impact habitat suitability, especially those related to regional human activity [68,69]. Despite the presence of suitable soil and climatic conditions, many areas of suitable habitat in Florida identified by our ENMs are unlikely to represent suitable habitats currently or in the future. For example, our 2090 projections show a hotspot of suitable habitat aligning with the existing Miami Metropolitan area. While G. monostachia currently exists in at least one preserve and formerly occurred in others within this large, densely populated urban area, there are seemingly no (or at least very few) truly suitable habitats remaining outside of the existing protected areas. Given population declines within these small preserves, it may be unreasonable to assume that any suitable habitat will remain in the Miami Metropolitan area into the foreseeable future. Thus, we caution against direct interpretations of ENM results concerning already urbanized or rapidly developing areas; other factors such as rates of population growth and land use changes impacting the area must be considered for a realistic view of habitat suitability (Figure 6).
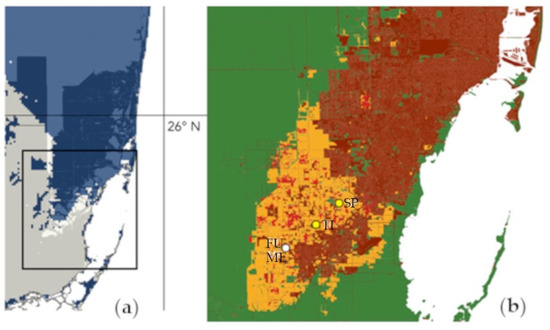
Figure 6.
A comparison projected suitable habitat in 2090 for Guzmania monostachia in SE Florida assuming a 2 m sea level rise (a) versus where populations of the species have currently and previously been found in Miami-Dade County (b).
In Figure 6a, areas in blue represent areas that contain habitat which is at least 90% suitable. Areas submerged by 1 m sea level rise are represented by the overlying darker color (dark blue over suitable habitat). In Figure 6b, white points are populations that are still present. Yellow points are populations that have been extirpated. Areas in green are natural lands. Areas in orange are agricultural lands. Areas in light red are rural areas. Areas in dark red are urbanized areas. Map constructed by using data from the Florida Cooperative Land Cover Map version 3.5. Population identifiers: Fuchs Hammock (FU), Meissner Hammock (ME), Timms Hammock (TI), Silver Palm Hammock (SP).
Another challenge in modeling G. monostachia is its epiphytic habit. Variables such as soil composition, which are frequently incorporated into ENMs for terrestrial plants, do not directly determine suitable habitat for epiphytes, but rather reflect the suitable habitats of their host plant species. Many epiphytic species, including G. monostachia, show some degree of host and environmental specificity [46,70]. While host species data may (in certain cases) prove informative for epiphyte-focused ENMs, studies have been successfully performed without them [71]. In our case, host tree species data were not included because of dramatic differences in host tree species distribution ranges relative to that of G. monostachia. For example, one preferred host, Fraxinus caroliniana Mill., occurs throughout the southeastern United States and as far north as southern Virginia [72], while G. monostachia does not occur outside of South Florida. In this case, inclusion of this host tree distribution data would contribute to an overestimation of suitable habitats for the focal species, which is notably less tolerant of temperate climatic conditions.
4.2. Implications for Conservation and Future Steps
Projecting ENMs onto future climate scenarios provides useful information for conservation efforts, particularly in the face of climate change. Investing considerable effort and resources into preservation activities in areas that may not support species in the future could prove counterproductive and wasteful. Based on the use of ENMs and the predicted impacts of climate change, conservationists can instead focus on preserving areas and populations that are likely to persist into the foreseeable future. For example, the ENMs shown here for G. monostachia can inform future conservation efforts by highlighting specific populations and areas of suitable habitat that will persist above sea level as climate change progresses over the next century. Additionally, future research might also consider species interactions between M. callizona and G. monostachia and utilize a joint SDM to identify potential areas where their projected distributions do not overlap. These non-overlapping areas may represent future safe havens for G. monostachia, particularly if they are also unaffected by SLR, and their preservation may prove beneficial to bromeliad-focused conservation efforts. In addition to climate change, anthropogenic impacts on environments must be taken into account when planning conservation efforts. The ongoing urban expansion in South Florida is likely to reduce or negatively impact remaining wetland environments throughout the region, but this variable is difficult to incorporate in an ENM. Within the Miami Metropolitan Complex, many of the disjunct rockland hammocks along the Miami Rock Ridge exist today as preserved lands. Records indicate that G. monostachia historically occurred in four of these preserved areas; however, despite their protected status, populations are reportedly extirpated from two. The remaining hammocks, Fuchs Hammock and Meissner Hammock, are contiguous preserves that form a single small area, but populations of G. monostachia in both are in steep decline. Dwindling plant numbers in these small forest fragments suggest that the preservation of small pockets of habitat is an ineffective conservation strategy for G. monostachia. Small forest fragments are known to suffer from edge effects that can negatively affect the microclimate or host-related requirements of many epiphytes, resulting in biodiversity loss [73]. Large preserves are more resilient to edge effects, particularly with increasing distance into their interiors. Perhaps this is why the largest and most robust populations of G. monostachia are found within Fakahatchee Strand and Big Cypress Preserves, which have large contiguous areas of suitable habitat. This could also explain the dismal state of the population within Everglades National Park. While the park itself is a large preserve, the rockland hammocks that provide suitable habitat for G. monostachia are small and fragmented. The hammock that holds the only known population of G. monostachia in the Everglades is only 140 m in diameter and is surrounded by dry, sparsely forested pine rockland and prairie ecosystems [74].
Our ENM results suggest G. monostachia will not be further imperiled by the changing climate in Florida. Instead, sea level rise and human urban expansion represent the main threats to remaining populations, and conservationists should carefully consider both as part of future strategies, plans, or actions. In situ conservation efforts should focus on surviving populations occurring at elevations greater than 2 m above sea level, while ex situ conservation should be undertaken for both populations at lower elevations and those threatened by urban encroachment. The Fairchild Tropical Botanic Garden (FTBG) has already begun ex situ conservation efforts for G. monostachia from Fuchs and Meissner Hammock Preserves, respectively, due to the marked decline of these populations [75,76], and other botanical gardens and institutions in South Florida have been encouraged to implement a similar approach. Other opportunities for ex situ conservation might be undertaken by hobby bromeliad growers and collectors. Bromeliads are charismatic and visually striking plants that are coveted by a large community of growers and collectors worldwide, particularly in Florida, where production by the ornamental bromeliad industry generates an estimated $20 million annually [77]. Furthermore, private gardens represent additional venues for ex situ conservation [78]. For example, efforts such as the FTBG-led Million Orchid Project [79] include re-introducing imperiled native orchids into public and private landscapes in population-dense areas of South Florida, and this initiative may serve as a programmatic model for the community-driven conservation of G. monostachia and other bromeliads native to Florida.
Our ENMs show that suitable habitat for G. monostachia will extend northward beyond its current range; therefore, a future conservation measure might involve transplanting individuals within preserved areas in Central or even North Florida, where they would be less affected by sea level rise and urban development. This conservation strategy is known as assisted migration, and it has been a contentious subject among conservationists [80,81]. General arguments against assisted migration focus on the possible unintended consequences of translocating species—for example, the possibility for invasiveness, impacts to native organisms in areas of introduction, or loss of genetic diversity. However, cases cited in the debate involve translocation over long or even intercontinental ranges [82,83]. Guzmania monostachia could be a model candidate for assisted migration based on available implementation guidelines [84,85,86]. Its current population fragmentation pattern, large area of existing suitable habitat outside its current range, potential for short-distance translocation, and potentially high transplantation success rate [84] suggest that assisted migration may be a viable conservation approach for G. monostachia, pending financial feasibility.
Supplementary Materials
The following supporting information can be downloaded at: https://www.mdpi.com/article/10.3390/d15040525/s1, Supplementary Figure S1: Mid-Holocene MESS; Supplementary Figure S2: 2050 MESS; Supplementary Figure S3: 2090 MESS; Table S1: Guzmania monostachia Occurrence Records; Table S2: Output model statistics for all 48 trial model runs in ENMEval.
Author Contributions
Conceptualization, S.K., A.A.N., G.G. and N.C.; data collection, S.K.; data curation, S.K. and A.A.N.; formal analysis, A.A.N.; funding acquisition, S.K. and N.C.; project administration, N.C.; investigation, S.K., A.A.N. and N.C.; methodology, S.K., A.A.N. and N.C.; resources, N.C.; supervision, N.C.; visualization, S.K. and A.A.N.; writing—original draft, S.K., A.A.N., G.G. and N.C.; writing—review and editing, S.K., A.A.N., G.G. and N.C. All authors have read and agreed to the published version of the manuscript.
Funding
This research was funded by the Florida Museum of Natural History and by awards to Shelby Krupar from the American Society of Plant Taxonomists, the Florida Native Plant Society, the International Association of Plant Taxonomy, and the Carrie Yoder Scholarship for Plant Ecology and Conservation Research in Florida (Department of Biology, University of Florida).
Institutional Review Board Statement
Not applicable.
Data Availability Statement
The raw climatic and soil data that were used in this study are publicly available on WorldClim (https://www.worldclim.org; accessed on 24 August 2022) and SoilGrids (https://soilgrids.org). The raw locality data that were used in this study are located in the supplements as Table S2. The R code used for the analysis is available at https://github.com/aemelton/EA_ENA_ENM.
Conflicts of Interest
The authors declare no conflict of interest.
References
- Barfuss, M.H.J.; Till, W.; Leme, E.M.C.; Pinzón, J.P.; Manzanares, J.M.; Halbritter, H.; Samuel, R.; Brown, G.K. Taxonomic revision of Bromeliaceae subfam. Tillandsioideae based on a multi-locus DNA sequence phylogeny and morphology. Phytotaxa 2016, 279, 1. [Google Scholar] [CrossRef]
- Givnish, T.; Millam, K.; Berry, P.; Sytsma, K. Phylogeny, Adaptive Radiation, and Historical Biogeography of Bromeliaceae Inferred from ndhF Sequence Data. Aliso 2007, 23, 3–26. [Google Scholar] [CrossRef]
- Givnish, T.J.; Barfuss, M.H.J.; Van Ee, B.; Riina, R.; Schulte, K.; Horres, R.; Gonsiska, P.A.; Jabaily, R.S.; Crayn, D.M.; Smith, J.A.C.; et al. Phylogeny, adaptive radiation, and historical biogeography in Bromeliaceae: Insights from an eight-locus plastid phylogeny. Am. J. Bot. 2011, 98, 872–895. [Google Scholar] [CrossRef]
- Frank, J.H.; Thomas, M.C. Metamasius callizona (CHEVROLAT) (COLEOPTERA: CURCULIONIDAE), AN IMMIGRANT PEST, DESTROYS BROMELIADS IN FLORIDA. Can. Entomol. 1994, 126, 673–682. [Google Scholar] [CrossRef]
- Frank, J.H.; Cave, R.D. Metamasius callizona is destroying Florida’s native bromeliads. In Proceedings of the Second International Symposium on Biological Control of Arthropods, Davos, Switzerland, 2–16 September 2005. [Google Scholar]
- Frank, J.H. Exploration in Guatemala and Belize for more parasitoids to use against Metamasius callizona in Florida. J. Bromel. Soc. 2011, 61, 112–125. [Google Scholar]
- Sunquist-Blunden, C.; Montero-McAllister, N. Florida’s Endangered and Threatened Species; Florida Fish and Wildlife Conservation Commission: Tallahassee, FL, USA, 2022. [Google Scholar]
- Gann, G.D.; Stocking, G.C. Collaborators Floristic Inventory of South Florida Database Online. Available online: https://regionalconservation.org/ircs/database/database.asp (accessed on 22 September 2022).
- Krupar, S.L. (Department of Biology, University of Florida, Gainesville, FL, USA) Personal communication, 2022.
- Benzing, D.H. Bromeliaceae: Profile of An Adaptive Radiation; Cambridge University Press: Cambridge, UK, 2000; ISBN 0521430313. [Google Scholar]
- Cascante-Marín, A.; de Jong, M.; Borg, E.D.; Oostermeijer, J.G.B.; Wolf, J.H.D.; den Nijs, J.C.M. Reproductive strategies and colonizing ability of two sympatric epiphytic bromeliads in a tropical premontane area. Int. J. Plant Sci. 2006, 167, 1187–1195. [Google Scholar] [CrossRef]
- Jump, A.S.; Marchant, R.; Peñuelas, J. Environmental change and the option value of genetic diversity. Trends Plant Sci. 2009, 14, 51–58. [Google Scholar] [CrossRef]
- Hine, A.C. Geologic History of Florida, 2nd ed.; University Press of Florida: Gainesville, FL, USA, 2013. [Google Scholar]
- Gardulski, A.F.; Gowen, M.H.; Milsark, A.; Weiterman, S.D.; Wise, S.W.; Mullins, H.T. Evolution of a deep-water carbonate platform: Upper Cretaceous to Pleistocene sedimentary environments on the west Florida margin. Mar. Geol. 1991, 101, 163–179. [Google Scholar] [CrossRef]
- Missimer, T.M.; Maliva, R.G. Late Miocene fluvial sediment transport from the southern Appalachian Mountains to southern Florida: An example of an old mountain belt sediment production surge. Sedimentology 2017, 64, 1846–1870. [Google Scholar] [CrossRef]
- Dahl, T.E. Florida’s Wetlands: An Update on Status and Trends 1985 to 1996; U.S. Department of the Interior, Fish and Wildlife Service: Washington, DC, USA, 2005. [Google Scholar]
- McLaughlin, D.L.; Cohen, M.J. Realizing ecosystem services: Wetland hydrologic function along a gradient of ecosystem condition. Ecol. Appl. 2013, 23, 1619–1631. [Google Scholar] [CrossRef]
- Dahl, T.E. Wetlands Losses in the United States 1780’s to 1980’s; U.S. Department of the Interior, Fish and Wildlife Service: Washington, DC, USA, 1990. [Google Scholar]
- Todd, M.J.; Muneepeerakul, R.; Pumo, D.; Azaele, S.; Miralles-Wilhelm, F.; Rinaldo, A.; Rodriguez-Iturbe, I. Hydrological drivers of wetland vegetation community distribution within Everglades National Park, Florida. Adv. Water Resour. 2010, 33, 1279–1289. [Google Scholar] [CrossRef]
- Kushlan, J.A. External threats and internal management: The hydrologic regulation of the Everglades, Florida, USA. Environ. Manag. 1987, 11, 109–119. [Google Scholar] [CrossRef]
- Todd, M.J.; Muneepeerakul, R.; Miralles-Wilhelm, F.; Rinaldo, A.; Rodriguez-Iturbe, I. Possible climate change impacts on the hydrological and vegetative character of Everglades National Park, Florida. Ecohydrology 2012, 5, 326–336. [Google Scholar] [CrossRef]
- Comer, P.; Faber-Langendoen, D.; Evans, R.; Gawler, S.; Josse, C.; Kittel, G.; Menard, S.; Pyne, M.; Reid, M.; Schulz, K.; et al. Ecological Systems of the United States: A Working Classification of U.S. Terrestrial Systems; NatureServe: Arlington, VA, USA, 2003. [Google Scholar]
- Meeder, J.F.; Harlem, P.W. Origin and development of true karst valleys in response to late Holocene sea-level change, the Transverse Glades of southeast Florida, USA. Depos. Rec. 2019, 5, 558–577. [Google Scholar] [CrossRef]
- Brooks, W.R.; Lockwood, J.L.; Jordan, R.C. Tropical paradox: A multi-scale analysis of the invasion paradox within Miami Rock Ridge tropical hardwood hammocks. Biol. Invasions 2013, 15, 921–930. [Google Scholar] [CrossRef]
- Owen, M. (Park Biologist, Fakahatchee Strand Preserve State Park, Copeland, FL, USA) Personal communication, 2021.
- Frank, J.H. Bromeliad-Eating Weevils. Selbyana 1999, 20, 40–48. [Google Scholar]
- Rifat, S.A.A.; Liu, W. Quantifying spatiotemporal patterns and major explanatory factors of urban expansion in miami metropolitan area during 1992–2016. Remote Sens. 2019, 11, 2493. [Google Scholar] [CrossRef]
- Walker, R.; Solecki, W. Theorizing Land-Cover and Land-Use Change: The Case of the Florida Everglades and Its Degradation. Ann. Assoc. Am. Geogr. 2004, 94, 311–328. [Google Scholar] [CrossRef]
- Cooper, T.M.; Frank, J.H.; Cave, R.D. Loss of phytotelmata due to an invasive bromeliad-eating weevil and its potential effects on faunal diversity and biogeochemical cycles. Acta Oecol. 2014, 54, 51–56. [Google Scholar] [CrossRef]
- Van Rossum, F.; Vekemans, X.; Gratia, E.; Meerts, P. A comparative study of allozyme variation of peripheral and central populations of Silene nutans L. (Caryophyllaceae) from Western Europe: Implications for conservation. Plant Syst. Evol. 2003, 242, 49–61. [Google Scholar] [CrossRef]
- Hamilton, J.A.; Eckert, C.G. Population genetic consequences of geographic disjunction: A prairie plant isolated on Great Lakes alvars. Mol. Ecol. 2007, 16, 1649–1660. [Google Scholar] [CrossRef] [PubMed]
- Gibson, S.Y.; Van Der Marel, R.C.; Starzomski, B.M. Climate Change and Conservation of Leading-Edge Peripheral Populations. Conserv. Biol. 2009, 23, 1369–1373. [Google Scholar] [CrossRef]
- Peterson, A.T. Predicting species’ geographic distributions based on ecological niche modeling. Condor 2001, 103, 599–605. [Google Scholar] [CrossRef]
- Kolanowska, M.; Rewicz, A.; Baranow, P. Ecological niche modeling of the pantropical orchid Polystachya concreta (Orchidaceae) and its response to climate change. Sci. Rep. 2020, 10, 14801. [Google Scholar] [CrossRef]
- Naranjo, A.A.; Melton, A.E.; Soltis, D.E.; Soltis, P.S. Endemism, projected climate change, and identifying species of critical concern in the Scrub Mint clade (Lamiaceae). Conserv. Sci. Pract. 2022, 4, e621. [Google Scholar] [CrossRef]
- Martínez-Meyer, E.; Peterson, A.T. Conservatism of ecological niche characteristics in North American plant species over the Pleistocene-to-Recent transition. J. Biogeogr. 2006, 33, 1779–1789. [Google Scholar] [CrossRef]
- Rios, N.E.; Bart, H.L. GEOLocate; Tulane University Museum of Natural History: Belle Chasse, LA, USA, 2010. [Google Scholar]
- Hijmans, R.J.; Phillips, S.; Leathwick, J.; Elith, J.; Hijmans, M.R.J. Package “dismo”. Circles 2017, 9, 1–68. [Google Scholar]
- Fick, S.E.; Hijmans, R.J. WorldClim 2: New 1-km spatial resolution climate surfaces for global land areas. Int. J. Climatol. 2017, 37, 4302–4315. [Google Scholar] [CrossRef]
- Batjes, N.H.; Ribeiro, E.; van Oostrum, A. Standardised soil profile data to support global mapping and modelling (WoSIS snapshot 2019). Earth Syst. Sci. Data 2020, 12, 299–320. [Google Scholar] [CrossRef]
- Hengl, T.; Mendes de Jesus, J.; Heuvelink, G.B.M.; Ruiperez Gonzalez, M.; Kilibarda, M.; Blagotić, A.; Shangguan, W.; Wright, M.N.; Geng, X.; Bauer-Marschallinger, B.; et al. SoilGrids250m: Global gridded soil information based on machine learning. PloS ONE 2017, 12, e0169748. [Google Scholar] [CrossRef] [PubMed]
- Murphy, H.T.; Lovett-Doust, J. Accounting for regional niche variation in habitat suitability models. Oikos 2007, 116, 99–110. [Google Scholar] [CrossRef]
- Quesada, C.A.; Phillips, O.L.; Schwarz, M.; Czimczik, C.I.; Baker, T.R.; Patiño, S.; Fyllas, N.M.; Hodnett, M.G.; Herrera, R.; Almeida, S.; et al. Basin-wide variations in Amazon forest structure and function are mediated by both soils and climate. Biogeosciences 2012, 9, 2203–2246. [Google Scholar] [CrossRef]
- Zuquim, G.; Costa, F.R.C.; Tuomisto, H.; Moulatlet, G.M.; Figueiredo, F.O.G. The importance of soils in predicting the future of plant habitat suitability in a tropical forest. Plant Soil 2020, 450, 151–170. [Google Scholar] [CrossRef]
- Ngoh, M.L. Evaluating Current and Future Potential Distribution of Epiphytic Orchids in the Congo Basin with Ecological Niche Models. Master’s Thesis, University of Tennessee, Knoxville, Tennessee, 2022. [Google Scholar]
- Bennett, B.C. Spatial distribution of catopsis and guzmania (bromeliaceae) in southern florida. Bull. Torrey Bot. Club 1987, 114, 265. [Google Scholar] [CrossRef]
- Hausfather, Z.; Peters, G.P. Emissions—The “business as usual” story is misleading. Nature 2020, 577, 618–620. [Google Scholar] [CrossRef] [PubMed]
- Sweet, W.V.; Kopp, R.; Weaver, C.P.; Obeysekera, J.; Horton, R.M.; Thieler, E.R.; Zervas, C.E. U.S. Department of Commerce, National Oceanic and Atmospheric Administration, National Ocean Service, Center for Operational Oceanographic Products and Services. In Global and Regional Sea Level Rise Scenarios for the United States; NOAA: Washington, DC, USA, 2017. [Google Scholar] [CrossRef]
- U.S. Army Corps of Engineers (USACE). Sea-Level Change Curve Calculator. Available online: https://cwbi-app.sec.usace.army.mil/rccslc/slcc_calc.html (accessed on 26 January 2023).
- Bivand, R.; Rundel, C.; Pebesma, E.; Stuetz, R.; Hufthammer, K.O.; Bivand, M.R. Package “Rgeos”; The Comprehensive R Archive Network (CRAN): San Francisco, CA, USA, 2017. [Google Scholar]
- Barve, N.; Barve, V.; Jiménez-Valverde, A.; Lira-Noriega, A.; Maher, S.P.; Peterson, A.T.; Soberón, J.; Villalobos, F. The crucial role of the accessible area in ecological niche modeling and species distribution modeling. Ecol. Modell. 2011, 222, 1810–1819. [Google Scholar] [CrossRef]
- Romero-Alvarez, D.; Escobar, L.E.; Varela, S.; Larkin, D.J.; Phelps, N.B.D. Forecasting distributions of an aquatic invasive species (Nitellopsis obtusa) under future climate scenarios. PloS ONE 2017, 12, e0180930. [Google Scholar] [CrossRef]
- Stubbs, R.L.; Soltis, D.E.; Cellinese, N. The future of cold-adapted plants in changing climates: Micranthes (Saxifragaceae) as a case study. Ecol. Evol. 2018, 8, 7164–7177. [Google Scholar] [CrossRef]
- van Proosdij, A.S.J.; Sosef, M.S.M.; Wieringa, J.J.; Raes, N. Minimum required number of specimen records to develop accurate species distribution models. Ecography 2016, 39, 542–552. [Google Scholar] [CrossRef]
- McPHERSON, J.M.; Jetz, W.; Rogers, D.J. The effects of species’ range sizes on the accuracy of distribution models: Ecological phenomenon or statistical artefact? J. Appl. Ecol 2004, 41, 811–823. [Google Scholar] [CrossRef]
- Leroy, B.; Meynard, C.N.; Bellard, C.; Courchamp, F. virtualspecies, an R package to generate virtual species distributions. Ecography 2016, 39, 599–607. [Google Scholar] [CrossRef]
- Muscarella, R.; Galante, P.J.; Soley-Guardia, M.; Boria, R.A.; Kass, J.M.; Uriarte, M.; Anderson, R.P. ENMeval: An R package for conducting spatially independent evaluations and estimating optimal model complexity for Maxent ecological niche models. Methods Ecol. Evol. 2014, 5, 1198–1205. [Google Scholar] [CrossRef]
- Phillips, S.J.; Anderson, R.P.; Schapire, R.E. Maximum entropy modeling of species geographic distributions. Ecol. Modell. 2006, 190, 231–259. [Google Scholar] [CrossRef]
- Di Cola, V.; Broennimann, O.; Petitpierre, B.; Breiner, F.T.; D’Amen, M.; Randin, C.; Engler, R.; Pottier, J.; Pio, D.; Dubuis, A.; et al. Ecospat: An R package to support spatial analyses and modeling of species niches and distributions. Ecography 2017, 40, 774–787. [Google Scholar] [CrossRef]
- Elith, J.; Kearney, M.; Phillips, S. The art of modelling range-shifting species. Methods Ecol. Evol. 2010, 1, 330–342. [Google Scholar] [CrossRef]
- Broennimann, O.; Fitzpatrick, M.C.; Pearman, P.B.; Petitpierre, B.; Pellissier, L.; Yoccoz, N.G.; Thuiller, W.; Fortin, M.-J.; Randin, C.; Zimmermann, N.E.; et al. Measuring ecological niche overlap from occurrence and spatial environmental data. Glob. Ecol. Biogeogr. 2012, 21, 481–497. [Google Scholar] [CrossRef]
- Escalante, T.; Rodríguez-Tapia, G.; Linaje, M.; Illoldi-Rangel, P.; González-López, R. Identification of areas of endemism from species distribution models: Threshold selection and Nearctic mammals. TIP 2013, 16, 5–17. [Google Scholar] [CrossRef]
- Liu, C.; Newell, G.; White, M. On the selection of thresholds for predicting species occurrence with presence-only data. Ecol. Evol. 2016, 6, 337–348. [Google Scholar] [CrossRef]
- Hijmans, R.J.; Van Etten, J.; Cheng, J.; Mattiuzzi, M.; Summer, M.; Greenburg, J.A.; Hijmans, M.R.J. Package “Raster”; R Package: Vienna, Austria, 2015. [Google Scholar]
- Hirzel, A.H.; Le Lay, G.; Helfer, V.; Randin, C.; Guisan, A. Evaluating the ability of habitat suitability models to predict species presences. Ecol. Modell. 2006, 199, 142–152. [Google Scholar] [CrossRef]
- Veloz, S.D. Spatially autocorrelated sampling falsely inflates measures of accuracy for presence-only niche models. J. Biogeogr. 2009, 36, 2290–2299. [Google Scholar] [CrossRef]
- Owens, H.L.; Campbell, L.P.; Dornak, L.L.; Saupe, E.E.; Barve, N.; Soberón, J.; Ingenloff, K.; Lira-Noriega, A.; Hensz, C.M.; Myers, C.E.; et al. Constraints on interpretation of ecological niche models by limited environmental ranges on calibration areas. Ecol. Modell. 2013, 263, 10–18. [Google Scholar] [CrossRef]
- Soberon, J.; Peterson, A.T. Interpretation of models of fundamental ecological niches and species’ distributional areas. Biodiv. Inf. 2005, 2, 1–10. [Google Scholar] [CrossRef]
- Wiens, J.A.; Stralberg, D.; Jongsomjit, D.; Howell, C.A.; Snyder, M.A. Niches, models, and climate change: Assessing the assumptions and uncertainties. Proc. Natl. Acad. Sci. USA 2009, 106 (Suppl. S2), 19729–19736. [Google Scholar] [CrossRef]
- Wagner, K.; Zotz, G. Including dynamics in the equation: Tree growth rates and host specificity of vascular epiphytes. J. Ecol. 2020, 108, 761–773. [Google Scholar] [CrossRef]
- Vasconcelos, T.S.; Antonelli, C.P.; Napoli, M.F. Mutualism influences species distribution predictions for a bromeliad-breeding anuran under climate change. Austral Ecol. 2017, 42, 869–877. [Google Scholar] [CrossRef]
- Westwood, M.; Oldfield, S.; Jerome, D.; Romero-Severson, J. Fraxinus caroliniana. The IUCN Red List of Threatened Species 2017: e.T63004A96445289. Available online: https://www.iucnredlist.org/species/63004/96445289 (accessed on 23 February 2023).
- Lippert, A.P.U.; Silva, V.L.; Mallmann, I.T.; Müller, A.; Droste, A.; Schmitt, J.L. Edge effect on vascular epiphytes in a subtropical Atlantic Forest fragment. J. Env. Anal. Progr. 2022, 7, 135–149. [Google Scholar] [CrossRef]
- The Florida Cooperative Land Cover Map; 3.5.; Florida Fish and Wildlife Conservation Commission and Florida Natural Areas Inventory. 2021. Available online: https://myfwc.com/research/gis/wildlife/cooperative-land-cover/ (accessed on 31 October 2022).
- Possley, J. (South Florida Conservation Program Manager, Fairchild Tropical Botanic Garden, Miami, FL, USA) Personal communication, 2021.
- Wintergerst, S. Fairchild Tropical Botanic Garden’s Conservation Program on-site Frozen Seed Bankinventory. Available online: https://fairchildgarden.org/science-and-education/science/native-plant-conservation/ (accessed on 23 February 2023).
- Negrelle, R.R.B.; Mitchell, D.; Anacleto, A. Bromeliad ornamental species: Conservation issues and challenges related to commercialization. Acta Sci. Biol. Sci. 2012, 34, 91–100. [Google Scholar] [CrossRef]
- Ismail, S.A.; Pouteau, R.; van Kleunen, M.; Maurel, N.; Kueffer, C. Horticultural plant use as a so-far neglected pillar of ex situ conservation. Conserv. Lett. 2021, 14, e12825. [Google Scholar] [CrossRef]
- Million Orchid Project—Fairchild Tropical Botanic Garden. Available online: https://fairchildgarden.org/science-and-education/science/million-orchid-project/ (accessed on 23 February 2023).
- Aubin, I.; Garbe, C.M.; Colombo, S.; Drever, C.R.; McKenney, D.W.; Messier, C.; Pedlar, J.; Saner, M.A.; Venier, L.; Wellstead, A.M.; et al. Why we disagree about assisted migration: Ethical implications of a key debate regarding the future of Canada’s forests. For. Chron. 2011, 87, 755–765. [Google Scholar] [CrossRef]
- Schlaepfer, M.A.; Helenbrook, W.D.; Searing, K.B.; Shoemaker, K.T. Assisted colonization: Evaluating contrasting management actions (and values) in the face of uncertainty. Trends Ecol. Evol. 2009, 24, 471–472. [Google Scholar] [CrossRef]
- Vitt, P.; Havens, K.; Kramer, A.T.; Sollenberger, D.; Yates, E. Assisted migration of plants: Changes in latitudes, changes in attitudes. Biol. Conserv. 2010, 143, 18–27. [Google Scholar] [CrossRef]
- Ricciardi, A.; Simberloff, D. Assisted colonization is not a viable conservation strategy. Trends Ecol. Evol. 2009, 24, 248–253. [Google Scholar] [CrossRef]
- Duarte, M.M.; Gandolfi, S. Diversifying growth forms in tropical forest restoration: Enrichment with vascular epiphytes. For. Ecol. Manag. 2017, 401, 89–98. [Google Scholar] [CrossRef]
- Hoegh-Guldberg, O.; Hughes, L.; McIntyre, S.; Lindenmayer, D.B.; Parmesan, C.; Possingham, H.P.; Thomas, C.D. Ecology. Assisted colonization and rapid climate change. Science 2008, 321, 345–346. [Google Scholar] [CrossRef] [PubMed]
- McLachlan, J.S.; Hellmann, J.J.; Schwartz, M.W. A Framework for Debate of Assisted Migration in an Era of Climate Change. Conserv. Biol. 2007, 21, 297–302. [Google Scholar] [CrossRef]
Disclaimer/Publisher’s Note: The statements, opinions and data contained in all publications are solely those of the individual author(s) and contributor(s) and not of MDPI and/or the editor(s). MDPI and/or the editor(s) disclaim responsibility for any injury to people or property resulting from any ideas, methods, instructions or products referred to in the content. |
© 2023 by the authors. Licensee MDPI, Basel, Switzerland. This article is an open access article distributed under the terms and conditions of the Creative Commons Attribution (CC BY) license (https://creativecommons.org/licenses/by/4.0/).