Abstract
New data on the fatty acid compositions of the muscle tissues of the two most widespread families of the mesopelagic zone—the Myctophidae (Notoscopelus kroyeri and Symbolophorus veranyi) and Stomiidae (Chauliodus sloani, Stomias boa, Borostomias antarcticus, and Malacosteus niger) families—were obtained from the Irminger Sea (North East Atlantic). The fatty acids (FAs) in the total lipids (TLs), phospholipids (PLs), triacylglycerols (TAGs), and cholesterol esters and waxes were analyzed using gas–liquid chromatography with a mass-selective detector and flame-ionized detector (GC-MS and GC-FID, respectively). Species-specific differences in the FA/alcohol profiles of the studied fishes were revealed. A directed deep-vise trend in the changes in the content and performance of certain FAs for the studied species was found. Along with this, a general character of dominance for monounsaturated fatty acids (MUFAs), which were discussed as food tracers, was revealed. MUFAs in the muscle tissues included dietary markers of zooplankton (copepods)—20:1(n-9) and 22:1(n-11), the content of which varied in association with the species—such that the biomarker Calanus glacialis predominated in muscles of B. antarcticus and C. hyperboreus prevailed in other studied species. Different strategies of compensatory adaptation to depth gradient in lipid metabolism among the studied species were discussed.
Keywords:
lipids; fatty acids; mesopelagic fish; Stomiidae; Myctophidae; mesopelagic zone; North Atlantic 1. Introduction
Mesopelagic fishes, which inhabit a depth range of two hundred–one thousand meters, are quite small in size but constitute one of the most widespread and abundant groups of marine organisms. Their biomass is estimated at 2-19.5 Gt worldwide [1,2]. The key ecological role of these organisms is to relocate organic matter from the highly productive epipelagic zone to deeper water layers (the bathy- and abyssopelagic) (the so-called “carbon cycle”) [3]. A majority of mesopelagic species are known to perform extensive vertical diurnal migrations to the epipelagic zone during the night and hundreds of meters downward during the daytime [4,5]. Such migrations cause the organisms to experience heavy pressure and temperature stresses, but deep-pelagic organisms have become well adapted to such circumstances, in particular, through a wide spectrum of compensatory biochemical mechanisms in which fatty acids (FAs) play a special role [6,7,8].
Fatty acids (FAs) are among the most labile and “sensitive” lipidic components, actively participating in the development of compensatory reactions in organisms living in different environments [9,10]. Differences in the habitats, life cycles, development features, intraspecies structure, and dietary specializations of mesopelagic fishes can influence their FA qualitative and quantitative compositions and, hence, the organisms’ adaptive responses [11,12]. We know, e.g., that a major share of FAs in fish are long-chain mono- and polyunsaturated acids (MUFAs and PUFAs, respectively) [13,14,15]. Physiologically significant PUFAs, such as eicosapentaenoic (20:5(n-3)), docosahexaenoic (22:6(n-3)), and arachidonic (20:4(n-6)) acids, are important components of phospholipids (PLs) in cell membranes, but their quantities in an organism are limited by food supply via the trophic chain and depend on the enzymatic activity in the processes of the synthesis and elongation of these FAs [14,16,17,18,19,20,21,22,23]. Certain FA molecules are involved in the rearrangement of the liquid crystal state of membranes under changing external conditions (such as hydrostatic pressure, temperature, salinity, etc.), act as sources of bioactive substances of the prostaglandin, leukotriene, and thromboxane classes, perform the energy reserve function, etc. [24,25,26,27].
Being one of the most diverse and abundant groups of marine organisms, mesopelagic fishes are not only valuable objects for the study of the fundamental aspects of the mechanisms of adaptation to extreme living conditions but can also serve as potential sources of biologically active substances (mainly due to their complex array of MUFAs and PUFAs) and feeds of special value for human health and industry (e.g., aquaculture or biotechnology) [1,5,28,29,30]. We have previously investigated the lipid and fatty acid profiles (lipidomes) of five members of the families most widespread in the North East Atlantic (Irminger Sea), which are different in their life cycles, trophic relationships, habitat depths, and presence (or absence) of circadian migrations [31,32,33]. In the study reported here, we focused on members of the two most widespread families of the mesopelagic zone: Myctophidae and Stomiidae. According to the literature, fishes of the Myctophidae family numerically constitute at least 20% of the oceanic fauna, and members of the Stomiidae family are among the main predators in the mesopelagic zone of the World Ocean [30,34].
Thus, the aim was to qualitatively and quantitatively study the fatty acid profiles (the FAs in total lipids and their individual fractions, i.e., phospholipids, triacylglycerols, and cholesterol esters and waxes) of the muscle tissues of members of the Myctophidae (Notoscopelus kroyeri and Symbolophorus veranyi) and Stomiidae (Chauliodus sloani, Stomias boa, Malacosteus niger, and Borostomias antarcticus) families captured in the Irminger Sea (North East Atlantic) at depths ranging within 250–700 m.
2. Materials and Methods
2.1. Sampling
The sampling of muscle tissues from mesopelagic fishes (Notoscopelus kroyeri (n = 17), Symbolophorus veranyi (n = 10), Chauliodus sloani (n = 16), Stomias boa (n = 13), Malacosteus niger (n = 14), and Borostomias antarcticus (n = 17)) was carried out during the surveys in the Irminger Sea survey (59°60′−64°60′ N, 26°20′−41°50′ W) in summer (June–July 2018) onboard an R/V «Atlantida» (AtlantNIRO, Kaliningrad, Russia). Biological material was sampled by trawling at 250, 325, 375, 400, 650, and 700 m depths in 3 areas: the North East Atlantic Fisheries Commission (NEAFC) regulatory area, the Greenland fishing zone, and the Icelandic exclusive economic zone (Figure 1). A 78.7/416 mid-water trawl (project 2492−02) was used, with the rope and net parts made of modern lightweight materials and mesh sizes of 68 mm in the wings and 16 mm in the cod end. Sampling methods were carried out according to the Manual for the International Deep Pelagic Ecosystem Survey [35]. The captured fish were identified to species level using the recommended guides on board and then (at the laboratory) using photo and video materials [36,37,38,39]. For the biochemical analysis, muscle tissues were taken from one-size adult individuals. Samples were taken individually from each of the captured specimens.
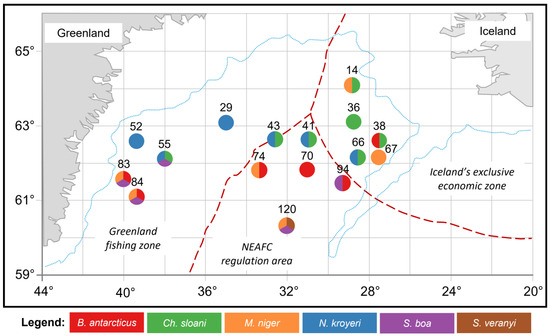
Figure 1.
Schematic map of the collection sites of the mesopelagic fishes (Notoscopelus kroyeri, Symbolophorus veranyi, Chauliodus sloani, Stomias boa, Malacosteus niger, and Borostomias antarcticus) in the Irminger Sea (North Atlantic).
Hydrophysical observations (water temperature, salinity, and hydrostatic pressure) were performed at the material collection sites using the Sea-Bird Electronics oceanographic complex, including the SBE-19plus V2 SEACATplus PROFILER SN 6376 CTD profiler with the SBE-33 control terminal. The average values of temperature and salinity for the study area were 4.67 °C and 34.92‰ and the variations were 3.64—6.64 °C and 34.87–35.01‰, respectively.
Sampling in the Irminger Sea was performed under the Agreement on Cooperation between the Federal Fisheries Agency of the Russian Federation and the Russian Academy of Sciences.
The tissue samples were stored at −20 °C until arriving at the laboratory. In the laboratory, the samples were homogenized with the addition of a mixture of chloroform/methanol (2:1) in a ratio of 1 to 10 and stored at −4 °C until extraction (the analysis was conducted quickly within 2–3 days). The extracted samples were dissolved in a mixture of chloroform/methanol (2:1) and stored at −20 °C.
2.2. Lipid Extraction
The total lipids (TLs) from muscle tissues were extracted using the Folch method with a mixture of chloroform/methanol (2:1 v/v) [40]. The vacuum evaporation was performed using a Hei-VAP Advantage ML/G3 rotary evaporator (Heidolph, Germany). The extracts were dissolved with chloroform/methanol (2:1 v/v) so that the sample concentration was 2.4 mg/mL.
2.3. Gas Chromatography
2.3.1. Fatty Acid Analysis of the Total Lipids
The qualitative and quantitative FA profiles of the TLs were analyzed using gas–liquid chromatography (GC) with a mass-selective detector (MS) and flame-ionized detector (FID), having previously subjected the TL mixtures to methylation [41]. To obtain the fatty acid methyl esters (FAMEs) from the TLs, 0.2 mL of a solution of TLs, 0.1 mL of an internal standard (behenic acid (22:0) (Sigma Aldrich, St. Louis, MO, USA) at a concentration of 2 mg/mL), 2 mL of methanol, and 0.2 mL of chlorate acetyl (CH3COCl) as a catalyst were added to a glass retort (Schott Duran, Mainz, Germany). The obtained solution was heated for 90 min at a fixed temperature of 70–80 °C. After methylation (followed by cooling), the hexane was poured in 5 mL for each sample. For phase separation, 2 mL of deionized water was poured into each glass retort and transferred into the separatory glass funnels for 15 min. FAMEs remain in the upper hexane layer while residue substances are concentrated in the lower aqueous phase. The hexane layer was evaporated using a rotary evaporator Hei-VAP Advantage HL/G3 (Heidolph, Schwabach, Germany) to collect pure FAMEs. Then, 2 mL of hexane for GC (Sigma Aldrich, St. Louis, MO, USA) was added to the collected FAMEs in glass retorts, and the gathered and final solutions were accumulated in GC vials for the following GC analysis. FAMEs were separated using GC with a mono-quadrupole mass-selective detector «α-Maestro» (Saitegra, Moscow, Russia) for the identification of FA constituents. The separation of FAs was carried out in a gradient thermal configuration (t°start = 140 °C—hold 5 min; increase in t° from 140 °C to 240 °C at a rate of 4 °C/min; and t°final = 240 °C—hold 2 min) with an HP-88 (60 m × 0.25 mm × 0.20 mkm) capillary column (Agilent Technologies, Santa Clara, USA) using helium as a mobile phase. FAMEs were detected in the SIM/SCAN mode: the SIM mode was used for searching for FAs according to the analytical standards with Supelco 37, Bacterial Acid Methyl Ester (BAME) Mix, and PUFA No.1 Marine source (Sigma Aldrich, St. Louis, USA); the SCAN mode was used for searching and identifying unique FAs with scan parameters of 50 to 400 m/z. The data were analyzed using «Maestro Analytic v. 1.025» software (Saitegra, Moscow, Russia) with the NIST library. An example of a chromatogram and identified FAs in the muscle tissue of S. boa are given in the Supplementary Material. Next, after the qualitative identification of FAs with GC-MS, the quantitative determination was carried out using GC-FID «Chromatek-Crystall-5000.2» (Chromatek, Yoshak-Ola, Russia). The separation of FAs was carried out for 32 min in a gradient thermal configuration (t°start = 140 °C—hold 5 min; increase in t° from 140 °C to 240 °C at a rate of 4 °C/min; and t°final = 240 °C—hold 2 min) with an HP-88 (60 m × 0.25 mm × 0.20 mkm) capillary column (Agilent Technologies, USA) using nitrogen as a mobile phase. The procedure for processing the results obtained with the software «Chromatek Analytic v. 3.0.298.1» (Chromatek, Yoshak-Ola, Russia) was described in [42]. The quantitative calculation of FAs was carried out by adding an internal standard to the samples (22:0). All GC parameters were identical between the GC-MS and GC-FID except for the mobile phase (helium and nitrogen, respectively).
2.3.2. Fatty Acid Analysis of the Individual Lipid Classes—Phospholipids, Triacylglycerols, and Cholesterol Esters and Waxes
The qualitative and quantitative fatty acid (FA) profiles of the lipid classes (phospholipids (PL), triacylglycerols (TAG), cholesterol esters + waxes) were analyzed using gas–liquid chromatography (GC or GLC, the applied abbreviation in this paper is GC) with a mass-selective detector (MS) and flame-ionized detector (FID), having previously subjected the TL mixtures to acid methylation [41]. The determination of certain lipid classes in TLs was carried out using high-performance thin-layer chromatography (HPTLC). The fractionation of total lipids was carried out on ultrapure glass-based plates (HPTLC Silicagel 60 F254 Premium Purity (Merck, Darmstadt, Germany)). The application of microvolumes of the samples (3 repetitions of 5 µL) was performed using a semi-automatic Linomat 5 applicator (CAMAG, Muttenz, Switzerland), and the separation of individual lipid classes was carried out using an ADC2 chromatographic chamber (CAMAG, Muttenz, Switzerland) in the solvent system hexane-diethyl ether-acetic acid (32:8:0.8, v/v) with a supersaturated zinc nitrate (ZnNO3 × 6H2O) solution for maintaining humidity (47–49% humidity) [43]. The qualitative identification of lipid classes was carried out according to the standards of the respective studied components (Sigma-Aldrich, Burlington, MA, USA). The lipid spots necessary for further analysis were scraped from the chromatographic plates into flasks (technical repetitions were combined into one sample), followed by the methylation procedure. The methylation procedure for individual lipid classes was identical to that of the methylation procedure for TLs (described in Section 2.3.1), except for the absence of an internal standard (behenic acid, 22:0) in the mixtures. The GC procedure was identical to that for the FAs in the TL analysis and is described in detail in Section 2.3.1.
Quantitative individual FAs in the samples were detected using the calibration method, wherein a Supelco 37 mixture (Sigma-Aldrich, St. Louis, MO, USA) with known concentrations was used as an external standard. The correction calibration factor (Ri) for the quantitative calculation of FAs not included in the Supelco 37 mixture was calculated using the formula [44]
where Mr is the molar mass of the internal standard FA (16:0), g/mol; ni is the number of carbon atoms in i FA; Mi is the molar mass of i FA, g/mol; and nr is the number of carbon atoms in the internal standard FA (16:0).
2.4. Statistical Analysis
The results were statistically processed using the R programming language (v. 4.2.2) in the «RStudio» integrated development environment with supplementary packages: «readxl» (v. 1.4.1), «tidyverse» (v. 1.3.2), «vegan» (v. 2.6-4), «cowplot» (v. 1.1.1), «cheatmap» (v. 1.0.12), «randomForest» (v. 4.7-1.1), and «statnet» (v. 2019.6). For each studied species, descriptive statistics were calculated (mean and error of the arithmetic mean, m ± se). Significant differences between groups were assessed using the nonparametric Wilcoxon–Mann–Whitney rank sum test [45]. The between groups/within group value variation ratio was estimated using the ANOSIM algorithm and the percentage similarity between groups with a SIMPER analysis. Species ordination in multidimensional space was performed by applying the non-metric multidimensional scaling (NMDS) algorithm to the investigated parameters. A multidimensional analysis of fatty acid composition was applied only to major physiologically valuable components contributing more than 1% to the total FA content [11]. The best metric of distances in the multidimensional attribute space was determined using Spearman’s coefficient of correlation between distance matrices. The measure of divergence between original and modeled distance matrices was estimated using the Stress index [46]. The impact of a complex of external abiotic environmental factors (temperature, salinity, and depth) on the fatty acid profiles of the studied species was assessed using a canonical correspondence analysis (CCA) [46]. The best metric of distances was also carried out using the Spearman coefficient. Machine learning was carried out using the Random Forest classification, and the mean decrease Gini coefficient was used to determine the significant classifiers [47,48]. A cluster analysis of the mesopelagic species based on the FA spectra was performed in Euclidian space [46].
This study was carried out at the Laboratory of Ecological Biochemistry and using the equipment of the Core Facility of the Karelian Research Centre of the Russian Academy of Sciences.
3. Results
In this study, the dominant FA family in the muscle tissues of all the fish species included in the study was MUFAs, accounting for 54.12% of total FAs in S. veranyi, 54.05% of total FAs in Ch. sloani, 59.46% of total FAs in M. niger, 57.81% of total FAs in S. boa, 46.50% of total FAs in B. antarcticus, and 42.94% of total FAs in N. kroyeri (Figure 2). The biggest shares within this group belonged to oleic (cis18:1(n-9)) acid (20.99, 21.87, 19.50, 21.07, 17.72, and 12.99% of total FAs, respectively) and to copepod biomarker FAs cis20:1(n-9) (8.19, 8.91, 10.47, 9.45, 9.08, and 8.32% of total FAs, respectively) and cis22:1(n-11) (11.46, 10.14, 13.33, 14.92, 9.01, and 11.04% of total FAs, respectively). In addition, the 22:1/20 index varied (1–1.40, 1.14, 1.27, 1.56, 0.99, and 1.33, respectively). Detritus biomarkers, the cis16:1(n-7) and cis18:1(n-7) FAs, contributed more than 1% to total FAs in the muscle tissues of all the fish species (5.73, 5.90, 6.68, 5.08, 3.53, and 2.36% of total FAs and 2.93, 2.53, 3.43, 2.57, 2.45, and 3.11% of total FAs, respectively). The content of cis22:1(n-9) in N. kroyeri, M. niger, and B. antarcticus was 1.47, 1.15, and 1.21% of total FAs. N. kroyeri additionally featured cis24:1(n-9), accounting for 1.49% of total FAs, whereas the contribution of this index in the rest of the species did not exceed 1% of total FAs. The fishes also contained minority MUFAs, with contributions in muscle tissues within 1% of total FAs (cis14:1(n-5), cis16:1(n-5), cis16:1(n-9), cis17:1(n-7), cis18:1(n-12), cis18:1(n-5), cis19:1(n-9), cis20:1(n-11), and cis20:1(n-7)) (Figure 3).
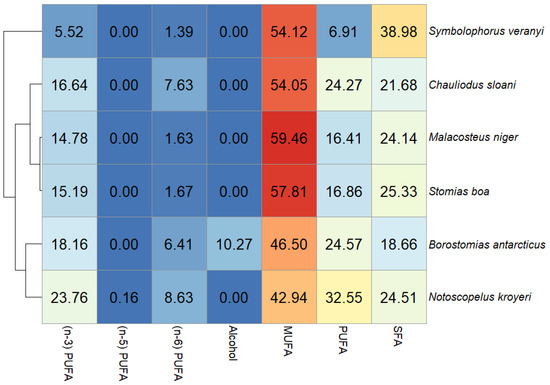
Figure 2.
Heat map of total fatty acid/alcohol content (% of total FAs) in muscle tissues of mesopelagic fishes (Notoscopelus kroyeri, Symbolophorus veranyi, Chauliodus sloani, Stomias boa, Malacosteus niger, and Borostomias antarcticus) inhabiting the 250–700-m depth gradient in the Irminger Sea (North Atlantic).
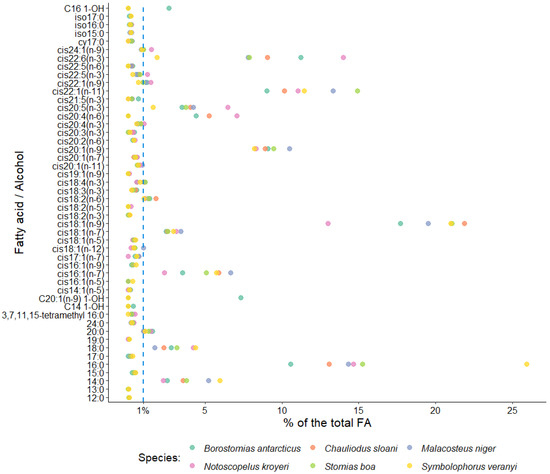
Figure 3.
Average levels of some fatty acids in muscle tissues of mesopelagic fishes (Notoscopelus kroyeri, Symbolophorus veranyi, Chauliodus sloani, Stomias boa, Malacosteus niger, and Borostomias antarcticus) across the depth gradient in the Irminger Sea (North Atlantic).
Polyunsaturated and saturated FAs (PUFAs and SFAs, respectively) constituted the second quantitatively biggest group in muscle tissues, with one or the other family prevailing depending on the species (Figure 2). A dominance of SFAs was detected in S. boa (25.33% of total FAs), M. niger (24.14% of total FAs), and S. veranyi (38.98% of total FAs), with the main FA in this group being palmitic 16:0 FA (15.26, 14.33, and 25.92% of total FAs). The species in which the PUFA family prevailed (Ch. sloani (24.27% of total FAs); N. kroyeri (32.55% of total FAs); and B. antarcticus (24.57% of total FAs)) also exhibited a dominance of 16:0 FAs among the SFAs, with contributions of 13.07, 14.66, and 10.57% of total FAs, respectively. All the species also contained significant amounts of 14:0 (3.78, 5.23, 5.95 and 3.55, 2.26, and 2.53% of total FAs, respectively) and 18:0 FAs (3.15, 1.73, 4.37 and 2.33, 4.23, and 2.78% of total FAs, respectively). The quantities of the 20:0 FAs in 5 of the studied species were 1.10 (in S. veranyi), 1.57 (in B. antarcticus), 1.47 (in N. kroyeri), 1.33 (in S. boa), and 1.04% (in Ch. sloani) of total FAs, while in M. niger this acid contributed no more than 1% of total FAs in muscle tissues. SFAs with contributions to total FAs not exceeding 1% were also identified: 12:0, 13:0, 15:0, 17:0, 19:0, 24:0, 3,7,11,15-tetramethyl 16:0, cy17:0, iso15:0, iso16:0, and iso17:0 (Figure 3).
The dominant PUFA family was n-3 PUFAs, but their quantities varied significantly across the species, accounting for 5.52% of total FAs in S. veranyi, 16.64% of total FAs in Ch. sloani, 14.78% of total FAs in M. niger, 15.19% of total FAs in S. boa, 18.16% of total FAs in B. antarcticus, and 23.76% of total FAs in N. kroyeri. The main n-3 PUFAs in the studied species were the physiologically significant eicosapentaenoic (cis20:5(n-3)) and docosahexaenoic (cis22:6(n-3)) acids, their content in muscles being 3.76 and 7.89% of total FAs in S. boa, 4.24 and 7.80% of total FAs in M. niger, 4.03 and 9.04% of total FAs in Ch. sloani, 3.51 and 11.22% of total FAs in B. antarcticus, 6.47 and 13.97% of total FAs in N. kroyeri, and 1.62 and 1.88% of total FAs in S. veranyi. A total of 3 of the species (S. boa, M. niger, and Ch. sloani) contained significant amounts of the cis18:4(n-3) FA (1.09, 1.10, and 1.01% of total FAs, respectively), and N. kroyeri contained cis20:4(n-3) and cis22:5(n-3) (1.03 and 1.24% of total FAs, respectively) in muscle tissues, while the contents of these acids in the rest of the species were minor (<1% of total FAs). Other fatty acids identified in the n-3 PUFA family were cis18:2(n-3), cis18:3(n-3), cis20:3(n-3), and cis21:5(n-3), but their levels in muscles were below 1% of total FAs (Figure 3).
The contributions of another major PUFA family—n-6 PUFAs—were 1.39% of total FAs in S. veranyi, 7.63% of total FAs in Ch. sloani, 1.63% of total FAs in M. niger, 1.67% of total FAs in S. boa, 6.41% of total FAs in B. antarticus, and 8.63% of total FAs in N. kroyeri. Dominance among n-6 PUFAs belonged to linoleic (cis18:2(n-6)) FA (1.01, 1.80, 1.27, 1.31, 1.40, and 1.11% of total FAs, respectively). However, it is worth noting a significant prevalence of arachidonic (cis20:4(n-6)) acid in Ch. sloani (5.25% of total FAs), B. antarcticus (4.42% of total FAs), and N. kroyeri (7.08% of total FAs), as opposed to its meager amounts in the other 3 species (<<1% of total FAs). In addition, minor concentrations of the cis20:2(n-6) and cis22:5(n-6) FAs were detected (Figure 3). The ratio of n-3 PUFAs to n-6 PUFAs (n-3/n-6 index = 3.97 (S. veranyi), 2.18 (Ch. sloani), 9.07 (M. niger), 9.10 (S. boa), 2.83 (B. antarcticus), and 2.75 (N. kroyeri)) proved to generate species groups identical to the results of clustering for all totaled FA families (Figure 2, left).
Substantial accumulation of long-chain alcohols (10.27% of total FAs) was detected in the muscle tissues of B. antarcticus, while the rest of the species did not contain these compounds. In turn, N. kroyeri uniquely featured the cis18:2(n-5) FA (0.16% of total FAs).
The statistical analysis of similarities (ANOSIM) in the quantities of individual FA components in muscle tissues revealed reliable differences between the species (R = 0.6061; p-value = 0.001). The application of the multidimensional statistical analysis (non-metric multidimensional scaling, NMDS) revealed the specific patterns of FA accumulation in each species (Figure 4). Thus, S. veranyi, M. niger, S. boa, and Ch. sloani tended to accumulate more MUFAs in muscle tissues, in particular, cis16:1(n-7), cis18:1(n-9), cis18:1(n-7), cis20:1(n-9), and cis22:1(n-11), whereas N. kroyeri and B. antarcticus were more predisposed to accumulate the structural cis20:5(n-3), cis22:6(n-3), and cis20:4(n-6), as well as long-chain alcohols (in B. antarcticus). The application of the similarity percentage analysis (SIMPER) confirmed that cis22:6(n-3) contributed the most (74.31%) to the average intergroup similarity between N. kroyeri and B. antarcticus, whereas the most characteristic features of the overlaps of Ch. sloani, S. boa, and M. niger in the multidimensional space were cis22:1(n-11) (68.28–83.74% similarity), cis18:1(n-9) (54.94–70.50% similarity), and cis20:1(n-9) (31.56–52.57% similarity). The greatest contributions to average intergroup percentage similarities between S. veranyi and the rest of the species were made by 16:0 (62.78–76.55% similarity) and cis22:6(n-3) (55.07–81.91% similarity). It is worth noting that a major contribution to intergroup similarities between members of the family Myctophidae (N. kroyeri and S. veranyi) was made by cis18:1(n-9) (53.10% similarity).
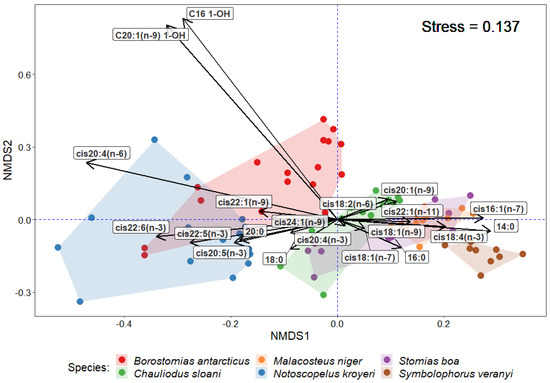
Figure 4.
NMDS ordination of some fatty acids in muscle tissues of mesopelagic fishes (Notoscopelus kroyeri, Symbolophorus veranyi, Chauliodus sloani, Stomias boa, Malacosteus niger, and Borostomias antarcticus) across the depth gradient in the Irminger Sea (North Atlantic).
To determine the changes in the qualitative and quantitative FA compositions of cell membranes across the depth gradient and to assess the effects of abiotic environmental impacts (temperature, salinity, and hydrostatic pressure), the FA profiles of the structural PL fractions were investigated. Having applied the parameter of variable importance for classification with the Random Forest machine learning algorithm, it was found that in all the studied species (excluding S. veranyi, which was captured only at a 375 m depth) an increase in depth caused a significant change in the quantities of cis18:1(n-9) (3.26–6.15 µg/mL in S. boa, 1.30–1.64 µg/mL in N. kroyeri, 4.49–0.29 µg/mL in M. niger, 0.49–0.41 µg/mL in Ch. sloani, and 0.32–0.11 µg/mL in B. antarcticus), cis22:6(n-3) (0.38–0.70, 1.14–1.46, 1.00–0.24, 0.26–0.22, and 0.28–0.10 µg/mL, respectively), cis20:3(n-6) (0.53–0.81, 0.36–0.07, 0.69–0.04, 0.07–0.04, and 0.09–0.00 µg/mL, respectively), 16:0 (3.76–6.17, 2.93–2.98, 4.53–0.74, 1.26–1.35, and 1.12–0.96 µg/mL, respectively), and 18:0 FAs (0.72–1.21, 0.79–0.74, 0.76–0.08, 0.04–0.14, and 0.11–0.07 µg/mL, respectively) (Figure 5). A significant change with depth in N. kroyeri and S. boa was observed for cis20:5(n-3) (with variation ranges of 0.32–0.39 and 0.12–0.32 µg/mL, respectively) and cis24:1(n-9) (with variation ranges of 0.02–0.34 and 0.12–0.30 µg/mL, respectively), while Ch. sloani, M. niger, N. kroyeri, and S. boa exhibited variations in cis20:4(n-6) in muscle tissues across the depth gradient (0.00–0.09, 2.97–0.14, 0.37–0.17, and 3.95–6.39 µg/mL, respectively). In S. boa, substantial depth-related concentration variations were detected for cis16:1(n-7) (0.83–1.32 µg/mL), cis18:1(n-7) (0.50–0.87 µg/mL), and cis20:1(n-9) (1.43–3.01 µg/mL); the latter FA also varied in M. niger (2.16–0.00 µg/mL).
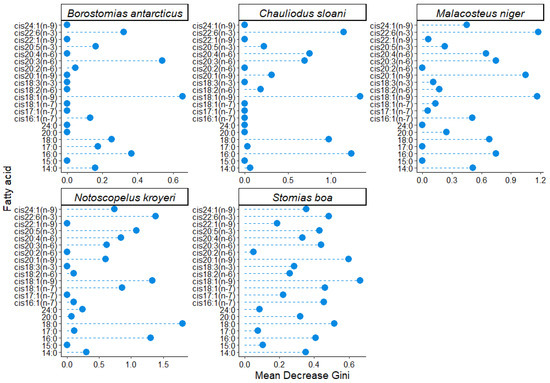
Figure 5.
Gini coefficient values obtained using a machine learning (RandomForest) algorithm for individual fatty acids in the fraction of structural phospholipids in muscle tissues of mesopelagic fishes (Notoscopelus kroyeri, Symbolophorus veranyi, Chauliodus sloani, Stomias boa, Malacosteus niger, and Borostomias antarcticus) across the depth gradient in the Irminger Sea (North Atlantic).
Having applied the canonical correspondence analysis (CCA), it was found that a rise in temperature and salinity entailed a reduction in the concentrations of FA components in muscle tissues, excluding the rise in the concentration of the 18:0 FA in Ch. sloani and B. antarcticus (from 0.04 to 0.14 and from 0.07 to 0.11 µg/mL, respectively) (Figure 6). A noteworthy distinctive feature of these 2 fish species was a rise in the content of the cis20:1(n-9) FA (from 0.00 to 0.02 µg/mL) in Ch. sloani and an increase in the concentration of the cis20:2(n-6) FA (from 0.00 to 0.01 µg/mL) in B. antarcticus in PL molecules under a comparatively higher temperature and salinity. The concentrations of individual FAs proved to increase depth-wise in all the studied fish species.
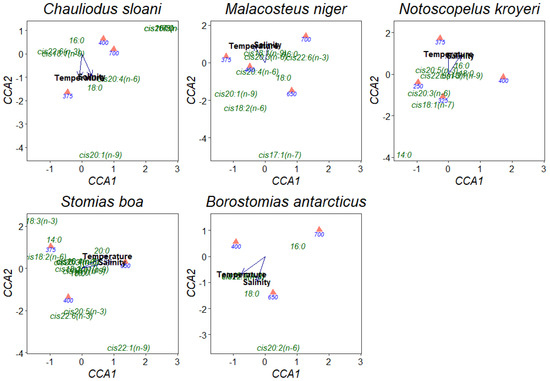
Figure 6.
Canonical correspondence analysis (CCA) ordination of the effects of abiotic environmental impacts (temperature and salinity) on individual fatty acids in phospholipids in muscle tissues of mesopelagic fishes (Notoscopelus kroyeri, Symbolophorus veranyi, Chauliodus sloani, Stomias boa, Malacosteus niger, and Borostomias antarcticus) across the depth gradient in the Irminger Sea (North Atlantic).
To comparatively evaluate the trophic relationships of the studied fish species, the FA profiles of the storage TAG fractions were analyzed. The statistical analysis of similarities, ANOSIM, revealed differences between species with some overlaps (R = 0.2829; p-value = 0.001). Pairwise comparisons using this method identified individual variations in between-species similarities (Figure 7). Similar (R < 0.01) species regarding the quantitative ratios of individual FAs in the storage TAG fractions were Ch. sloani vs S. boa (R = −0.0343), Ch. sloani vs M. niger (R = 0.0163), S. boa vs M. niger (R = 0.0942), and S. boa vs N. kroyeri (R = 0.0914), whereas R values for the rest of the pairwise comparisons ranged within 0.1514—0.7683 (from “similar with some differences (high overlap)” to “highly different”). The cluster analysis confirmed the differentiation of species into two groups: group 1 including N. kroyeri, Ch. sloani, M. niger, and S. boa; group 2 including B. antarcticus and S. veranyi (Figure 8). In all the species, the main FAs within TAGs were 16:0 (4.74–8.96 µg/mL), cis16:1(n-7) (0.94–2.52 µg/mL), cis18:1(n-9) (3.89–8.62 µg/mL), cis18:1(n-7) (0.49–1.93 µg/mL), cis20:1(n-9) (1.58–5.20 µg/mL), and cis22:1(n-11) (1.73–10.20 µg/mL). At the same time, the concentrations of these FAs in muscle tissues were higher in the species of group 1 on average compared with those of group 2. Prevalence of the 14:0, 15:0, 17:0, 20:0, cis18:2(n-6), cis20:1(n-11), cis20:1(n-7), cis20:4(n-3), cis20:5(n-3), cis22:5(n-3), cis22:6(n-3), and cis24:1(n-9) FAs were also found in group 1 versus group 2.
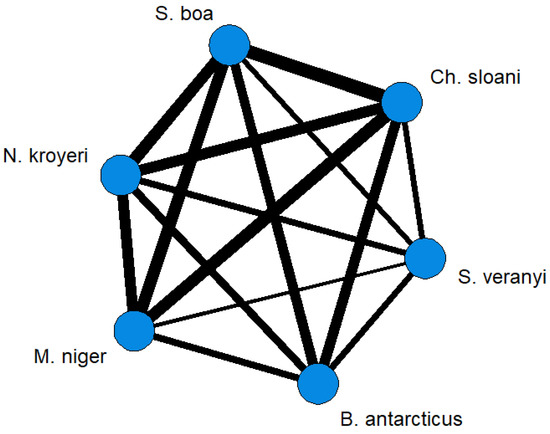
Figure 7.
Network graphs based on pairwise comparisons (ANOSIM) between mesopelagic fishes (Stomias boa, Malacosteus niger, Chauliodus sloani, Borostomias antarcticus, and Notoscopelus kroyeri) across the depth gradient in the Irminger Sea (North Atlantic). Note: the “thicker” the line is connecting two species, the “stronger” the relationship is (lower R in pairwise ANOSIM comparisons between species).
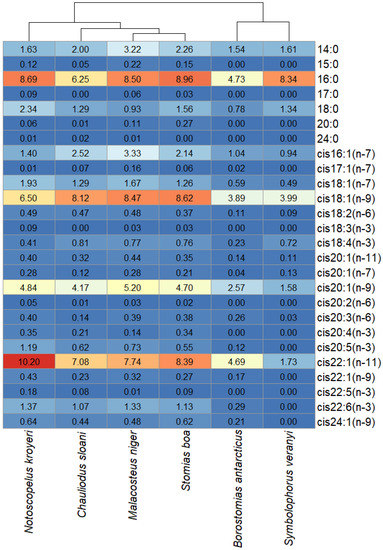
Figure 8.
Heat map with species clustered by the quantitative contents (µg/mL) of individual fatty acids in storage triacylglycerols in mesopelagic fishes (Stomias boa, Malacosteus niger, Chauliodus sloani, Borostomias antarcticus, and Notoscopelus kroyeri) across the depth gradient in the Irminger Sea (North Atlantic).
Having analyzed the FA profiles of the combined cholesterol esters and waxes fractions, it was found that the muscle tissues of B. antarcticus and S. boa accumulated comparatively high amounts of cis18:1(n-9) (3.45 and 3.27 µg/mL, respectively), cis20:1(n-9) (2.17 and 1.55 µg/mL, respectively), and cis22:1(n-11) (2.35 and 2.82 µg/mL, respectively), whereas the concentrations of these acids in the rest of the species did not exceed 1 µg/mL (except for cis18:1(n-9) in M. niger, which had a concentration of 1.11 µg/mL) (Figure 9). The distinction between S. boa and B. antarcticus was the presence of cis17:1(n-7) in the cholesterol esters and waxes fraction in the muscle tissues of the latter (1.21 µg/mL).
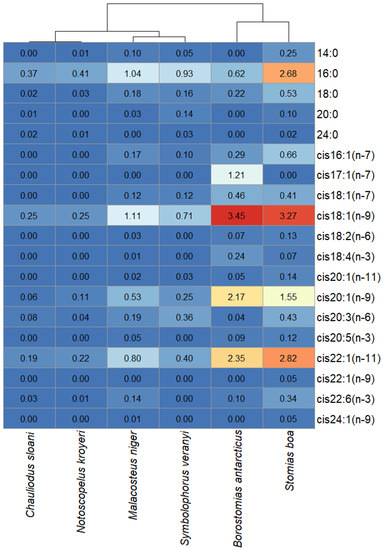
Figure 9.
Heat map with species clustered by the quantitative contents (µg/mL) of individual fatty acids in the combined cholesterol esters and waxes fractions in mesopelagic fishes (Stomias boa, Malacosteus niger, Chauliodus sloani, Borostomias antarcticus, and Notoscopelus kroyeri) across the depth gradient in the Irminger Sea (North Atlantic).
4. Discussion
Mesopelagic fishes, one of the most abundant and widespread groups of organisms in the “twilight zone” of the World Ocean, make up approximately 20 Gt of the total biomass according to different estimates, which is roughly equivalent to a 100-fold total annual global catch [2,49]. Species inhabiting the 200–1000-m depth range and occupying different positions in the trophic web play an important role in the processes of matter transformation and transfer between layers of the ocean [50,51,52,53,54]. The most common and significant members of the mesopelagic fish fauna are the Myctophidae and Stomiidae families, in which most species perform diurnal vertical migrations [30,55,56]. Being the most labile and “sensitive” lipidic components, fatty acids are the organisms’ main structural and energetic molecules, directly involved in the development of compensatory responses to external impacts (temperature, salinity, hydrostatic pressure, etc.) and in carbon cycling between water layers [10,12]. The species-specificity of the qualitative and quantitative characteristics of the FA profiles (including their minority components) of the muscle tissues in the studied mesopelagic fishes indicate differentiations between taxa in dietary specializations, life cycles, vertical migration abilities, as well as the mechanisms and strategies of biochemical adaptation to extreme environments, but at the same time, the species share certain characteristics [11,12,14,57,58]. Thus, a known feature of fishes of the Myctophidae family is high MUFA content in muscle tissues, which is mainly associated with their diet [59,60]. In our study, however, MUFAs dominated in all six species, especially in two species of the Stomiidae family (M. niger and S. boa). The greatest share among all the MUFAs identified belonged to oleic, cis18:1(n-9), acid, which acts as the main source of energy in the fish organism. However, the accumulation of this acid together with cis18:1(n-7) may point to the carnivory behaviors of the species [61,62]. This supposition is in agreement with the comparatively high content of FA biomarkers of copepods of the genus Calanus (cis20:1(n-9) and cis22:1(n-11) FAs) in muscle tissues of all the species, corroborating the previously published results regarding the food items consumed by these species detected via studying stomach content [30,63,64,65,66,67]. Noteworthy are the differences in the 22:1/20:1 index, around which two groups of species are formed, B. antarcticus on the one hand and M. niger, S. veranyi, Ch. sloani, S. boa, and N. kroyeri on the other. According to some studies [68,69], the 22:1 to 20:1 FA ratio values corresponding to >1, <1, or =1 point to one of the three common species of copepods living in northern latitudes: Calanus hyperboreus, C. glacialis, or C. finmarchicus, respectively. Our results suggest that the diet of B. antarcticus is dominated by C. glacialis, whereas the main copepod in the diet of the rest of the five species is C. hyperboreus. At the same time, a significant content of long-chain alcohols in B. antarcticus was detected, which are most probably passed up the trophic web from copepods rich in waxes and fatty alcohols [68,70,71]. Further indirect evidence of the carnivory behaviors of the species is the trace amounts of the 3,7,11,15-tetramethyl 16:0 FA (phytanic acid) detected in their muscle tissues (excluding S. veranyi), which suggests that the position of the species in the trophic web is not lower than level II consumers, since phytanic acid is formed from phytol (a constituent of chlorophyll) and stored within lipids [72]. It is known that some copepod species feed on phytoplankton [73].
A detailed analysis of FAs in the storage TAG fractions and the statistical analysis showed that some of the species (Ch. sloani, S. boa, M. niger, and N. kroyeri) have common dietary features, whereas the remaining two species—B. antarcticus and S. veranyi—differ reliably, in particular, regarding the concentrations of individual FAs within TAGs. The most probable explanation is the foraging intensity and abundance of food resources in the areas inhabited by these species [69]. The high 16:0 FA content in TAGs may be evidence of a trophic connection to euphausiids [67,74,75]. The significant content of cis16:1(n-7) and cis18:1(n-7) (above 1 µg/mL in the TAG fraction or above 1% of total FAs in TLs) in the samples may also point to the consumption of small amounts of hyperiids of the genera Themisto and Parathemisto, which feed on mesozooplankton, as well as on detritus, as confirmed by the finding of biomarker FAs of bacterial origin (iso15:0, iso16:0, iso17:0, and cy17:0) in muscle tissues [65,76]. The content of cis18:4(n-3) in S. boa, M. niger, and Ch. sloani muscle tissues may indicate the consumption of dinoflagellates [77].
A special highlight is the differences detected in the accumulation of FAs in muscle tissues of the studied mesopelagic fishes. Most animals are known to obtain essential unsaturated FAs only from the food they consume since they lack the necessary desaturases and have limited levels of long-chain FA (with 20 and more carbon atoms) synthesis through elongation [14,16]. Thus, the accumulation of cis20:5(n-3), cis22:6(n-3), and cis20:4(n-6) in N. kroyeri and B. antarcticus in our samples may point to a higher trophic level, as well as to more active feeding as compared with the rest of the species [78].
The detected dominance of essential “omega-3” PUFAs (especially cis20:5(n-3) and cis22:6(n-3)) over “omega-6” PUFAs under extremely high hydrostatic pressures and low temperatures indicates one of the mechanisms for controlling cell membrane rigidity in the organisms’ compensatory response designed to generate optimal conditions for the functioning of membrane-bound enzyme systems [24,26,27]. It is known that n-3 and n-6 PUFAs shape the inner structure of biomembranes and that regulation of their physicochemical state directly depends on the n-3/n-6 PUFA ratio [79]. Such regulation in mesopelagic organisms living in northern latitudes is mainly affected by n-3 PUFA adjustments [31,32]. In this study, however, Ch. sloani, B. antarcticus, and N. kroyeri exhibited a comparatively low content of n-6 PUFAs in muscle tissues, which significantly influenced the n-3/n-6 PUFA ratio, and it can be concluded that these species have used other compensatory mechanisms to regulate membrane fluidity, in particular, accumulation of arachidonic acid, cis20:4(n-6).
Alterations in cis20:5(n-3) and cis22:6(n-3) contents in cell membranes are known to target the rearrangement of their physicochemical states and to be directly related to an organism’s locomotor activity, especially in vertically migrating species [11,31,42,80,81,82]. The concentrations of FAs (especially unsaturated FAs) in the fishes in our study increased under lower temperatures and salinity at greater depths. This finding is corroborated by studies on the molecular adaptations of organisms exposed to extreme abiotic impacts [24,27]. Furthermore, a rise was observed in the concentration of the 18:0 FA accompanying increases in temperature and salinity at lower depths in Ch. sloani and B. antarcticus, suggesting they may use a compensatory mechanism of elevating the saturation degree of membrane PLs at relatively small depths. On the other hand, there were some differences between Ch. sloani and B. antarcicus, such that upon reaching higher water layers, Ch. sloani accumulated more MUFAs in membrane PLs (cis20:1(n-9)), whereas additional membrane rearrangement in B. antartcicus was provided by n-6 PUFAs (cis20:2(n-6)). This fact corroborates and expands the conclusion drawn from data on the n-3/n-6 PUFA ratio that these species have a compensatory response other than the mechanism of adjusting n-3 PUFA content in cell membranes employed by aquatic organisms in northern latitudes.
The application of a machine learning algorithm revealed a significant (although oppositely directed) depth-related change in the content of cis18:1(n-9) within membrane PLs in all the species. This acid is not only a source of energy in the fish organism but is also involved in the adaptive response to temperature and pressure changes through modification of its content in the PL fraction [83,84,85]. The amount of cis18:1(n-9) in membrane PLs increased with depth in S. boa and N. kroyeri and declined in the rest of the species. Variations in the 18:1 FA are a known mechanism of adaption to living at great depths [86]. The significant changes detected in all the species in SFA (16:0 and 18:0) content in membrane PLs are a consequence of the involvement of these molecules in the lipid bilayer of cell membranes under the impact of lower hydrostatic pressure at smaller depths [27,87].
A characteristic feature of mesopelagic organisms is the ability to perform circadian vertical migrations [4,5,58]. Such vertical migrants are characterized by an accumulation of waxes and cholesterol esters in muscle tissues [88,89]. According to the literature, N. kroyeri and S. veranyi are vertical migrants, while Ch. sloani, S. boa, and B. antarcticus have been reported to have ontogenetic spatial variation in vertical distribution (vertical semi-migrants) [30,65,66,67,90,91]. In our study, FA build-up in the combined cholesterol esters and waxes fraction was detected in the vertical migrants B. antarcticus and S. boa, but there was no significant accumulation in the rest of the species. In all likelihood, Ch. sloani, N. kroyeri, and S. veranyi use other mechanisms for maintaining adequate buoyancy in the water column. Another fact to be noted is the build-up of cis18:1(n-9) in the vertically non-migratory M. niger, which is most likely associated with energy-related processes in the organism, such as the accumulation of FAs in the form of cholesterol esters.
5. Conclusions
In this study, the FA profiles of members of the two most widespread fish families in the mesopelagic zone of the Irminger Sea (Stomiidae and Myctophidae) revealed species-specific qualitative and quantitative differences in the accumulation of individual FAs and long-chain alcohols and in the patterns of these changes across the depth gradient associated with the use of different mechanisms of compensatory adaptations to the extreme environment (high hydrostatic pressure, low temperatures, specific photoperiod, etc.). Differences were detected in the mechanisms of membrane physicochemical state adjustment between Ch. sloani, B. antarcticus, and N. kroyeri versus S. boa, S. veranyi, and M. niger, involving elevations of n-6 and n-3 PUFAs in cell membrane PLs, respectively. At relatively small depths, on the other hand, all the species maintained optimal membrane fluidity by accumulating SFAs in the PL fraction. Putative differences were revealed in the mechanisms of maintaining adequate buoyancy in vertically migrating species, including the accumulation of FAs in cholesterol ester and wax molecules in B. antarcticus and S. boa and their absence in Ch. sloani, S. veranyi, and N. kroyeri. Similarities and differences were noted in the diets of the studied fish species. The main food item for all species was crustaceans of the genus Calanus, but the compositions of the species consumed varied; C. glacialis predominated in B. antarcticus and C. hyperboreus prevailed in others. N. kroyeri and B. antarcticus proved to occupy a higher trophic level than other species. Nonetheless, all the species were shown to be at least level II consumers.
Supplementary Materials
The following supporting information can be downloaded at: https://www.mdpi.com/article/10.3390/d15020166/s1, Figure S1: An example of a chromatogram and the identified FAs of the muscle tissue of Stomias boa using the gas chromatography method with mass-selective detection (GC-MS).
Author Contributions
Conceptualization, S.A.M.; methodology, S.A.M., V.P.V. and D.V.A.; software, S.A.M. and V.P.V.; validation, V.P.V. and S.A.M.; formal analysis, V.P.V.; investigation, S.A.M. and V.P.V.; resources, V.P.V., D.V.A., A.M.O. and S.A.M.; data curation, V.P.V. and S.A.M.; writing—original draft preparation, V.P.V. and S.A.M.; writing—review and editing, D.V.A. and A.M.O.; visualization, V.P.V.; supervision, S.A.M.; project administration, S.A.M. and A.M.O.; funding acquisition, S.A.M. All authors have read and agreed to the published version of the manuscript.
Funding
This research was funded by the Presidential Grant for Young Doctors of Science MD-5761.2021.1.4 and in the frame of the State Order to KarRC RAS FMEN-2022–0006.
Institutional Review Board Statement
This study was conducted according to the guidelines of the Declaration of Helsinki and approved by the Institutional Review Board (or Ethics Committee) of the Institute of Biology KarRC RAS (protocol code 017, 27 May 2022).
Data Availability Statement
All data are presented in the paper.
Conflicts of Interest
The authors declare no conflict of interest.
References
- Irigoien, X.; Klevjer, T.A.; Røstad, A.; Martinez, U.; Boyra, G.; Acuña, J.L.; Bode, A.; Echevarria, F.; Gonzalez-Gordillo, J.I.; Hernandez-Leon, S.; et al. Large mesopelagic fishes biomass and trophic efficiency in the open ocean. Nat. Commun. 2014, 5, 3271. [Google Scholar] [CrossRef] [PubMed]
- Hidalgo, M.; Browman, H.I. Developing the knowledge base needed to sustainably manage mesopelagic resources. ICES J. Mar. Sci. 2019, 76, 609–615. [Google Scholar] [CrossRef]
- Aumont, O.; Maury, O.; Lefort, S.; Bopp, L. Evaluating the potential impacts of the diurnal vertical migration by marine organisms on marine biogeochemistry. Glob. Biogeochem. Cycles 2018, 32, 1622–1643. [Google Scholar] [CrossRef]
- Salvanes, A.G.V.; Kristoffersen, J.B. Mesopelagic Fishes; Academic Press: Cambridge, MA, USA, 2001; pp. 1711–1717. [Google Scholar]
- Catul, V.; Gauns, M.; Karuppasamy, P.K. A review on mesopelagic fishes belonging to family Myctophidae. Rev. Fish Biol. Fish 2011, 21, 339–354. [Google Scholar] [CrossRef]
- Tocher, D.R.; Bell, J.G.; Dick, J.R.; Henderson, R.J.; McGhee, F.; Michell, D.; Morris, P.C. Polyunsaturated fatty acid metabolism in Atlantic salmon (Salmo salar) undergoing parr-smolt transformation and the effects of dietary linseed and rapeseed oils. Fish Physiol. Biochem. 2000, 23, 59–73. [Google Scholar] [CrossRef]
- Arts, M.T.; Kohler, C.C. Health and conditions in fish: The influence of lipids on membrane competency and immune response. In Lipids in Aquatic Ecosystems; Arts, M.T., Brett, M.T., Kainz, M.J., Eds.; Springer: Heidelberg, Germany; Dordrecht, The Netherlands; London, UK; New York, NY, USA, 2009; pp. 237–257. [Google Scholar]
- Shillito, B.; Desurmont, C.; Barthélémy, D.; Farabos, D.; Després, G.; Ravaux, J.; Zbinden, M.; Lamazière, A. Lipidome variations of deep-sea vent shrimps according to acclimation pressure: A homeoviscous response? Deep-Sea Res. Part I Oceanogr. Res. Pap. 2020, 161, 103285. [Google Scholar] [CrossRef]
- Kreps, E.M. Lipids of Cellular Membranes. Evolution of Brain Lipids. Adaptive Function of Lipids; Nauka: St. Petersburg, Russia, 1981; p. 339. [Google Scholar]
- Ashjian, C.J.; Campbell, R.G.; Welch, H.E.; Butler, M.; Van Keuren, D. Annual cycle in abundance, distribution, and size in relation to hydrography of important copepod species in the western Arctic Ocean. Deep Sea Res. Part I Oceanogr. Res. Pap. 2003, 50, 1235–1261. [Google Scholar] [CrossRef]
- Petursdottir, H.; Gislason, A.; Falk-Petersen, S. Lipid classes and fatty acid composition of muscle, liver and skull oil in deep-sea redfish Sebastes mentella over the Reykjanes Ridge. J. Fish Biol. 2008, 73, 2485–2496. [Google Scholar] [CrossRef]
- Petursdottir, H.; Gislason, A.; Falk-Petersen, S.; Hop, H.; Svavarsson, J. Trophic interaction of the pelagic ecosystem over the Reykjanes Ridge as evaluated by fatty acid and stable isotope analyses. Deep-Sea Research. Part II 2008, 55, 83–93. [Google Scholar] [CrossRef]
- Graeve, M.; Kattner, G.; Piepenburg, D. Lipids in Arctic benthos: Does the fatty acid and alcohol composition reflect feeding and trophic interactions? Polar Biol. 1997, 18, 53–61. [Google Scholar] [CrossRef]
- Tocher, D.R. Metabolism and functions of lipids and fatty acids in teleost fish. Rev. Fish. Sci. 2003, 11, 107–184. [Google Scholar] [CrossRef]
- Mayzaud, P.; Chevallier, J.; Tavernier, E.; Moteki, M.; Koubbi, P. Lipid composition of the Antarctic fish Pleuragramma antarcticum. Influence of age class. Polar Sci. 2011, 5, 264–271. [Google Scholar] [CrossRef]
- Krutetskaya, Z.I.; Lebedev, O.E. Arachidonic acid and its products: Pathways of formation and metabolism in cells. Cell Tissue Biol. 1993, 35, 3–27. [Google Scholar]
- Ghioni, C.; Tocher, D.R.; Bell, M.V.; Dick, J.R.; Sargent, J.R. Low C18 to C20 fatty acid elongase activity and limited conversion of stearidonic acid, 18: 4 (n–3), to eicosapentaenoic acid, 20: 5 (n–3), in a cell line from the turbot, Scophthalmus maximus. Biochim. Biophys. Acta (BBA)-Mol. Cell Biol. Lipids 1993, 1437, 170–181. [Google Scholar] [CrossRef]
- Sergeeva, M.G.; Varfolomeeva, A.T. Arachidonic Acid Cascade; Public education: Moscow, Russia, 2006; p. 256. [Google Scholar]
- Boldyrev, A.A.; Kyayvaryainen, E.I.; Ilyukha, V.A. Biomembranology: A Textbook; KarRC RAS: Petrozavodsk, Russia, 2006; p. 226. [Google Scholar]
- Bell, M.V.; Dick, J.R.; Porter, A.E.A. Biosynthesis and tissue deposition of docosahexaenoic acid (22:6n−3) in rainbow trout (Oncorhynchus mykiss). Lipids 2001, 36, 1153–1159. [Google Scholar] [CrossRef]
- Bell, M.V.; Dick, J.R.; Kelly, M.S. Biosynthesis of eicosapentaenoic acid in the sea urchin Psammechinus miliaris. Lipids 2001, 36, 79–82. [Google Scholar] [CrossRef]
- Monroig, Ó.; Rotllant, J.; Sánchez, E.; Cerdá-Reverter, J.M.; Tocher, D.R. Expression of long-chain polyunsaturated fatty acid (LC-PUFA) biosynthesis genes during zebrafish Danio rerio early embryogenesis. Biochim. Biophys. Acta (BBA)-Mol. Cell Biol. Lipids 2009, 1791, 1093–1101. [Google Scholar] [CrossRef]
- Monroig, O.; Tocher, D.R.; Castro, L.F.C. Polyunsaturated fatty acid biosynthesis and metabolism in fish. In Polyunsaturated Fatty Acid Metabolism; AOCS Press: Urbana, IL, USA, 2018; pp. 31–60. [Google Scholar]
- Hazel, J.R. Thermal adaptation in biological membranes: Is homeoviscous adaptation the explanation? Annu. Rev. Physiol. 1995, 57, 19–42. [Google Scholar] [CrossRef]
- Hulbert, A.J. The under-appreciated fats of life: The two types of polyunsaturated fats. J. Exp. Biol. 2021, 224, jeb232538. [Google Scholar] [CrossRef]
- Biederman, A.M.; O’Brien, K.M.; Crockett, E.L. Homeoviscous adaptation occurs with thermal acclimation in biological membranes from heart and gill, but not the brain, in the Antarctic fish Notothenia coriiceps. J. Comp. Physiol. B 2021, 191, 289–300. [Google Scholar] [CrossRef]
- Macdonald, A. Life at High Pressure; Springer International Publishing: Cham, Switzerland, 2021; 445p. [Google Scholar]
- Olsen, R.E.; Strand, E.; Melle, W.; Nørstebø, J.T.; Lall, S.P.; Ringø, E.; Tocher, D.R.; Sprague, M. Can mesopelagic mixed layers be used as feed sources for salmon aquaculture? Deep Sea Res. Part II Top. Stud. Oceanogr. 2020, 180, 104722. [Google Scholar] [CrossRef]
- Yang, Z.H.; Emma-Okon, B.; Remaley, A.T. Dietary marine-derived long-chain monounsaturated fatty acids and cardiovascular disease risk: A mini review. Lipids Health Dis. 2016, 15, 201. [Google Scholar] [CrossRef] [PubMed]
- Eduardo, L.N.; Lucena-Frédou, F.; Mincarone, M.M.; Soares, A.; Loc’h, L.; Frédou, T.; Ménard, F.; Bertrand, A. Trophic ecology, habitat, and migratory behaviour of the viperfish Chauliodus sloani reveal a key mesopelagic player. Sci. Rep. 2020, 10, 20996. [Google Scholar] [CrossRef] [PubMed]
- Voronin, V.P.; Nemova, N.N.; Ruokolainen, T.R.; Artemenkov, D.V.; Rolskii, A.Y.; Orlov, A.M.; Murzina, S.A. Into the Deep: New Data on the Lipid and Fatty Acid Profile of Redfish Sebastes mentella Inhabiting Different Depths in the Irminger Sea. Biomolecules 2021, 11, 704. [Google Scholar] [CrossRef]
- Voronin, V.P.; Artemenkov, D.V.; Orlov, A.M.; Murzina, S.A. Lipids and Fatty Acids in Some Mesopelagic Fish Species: General Characteristics and Peculiarities of Adaptive Response to Deep-Water Habitat. J. Mar. Sci. Eng. 2022, 10, 949. [Google Scholar] [CrossRef]
- Murzina, S.A.; Voronin, V.P.; Ruokolainen, T.R.; Artemenkov, D.V.; Orlov, A.M. Comparative Analysis of Lipids and Fatty Acids in Beaked Redfish Sebastes mentella Travin, 1951 Collected in Wild and in Commercial Products. J. Mar. Sci. Eng. 2022, 10, 59. [Google Scholar] [CrossRef]
- McGinnis, R.F. Biogeography of the lantern fishes (Myctophidae) south of 30°S. Antarct. Res Ser 1982, 35, 110. [Google Scholar]
- ICES. Manual for the International Deep Pelagic Ecosystem Survey in the Irminger Sea and Adjacent Waters. In Series of ICES Survey Protocols SISP 11- IDEEPS VI, Copenhagen, Denmark; 2015; 49p, Available online: https://ices-library.figshare.com/articles/report/SISP_11_-_Manual_for_the_International_Deep_Pelagic_Ecosystem_Survey_in_the_Irminger_Sea_and_Adjacent_Waters_Version_1/19050851 (accessed on 15 December 2022).
- Kukuev, E.I.; Gushchin, A.V.; Gomolitsky, V.D. Methodical Materials for the Identification of Fish in the Open Waters of the North Atlantic; AtlantNIRO: Kaliningrad, Russia, 1980; 145p. [Google Scholar]
- Dolgov, A.V. Atlas-Key to Fishes of the Barents Sea; PINRO: Murmansk, Russia, 2011; 187p. [Google Scholar]
- Schilling, B.; Couperus, A.S.; Bos, O.G. Fotogids Mesopelagische Vissen: Noordoost Atlantische Oceaan = Photo Guide Mesopelagic Fish: North East Atlantic Ocean; Wageningen Marine Research: Yerseke, The Netherlands, 2019; 121p. [Google Scholar]
- Sutton, T.T.; Hulley, P.A.; Wienerroither, R.; Zaera-Perez, D.; Paxton, J.R. Identification Guide to the Mesopelagic Fishes of the Central and South East Atlantic Ocean; FAO: Rome, Italy, 2020. [Google Scholar]
- Folch, J.; Lees, M.; Sloan-Syanley, G.H. A simple method for the isolation and purification of total lipids from animal tissue (for brain, liver and muscle). J. Biol. Chem 1957, 226, 497–509. [Google Scholar] [CrossRef]
- Cyganov, E.P. Method for direct lipid methylation after TLC without elution from silica gel. Labor. Matter 1971, 8, 490–493. [Google Scholar]
- Murzina, S.A.; Pekkoeva, S.N.; Kondakova, E.A.; Nefedova, Z.A.; Filippova, K.A.; Nemova, N.N.; Orlov, A.M.; Berge, J.; Falk-Petersen, S. Tiny but Fatty: Lipids and Fatty Acids in the Daubed Shanny (Leptoclinus maculatus), a Small Fish in Svalbard Waters. Biomolecules 2020, 10, 368. [Google Scholar] [CrossRef]
- Olsen, R.E.; Henderson, R.J. The rapid analysis of neutral and polar marine lipids using double development HPTLC and scanning densitometry. J. Exp. Mar. Biol. Ecol 1989, 129, 189–197. [Google Scholar] [CrossRef]
- ISO/TS 17764-2-2015; Feeds, Compound Feeds. Determination of the Content of Fatty Acids. Part 2. Gas Chromatographic Method. Russia. ISO: Geneva, Switzerland, 2017; 16p.
- Kabakoff, R. R in Action: Data Analysis and Graphics with R. TRANSL. from English P. A. Volkova; DMK Press: Moscow, Russia, 2014; p. 588. [Google Scholar]
- Shitikov, V.K.; Mastitsky, S.E. Classification, Regression, Data Mining Algorithms Using R. 2017. Available online: https://github.com/ranalytics/data-mining (accessed on 1 December 2022).
- Bruce, P.; Bruce, A. Practical Statistics for Data Scientists; Spb. BHV-Peterburg: Saint Petersburg, Russia, 2020; 304p. [Google Scholar]
- Lantz, B. Machine Learning with R: Expert Techniques for Predictive Modeling; Spb.: Saint Petersburg, Russia, 2020; 464p. [Google Scholar]
- FAO 2020. The Mesopelagic Fish Guide: Shedding Light on 550 Fish Species in One of the Largest Ecosystems on Earth. EAF—Nansen Programme. Available online: http://www.fao.org/in-action/eaf-nansen/news-events/detail-events/en/c/1311820/ (accessed on 10 December 2022).
- Choy, C.A.; Popp, B.N.; Hannides, C.C.; Drazen, J.C. Trophic structure and food resources of epipelagic and mesopelagic fishes in the North Pacific Subtropical Gyre ecosystem inferred from nitrogen isotopic compositions. Limnol. Oceanogr. 2015, 60, 1156–1171. [Google Scholar] [CrossRef]
- Cavallaro, M.; Ammendolia, G.; Andaloro, F.; Battaglia, P. First record of the mesopelagic fish Diaphus dumerilii (Bleeker, 1856) in the Mediterranean Sea. Mar. Biodivers. 2017, 47, 585–588. [Google Scholar] [CrossRef]
- Choy, C.A.; Portner, E.; Iwane, M.; Drazen, J.C. Diets of five important predatory mesopelagic fishes of the central North Pacific. Mar. Ecol. Prog. Ser. 2013, 492, 169–184. [Google Scholar] [CrossRef]
- Olaso, I.; Velasco, F.; Sánchez, F.; Serrano, A.; Rodríguez-Cabello, C.; Cendrero, O. Trophic relations of lesser-spotted catshark (Scyliorhinus canicula) and blackmouth catshark (Galeus melastomus) in the Cantabrian Sea. J. Northwest Atl. Fish. Sci. 2005, 35, 481–494. [Google Scholar] [CrossRef]
- Pusineri, C.; Chancollon, O.; Ringelstein, J.; Ridoux, V. Feeding niche segregation among the Northeast Atlantic community of oceanic top predators. Mar. Ecol. Prog. Ser. 2008, 361, 21–34. [Google Scholar] [CrossRef]
- Olivar, M.P.; Hulley, P.A.; Castellón, A.; Emelianov, M.; López, C.; Tuset, V.M.; Contreras, T.; Molí, B. Mesopelagic fishes across the tropical and equatorial Atlantic: Biogeographical and vertical patterns. Prog. Oceanogr. 2017, 151, 116–137. [Google Scholar] [CrossRef]
- Duhamel, G.; Hulley, P.A.; Causse, R.; Koubbi, P.; Vacchi, M.; Pruvost, P.; Vigetta, S.; Irisson, J.O.; Mormede, S.; Belchier, M.; et al. Biogeographic Patterns of Fish. Biogeographic Atlas of the Southern Ocean; Scientific Committee on Antarctic Research: Cambridge, UK, 2014; pp. 328–362. [Google Scholar]
- Iverson, S.J. Tracing aquatic food webs using fatty acids: From qualitative indicators to quantitative determination. In Lipids in Aquatic Ecosystems, 3rd ed.; Arts, M.T., Brett, M.T., Kainz, M., Eds.; Springer: New York, NY, USA, 2009; pp. 281–308. [Google Scholar]
- Ozdemir, N.S.; Parrish, C.C.; Parzanini, C.; Mercier, A. Neutral and polar lipid fatty acids in five families of demersal and pelagic fish from the deep Northwest Atlantic. ICES J. Mar. Sci. 2019, 76, 1807–1815. [Google Scholar] [CrossRef]
- Saito, H.; Murata, M. Origin of the monoene fats in the lipid of midwater fishes: Relationship between the lipids of myctophids and those of their prey. Mar. Ecol. Prog. Ser 1998, 168, 21–33. [Google Scholar] [CrossRef]
- Lea, M.A.; Nichols, P.D.; Wilson, G. Fatty acid composition of lipid-rich myctophids and mackerel icefish (Champsocephalus gunnari)–Southern Ocean food-web implications. Polar Biol. 2002, 25, 843–854. [Google Scholar] [CrossRef]
- Falk-Petersen, S.; Hagen, W.; Kattner, G.; Clarke, A.; Sargent, J.R. Lipids, trophic relationships, and biodiversity in Arctic and Antarctic krill. Can. J. Fish. Aq. Sci 2000, 57, 178–191. [Google Scholar] [CrossRef]
- Dalsgaard, J.; St. John, M.; Kattner, G.; Muller-Navarra, D.; Hagen, W. Fatty acid trophic markers in the pelagic marine environment. Adv. Mar. Biol. 2003, 46, 225–340. [Google Scholar]
- Stegeman, J.J.; Schlezinger, J.J.; Craddock, J.E.; Tillitt, D.E. Cytochrome P450 1A expression in midwater fishes: Potential effects of chemical contaminants in remote oceanic zones. Environ. Sci. Technol. 2001, 35, 54–62. [Google Scholar] [CrossRef]
- Sutton, T.T. Trophic ecology of the deep-sea fish Malacosteus niger (Pisces: Stomiidae): An enigmatic feeding ecology to facilitate a unique visual system? Deep Sea Res. Part I: Oceanogr. Res. Pap. 2005, 52, 2065–2076. [Google Scholar] [CrossRef]
- Munschy, C.; Spitz, J.; Bely, N.; Héas-Moisan, K.; Olivier, N.; Pollono, C.; Chouvelon, T. A large diversity of organohalogen contaminants reach the meso-and bathypelagic organisms in the Bay of Biscay (northeast Atlantic). Mar. Pollut. Bull. 2022, 184, 114180. [Google Scholar] [CrossRef] [PubMed]
- Klimpel, S.; Palm, H.W.; Busch, M.W.; Kellermanns, E.; Rückert, S. Fish parasites in the Arctic deep-sea: Poor diversity in pelagic fish species vs. heavy parasite load in a demersal fish. Deep Sea Res. Part I Oceanogr. Res. Pap. 2006, 53, 1167–1181. [Google Scholar] [CrossRef]
- Butler, M.; Bollens, S.M.; Burkhalter, B.; Madin, L.P.; Horgan, E. Mesopelagic fishes of the Arabian Sea: Distribution, abundance and diet of Chauliodus pammelas, Chauliodus sloani, Stomias affinis, and Stomias nebulosus. Deep Sea Res. II 2001, 48, 1369–1383. [Google Scholar] [CrossRef]
- Sargent, J.R.; Falk-Petersen, S. The lipid biochemistry of calanoid copepods. Hydrobiologia 1988, 167/168, 101–114. [Google Scholar] [CrossRef]
- Scott, C.L.; Kwasniewski, S.; Falk-Petersen, S.; Sargent, J.R. Species differences, origins andfunctions of fatty alcohols and fatty acids in the wax esters and phospholipids of Calanus hyperboreus, C. glacialis and C. finmarchicus from Arctic waters. Mar. Ecol. Prog. Ser. 2002, 235, 127–134. [Google Scholar] [CrossRef]
- Lee, R.F. Lipid composition of the copepod Calanus hyperboreas from the ArcticOcean. Changes with depth and season. Mar. Biol. 1974, 26, 313–318. [Google Scholar] [CrossRef]
- Falk-Petersen, S.; Mayzaud, P.; Kattner, G.; Sargent, J.R. Lipids and life strategy of Arctic Calanus. Mar. Biol. Res. 2009, 5, 18–39. [Google Scholar] [CrossRef]
- Verhoeven, N.M.; Wanders, R.J.A.; Saudubray, J.M.; Jakobs, C. The metabolism of phytanic acid and pristanic acid in man: A review. J. Inherit. Metab. Dis. 1998, 21, 697–728. [Google Scholar] [CrossRef] [PubMed]
- Bode, M.; Hagen, W.; Schukat, A.; Teuber, L.; Fonseca-Batista, D.; Dehairs, F.; Auel, H. Feeding strategies of tropical and subtropical calanoid copepods throughout the eastern Atlantic Ocean–Latitudinal and bathymetric aspects. Prog. Oceanogr. 2015, 138, 268–282. [Google Scholar] [CrossRef]
- Gershanovich, A.D. Lipid mobilization during early development of surgeons. In Proc. First Intarnational Symposium Sturgeon; Bordeaux: Gironde, France, 1991; pp. 41–52. [Google Scholar]
- Atlasova, M. Estimates of the total food composition Notoscopelus kroyeri in the Irminger Sea in 2003–2013 years. Nat. Math. Sci. Mod. World 2015, 32, 54–58. [Google Scholar]
- Auel, H.; Harjes, M.; Da Rocha, R.; Stübing, D.; Hagen, W. Lipid biomarkers indicate different ecological niches and trophic relationships of the Arctic hyperiid amphipods Themisto abyssorum and T. libellula. Polar Biol. 2002, 25, 374–383. [Google Scholar] [CrossRef]
- Schukat, A.; Auel, H.; Teuber, L.; Lahajnar, N.; Hagen, W. Complex trophic interactions of calanoid copepods in the Benguela upwelling system. J. Sea Res. 2014, 85, 186–196. [Google Scholar] [CrossRef]
- Gaskett, A.C.; Bulman, C.; He, X.; Goldsworthy, S.D. Diet composition and guild structure of mesopelagic and bathypelagic fishes near Macquarie Island, Australia. N. Z. J. Mar. Freshw. Res 2001, 35, 469–476. [Google Scholar] [CrossRef]
- Rabinovich, A.L.; Ripatti, P.O. Polyunsaturated carbon chins of lipids: Structure, properties, functions. Biol. Bull. Rev 1994, 114, 581–594. [Google Scholar]
- Shulman, G.E.; Yuneva, T.V. Role of docosahexaenoic acid in adaptations fishes (review). Hydrobiol. J. 1990, 26, 43–51. [Google Scholar]
- Isanta Navarro, J.; Fromherz, M.; Dietz, M.; Zeis, B.; Schwarzenberger, A.; Martin--Creuzburg, D. Dietary polyunsaturated fatty acid supply improves Daphnia performance at fluctuating temperatures, simulating diel vertical migration. Freshw. Biol. 2019, 64, 1859–1866. [Google Scholar] [CrossRef]
- Murzina, S.A.; Nefedova, Z.A.; Pekkoeva, S.N.; Veselov, A.E.; Baryshev, I.A.; Ripatti, P.O.; Nemova, N.N. Content of fatty acids in forage objects of juveniles of salmonids from rivers of the Lake Onega basin. Inland Water Biol. 2019, 12, 96–103. [Google Scholar] [CrossRef]
- Almansa, E.; Martian, M.V.; Cejas, J.R.; Badi, P.; Jerez, S.; Lorenzo, A. Lipid and fatty acid composition of female gilthead seabream during their reproductive cycle: Effects of a diet lacking n--3 HUFA. J. Fish Biol. 2001, 59, 267–286. [Google Scholar] [CrossRef]
- Buda, C.; Dey, I.; Balogh, N.; Horvath, L.I.; Maderspach, K.; Juhasz, M.; Yeo, Y.K.; Farkas, T. Structural order of membranes and composition of phospholipids in fish brain cells during thermal acclimatization. Proc. Natl. Acad. Sci. USA 1994, 91, 8234–8238. [Google Scholar] [CrossRef] [PubMed]
- Nemova, N.N.; Nefedova, Z.A.; Murzina, S.A.; Veselov, A.E.; Ripatti, P.O. Comparative characteristics of the lipid and fatty acid status of eyed-stage atlantic salmon embryos reared in natural and artificial environments. Biol. Bull. 2015, 42, 493–499. [Google Scholar] [CrossRef]
- Murzina, S.A.; Nefedova, Z.A.; Veselov, A.E.; Ripatti, P.O.; Nemova, N.N.; Pavlov, D.S. Changes in fatty acid composition during embryogenesis and in young age groups (0+) of Atlantic Salmon Salmo salar L.: The role of rheotactic behavior and lipid composition of fry in the formation of phenotypic groups of Salmon in large arctic rivers. In Salmon: Biology, Ecological Impacts and Economic Importance, 2nd ed.; Woo, P.T.K., Noakes, D.J., Eds.; Nova Science Publishers: Hauppauge, NY, USA, 2014; pp. 47–65. [Google Scholar]
- Winnikoff, J.R.; Haddock, S.H.; Budin, I. Depth-and temperature-specific fatty acid adaptations in ctenophores from extreme habitats. J. Exp. Biol. 2021, 224, jeb242800. [Google Scholar] [CrossRef]
- Neighbors, M.A. Triacylglycerols and wax esters in the lipids of deep midwater teleost fishes of the Southern California Bright. Mar. Biol. 1988, 98, 15–22. [Google Scholar] [CrossRef]
- Phleger, C.F.; Nelson, M.M.; Mooney, B.D.; Nichols, P.D. Wax esters versus triacylglycerols in myctophid fishes from the Southern Ocean. Antarct. Sci. 1999, 11, 436–444. [Google Scholar] [CrossRef]
- Roe, H.S.J.; Badcock, J. The diel migrations and distributions within a mesopelagic community in the North East Atlantic. 5. Vertical migrations and feeding of fish. Prog. Oceanogr. 1984, 13, 389–424. [Google Scholar] [CrossRef]
- Podrazhanskaya, S.G. Feeding habits of mesopelagic species of fish and estimation of plankton graze in the Northwest Atlantic. NAFO Sci. Counc. Stud. 1993, 19, 79–85. [Google Scholar]


Disclaimer/Publisher’s Note: The statements, opinions and data contained in all publications are solely those of the individual author(s) and contributor(s) and not of MDPI and/or the editor(s). MDPI and/or the editor(s) disclaim responsibility for any injury to people or property resulting from any ideas, methods, instructions or products referred to in the content. |
© 2023 by the authors. Licensee MDPI, Basel, Switzerland. This article is an open access article distributed under the terms and conditions of the Creative Commons Attribution (CC BY) license (https://creativecommons.org/licenses/by/4.0/).