Article

Seasonal Variation in the Organization of Dung Beetle Communities in the Moroccan Middle Atlas (Coleoptera: Scarabaeoidea)

by
Hasnae Hajji
1,
Abdellatif Janati-Idrissi
1,
Abdelkhaleq Fouzi Taybi
2,
Valérie Caron
3,
Jean-Pierre Lumaret
4,5,* and
Youness Mabrouki
1
1
Laboratoire de Biotechnologie, Conservation et Valorisation des Ressources Naturelles, Faculté des Sciences de Dhar El Mehraz, Université Sidi Mohamed Ben Abdellah, B.P. 1796 Fès-Atlas, Fez 30000, Morocco
2
Faculté Pluridisciplinaire de Nador, Équipe de Recherche en Biologie et Biotechnologie Appliquées, Université Mohammed Premier, Selouane, Nador 62700, Morocco
3
Commonwealth Scientific Industrial Research Organisation (CSIRO), Health & Biosecurity, Black Mountain, Clunies Ross St., Acton, ACT 2601, Australia
4
Laboratoire de Zoogéographie, Université Paul Valéry Montpellier 3, Route de Mende, CEDEX 5, 34199 Montpellier, France
5
CSIRO European Laboratory, 830 Avenue du Campus Agropolis, 34980 Montferrier-sur-Lez, France
*
Author to whom correspondence should be addressed.
Diversity 2023, 15(11), 1138; https://doi.org/10.3390/d15111138
Submission received: 6 September 2023 / Revised: 24 October 2023 / Accepted: 7 November 2023 / Published: 11 November 2023
(This article belongs to the Special Issue Biodiversity and Ecosystem Function)

Abstract

:
Dung beetles feed on and bury animal droppings, and their role is crucial in reducing the accumulation of manure, which diminishes the useful surface area of pastures. The aim of this research was to characterize the seasonal organization of dung beetle communities (Coleoptera: Scarabaeoidea) in the Middle Atlas region of Morocco in terms of core and satellite species. The beetles were collected using standard dung-baited traps. Four sites along a gradient of elevation were surveyed for one year every 7 to 10 days, depending on the season and local weather conditions. A total of 24,397 beetles were collected, belonging to 51 species. In most dung beetle communities, two to three species were found to be predominant, representing between 70 and 95% of all the individuals active at the same time but constituting only 10 to 30% of species diversity. The rapid succession of species at the same site limits the competition between species, allowing for the efficient use of available trophic resources.

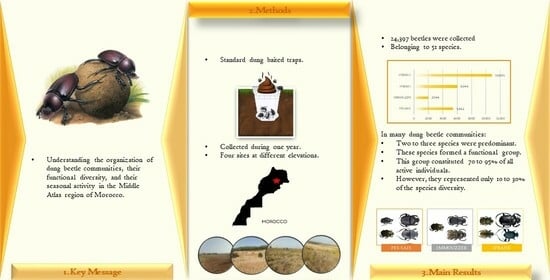
Graphical Abstract

1. Introduction

Dung beetles (a group of Coleoptera that taxonomically includes the Scarabaeidae Scarabaeinae, most Scarabaeidae Aphodiinae, and most Geotrupidae) are among the insects primarily responsible for dung removal from the ground surface in many ecosystems. Factors affecting their abundance and distribution thus impact dung degradation [1,2,3,4]. Their activity directly improves the fertility and physical characteristics of soils [5], helps to disperse seeds contained in dung [6], contributes to the reduction of dung breeding flies and gastrointestinal parasites of livestock [1,7], and in part reduces greenhouse gas emissions [8,9,10]. Three main guilds have been identified to describe the feeding and/or nesting behavior of dung beetles: non-nesters (dwellers), paracoprids (tunnelers), and telecoprids (rollers) [11,12]. These groups describe how species handle and consume dung, which determines where the dung is moved after it has been deposited. Non-nesters lay their eggs inside droppings, paracoprids dig nests below the droppings, and telecoprids cut off a parcel of dung and bury it at a distance.
Dung beetles are sensitive to habitat perturbations and are easily studied, making them an ideal focal taxon to evaluate the effects of anthropogenic disturbances [13,14,15]. Ecological functions are directly influenced by both community attributes and environmental variables and confirm the link between biodiversity, environment, and ecosystem functioning [16,17]. Dung beetles are particularly vulnerable to the destruction of their habitat and the use of pesticides, especially veterinary medicines found in animal feces and resulting from the treatment of animals [18,19]. About 644 dung beetle species are present in countries around the Mediterranean Basin [20], where the rate of endemism is very high [21,22]. Studies on dung beetles in this biogeographical sub-region mostly focused on the spatio-temporal organization of their communities [23,24,25] but have, for the most part, not considered the combination of abundance and biomass of the species, which is a key factor in understanding the rapidity and level of degradation of animal dung.
The efficiency of dung beetles in using animal dung depends on both their abundance and size [26], the latter being correlated with their individual biomass [27]. To reflect the importance of the species that compose a dung beetle community at a given time, some authors have proposed to divide them into the following three categories based on their abundance (number of individuals) and biomass: (1) core species (those representing at least 10% of the community, in both abundance and biomass [28,29]), (2) satellite species (those representing at least 10% of the community, in either abundance or biomass), and (3) accessory species (those that represent less than 10% of the community in both abundance and biomass) [30]. Core and satellite species define the functionally most important species present at a given time within a community [31]. Competition for trophic resources and reproduction sites in a dung beetle community can be mitigated if coexisting species of the same size belong to different guilds or if coexisting species of the same guild differ in size [28,32,33]. In most situations, the core and satellite species include a few species whose cumulative frequency often ranges between 70 and 85% [32].
Janati-Idrissi [34] was the first author who investigated the spatio-temporal variation of core and satellite species in the dung beetle communities in Morocco. The present study extends this approach by examining the spatial and temporal structure of dung beetle communities in the Middle Atlas region of Morocco. The aim of this work is to go further by examining how diversity in dung beetle communities varied along an altitudinal gradient over an annual cycle, environmental variables contributing to the structural composition of communities.

2. Materials and Methods

2.1. Study Sites

The Middle Atlas is a mountain system that extends for some 350 km from the southwest to the northeast of Morocco, between the Rif and the High Atlas. The western side usually receives between 1000 and 1500 mm of rain a year, unlike the eastern valleys, which are far drier. More continental than the Rif and generally wetter than the High Atlas, the Middle Atlas experiences cold winters, with snowfalls above 2000 to 2500 m between November and April. Pastoralism is the main economic resource of this region. Dung beetle communities were studied in four stations located between the Sais Plain and the Middle Atlas: one close to Fez-Sais, one close to the town of Immouzzer, and two (Ifrane I and Ifrane II) near the town of Ifrane. These sites differed from each other in several factors (bioclimatic zones, altitude, soil, and vegetation cover) (Figure 1).
The Fez-Sais station (33°54′ N–4°59′ W; elevation 609 m) is located at the edge of the Sais plain and before the Middle Atlas plateau. It is a karstic formation of lacustrine origin composed mainly of massive limestone and travertine associated with conglomerates and marl, resulting in a hard and rocky soil. The site is situated in the semi-arid bioclimatic zone with temperate winters and consists of an open environment with a predominance of herbaceous vegetation, mainly grazed by sheep. The site has been degraded by the expansion of urbanization in the Fez conurbation, which is increasingly restricting the grazing area.
The Immouzzer station (33°47′ N–4°59′ W; elevation 898 m) is located on the Middle Atlas plateau, 3 km north of the town of Immouzzer Kandar. The substratum consisted of superficial red clay soil with outcrops of limestone blocks. The scrubland alternated between very open areas with a predominance of herbaceous vegetation and a few patches of Chamaerops humilis L. (locally called doum) and more closed areas (holm oak (Quercus ilex L.) coppice).
Two sites, one kilometer apart, respectively, Ifrane I (33°32′ N–5°09′ W; elevation 1631 m) and Ifrane II (33°33′ N–5°10′ W; elevation 1613 m) were surveyed on the Middle Atlas plateau, four kilometers from the town of Ifrane. The sites were in the humid bioclimatic zone with cold winters. The landscape was very open and rocky, with a superficial red soil of silty clay resting on a bedrock of Lias limestone and dolomite. The vegetation was a mixture of herbaceous steppe formations with numerous clumps of Chamaerops humilis, indicating intensive grazing by sheep flocks. These open areas were bordered by a holm oak forest.

2.2. Sampling

From September 2018 to August 2019, the study sites were surveyed every 7 to 10 days, depending on the season and local weather conditions. Three CSR-type baited traps [35] were set up simultaneously at each of the study sites. The traps, 15 cm deep and 30 cm in diameter, were buried at ground level about 50 m apart and covered with a large-mesh (1 × 1 cm) metal grid supporting about 250 g of fresh cattle dung. The dung beetles attracted fell into the container, which had been three-quarters filled with a preservative liquid (solution of 80% water and 20% of ethyl alcohol (95%), and a few drops of liquid detergent). The traps were collected one week after they had been installed.

2.3. Identification of Dung Beetles

The collected beetles were preserved in a 70% ethyl alcohol solution and identified to the species level using a Zeiss Stemi 508 stereomicroscope and counted. The species identification was mainly based on the reference work on the Scarabaeoidea of North Africa [36]. For each species, 10 to 200 individuals (depending on their size) were air-dried for 24 to 48 h, then placed in a fan-assisted oven heated to 70 °C for 12 h and weighed using a high-precision balance (APX-200, Denver Instrument GmbH, Göttingen, Germany; precision 0.1 mg). The mean individual biomass (dry weight) was calculated for each species. The total biomass of each species was calculated using the total number of individuals collected at a sampling event multiplied by the mean individual biomass for that species. A matrix of 51 species and 48 samples was drawn up from these surveys (51 species/48 samples [= 4 sites × 12 months]).

2.4. Statistical Analysis

The analyses of the data were carried out using the software R in version 4.1.3, under the Ade4, vegan, leaflet, labdsv, ggplot2, mvpart, MASS, and agricolae packages. We also used some additional scripts from the book Numerical Ecology with R [37,38].
Species were classified as core species (>10% total number and biomass), satellite species (>10% total number or biomass), or accessory (<10% total number and biomass). Core and satellite species were used in the analyses as these species would likely play a significant role in the recycling of dung. Cumulative frequencies were calculated for the total number and biomass for each month. A distribution map was built by processing all the gathered data in ArcGIS software.
The distribution of diversity requires an additive measurement of the variance within the sample, and linear diversity indices such as Hill numbers [39] facilitate a clearer interpretation of the obtained results. Many community ecologists currently prefer to use Hill numbers for taxonomic diversity and Hill ratios for regularity rather than Shannon entropy and Pielou regularity, respectively [40]. This is because these Hill numbers, also known as “equivalent numbers” are simpler to understand, representing “the number of equally probable elements (individuals, species, etc.) needed to produce the observed value of the diversity index” [40]. Hill’s numbers [41] differ only in the importance assigned to relatively rarer species [39].
In most cases, N1 (where N1 = exp(H) [H: Shannon diversity (base e)]) and N2 (where N2 = (1/λ) [λ: Simpson diversity], the inverse of Simpson’s index), are sufficient for answering any questions that a heterogeneity index can answer [42]. N1 offers greater importance to the evenness of the rarest species compared to N2. N0, which represents the number of species (i.e., species richness), is a diversity index that completely ignores the distribution of individuals among species [39]. Note that the N2 index, calculated as 1/λ, reduces sensitivity to variation in the abundance of highly abundant (generally few in numbers) species and hence indicates the number of dominant species present in a sample [40].
Hill’s numbers (N), all measured in equivalent units of species, were recorded for each of the four collection sites over the course of the twelve-month sampling period.
Hill ratios (E) are calculated from Hill numbers and are denoted by E1, E2 [40], E1.0 [43], and E2.0 [38], respectively. E1 = N1/N0 represents Shannon’s regularity (Hill ratio), while E2 = N2/N0 represents Simpson’s regularity (Hill ratio). They measure the regularity of species within a sample. When the species in the sample have the same abundance or dominance, or when there is only one species present, these two ratios are equal to 1 [40]. It is important to note that regularity cannot be measured in a singular way, and its imprecision requires caution when applied [43].
To compare diversity values between sites, we used ANOVA followed by Bonferroni tests if conditions of normality and/or homoscedasticity were satisfied; otherwise, we used the Kruskal Wallis test followed by Wilcoxon tests.
The analysis of community composition was made using a redundancy analysis (RA), which combines regression and principal component analysis (PCA). It is a direct extension of regression analysis to model multivariate response data. Redundancy analysis is a two-step process [38]. The first step is a multiple regression, where each object in Y is regressed on the explanatory variables in X, resulting in a matrix of fitted values Yfit. This step is calculated using the following linear equation: Yfit = X[X′X] − 1X′Y. In the second step, we applied a principal component analysis (PCA) to the fitted Yfit matrix to reduce dimensionality, i.e., to obtain the eigenvalues and eigenvectors. We then obtained a Z matrix containing the canonical axes, which correspond to linear combinations of the explanatory variables in the space of X. In the analysis of community composition, these canonical axes are interpreted as complex environmental gradients [38].
Before performing the redundancy analysis, the environmental or explanatory data were standardized (normalized). Moreover, to resolve the issue of double zeros in the matrix, we used the Hellinger transformation. To identify the significant explanatory variables, a progressive selection was conducted [38], with 1000 permutations to assess the significance of our ultimate model.
Relationships between samples were explored using a non-metric multidimensional scaling (NMDS) with the Bray–Curtis dissimilarity coefficient, which is a variation of Sørensen’s index that accounts for species abundance and is unaffected by double absences. NMDS uses an iterative algorithm to locate items in the specified number of dimensions with the aim of minimizing a stress function, which ranges from 0 to 1, and evaluates the adjustment of the distance between items in the ordination space. The greater the precision of object representation in the ordination space, the lower the stress value. Object ordinations can be generated from any dissimilarity through the use of NMDS [38,40].
Finally, a correspondence analysis (CA) was used to create a temporal biotypology. This method has proven particularly effective as an ordination method [38,40]. Its use in the field of biological zonation is justified in that its biocenoses are generally organized in a continuum. To homogenize the variances and to minimize the influence of the most abundant taxa, all our data underwent a logarithmic transformation: y = log(x + 1).

2.5. Environmental Data

Monthly meteorological data, including the mean, maximum, and minimum temperature, average amount of rainfall, relative humidity, and wind speed, were provided by the Sebou water basin agency (www.abhsebou.ma; accessed on 4 June 2023)).
Additionally, we used a GPS device (Garmin eTrex 10) to determine elevation and geographic coordinates. To identify Emberger’s bioclimatic levels, we consulted the map produced by Brignon and Sauvage [44] at the Rabat Scientific Institute (formerly known as the Institut Scientifique Chérifien) (Table S6).

3. Results

3.1. Faunal Composition of Assemblages and Organization of the Dung Beetle Communities

During the study, 24,397 individuals and 51 species were collected in total, including 27 Scarabaeinae species, 21 Aphodiinae species, and 3 Geotrupidae species (Table 1).
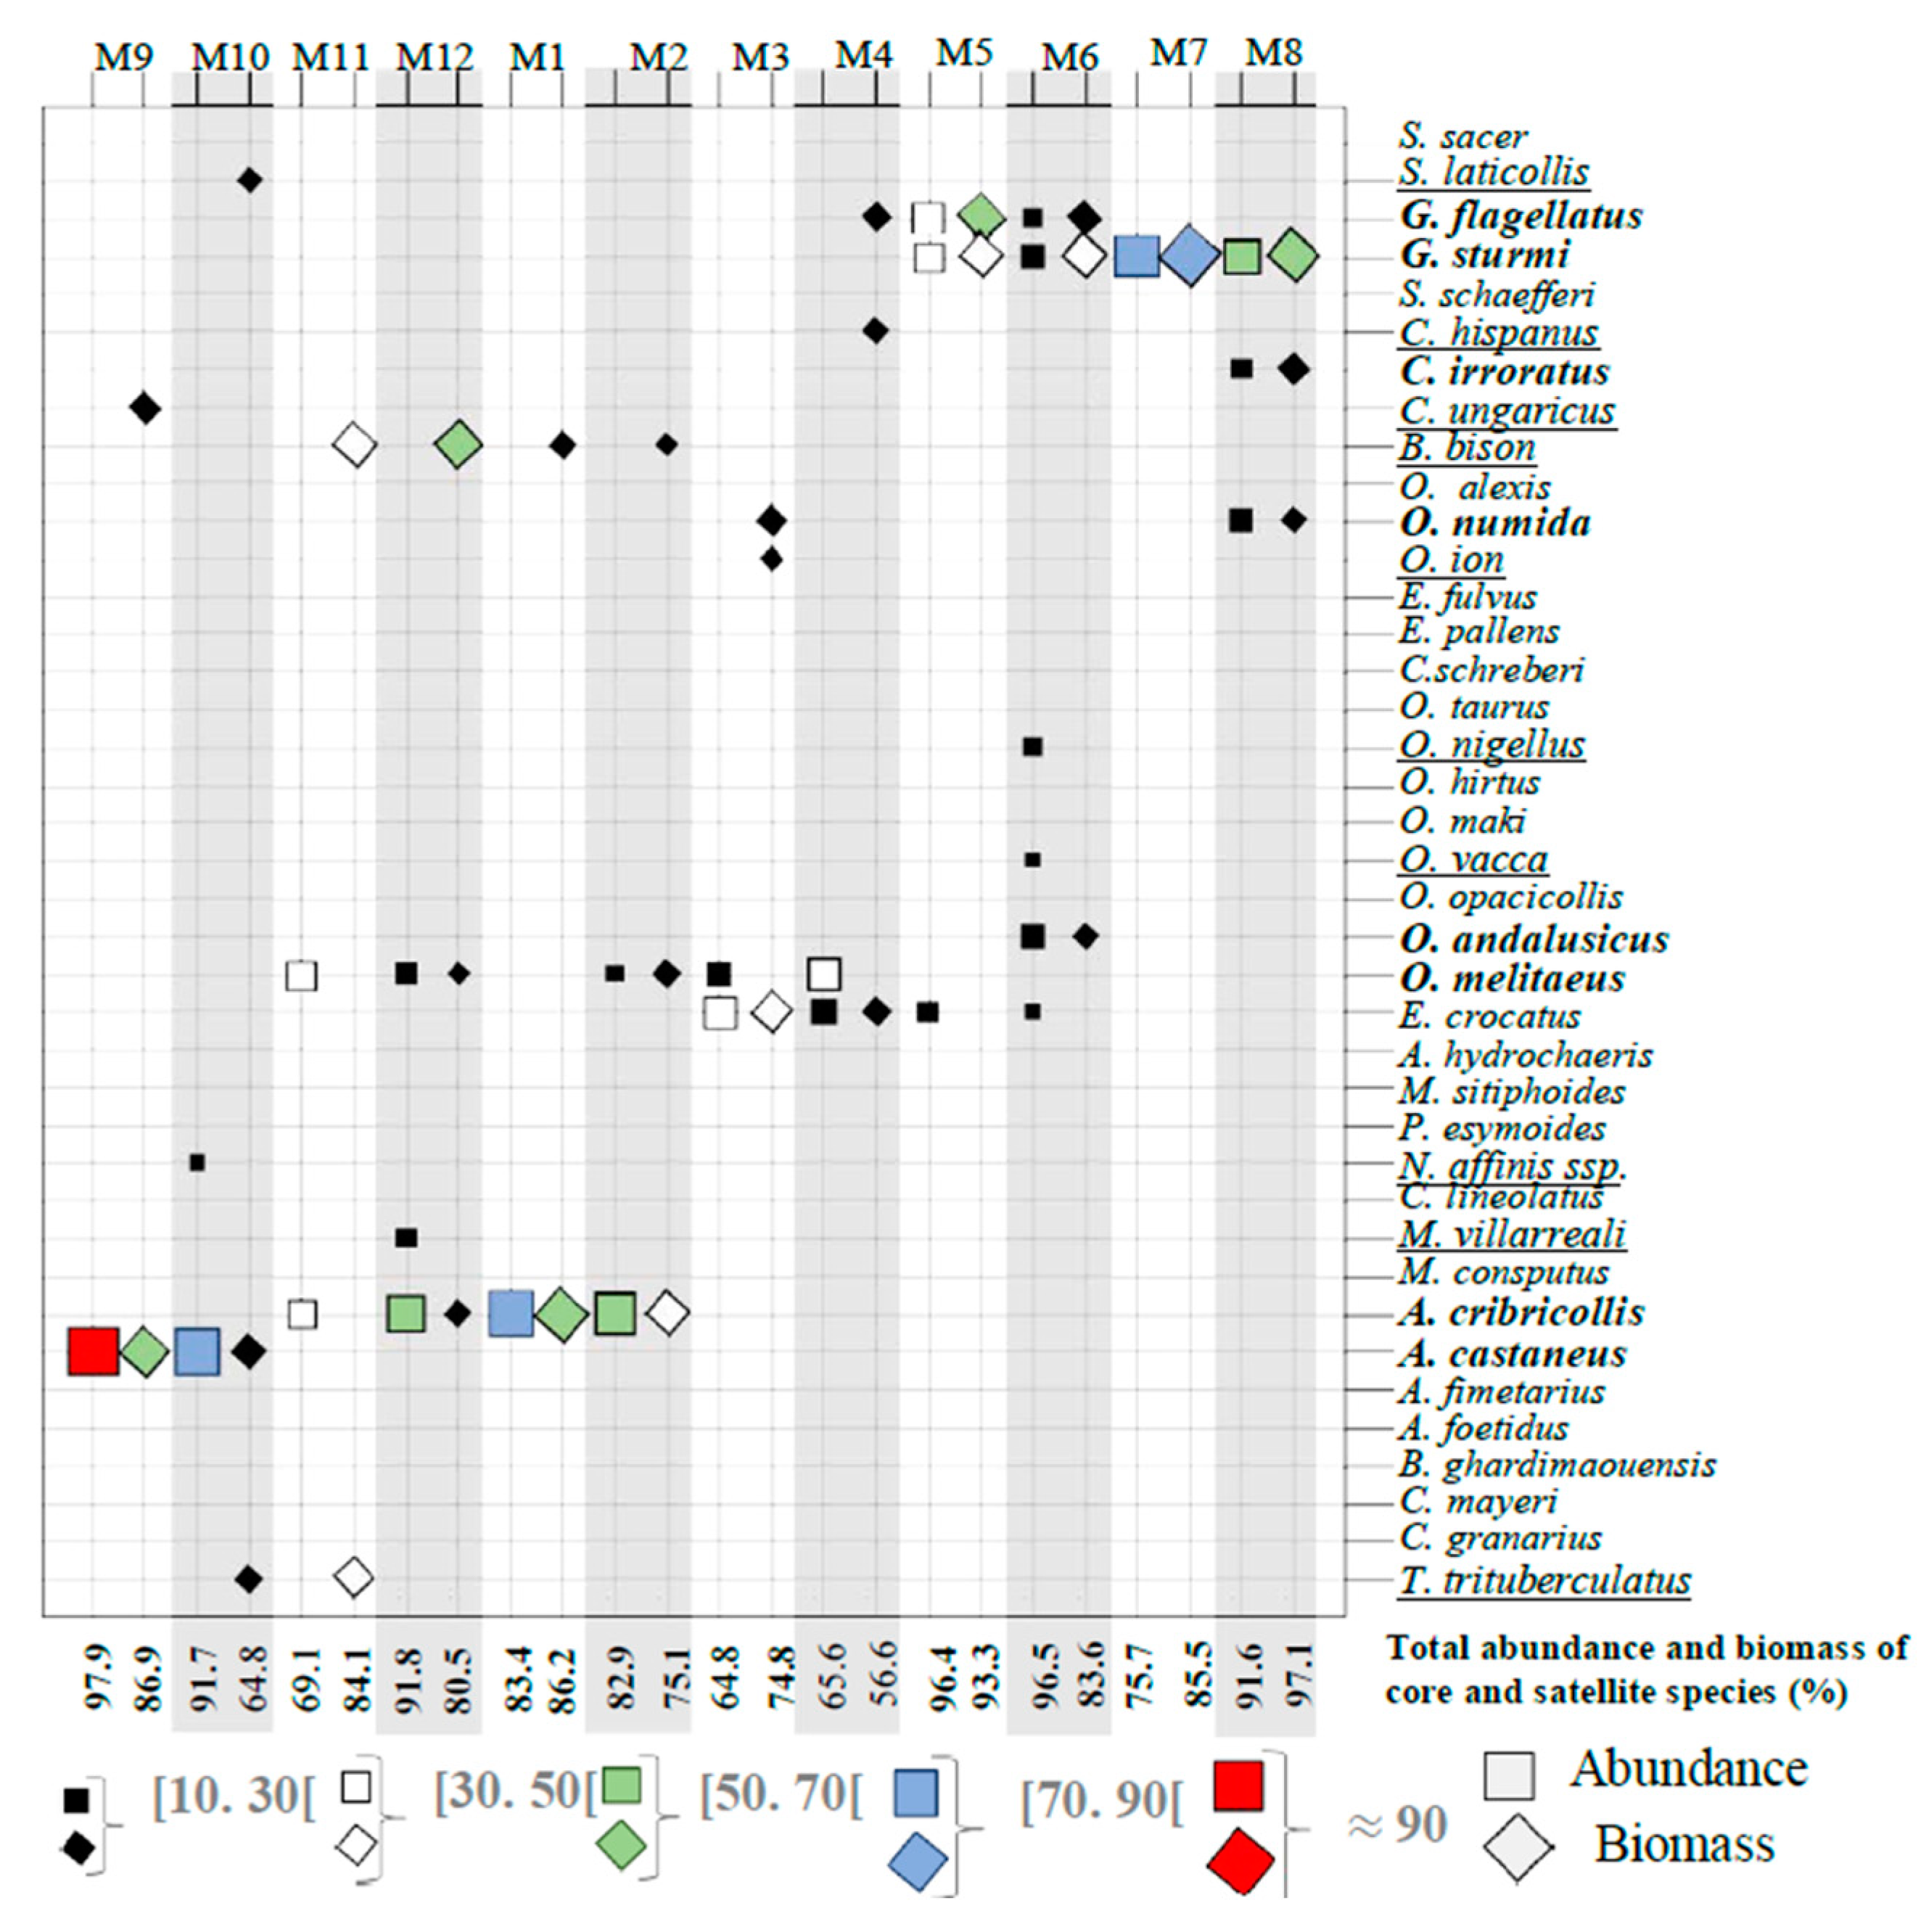
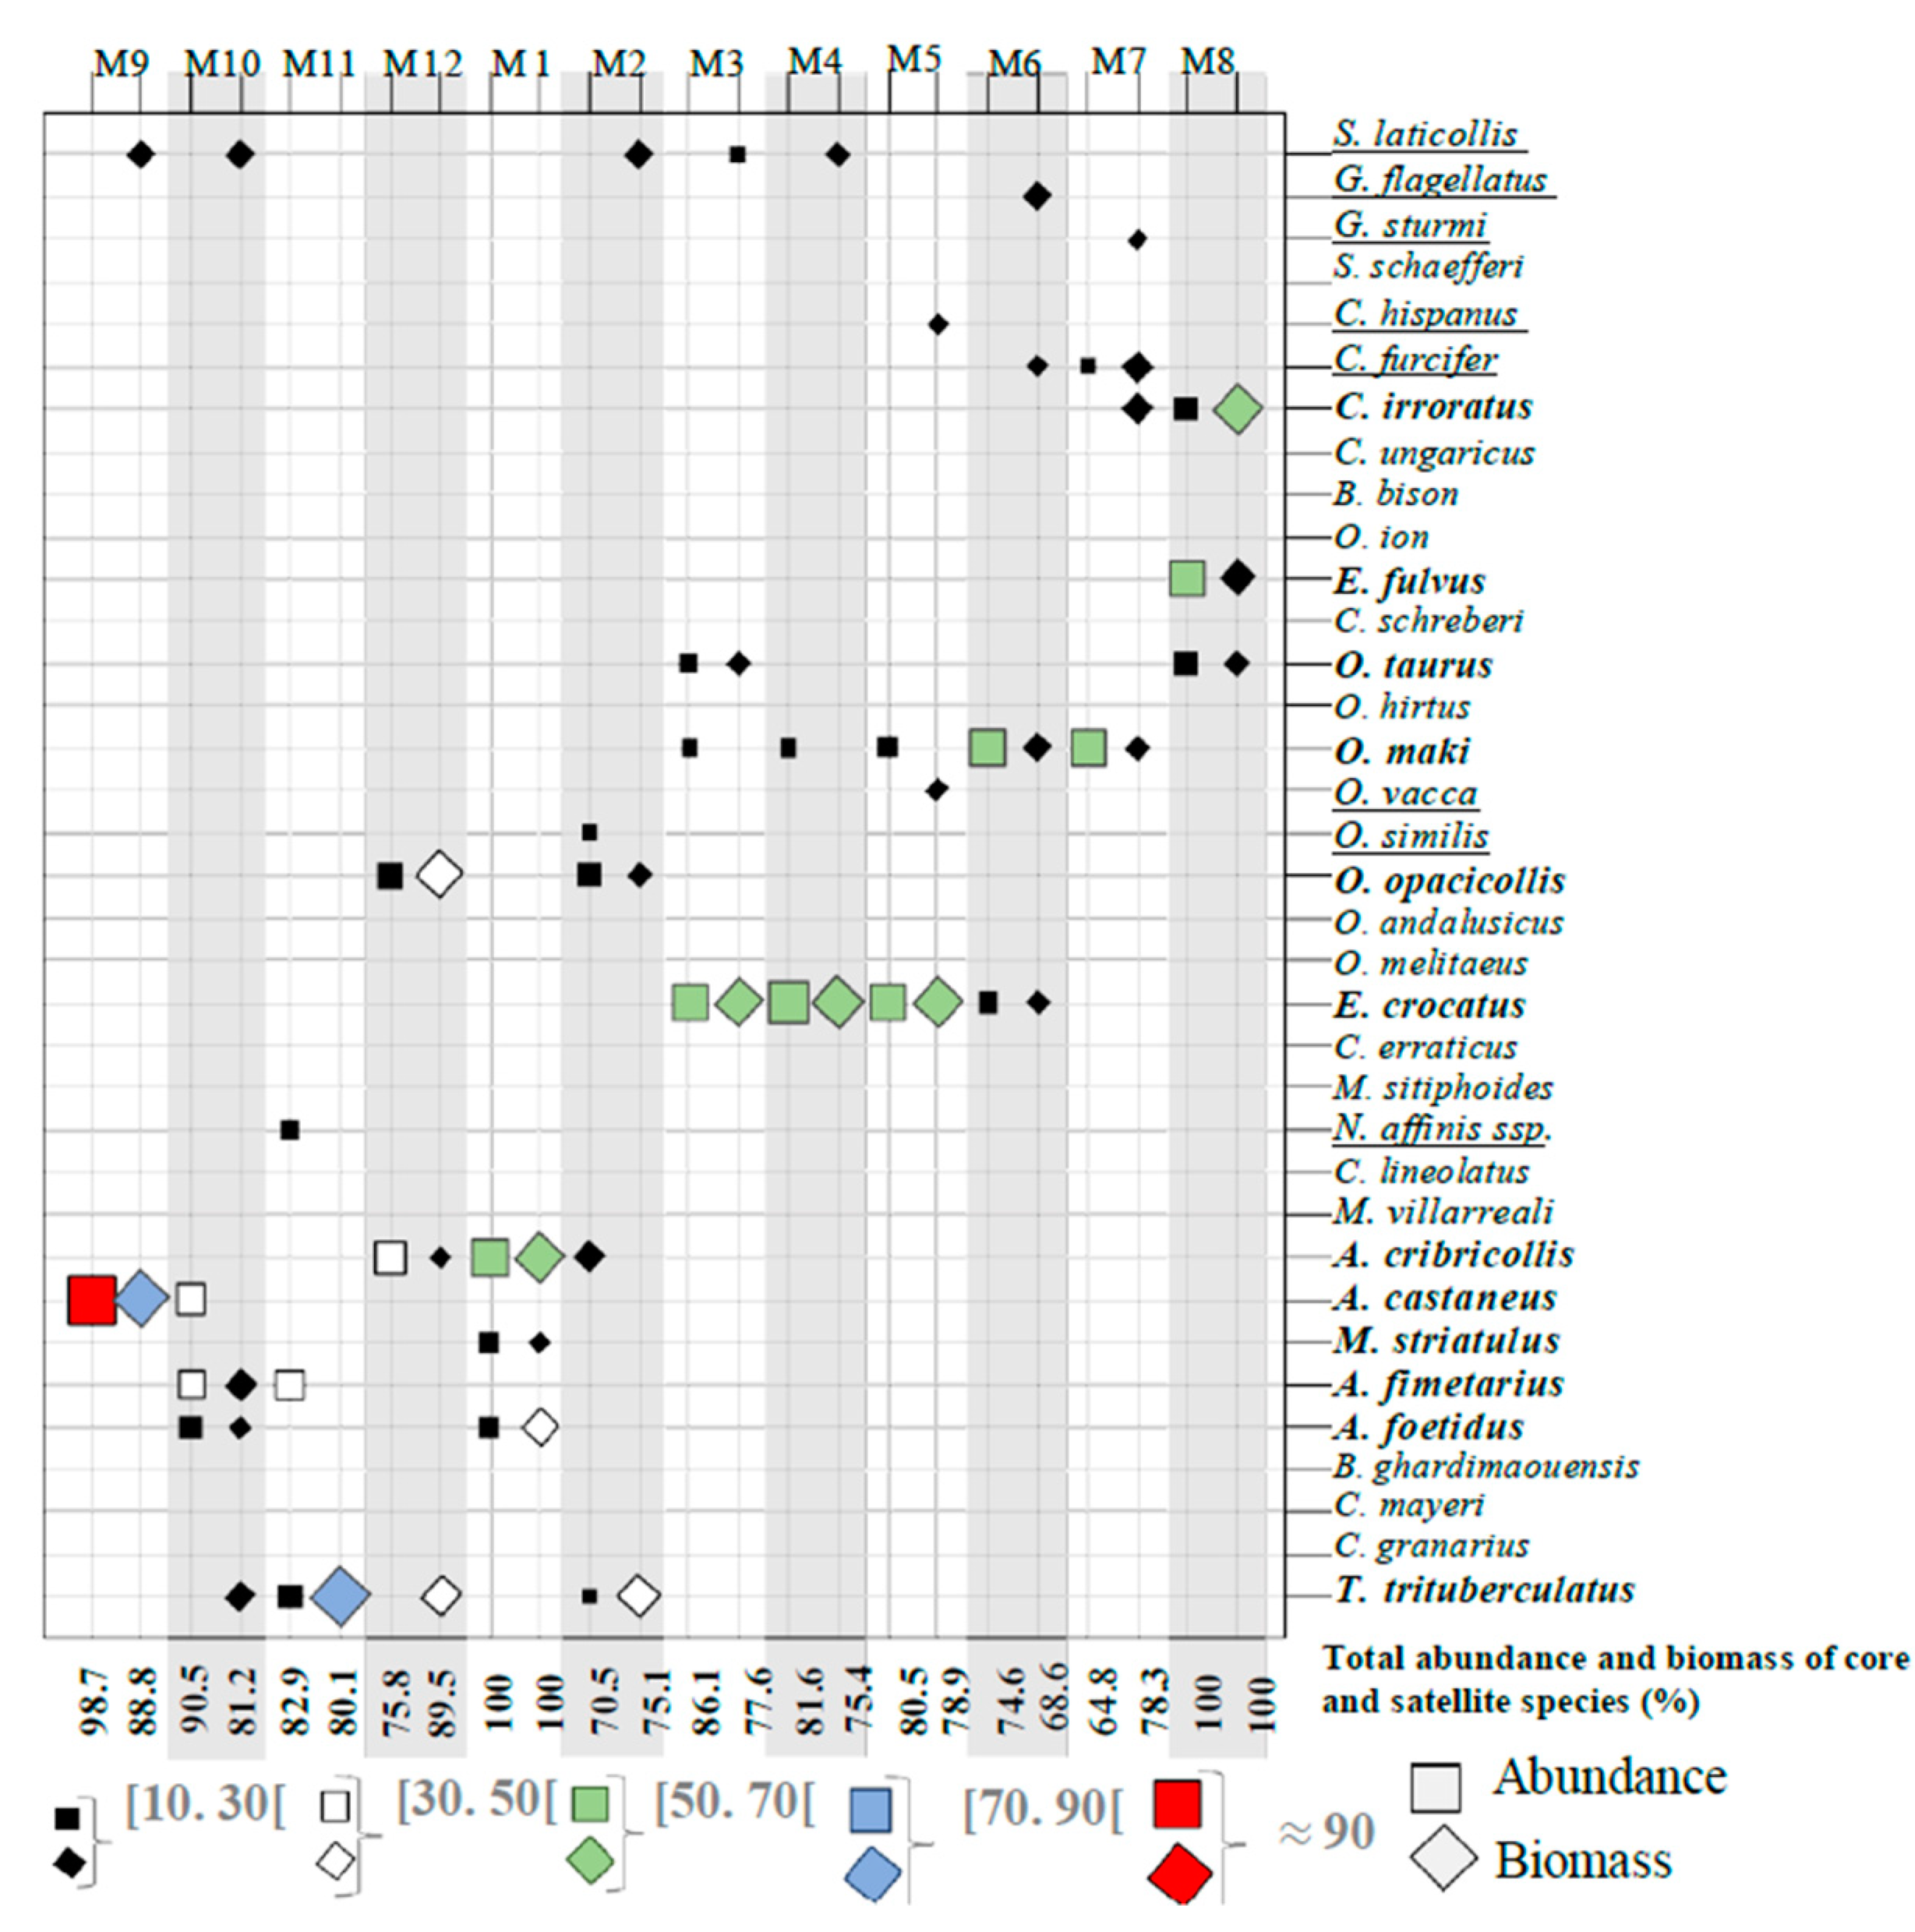
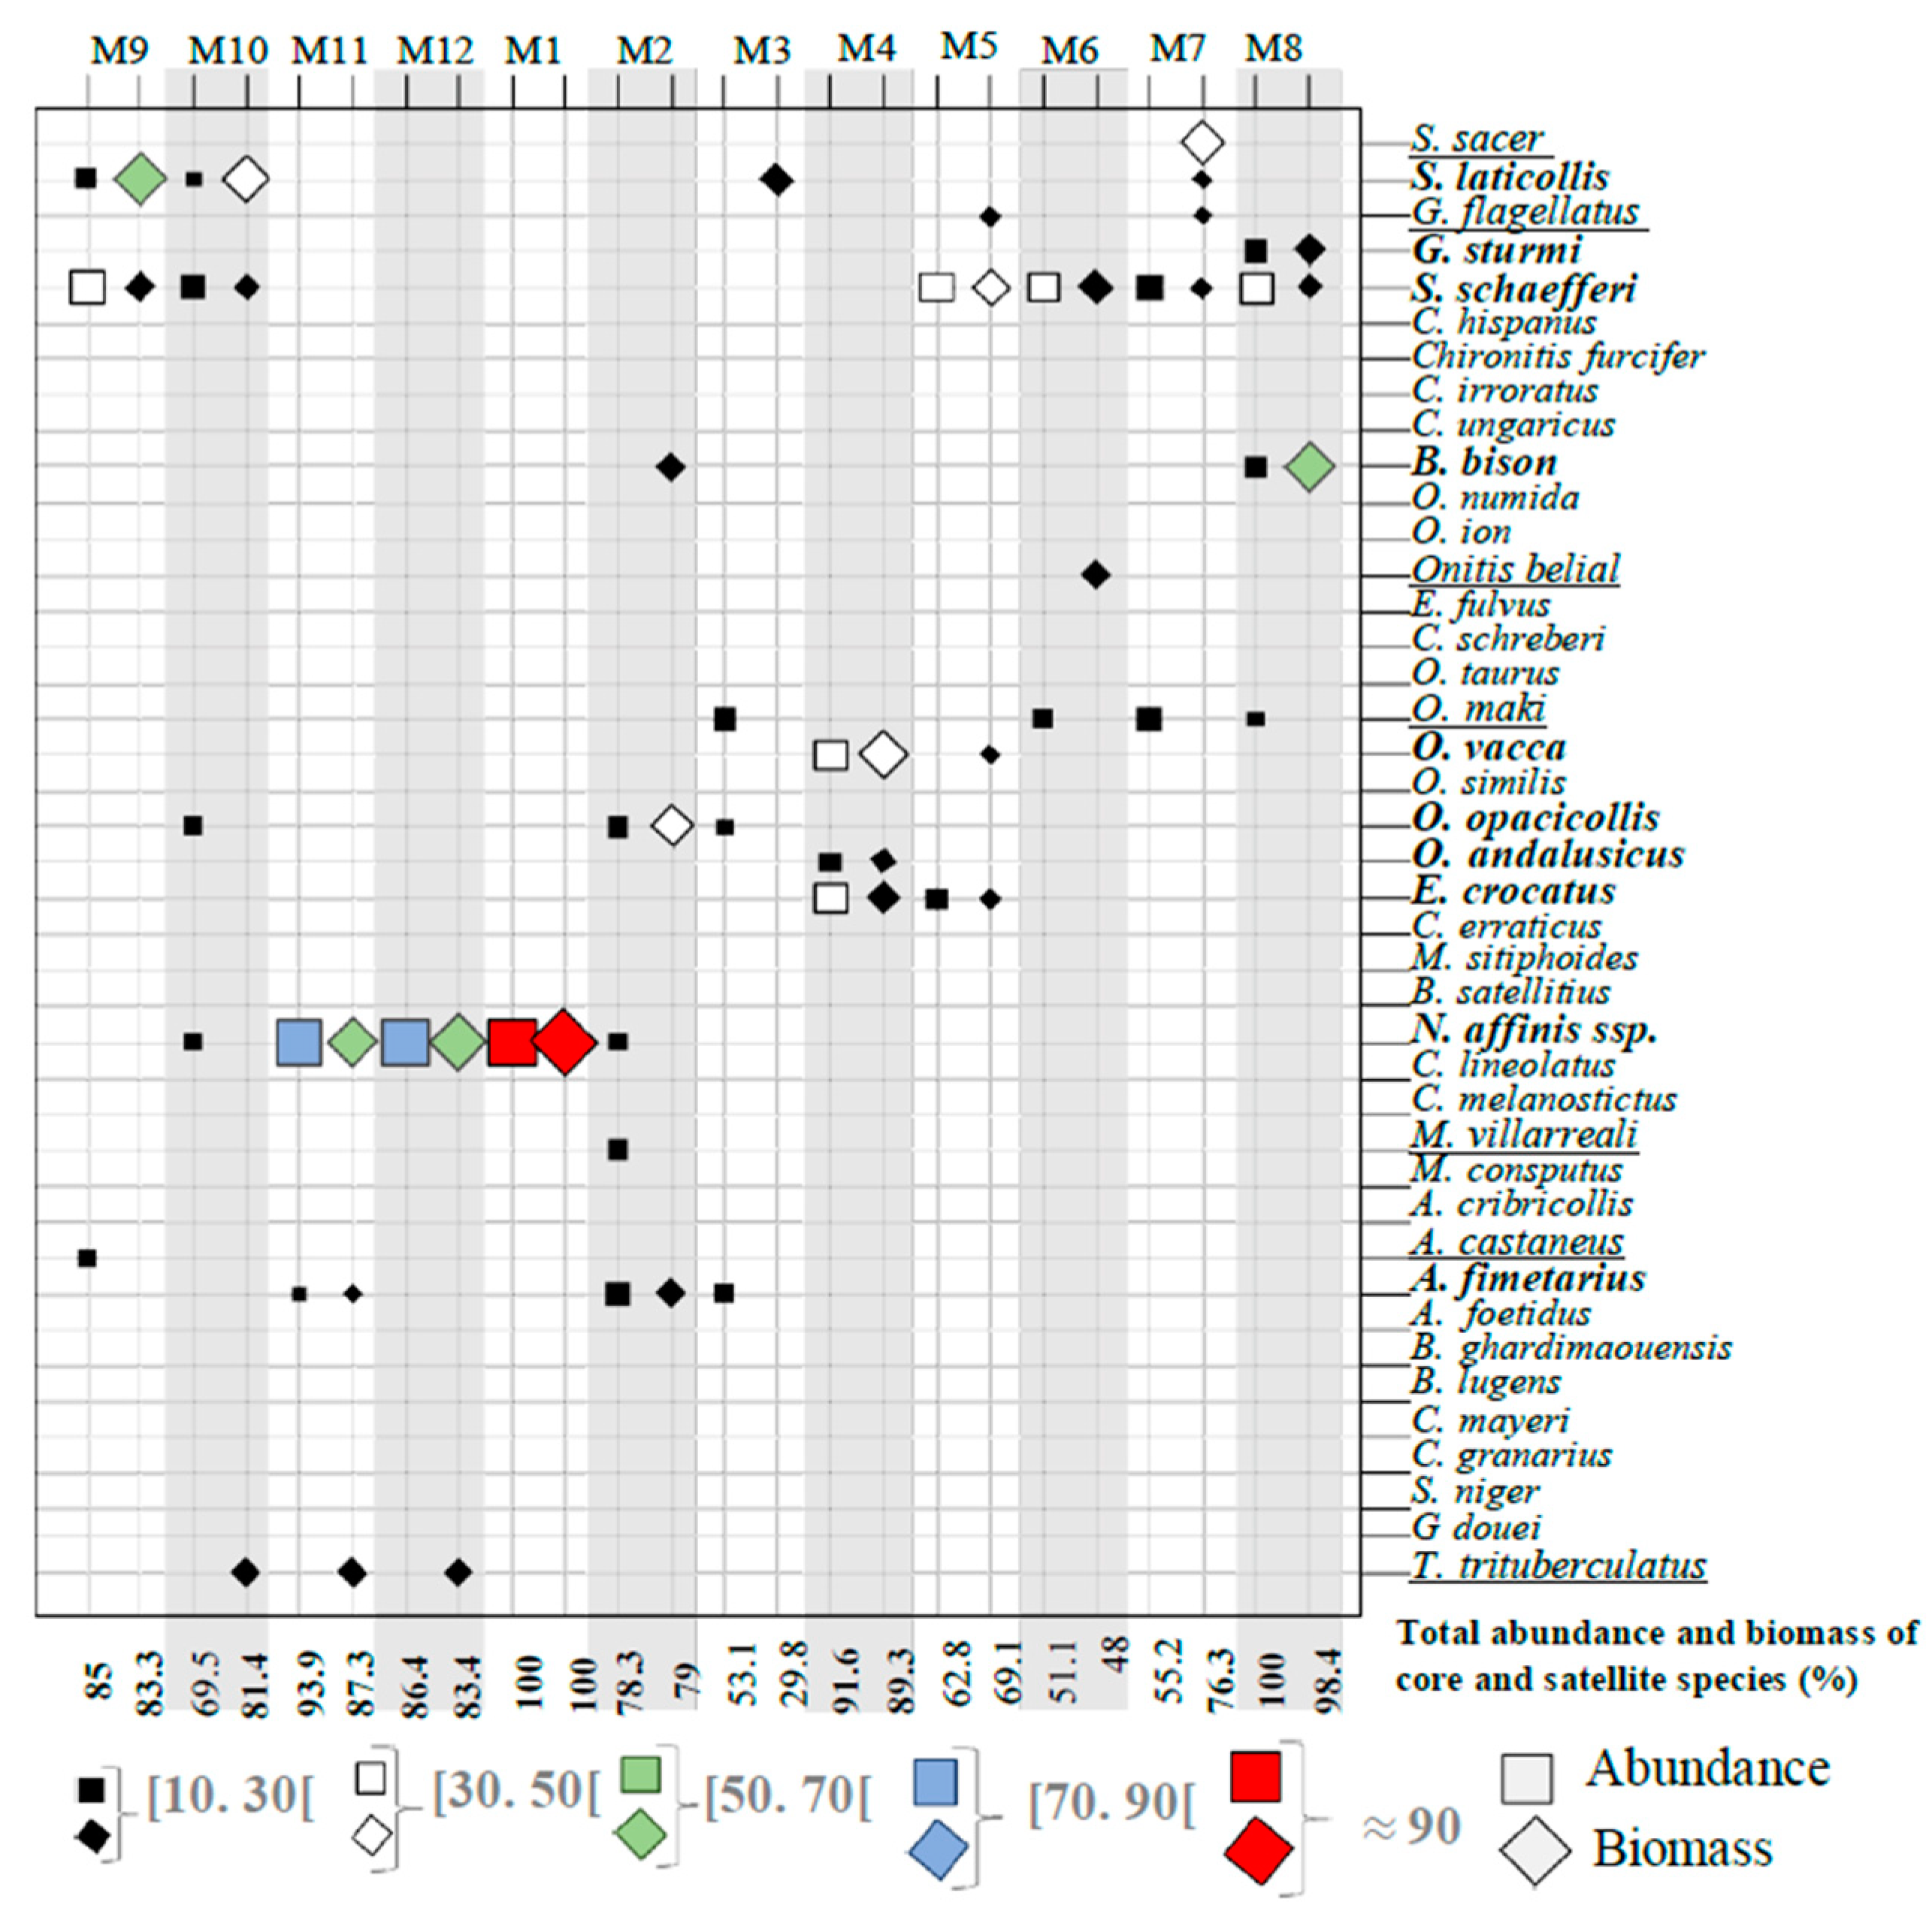
In all the monitored sites, the core and satellite species (usually two to five) represented more than 70% and often more than 80% of the total number and/or biomass of the beetles in a community at any time of the year. Each of these was rarely dominant for more than a few weeks or months, being followed by another combination of core and satellite species, enabling almost 50% of the total number of species recorded during the year to acquire a core or satellite species status: 19 species (9 core and 10 satellite species) out of a total of 39 at Fez-Sais (Figure 2); 20 (13 core and 7 satellite species) out of 35 at Immouzzer (Figure 3); 17 (10 core and 7 satellite) out of 42 at Ifrane I (Figure 4); and 18 (12 core and 6 satellite) out of 43 at Ifrane II (Figure 5).
In autumn and winter, some non-nester species became dominant in the dung beetle communities at all sites. At Fez-Sais in September and October, Anomius castaneus dominated the community in terms of numbers (97.9% of individuals in September). In September, two species dominated, Cheironitis ungaricus and A. castaneus, which together accounted for almost 87% of the cumulative biomass of all the individuals in the community (Figure 2). At Immouzzer, A. castaneus and Aphodius fimetarius were seasonal species that appeared in large numbers between September and November. The winter non-nester species Amidorus cribricollis was also well represented between December and February (Figure 3). At Ifrane I, Nimbus affinis dominated the community throughout winter, both in numbers and biomass, in association with Thorectes trituberculatus in November and December. Nimbus affinis was the only active species in January (100% both in numbers and biomass) (Figure 4). At Ifrane II, during the winter season and from November to January, N. affinis was the dominant species both in terms of numbers and biomass. To a lesser extent, this species was accompanied by several satellite species, based either on the biomass they represented in the community (Scarabaeus sacer, Scarabaeus laticollis, and Onthophagus marginalis ssp. andalusicus) or the number of their individuals (A. cribricollis and A. fimetarius).
In spring and summer (March to August), the non-nester species disappeared and were replaced by paracoprids and telecoprids. At Fez-Sais, three species were dominant in May in terms of numbers: Euonthophagus crocatus (paracoprid), Gymnopleurus flagellatus (telecoprid), and Gymnopleurus sturmi (telecoprid), which together accounted for 96.4% of the total number of individuals in the community, while G. flagellatus and G. sturmi together accounted for 93.4% in biomass. At Immouzzer, the small paracoprids were mainly represented by E. crocatus, which was active from March to June, with 62% of the total biomass of active species in April. At Ifrane I, in August, two telecoprids (G. sturmi and Sisyphus schaefferi) and two paracoprids (Bubas bison and Onthophagus maki) together accounted for 100% of the active dung beetles. At Ifrane II, from March to August, telecoprids (S. sacer, S. laticollis, G. flagellatus, G. sturmi, and S. schaefferi) and four small paracoprids (O. maki, Onthophagus vacca L., O. m. andalusicus, and E. crocatus) were the main species that composed the dung beetle community.

3.2. Core Species and Satellite Species

At all the sites, non-nester species became dominant in autumn, and this trend was confirmed in winter due to their numbers and biomass. At Fez-Sais, several small paracoprids replaced the non-nester species in early spring, especially Onthophagus melitaeus and E. crocatus, which were in turn supplanted from May until August by several telecoprids, especially G. flagellatus and more notably G. sturmi. At Immouzzer, the winter non-nester species were replaced by a cascading succession of small paracoprids from March to August, followed by large paracoprids in July and August (Cheironitis furcifer and C. irroratus). At Ifrane I and Ifrane II, the winter non-nester species were replaced by a combination of several small paracoprids (O. vacca and O. m. andalusicus) and telecoprids (S. sacer and S. schaefferi).

3.3. Diversity in the Communities and Environmental Variables

Calculations of Hill’s diversity numbers N0, N1, and N2 and Hill’s ratios E1 and E2 showed that all six indices change over time (Figure 6). The N0 index expresses taxonomic richness, whereas the E1 and E2 indices (Hill ratios) measure the diversity and equitability of samples, respectively.
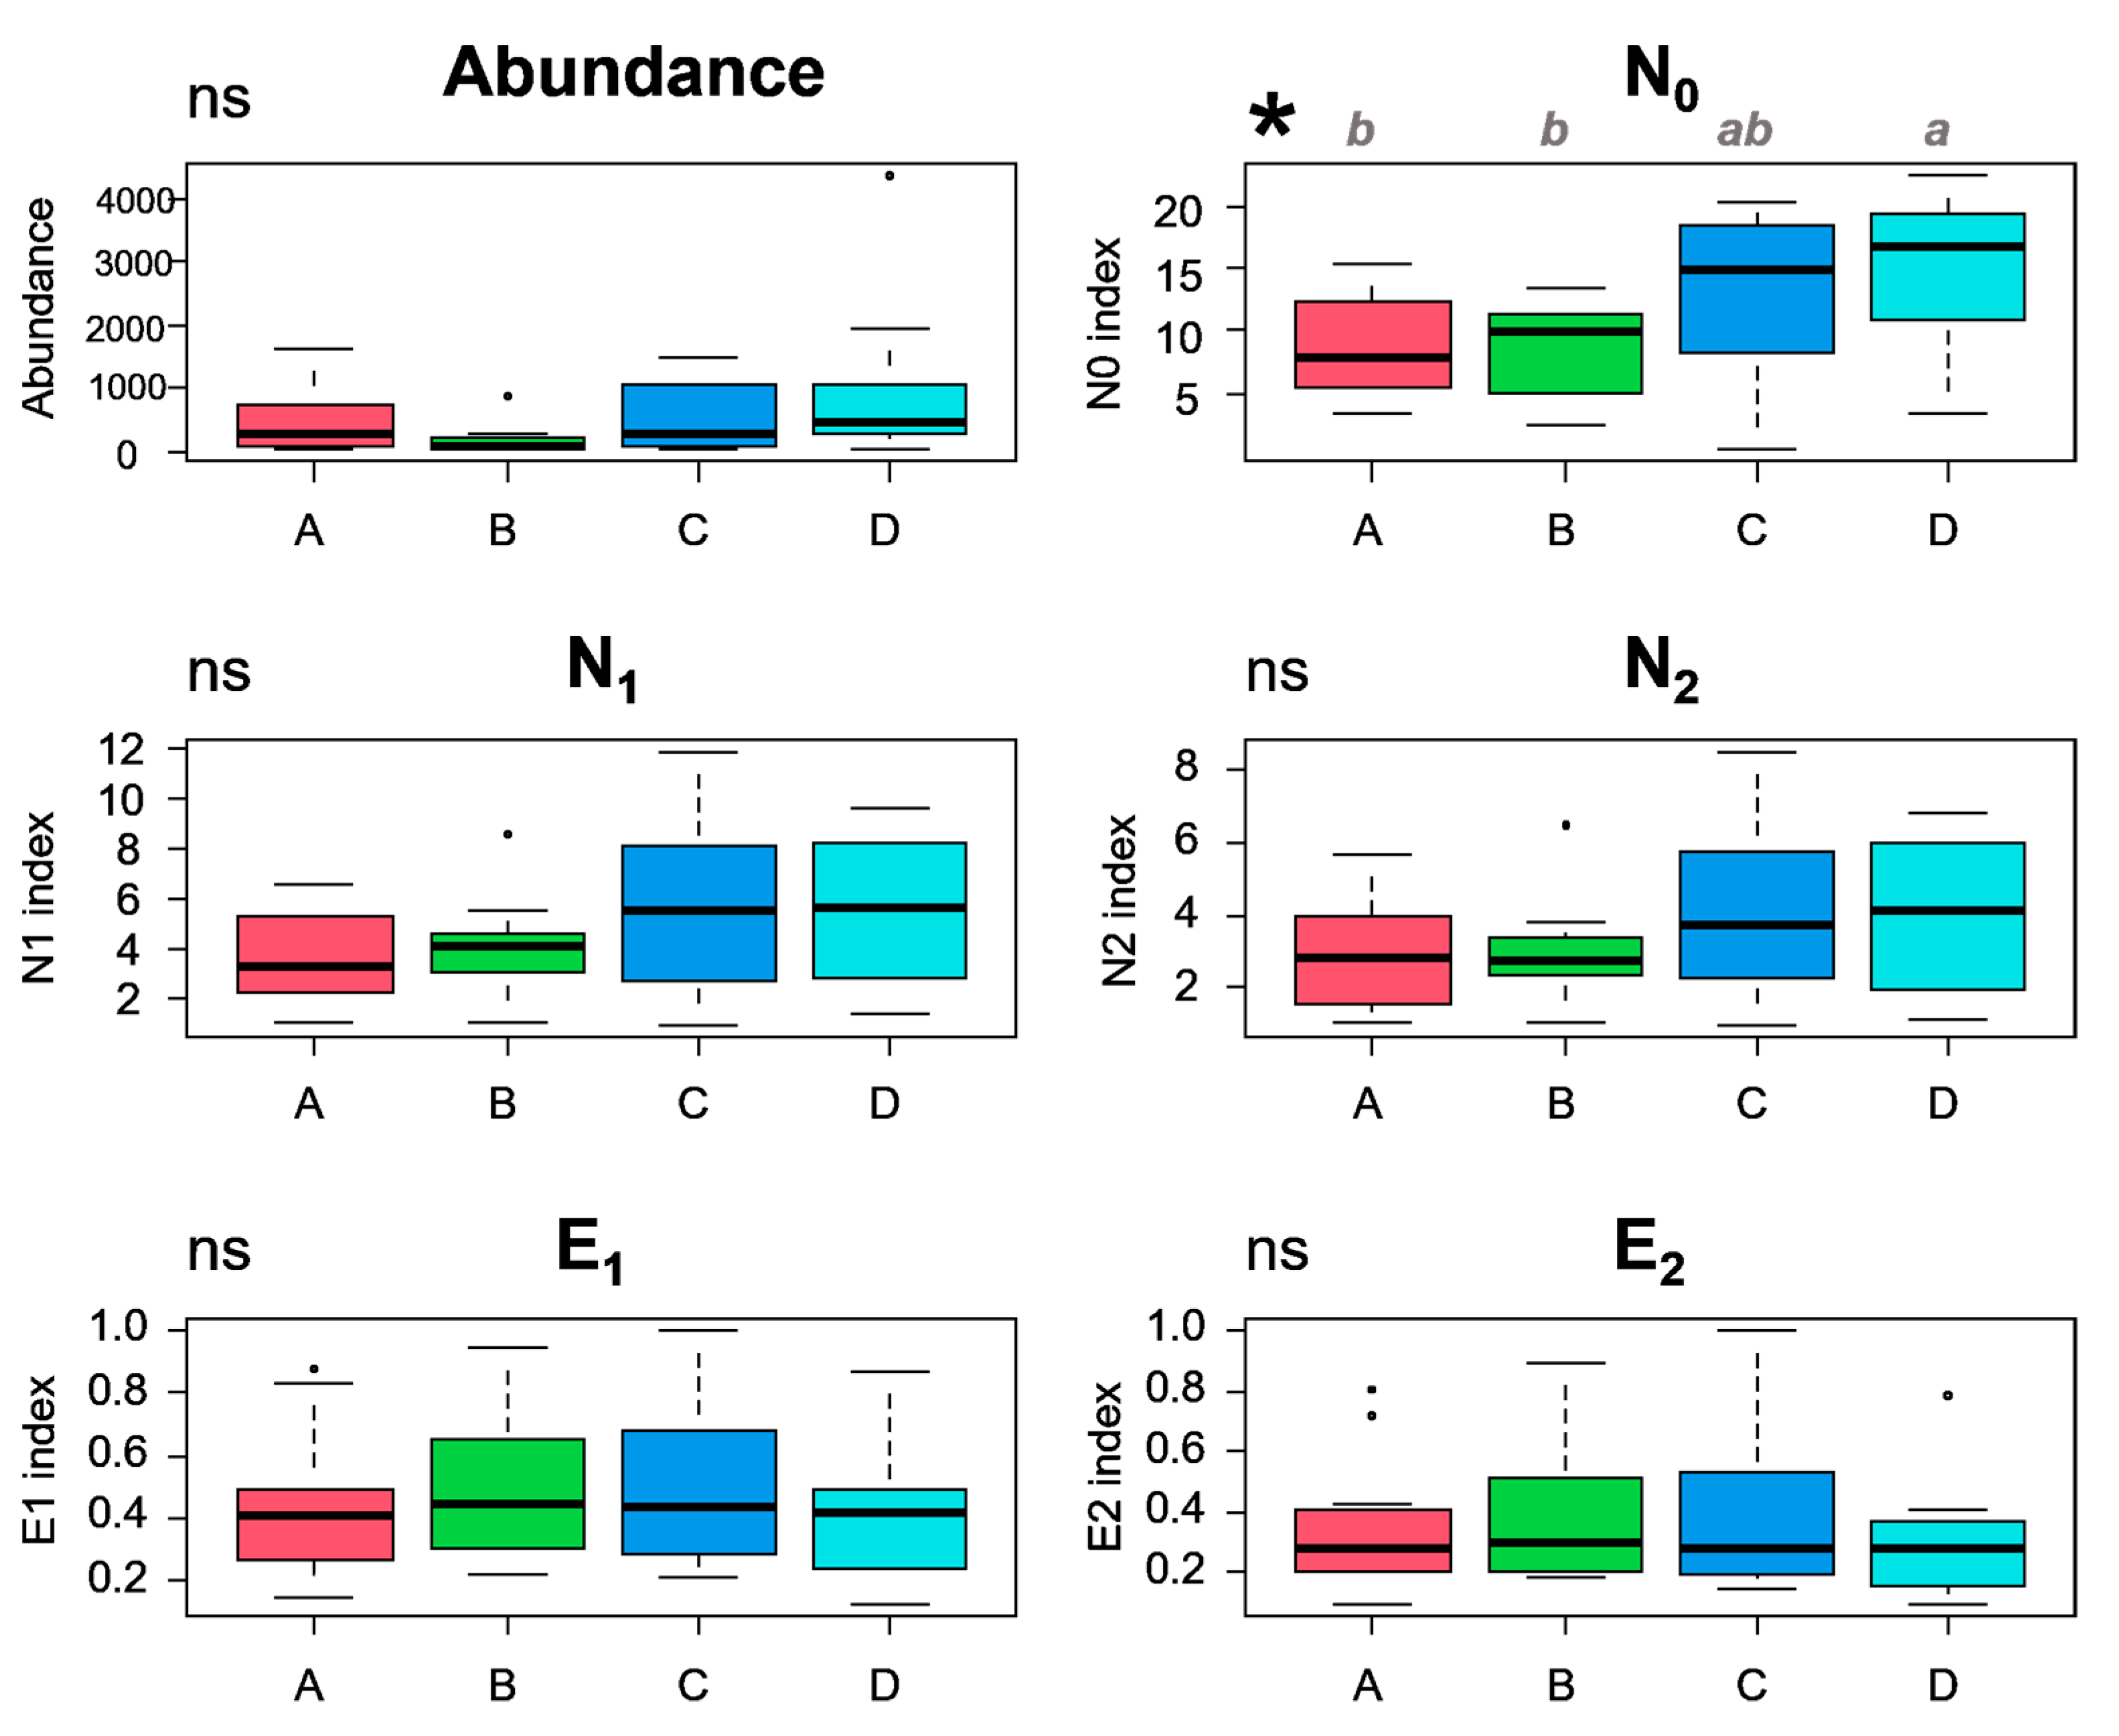
Figure 6 provides a clear visual representation of how abundance, diversity indices (N0, N1, and N2), and regularity (E1 and E2) changed over different sampling sites and months, both spatially and temporally. For a more detailed analysis of the statistical significance of these spatial changes, see Figure 7 and Figure 8.
There was a high abundance of individuals at higher elevations, particularly at Ifrane II in September, as well as in spring and early summer at Ifrane I and Ifrane II. For Ifrane I, the N1 and N2 values in March were particularly high (equaling 12 and 9, respectively). The difference in these diversity indices between the four sites was not statistically significant, except for N0 (richness), which showed a clear difference between Ifrane II and (Fez-Sais) and (Immouzzer) (Figure 8).
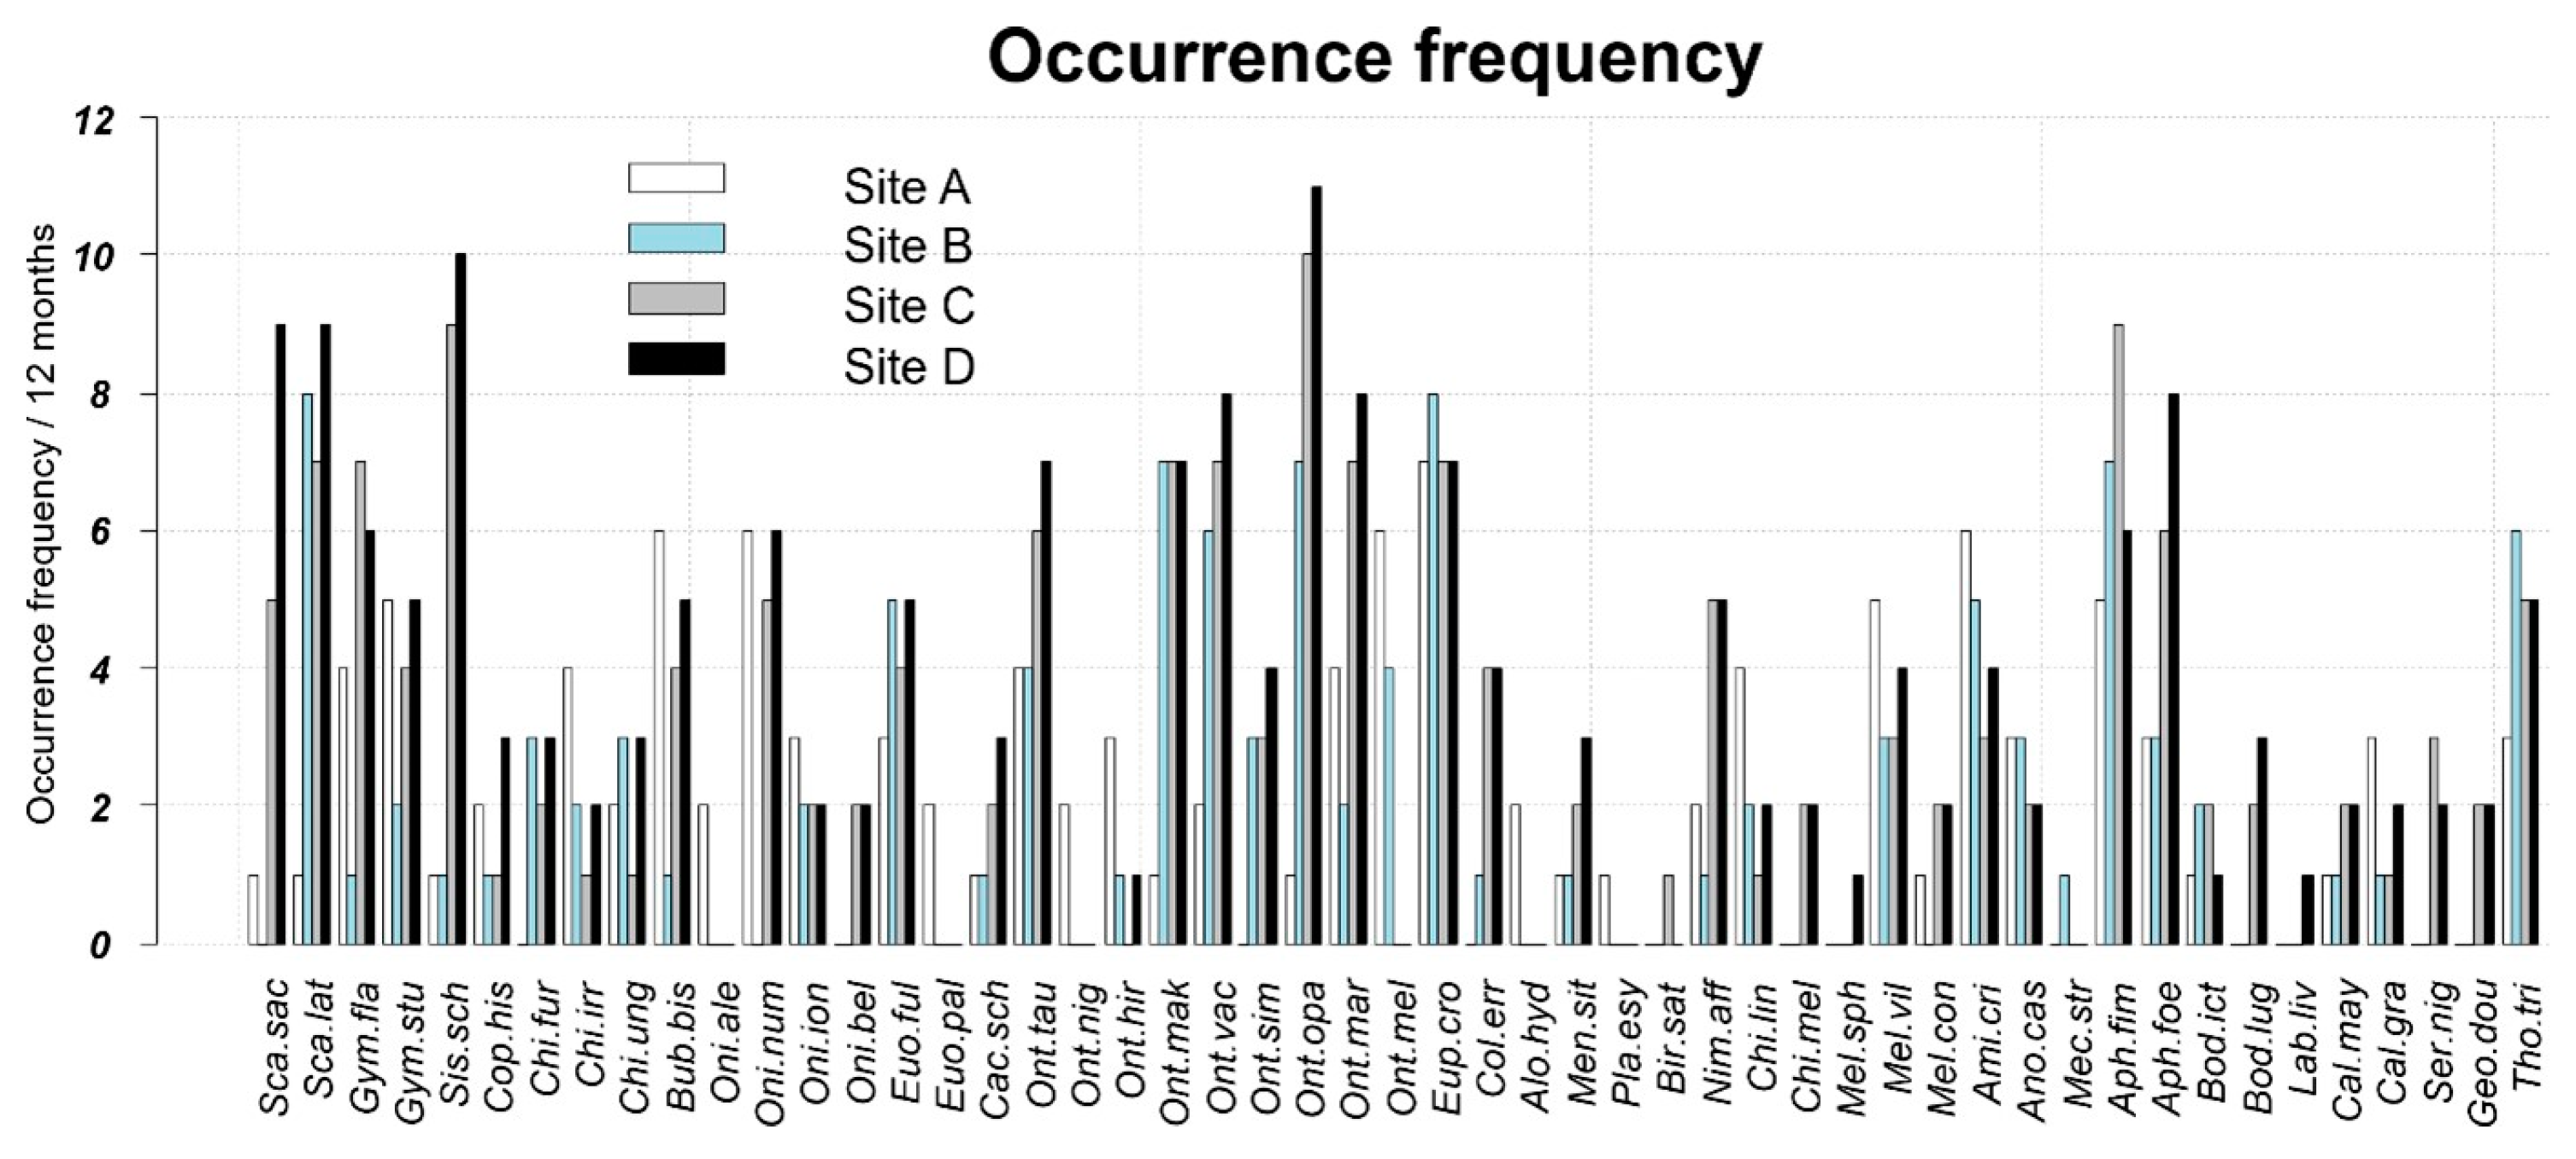
Figure 9 is a summary of species frequency for each site over the twelve-month sampling period. It illustrates fluctuations in dung beetle communities between sites, as well as species that are sensitive or insensitive to seasonal changes. Species activity was highly variable from one month to the next. This is expressed by the presence or absence of some species in the surveys. Some species can be considered indifferent to seasonal fluctuations (e.g., Onthophagus opacicollis, present 11 times over 12 months at Ifrane II), while others were rare and absent from most sites, such as Plagiogonus esymoides (only present at Fez-Sais), which can be regarded as quite occasional (Figure 9).
The results of the full redundancy analysis (RA) suggested that the ten environmental explanatory variables (Table S6) retained in this study explained 41.05% (38.44% after adjustment) of the variance in the temporal and spatial structure of the dung beetle communities studied. Out of all the variables scrutinized, only four proved statistically relevant, namely temperature, rainfall, relative wind speed, and elevation. The final model of the canonical redundancy analysis (RDA) indicates that the chosen four environmental factors account for 38.86% (35.17% after adjustment) of the variance in the spatio-temporal structure of the dung beetle community examined.
The findings indicate that the ultimate model is statistically significant (p = 0.0009), and each variable incorporated in this model is also significant (p = 0.0001). In addition, the first two canonical axes generated via the RDA are also statistically significant (p = 0.001) (Table S7). The adjusted RDA model explained 27.63% of the variation in these four explanatory variables distributed over the first two axes of the RDA. These play an important role in the dispersion of the species sampled at the four sites throughout the year. The RDA triplot (scaling 1,2) opposes along the first axis, from left to right, the coldest months with high rainfall (Group 1) to the warmest and driest months (Group 2). The second axis separates sites according to elevation (Figure 10).
An analysis using the non-metric multidimensional scaling (NMDS), with the Bray–Curtis dissimilarity matrix of the dung beetle species matrix (51 species/48 samples [= 4 sites × 12 months]), was used to graphically represent seasonal changes in the species communities. The correlation between the observed distance and the ordination distance (R2 > 0.91) and the low-stress value (0.103) suggests that the NMDS fit is satisfactory. Figure 11 shows three seasonal clusters: one on the left, comprising the hottest months with no or reduced rainfall (from May to September); in contrast, another cluster comprising the coldest months with high rainfall (from November to February) was set up on the right. Between these two clusters, a third groupx shows the transition between them; on the one hand, this group shows the transition from the cold, rainy season to the dry, hot season (March and April); on the other, the opposite transition (October).
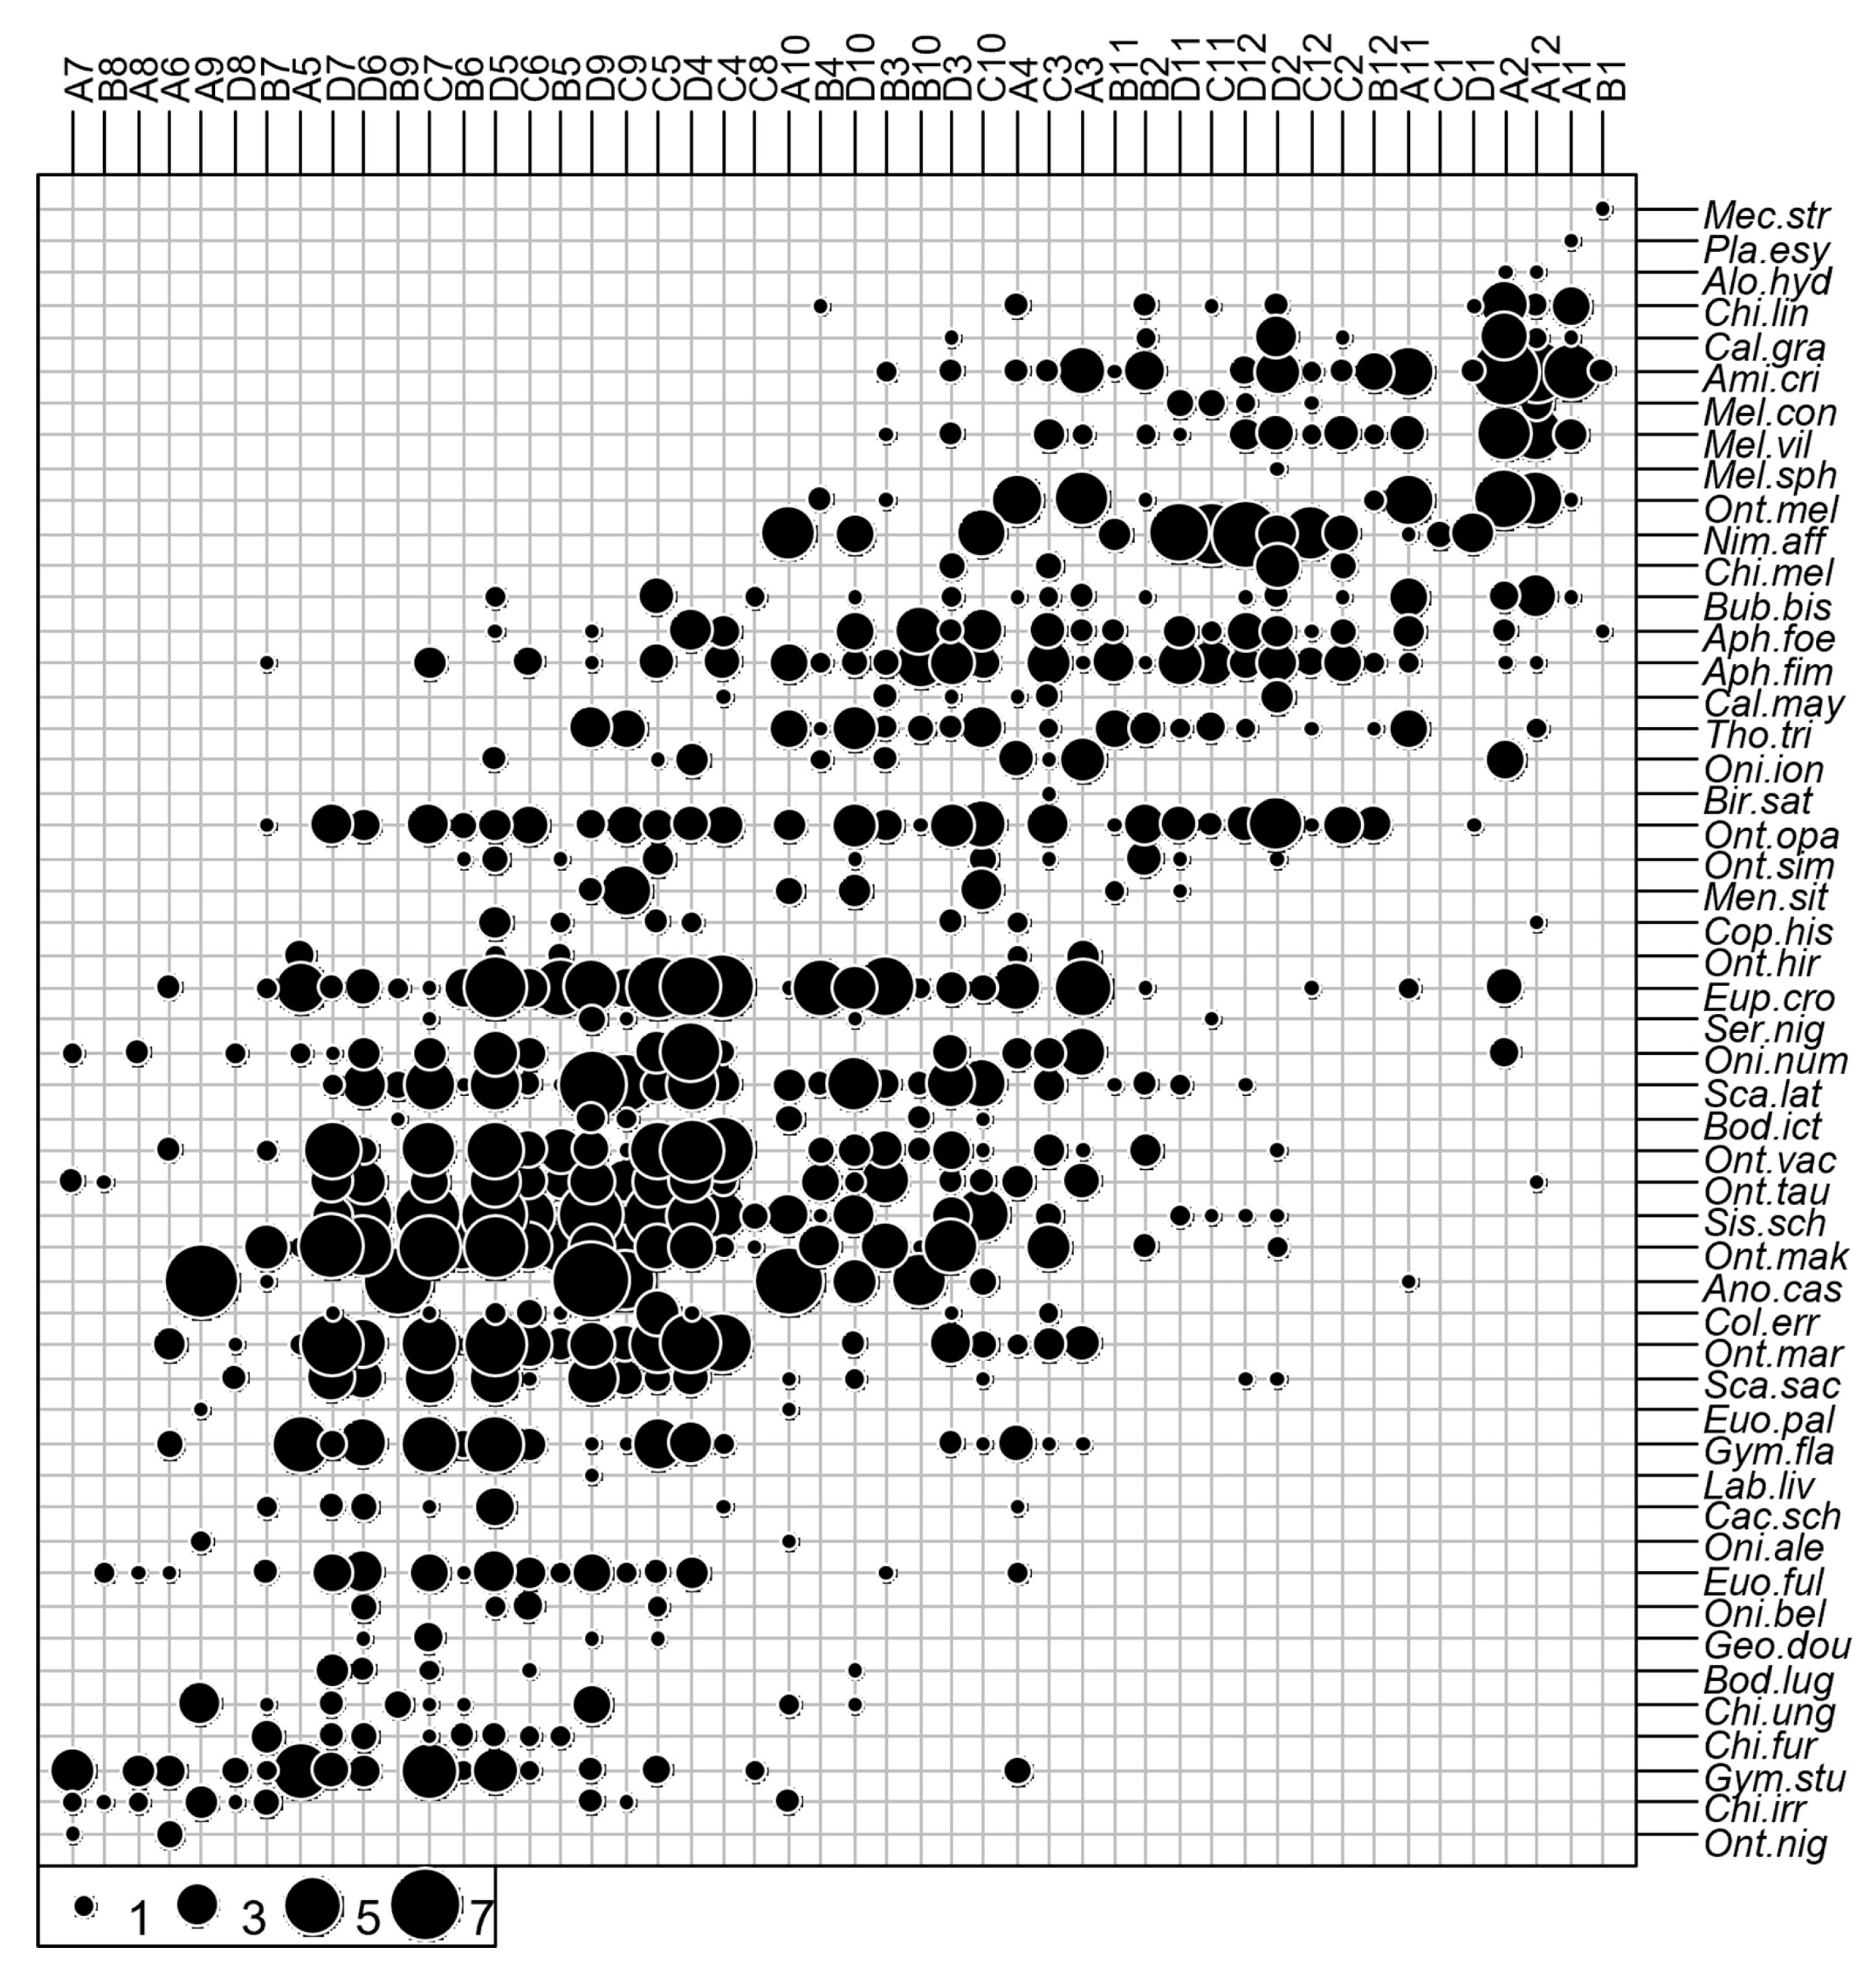
To exhibit groups or factor levels on ordination diagrams, we used the ordihull functionality from the vegan package. The groups were derived from the Bray–Curtis metric. Species can also be categorized into three groups: (1) species that prefer cold and wet months; (2) species that prefer hot and dry months, each group replacing the other during the transition months (months 3, 4, and 10); and (3) species that were indifferent to the seasonal changes. The ordination of the first axis of the correspondence analysis (CA) (Figure 12) confirms the results of this analysis.

4. Discussion

The organization of dung beetle communities depends on the combination of species traits (individual size, life cycles, and food preferences) and environmental variables (soil type, habitat characteristics, and elevation) [32,45,46,47,48,49]. Locally, the abundance of a species depends on the quantity and quality of the trophic resources available [28], the quantity of dung required for reproduction being directly linked to the size of the individuals [45,50]. This relationship makes it possible to identify the most important species involved in the use of dung at any given time. Smaller species compensate for their size by many individuals to achieve the same level of functional efficiency as larger species, hence the combination of the criteria size (or weight) and number of individuals to identify the core and satellite groups. The organization of dung beetle communities in the Middle Atlas, characterized by very few dominant species at the same time, is like those observed in the mountains of alpine areas [23,30,46,47,48], as well as in Mediterranean environments [29,46,47,51,52,53,54,55], and in North America [32,49,56].
However, despite the elevational gradient of the sites under study (elevational variation of 1000 m), few differences were observed in the organization of their dung beetle communities year-round. In general, along an elevational gradient, their communities tend to become less diverse due to less favorable environmental conditions [48]. In the present study, the gradient was too weak to observe a comparable situation. Non-nester species were active during the coldest and wettest periods of the year (late autumn and winter) and were later replaced by paracoprids and/or telecoprids during the rest of the year. This sharing of the activity periods by the guilds can be related to climatic conditions (temperature and precipitations), which influence the moisture content of the dung and its quality. Non-nester species quickly colonize dung once it has been deposited. Their eggs are laid directly in the fecal matter, and the larvae eat and develop within the dung mass. This reproductive strategy is observed in most Aphodiinae, where females compensate for the non-protection of their eggs with a high fecundity [57]. Larval development often takes several weeks, and it is crucial that the dung mass retains sufficient moisture content throughout this period. In this sense, autumn and winter were particularly favorable periods for non-nester species. They also avoid competition with the paracoprids and telecoprids, which require higher temperatures to reproduce. Paracoprids and telecoprids use a substantial proportion of dung, which is unfavorable for the non-nester species whose larvae develop unprotected inside the dung pats. On the other hand, paracoprids reduce the direct constraints due to dry conditions by burrowing under the dung and accumulating the material in the soil profile, where it retains its initial moisture content. The accumulated reserves enable their larvae to develop in a protected environment without high competition. This parental effort is compensated by reduced fecundity in the females, as most of their offspring reach maturity. There are different ways of storing the food mass for larvae. Dung may be packed at the blind end of a gallery like a sausage (most Geotrupidae; Bubas and Cheironitis species) or like pellets (e.g., Onthophagus species). In the Coprini tribe, the brood mass is remodeled into several brood balls containing an egg (Copris species). The telecoprid species quickly compact fresh dung, which is shaped into a ball and rolled several meters away from the initial mass. It is then buried in an underground chamber where conditions ensure that the brood ball will retain sufficient humidity to support the development of the larvae [58].
Competition between paracoprids and telecoprids was restricted mainly to sharing the trophic resources available in the pastures, with no real competition for egg-laying sites: paracoprids exploited the volume of space below the droppings to dig their nests, while telecoprids dispersed in search of egg-laying sites. The rapid succession of species making up the core and satellite groups probably restricted interspecific competition. Only around 20% of species can be considered to have played a decisive role in the functioning of each site studied (Figure 2, Figure 3, Figure 4 and Figure 5). Despite structural similarities between the core and satellite groups, their composition was often different, even though some species were generalists and participated simultaneously in the formation of the core and satellite groups at several sites, such as S. sacer (two sites), A. fimetarius (three sites), and E. crocatus (four sites). Conversely, some species were dominant and characteristic of a single site, such as Onitis ion and O. melitaeus at Fez-Sais. Interestingly, even sites 1 km apart showed differences in their core and satellite groups, as seen in Ifrane I and Ifrane II, indicating that local conditions can play an important role in structuring communities.
The strategy of certain species to continue their activity over a long period could possibly impede other species, which have insufficient trophic resources to develop large populations. This is potentially the case for G. sturmi at Fez-Sais, which remained active for four consecutive months (May to August) during the warm period, while A. castaneus (September-October) and A. cribricollis (November-February) relayed each other to use most of the trophic resources in autumn and winter, these three species offering limited opportunities to the other species in the community (Figure 2). Similarly, E. crocatus was extremely dominant at Immouzzer, where there were no other species present to compete for four months (March to June) (Figure 3). At Ifrane I, two core species were dominant: S. schaefferi (small roller), which remained active for half the year, and N. affinis (dweller), taking over between November and January (Figure 4). At Ifrane II, N. affinis and S. laticollis (roller) successively dominated the dung beetle community and were the more distinctive species in the functioning of the site (Figure 5).
As expected, differences in the life traits of species can contribute to their spatio-temporal segregation, allowing each of them to exploit the available trophic resources in turn. Although the abundance and/or biomass of accessory species (more than fifty percent of total species) were very low compared with the other active species at a given time to have a substantial ecosystem impact, their presence remained important, as some of them could constitute a functional reserve in the future in the event of disturbance to the system. The populations of some dominant species could collapse under unfavorable conditions, and these accessory species, which in the meantime have found only narrow trophic niches in which to maintain themselves, could eventually take over and provide the same functions as those provided by the current dominant species [28].
Biodiversity fluctuates over time and space, resulting from intricate interactions among abiotic factors [59]. For insects, seasonality primarily hinges on three factors, namely resource availability, temperature, and precipitation [60]. This is true even for dung beetle communities [61,62]. The beetle populations changed over time due to dominant factors such as temperature, precipitation, and elevation, as illustrated by the redundancy analysis. This analysis divided the surveys into two main groups, winter and summer, respectively, with an additional group created to highlight the transition between the other two. The transition group encompassed months 3 and 4 (March–April), delineating the shift from the cold, wet season to the dry, hot period, whilst month 10 (October) showed the opposite change.
This change is illustrated by the composition of the two main taxonomic groups. The first one consisted of species present during the winter months, from November to February, when average monthly temperatures were below 14.5 °C at all sites. The second group comprised thermophilic species that tended to be present during summer, from May to September, when average monthly temperatures at all sites were above 20 °C. The months of March, April, and November, which were positioned between these two groups, were transitional periods. A third group consisted of indifferent and eurythermic species that may occur at any time of the year, with varying frequency. This group was quite diverse, with some species displaying a distinct inclination toward the summer season while others were more typical of the transitional months.
Our findings contribute to the understanding of the regional dynamics of dung beetle communities in the Moroccan Middle Atlas and enhance our insight into their diversity within an environment facing multiple climatic constraints.

Supplementary Materials

The following supporting information can be downloaded at https://www.mdpi.com/article/10.3390/d15111138/s1. Table S1. Monthly participation from September 2018 (month M9) to August 2019 (month M8) of core and satellite species in the Fez-Sais site. For each month, the left-hand column corresponds to the cumulative numbers (in %) of individuals, and the right-hand column corresponds to their biomass (%). Table S2. Monthly participation from September 2018 (month M9) to August 2019 (month M8) of core and satellite species in Immouzzer. For each month, the left-hand column corresponds to the cumulative numbers (in %) of individuals, and the right-hand column corresponds to their biomass (%). Table S3. Monthly participation from September 2018 (month M9) to August 2019 (month M8) of core and satellite species in the Ifrane I site. For each month, the left-hand column corresponds to the cumulative numbers (in %) of individuals, and the right-hand column corresponds to their biomass (%). Table S4. Monthly participation from September 2018 (month M9) to August 2019 (month M8) of core and satellite species in the Ifrane II site. For each month, the left-hand column corresponds to the cumulative numbers (in %) of individuals, and the right-hand column corresponds to their biomass (%). Table S5. Monthly Headcount of Core and Satellite Species Recorded from September 2018 to August 2019. Table S6. Data Matrix of Mesological Observations for the Period September 2018–August 2019. Table S7. Numerical Results for Figure 8 and Figure 10.

Author Contributions

Conceptualization, H.H., A.J.-I. and J.-P.L.; methodology, H.H., A.J.-I. and J.-P.L.; software Y.M. and A.F.T.; validation, A.J.-I., J.-P.L. and Y.M.; formal analysis, A.F.T. and Y.M.; field investigation, H.H., A.J.-I. and J.-P.L.; resources, V.C., A.J.-I. and J.-P.L.; writing—original draft preparation, H.H., J.-P.L., Y.M. and V.C.; writing—review and editing, all authors.; supervision, A.J.-I., J.-P.L. and Y.M.; project administration, V.C., A.J.-I. and J.-P.L.; funding acquisition, V.C. All authors have read and agreed to the published version of the manuscript.

Funding

This research was funded through the Dung Beetle Ecosystem Engineers project supported by Meat and Livestock Australia and the Commonwealth Government’s Rural R&D for Profit program administered through the Department of Agriculture, Fisheries and Forestry. Contract Service Agreement between CSIRO and Faculty of Sciences Dhar el Mahraz n°2019030623.

Institutional Review Board Statement

The study was conducted in accordance with the Declaration of Helsinki and approved by the General Director of Office National de Sécurité Sanitaire des Produits Alimentaires (ONSSA), Rabat (Morocco) for the delivery of successive collect permits.

Data Availability Statement

The data presented in this study are contained within the article.

Acknowledgments

We acknowledge the University Sidi Mohamed Ben Abdellah for the Ph.D. grant support to H.H. Our warmest thanks go to Youness el Fattouhi, who assisted us regularly in the fieldwork. We also thank the CSIRO for its financial support (Research agreement: 2019030623).

Conflicts of Interest

The authors declare no conflict of interest.

References

  1. Braga, R.F.; Korasaki, V.; Andresen, E.; Louzada, J. Dung beetle community and functions along a habitat-disturbance gradient in the Amazon: A rapid assessment of ecological functions associated to biodiversity. PLoS ONE 2013, 8, e57786. [Google Scholar] [CrossRef] [PubMed]
  2. Louzada, J.N.C.; Silva, P.R.C.E. Utilisation of introduced Brazilian pastures ecosystems by native dung beetles: Diversity patterns and resource use. Insect Conserv. Divers. 2009, 2, 45–52. [Google Scholar] [CrossRef]
  3. Nichols, E.; Spector, S.; Louzada, J.; Larsen, T.; Amezquita, S.; Favila, M.E. Ecological functions and ecosystem services provided by Scarabaeinae dung beetles. Biol. Conserv. 2008, 141, 1461–1474. [Google Scholar] [CrossRef]
  4. Stanbrook, R.; King, J.R. Dung beetle community composition affects dung turnover in subtropical US grasslands. Ecol. Evol. 2022, 12, e8660. [Google Scholar] [CrossRef]
  5. Bang, H.S.; Lee, J.-H.; Kwon, O.S.; Na, Y.E.; Jang, Y.S.; Kim, W.H. Effects of paracoprid dung beetles (Coleoptera: Scarabaeidae) on the growth of pasture herbage and on the underlying soil. Appl. Soil Ecol. 2005, 29, 165–171. [Google Scholar] [CrossRef]
  6. Vulinec, K. Dung beetles (Coleoptera: Scarabaeidae), monkeys, and conservation in Amazonia. Fla. Entomol. 2000, 83, 229–241. [Google Scholar] [CrossRef]
  7. Nichols, E.; Gómez, A. Dung beetles and fecal helminth transmission: Patterns, mechanisms, and questions. Parasitology 2014, 141, 614–623. [Google Scholar] [CrossRef]
  8. Fowler, F.; Denning, S.; Hu, S.; Watson, W. Carbon neutral: The failure of dung beetles (Coleoptera: Scarabaeidae) to affect dung-generated greenhouse gases in the pasture. Environ. Entomol. 2000, 49, 1105–1116. [Google Scholar] [CrossRef]
  9. Penttilä, A.; Slade, E.M.; Simojoki, A.; Riutta, T.; Minkkinen, K.; Roslin, T. Quantifying beetle-mediated effects on gas fluxes from dung pats. PLoS ONE 2013, 8, e71454. [Google Scholar] [CrossRef]
  10. Verdú, J.R.; Sánchez-Piñero, F.; Lobo, J.M.; Cortez, V. Evaluating long-term ivermectin use and the role of dung beetles in reducing short-term CH4 and CO2 emissions from livestock faeces: A mesocosm design under Mediterranean conditions. Ecol. Entomol. 2019, 45, 109–120. [Google Scholar] [CrossRef]
  11. Doube, B.M. A functional classification for the analysis of dung beetle assemblages. Ecol. Entomol. 1990, 15, 371–383. [Google Scholar] [CrossRef]
  12. Tonelli, M. Some considerations on the terminology applied to dung beetle functional groups. Ecol. Entomol. 2021, 46, 772–776. [Google Scholar] [CrossRef]
  13. Favila, M.; Halffter, G. The use of indicator groups for measuring biodiversity as related to community structure and function. Acta Zool. Mex. 1997, 72, 1–25. [Google Scholar] [CrossRef]
  14. Bicknell, J.; Phelps, S.; Davies, R.; Mann, D.; Struebig, M.; Davies, Z.; Davies, G. Dung beetles as indicators for rapid impact assessments: Evaluating best practice forestry in the neotropics. Ecol. Indic. 2014, 43, 154–161. [Google Scholar] [CrossRef]
  15. Carvalho, R.L.; Andresen, E.; Barônio, G.J.; Oliveirad, V.H.F.; Louzada, J.; Rodrigo, F.; Braga, R.F. Is dung removal a good proxy for other dung beetle functions when monitoring for conservation? A case study from the Brazilian Amazon. Ecol. Indic. 2020, 109, 105840. [Google Scholar] [CrossRef]
  16. Gómez-Cifuentes, A.; Munevar, A.; Gimenez, V.C.; Gatti, M.G.; Zurita, G. Influence of land use on the taxonomic and functional diversity of dung beetles (Coleoptera: Scarabaeinae) in the southern Atlantic Forest of Argentina. J. Insect Conserv. 2017, 21, 147–156. [Google Scholar] [CrossRef]
  17. Nunes, C.A.; Braga, R.F.; de Moura Resende, F.; Neves, F.; Figueira, J.; Fernandes, G. Linking biodiversity, the environment and ecosystem functioning: Ecological functions of dung beetles along a tropical elevational gradient. Ecosystems 2018, 21, 1244–1254. [Google Scholar] [CrossRef]
  18. Verdú, J.R.; Lobo, J.M.; Sánchez-Piñero, F.; Gallego, B.; Numa, C.; Lumaret, J.-P.; Cortez, V.; Ortiz, A.J.; Tonelli, M.; García-Teba, J.P.; et al. Ivermectin residues disrupt dung beetle diversity, soil properties and ecosystem functioning: An interdisciplinary field study. Sci. Total Environ. 2018, 618, 219–228. [Google Scholar] [CrossRef]
  19. Lumaret, J.-P.; Kadiri, N.; Martínez, M.I. The Global Decline of Dung Beetles. In Imperiled: The Encyclopedia of Conservation; DellaSala, D.A., Goldstein, M.I., Eds.; Elsevier: Amsterdam, The Netherlands, 2022; Volume 3, pp. 553–562. [Google Scholar]
  20. Löbl, I.; Löbl, D. Catalogue of Palaearctic Coleoptera. Volume 3, Scarabaeoidea, Scirtoidea, Dascilloidea, Buprestoidea, Byrrhoidea; Revised and updated edition; Brill: Leiden, The Netherlands; Boston, MA, USA, 2016. [Google Scholar]
  21. Lumaret, J.-P.; Lobo, J.M. Geographic distribution of endemic dung beetles (Coleoptera, Scarabaeoidea) in the Western Palaearctic Region. Divers. Distrib. 1996, 3, 192–199. [Google Scholar] [CrossRef]
  22. Numa, C.; Tonelli, M.; Lobo, J.M.; Verdú, J.R.; Lumaret, J.-P.; Sánchez-Piñero, F.; Ruiz, J.L.; Dellacasa, M.; Ziani, S.; Arriaga, A.; et al. The Conservation Status and Distribution of Mediterranean Dung Beetles; IUCN: Gland, Switzerland; Málaga, Spain, 2020. [Google Scholar]
  23. Errouissi, F.; Jay-Robert, P.; Lumaret, J.-P.; Piau, O. Composition and structure of dung beetle (Coleoptera: Aphodiidae, Geotrupidae, Scarabaeidae) assemblages in mountain grasslands of the Southern Alps. Ann. Entomol. Soc. Am. 2004, 97, 701–709. [Google Scholar] [CrossRef]
  24. Haloti, S.; Janati-Idrissi, A.; Chergui, H.; Lumaret, J.-P. Structure des communautés de Scarabéides coprophages du Maroc nord-occidental (Coleoptera, Scarabaeoidea). Bull. Inst. Sci. Rabat Sci. Vie 2006, 28, 25–34. [Google Scholar]
  25. Lobo, J.M.; Lumaret, J.-P.; Jay-Robert, P. Diversity, distinctiveness, and conservation status of the Mediterranean coastal dung beetle assemblages in the Regional Natural Park of the Camargue (France). Divers. Distrib. 2001, 7, 257–270. [Google Scholar] [CrossRef]
  26. Horgan, F.G. Burial of bovine dung by coprophagous beetles (Coleoptera: Scarabaeidae) from horse and cow grazing sites in El Salvador. Eur. J. Soil Biol. 2001, 37, 103–111. [Google Scholar] [CrossRef]
  27. Lobo, J.M. Estimation of dung beetle biomass (Coleoptera: Scarabaeoidea). Eur. J. Entomol. 1993, 90, 235–238. [Google Scholar]
  28. Lumaret, J.-P.; Kadiri, N.; Bertrand, M. Changes in resources: Consequences for the dynamics of dung beetle communities. J. Appl. Ecol. 1992, 29, 349–356. [Google Scholar] [CrossRef]
  29. Kadiri, N. Effets des Activités Sylvo-Pastorales sur la Structure et la Dynamique des Communautés de Scarabéidés Coprophages en Région Méditerranéenne. Ph.D. Dissertation, Faculté des Sciences et Techniques de Saint-Jérôme, Université Aix-Marseille 3, Aix-en-Provence, France, 1993. [Google Scholar]
  30. Stiernet, N.; Lumaret, J.-P. Organisation des peuplements de Scarabéidés coprophages de Vanoise (Insectes Coléoptères). In Sciences Naturelles et Montagnes; Deloince, R., Ed.; Actes 116ème Congrès national des Sociétés historiques et scientifiques, Chambéry-Annecy 1991; Les Editions du CTHS (Publ.): Paris, France, 1993; pp. 225–239. [Google Scholar]
  31. Hanski, I. Dynamics of regional distribution: The core and satellite species hypothesis. Oikos 1982, 38, 210–221. [Google Scholar] [CrossRef]
  32. Kadiri, N.; Lumaret, J.-P.; Floate, K.D. Functional diversity and seasonal activity of dung beetles (Coleoptera: Scarabaeoidea) on native grasslands in southern Alberta, Canada. Can. Entomol. 2014, 146, 291–305. [Google Scholar] [CrossRef]
  33. Hanski, I.; Cambefort, Y. Dung Beetle Ecology; Princeton University Press: Princeton, NJ, USA, 1991. [Google Scholar]
  34. Janati-Idrissi, A. Les Scarabéides Coprophages des Pelouses Sèches du Maroc Occidental: Structure des Communautés et Rôle Ecologique. Ph.D. Dissertation, Faculté des Sciences Dhar el Mahraz, Univ. Sidi Mohamed Ben Abdellah, Fez, Morocco, 2000. [Google Scholar]
  35. Lobo, J.M.; Martin-Piera, F.; Veiga, C.M. Las trampas con cebo, sus posibilidades en el estudio de la communidades coprófagas de Scarabaeoidea (Col.). I: Características determinantes de su capacidad de captura. Rev. Ecol. Biol. Sol. 1988, 25, 77–100. [Google Scholar]
  36. Baraud, J. Coléoptères Scarabaeoidea: Faune du Nord de l’Afrique, du Maroc au Sinaï; Lechevalier Publ.: Paris, France, 1985. [Google Scholar]
  37. Dray, S.; Dufour, A.-B. The ade4 Package: Implementing the Duality Diagram for Ecologists. J. Stat. Softw. 2007, 22, 1–20. [Google Scholar] [CrossRef]
  38. Borcard, D.; Gillet, F.; Legendre, P. Numerical Ecology with R, 2nd ed.; Springer International Publ.: Berlin/Heidelberg, Germany, 2018. [Google Scholar]
  39. Alatalo, R.; Alatalo, R. Components of diversity: Multivariate analysis with interaction. Ecology 1977, 58, 900–906. [Google Scholar] [CrossRef]
  40. Legendre, P.; Legendre, L. Numerical Ecology, 3rd ed.; Elsevier Publ.: Amsterdam, The Netherlands, 2012. [Google Scholar]
  41. Hill, M.O. Diversity and evenness: A unifying notation and its consequences. Ecology 1973, 54, 427–432. [Google Scholar] [CrossRef]
  42. Peet, R.K. The measurement of species diversity. Annu. Rev. Ecol. Evol. Syst. 1974, 5, 285–307. [Google Scholar] [CrossRef]
  43. Alatalo, R.V. Problems in the measurement of evenness in ecology. Oikos 1981, 37, 199–204. [Google Scholar] [CrossRef]
  44. Brignon, C.; Sauvage, C.H. Carte des étages bioclimatiques au 1/2,000,000. Comité national Géogr. du Maroc: Atlas du Maroc, sect. II. Bull. Inst. Sci. de Rabat, 1962. [Google Scholar]
  45. Nealis, V.G. Habitat associations and community analysis of South Texas dung beetles (Coleoptera: Scarabaeinae). Can. J. Zool. 1977, 55, 138–147. [Google Scholar] [CrossRef]
  46. Lumaret, J.-P. Structure des peuplements de coprophages Scarabaeidae en région méditerranéenne française: Relations entre les conditions écologiques et quelques paramètres biologiques des espèces. Bull. Soc. Entomol. Fr. 1983, 88, 481–495. [Google Scholar] [CrossRef]
  47. Lumaret, J.P.; Kirk, A. Ecology of dung beetles in the French Mediterranean region (Coleoptera: Scarabaeidae). Acta Zool. Mex. (Nueva Ser.) 1987, 24, 1–55. [Google Scholar]
  48. Lumaret, J.-P.; Stiernet, N. Biogeography of dung beetle communities in the western and central Alps (Coleoptera, Scarabaeoidea). Biogeographia 1992, 16, 425–436. [Google Scholar]
  49. Floate, K.D.; Kadiri, N. Dung beetles (Coleoptera: Scarabaeidae) associated with cattle dung on native grasslands of southern Alberta, Canada. Can. Entomol. 2013, 145, 647–654. [Google Scholar] [CrossRef]
  50. Halffter, G.; Matthews, E.G. The natural history of dung beetles of the subfamily Scarabaeinae (Coleoptera: Scarabaeidae). Folia Entomol. Mex. 1966, 12–14, 1–312. [Google Scholar]
  51. Jay-Robert, P.; Lumaret, J.-P.; Lebreton, J.D. Spatial and temporal variation of mountain dung beetle assemblages and their relationships with environmental factors (Aphodiinae: Geotrupinae: Scarabaeinae). Ann. Entomol. Soc. Am. 2008, 101, 58–69. [Google Scholar] [CrossRef]
  52. Lobo, J.M.; Guéorguiev, B.; Chehlarov, E. Convergences and divergences between two European mountain dung beetle assemblages (Coleoptera, Scarabaeoidea). Anim. Biodivers. Conserv. 2007, 30, 83–96. [Google Scholar] [CrossRef]
  53. Menéndez, R.; Gutiérrez, D. Altitudinal effects on habitat selection of dung beetles (Scarabaeoidea Aphodiidae) in the northern Iberian Peninsula. Ecography 1996, 19, 313–317. [Google Scholar] [CrossRef]
  54. Janati-Idrissi, A.; Kadiri, N.; Lumaret, J.-P. Le partage du temps et de l’espace entre les guildes de Coléoptères coprophages dans le Moyen-Atlas (Maroc). Ann. Soc. Entomol. Fr. 1999, 35, 213–221. [Google Scholar]
  55. Mantoni, C.; Tsafack, N.; Palusci, E.; Di Pietro, S.; Fattorini, S. Diversity patterns of dung beetles along a Mediterranean elevational gradient. Insects 2021, 12, 781. [Google Scholar] [CrossRef]
  56. Lobo, J.M. Species diversity and composition of dung beetle (Coleoptera: Scarabaeoidea) assemblages in North America. Can. Entomol. 2000, 132, 307–321. [Google Scholar] [CrossRef]
  57. Martínez, I.M.; Lumaret, J.-P. Escarabajos Estercoleros: Biología Reproductiva y su Regulación (Coleoptera: Scarabaeidae y Geotrupidae); Asociación Española de Entomología Publ.: Madrid, Spain, 2022; 406p, Available online: https://www.entomologica.es/cont/publicaciones/docs/Docpubli1_26.pdf (accessed on 1 February 2023).
  58. Lumaret, J.-P. Desiccation rate of excrements: A selective pressure on dung beetles. In Time Scales of Biological Responses to Water Constraints. The Case of Mediterranean Biota; Roy, J., Aronson, J., Di Castri, F., Eds.; SPB Academic Publishing: Amsterdam, The Netherlands, 1995; pp. 105–118. [Google Scholar]
  59. Sanders, N.J.; Rahbek, C. The patterns and causes of elevational diversity gradients. Ecography 2012, 35, 1–3. [Google Scholar] [CrossRef]
  60. Wolda, H. Insect seasonality: Why? Annu. Rev. Ecol. Evol. Syst. 1988, 19, 1–18. [Google Scholar] [CrossRef]
  61. Tshikae, B.P.; Davis, A.L.; Scholtz, C.H. Species richness—Energy relationships and dung beetle diversity across an aridity and trophic resource gradient. Acta Oecol. Oecol. Gen. 2013, 49, 71–82. [Google Scholar] [CrossRef]
  62. Daoudi, L.; Chavanon, G.; Taybi, A.F.; Mabrouki, Y. Composition and phenology of the beetle community (Coleoptera: Scarabaeoidea, Staphylinidae, Histeridae, Hydrophilidae) associated to dung of equines in an arid environment. Ann. Soc. Entomol. Fr. 2022, 58, 155–164. [Google Scholar] [CrossRef]
Figure 1. Location of the study sites in Morocco. (A) Fez-Sais; (B) Immouzzer; (C) Ifrane I; and (D) Ifrane II. Red stars correspond to the position of the study sites.
Diversity 15 01138 g001
Figure 2. Monthly organization of the dung beetle community in Fez-Sais from September 2018 (month M9) to August 2019 (month M8). Core species names are mentioned in bold characters; satellite species are underlined. Squares and diamonds correspond to the relative abundance and biomass, respectively, of species that were part of the monthly groups of core species. The size of the squares and diamonds was adjusted to the relative part of each species.
Diversity 15 01138 g002
Figure 3. Monthly organization of the dung beetle community in Immouzzer from September 2018 (month M9) to August 2019 (month M8). Core species names are mentioned in bold characters; satellite species are underlined. Squares and diamonds correspond to the relative abundance and biomass, respectively, of species that were part of the monthly groups of core species. The size of the squares and diamonds was adjusted to the relative part of each species.
Diversity 15 01138 g003
Figure 4. Monthly organization of the dung beetle community in Ifrane I from September 2018 (month M9) to August 2019 (month M8). Core species names are mentioned in bold characters; satellite species are underlined. Squares and diamonds correspond to the relative abundance and biomass, respectively, of species that were part of the monthly groups of core species. The size of the squares and diamonds was adjusted to the relative part of each species.
Diversity 15 01138 g004
Figure 5. Monthly organization of the dung beetle community in Ifrane II from September 2018 (month M9) to August 2019 (month M8). Core species names are mentioned in bold characters; satellite species are underlined. Squares and diamonds correspond to the relative abundance and biomass, respectively, of species that were part of the monthly groups of core species. The size of the squares and diamonds was adjusted to the relative part of each species.
Diversity 15 01138 g005
Figure 6. Alpha diversity (Abundance, Hill’s diversity numbers N and Hill’s ratio E) obtained in the four collection sites (A: Fez-Sais (white bars); B: Immouzzer (blue bars); C: Ifrane I (grey bars); and D: Ifrane II (black bars)), during the 12 months of sampling. Hill’s diversity numbers: N0 (=number of species = Species richness); N1 = exp(H), with H = Shannon entropy = number of abundant species; N2 = 1/λ (λ: Simpson index = the number of dominant species). Hill’s ratio E1 = N1/N0; Hill’s ratio E2 = N2/N0 [39].
Diversity 15 01138 g006
Figure 7. Scatter plots and pairwise correlation matrix of alpha diversity indices (Hill’s diversity numbers N and Hill’s ratio E) obtained from beetle’s abundance data. Significant correlations are in bold, with stars at the bottom. p-values: ** ≤ 0.01, *** ≤ 0.001 Red lines represent the lowess smoothing.
Diversity 15 01138 g007
Figure 8. Boxplots of six diversity indices grouped according to the sites: Fez-Sais (A); Immouzzer (B); Ifrane I (C); and Ifrane II (D). The significant overall difference between sites after analysis of variance. The letters above indicate whether there is a significant difference between sites in pairwise post hoc comparisons (the same letter indicates no difference); ns: not significant. p-values: * ≤ 0.05; ** ≤ 0.01.
Diversity 15 01138 g008
Figure 9. Species occurrence at the four collection sites during the 12 months of sampling. Fez-Sais (A; white bars); Immouzzer (B; blue bars); Ifrane I (C; grey bars); and Ifrane II (D; black bars).
Diversity 15 01138 g009
Figure 10. RDA Triplot (scaling 1, 2): the relationship between environmental variables [rainfall (P), temperature (T), wind speed (W), and elevation (A)] and dung beetle species (Triplot 1) and the combination sites–months (scaling 2), respectively.
Diversity 15 01138 g010
Figure 11. Non-metric multidimensional scaling (NMDS) of samples categorized into three groups defined via the Bray–Curtis hierarchical clustering and Ward’s D2 method. The letters identify the four sites (Fez-Sais (A), Immouzzer (B), Ifrane I (C), and Ifrane II (D)) and the numbers of the sampling months (e.g., A9: site A, sampling month 9).
Diversity 15 01138 g011
Figure 12. Ordination of samples along the F1 axis of a correspondence analysis (CA). The matrix is composed of 48 samples/51 species–samples (months x sites). The circles reflect the species’ abundance transformed into log(x + 1), and their sizes are proportional to the abundance.
Diversity 15 01138 g012
Table 1. List of species collected, individual biomass (dry weight, mg), guild membership [paracoprids (P), telecoprids (T), non-nesters (D)], and presence (X) or absence (0) at each station.
Family/SubfamilySpecies ListIndividual Biomass (mg)GuildPresence or Absence in Stations
Fez-SaisImmouzzerIfrane IIfrane II
ScarabaeinaeScarabaeus sacer Linnaeus 1758650.3TX0XX
Scarabaeus laticollis Linnaeus 1767173.0TXXXX
Gymnopleurus flagellatus (Fabricius 1787)98.9TXXXX
Gymnopleurus sturmi (McLeay 1821)85.0TXXXX
Sisyphus schaefferi (Linnaeus 1758)29.0TXXXX
Copris hispanus (Linnaeus 1764)427.6PXXXX
Cheironitis furcifer (Rossi 1792)68.5P0XXX
Cheironitis irroratus (Rossi 1790)93.7PXXXX
Cheironitis ungaricus (Rossi 1790)92.8PXXXX
Bubas bison (Linnaeus 1767)161.6PXXXX
Onitis alexis Klug 1835128.5PX0X0
Onitis numida (Laporte de Castelnau 1840)51.3PX0XX
Onitis ion (Olivier 1789)44.7PXXXX
Onitis belial (Fabricius 1798)433.3P00XX
Euoniticellus fulvus (Goeze 1777)25.0PXXXX
Euoniticellus pallens (Olivier 1789)19.5PX000
Caccobius schreberi (Linnaeus 1758) 7.0PXXXX
Onthophagus (s.str.) taurus (Schreber 1759)21.6PXXXX
Onthophagus (Parentius) nigellus (Illiger 1803)5.5PX000
Onthophagus (Trichonthophagus) hirtus (Illiger 1803)11.5PXX0X
Onthophagus (Trichonthophagus) maki (Illiger 1803)10.0PXXXX
Onthophagus (Palaeonthophagus) vacca (Linnaeus 1767)41.4PXXXX
Onthophagus (Palaeonthophagus) similis (Scriba 1790)7.6P0XXX
Onthophagus (Palaeonthophagus) opacicollis Reitter 189322.0PXXXX
Onthophagus (Palaeonthophagus) marginalis spp. andalusicus Waltl 183531.7PXXXX
Onthophagus (Amphionthophagus) melitaeus (Fabricius 1798)7.6PXX00
Euonthophagus crocatus (Mulsant & Godart 1873)22.1PXXXX
AphodiinaeColobopterus erraticus (Linnaeus 1758)22.1P0XXX
Alocoderus hydrochaeris (Fabricius 1798)11.1DX000
Mendidaphodius sitiphoides (D’Orbigny 1896)3.4DXXXX
Plagiogonus esymoides (Reitter 1892)2.7DX000
Biralus satellitius (Herbst 1789)23.0D00X0
Nimbus affinis ssp. orbignyi (Clouët des Pesruches 1896)5.8DXXXX
Chilothorax lineolatus (Illiger 1803)4.7DXXXX
Chilothorax melanostictus (W. Schmidt 1840)3.5D00XX
Melinopterus sphacelatus (Panzer 1798)3.8D000X
Melinopterus villarreali Baraud 19754.3DXXXX
Melinopterus consputus (Creutzer 1799)3.6DX0XX
Amidorus cribricollis (Lucas 1846)4.1DXXXX
Anomius castaneus (Illiger 1803)3.0DXXXX
Mecynodes striatulus (Waltl 1835)3.1D0X00
Aphodius (s.str.) fimetarius (Linnaeus 1758)10.0DXXXX
Aphodius (s.str.) foetidus (Herbst 1783)7.0DXXXX
Bodiloides ictericus ghardimaouensis (Balthasar 1929)4.0DXXXX
Bodilus lugens (Creutzer 1799)5.1D00XX
Labarrus lividus (Olivier 1789)4.7D000X
Calamosternus mayeri (Pilleri 1953)3.6DXXXX
Calamosternus granarius (Linnaeus 1767)3.3DXXXX
GeotrupidaeSericotrupes niger (Marsham 1802)210.3P00XX
Geotrupes (Stereopyge) douei Gory 1841523.7P00XX
Thorectes trituberculatus (Reitter 1893)129.0PXXXX
Total Species51 39354243
Disclaimer/Publisher’s Note: The statements, opinions and data contained in all publications are solely those of the individual author(s) and contributor(s) and not of MDPI and/or the editor(s). MDPI and/or the editor(s) disclaim responsibility for any injury to people or property resulting from any ideas, methods, instructions or products referred to in the content.