Article

Application of Fluctuating Asymmetry Values in Pelophylax ridibundus (Amphibia: Anura: Ranidae) Meristic Traits as a Method for Assessing Environmental Quality of Areas with Different Degrees of Urbanization

1
Department of Human Anatomy and Physiology, Faculty of Biology, University of Plovdiv “Paisii Hilendarski”, 24 Tsar Assen Str., 4000 Plovdiv, Bulgaria
2
Department of Ecology and Environmental Conservation, Faculty of Biology, University of Plovdiv “Paisii Hilendarski”, 24 Tsar Assen Str., 4000 Plovdiv, Bulgaria
3
Department of Functional Genetics, Abiotic and Biotic Stress, AgroBioInstitute, Agricultural Academy, 8 Dragan Tsankov Blvd., 1164 Sofia, Bulgaria
*
Author to whom correspondence should be addressed.
Diversity 2023, 15(1), 118; https://doi.org/10.3390/d15010118
Submission received: 15 December 2022 / Revised: 6 January 2023 / Accepted: 13 January 2023 / Published: 15 January 2023
(This article belongs to the Special Issue Biodiversity Research in Bulgaria)

Abstract

:
In this paper, we assess the environmental impact of urbanization in three freshwater biotopes, using the levels of fluctuating asymmetry (FA) in 10 meristic morphological traits in the Marsh Frog (Pelophylax ridibundus (Pallas, 1771)). Two of the studied biotopes are located in the boundaries of the city of Plovdiv (one in the central part, the other in a suburban residential area), and the third is located in the vicinity of the village of Orizare. Our working hypothesis is based on the assumption that urban and suburban sites are more severely affected by human activities than rural sites. However, according to our results, the population of P. ridibundus inhabiting Maritsa River in the central part of Plovdiv City, and that in the suburban zone, have found relatively good living conditions. Contrary to our expectations, the worst environmental conditions were observed in the rural zone, where anthropogenic stress related to intensive pastoral animal husbandry and crop farming was present. The absence of adult individuals in the rural site is also an indicator of unfavorable living conditions.

1. Introduction

Currently, the role of the anthropogenic factor is crucial for the changes in the geological and climate processes on planet Earth and it affects the functioning of all ecosystems [1]. One of the negative effects of anthropization in the 21st century is related to the loss of natural habitats at the expense of increasing agricultural land [2] and urbanized territories [3], which results in a drastic loss of biodiversity on a planetary scale [4]. In the context of increasing anthropization, the pollution of continental freshwater ecosystems is a serious public problem, because they are not only a habitat for many organisms, but freshwater is also used for human farming activities, e.g., irrigation, fish farming and tourism. This requires not only the knowledge of the functioning mechanisms of these sensitive ecosystems, but also the development of efficient measures for their protection, restoration and effective management [5].
Aquatic frogs (Anura) are an important component of the biota of freshwater ecosystems and also a key factor for their normal functioning [6]. Because of the biphasic life cycle and semi-permeable skin, aquatic frogs may be in direct contact with different toxicants [7]. The permeability facilitates the penetration and uptake of xenobiotics [8,9]. The specifics of the feeding during the different life stages of aquatic frogs (detritophages or active predators), the continuous processing of water through the gills (during the larval stages), the heterothermal metabolism and their increased sensitivity to chemicals make them good bioindicators for assessing the state of the environment [10,11].
Despite the reservations of some authors [12,13], fluctuating asymmetry (FA) [14] has become a well-established method for the evaluation of the developmental stability of individuals from wild populations in different animal species [15,16,17,18]. Fluctuating asymmetry is manifested as slight deviations from symmetry usually described by frequency distributions of phenotypic characters on the right and left side of the body [19,20]. Fluctuating asymmetry appears to be a non-specific indicator of stress caused by genetic or environmental factors associated with a change in the state of the biological system [21]. First of all, a change in FA levels is observed in the case of a deviation from the optimal conditions of development. As a result, it becomes possible to characterize and measure stress in natural populations of animal organisms (including anurans) living in the conditions of increased anthropogenic pressure [22,23,24,25,26] and to use this as the basis for developing a concept and methodology of the assessment of environmental health [21]. One of these methodological approaches based on the measurement of FA levels in a complex of meristic traits on the dorsal side of the body and extremities in anuran amphibians was proposed by Zakharov et al. [27,28] and was broadly applied for the assessing the ecological quality of their habitats [29,30,31,32,33,34,35,36,37,38,39]. The majority of these studies have been carried out in various anthropogenically polluted areas and they usually measure FA levels in populations subjected directly to anthropogenic stress caused by toxicants of different natures and compare them with FA levels in reference populations.
There are few works attempting to trace changes in FA levels in populations of anuran amphibians living in habitats with different degrees of urbanization [40,41]. In this context, a certain gap in the scientific literature exists, which has motivated this study.
In this work, we present the results from FA level measurement in 10 meristic morphological traits in the Marsh Frog Pelophylax ridibundus (Pallas, 1771) from three populations inhabiting sites with different degrees of urbanization, located in the city of Plovdiv (South Bulgaria), in order to assess the impact of urbanization. For the purpose of a more objective assessment of the ecological quality of the sites, FA values in P. ridibundus meristic traits are considered in the context of the data from the physicochemical monitoring of the water in each site. Our working hypothesis is based on the assumption that urban and suburban sites are more severely affected by human activities than rural sites.

2. Materials and Methods

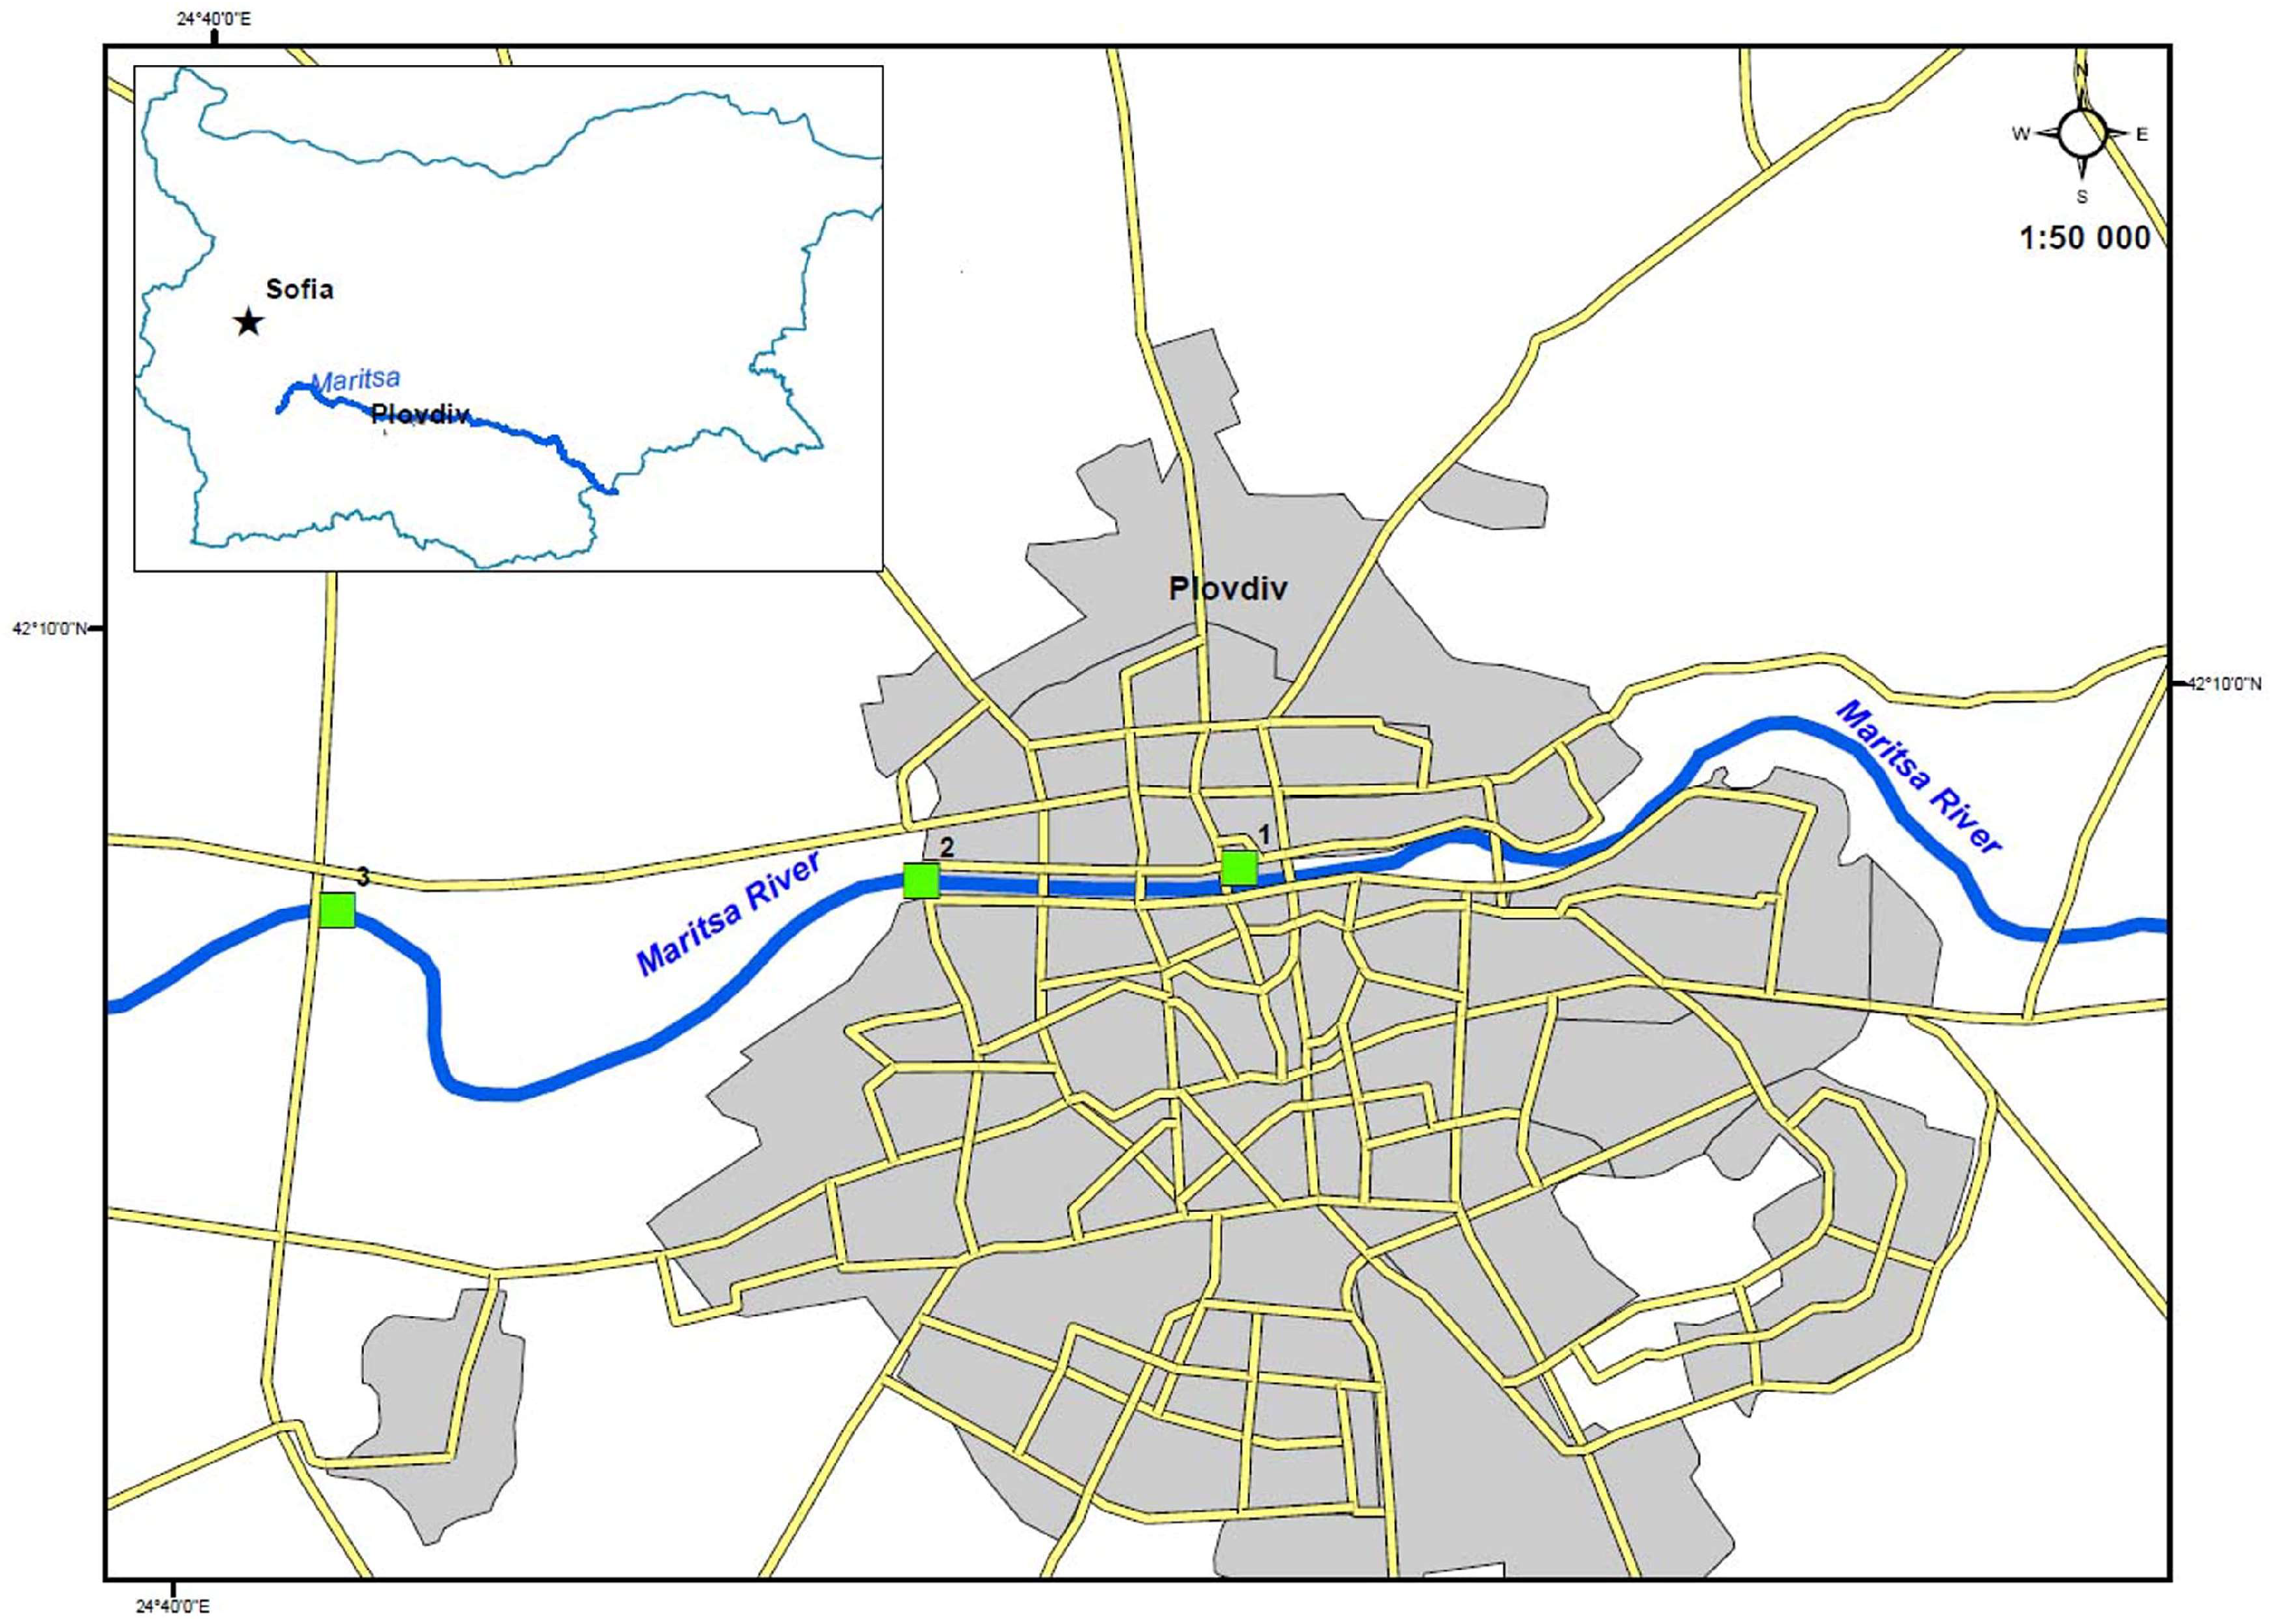
2.1. Sampling Area and Data Collection

This study was conducted in April 2020 in three sites located on the right bank of Maritsa River in South Bulgaria (Figure 1): urban site—Maritsa River in the central part of Plovdiv City (24°44′51.64′′ E, 42°9′14.05′′ N), suburban site—Maritsa River to the west of the “Zaharna Fabrika” residential area and to the south of the “Smirnenski” residential area in Plovdiv City (24°43′17.94′′ E, 42°9′13.753′′ N) and rural site—Maritsa River to the west of Plovdiv City in the lands of Orizare Village (24°40′39.737′′ E, 42°9′4.708′′ N). The urban site is in the central part of the second largest city in Bulgaria (367,214 citizens to June 2022). Here, the two banks of Maritsa River are built up with high residential and administrative buildings. The suburban site is located in the western suburbs of Plovdiv City. On the riverbanks here, there are mainly residential buildings (low-rise), single-family houses and industrial buildings. Table 1 presents data from the physicochemical monitoring of the water at each site, carried out by the Basin Directorate of Water Management-East Aegean Sea, Region-Plovdiv (https://earbd.bg (accessed on 29 November 2022)) for the 2017–2019 period and at the time of the research. These analyses were performed in accordance with the water framework directive WED 2000/60/EC [42] and Ordinances No H-4/14.09.2012 [43] and No 256/1.11.2010 [44] on the characterization of surface waters in Bulgaria (Table 1).
The Marsh Frog P. ridibundus individuals were caught at night under the light of an electric lantern. The frogs were caught at random in sections about 1–2 km long and 4 m wide, upstream along the riverbank, according to Sutherland’s [45] methodology. The distance from the sampling points between individual sites was not less than 5–7 km. In the urban and suburban sites, only adult individuals (SVL > 60.0 mm) were caught, and in the rural site, only sub-adult individuals (SVL > 40.0 mm) were caught, according to the methodology of Bannikov et al. [46]. After the analyses, all the frogs were returned to their natural habitats.

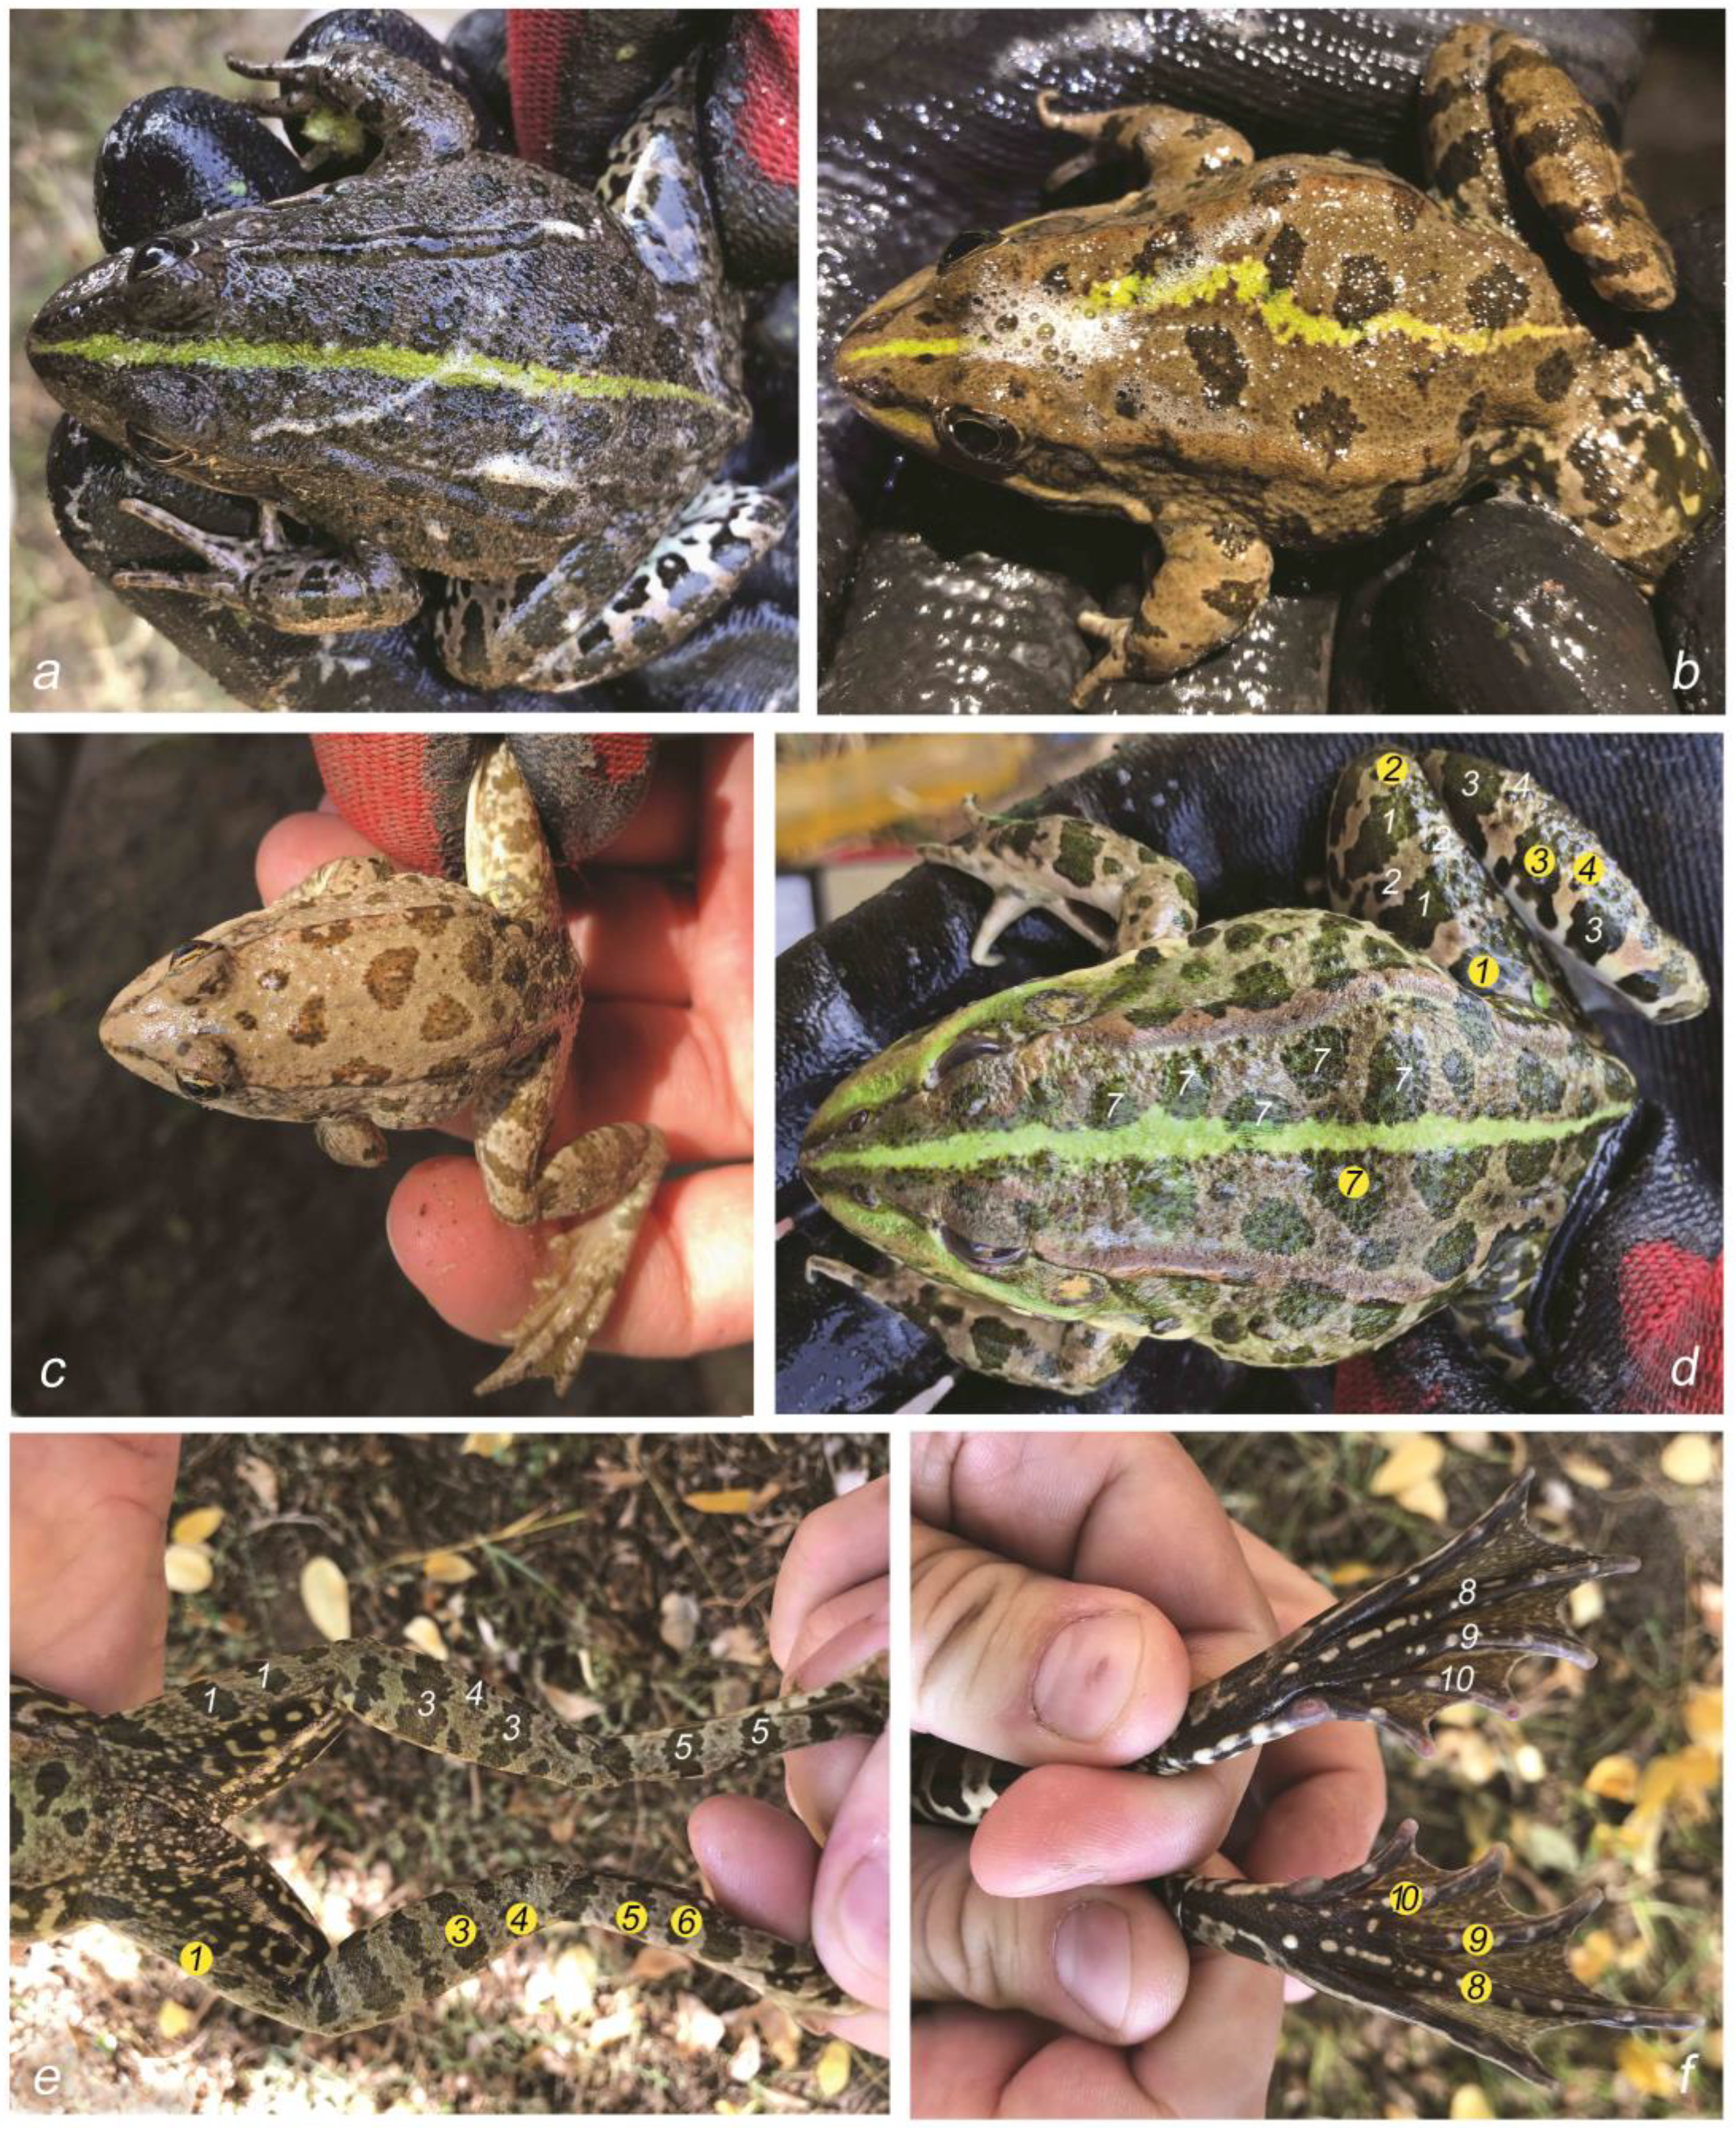
2.2. Identification of FA

A total of 90 individuals of P. ridibundus (30 individuals per site) were used for the analysis of fluctuating asymmetry. We measured the FA levels in ten morphological meristic traits on the dorsal side of the body and the limbs of P. ridibundus (Figure 2). This technique was proposed by Zakharov et al. [27,28] and was successfully applied in our previous studies with this species on the territory of Bulgaria [35,36,37,39].
The main advantage of the methodology is that it allows for working with living animals, which makes it applicable for protected species of anurans. The data obtained on FA levels for each individual were used for the calculation of the index frequency of the asymmetric manifestation of an individual (FAMI).
The average FAMI was calculated using the formula proposed by Zakharov et al. [47], namely, FAMI = (ΣXi)/n, where Xi is the frequency of FA observed in each individual and n is the number of individuals in the sample. After calculating the average FAMI for each site, we used the scale proposed by Zakharov et al. [28] to evaluate the habitat quality. The scale classifies the habitat quality according to the average FAMI values as follows: 1: FAMI < 0.4 (grade 1: conventional rate (clean water basin)); 0.41 ≤ FAMI ≤ 0.5 (grade 2: minimal impact on organisms (slightly polluted water basin)); 0.51 ≤ FAMI ≤ 0.6 (grade 3: a satisfactory condition of organisms (moderately polluted water basin)); 0.61 ≤ FAMI ≤ 0.7 (grade 4: an unfavorable condition of organisms (heavily polluted water basin)); FAMI ≥ 0.71 (grade 5: a critical condition of organisms (very heavily polluted water basin)).

2.3. Statistical Analyses

A general linear model with a logit link function was used to evaluate the difference in the odds for observing asymmetries between the three groups [48]. We used a PCA to analyze the similarities between the living conditions in the studied biotopes according to the physicochemical data. The statistical analysis was performed in R, version 4.2.2 [49]. The regression analysis was performed using the glm function in the stats package. The prcomp function was used for the PCA, and the biplot was constructed using the factoextra package.

3. Results

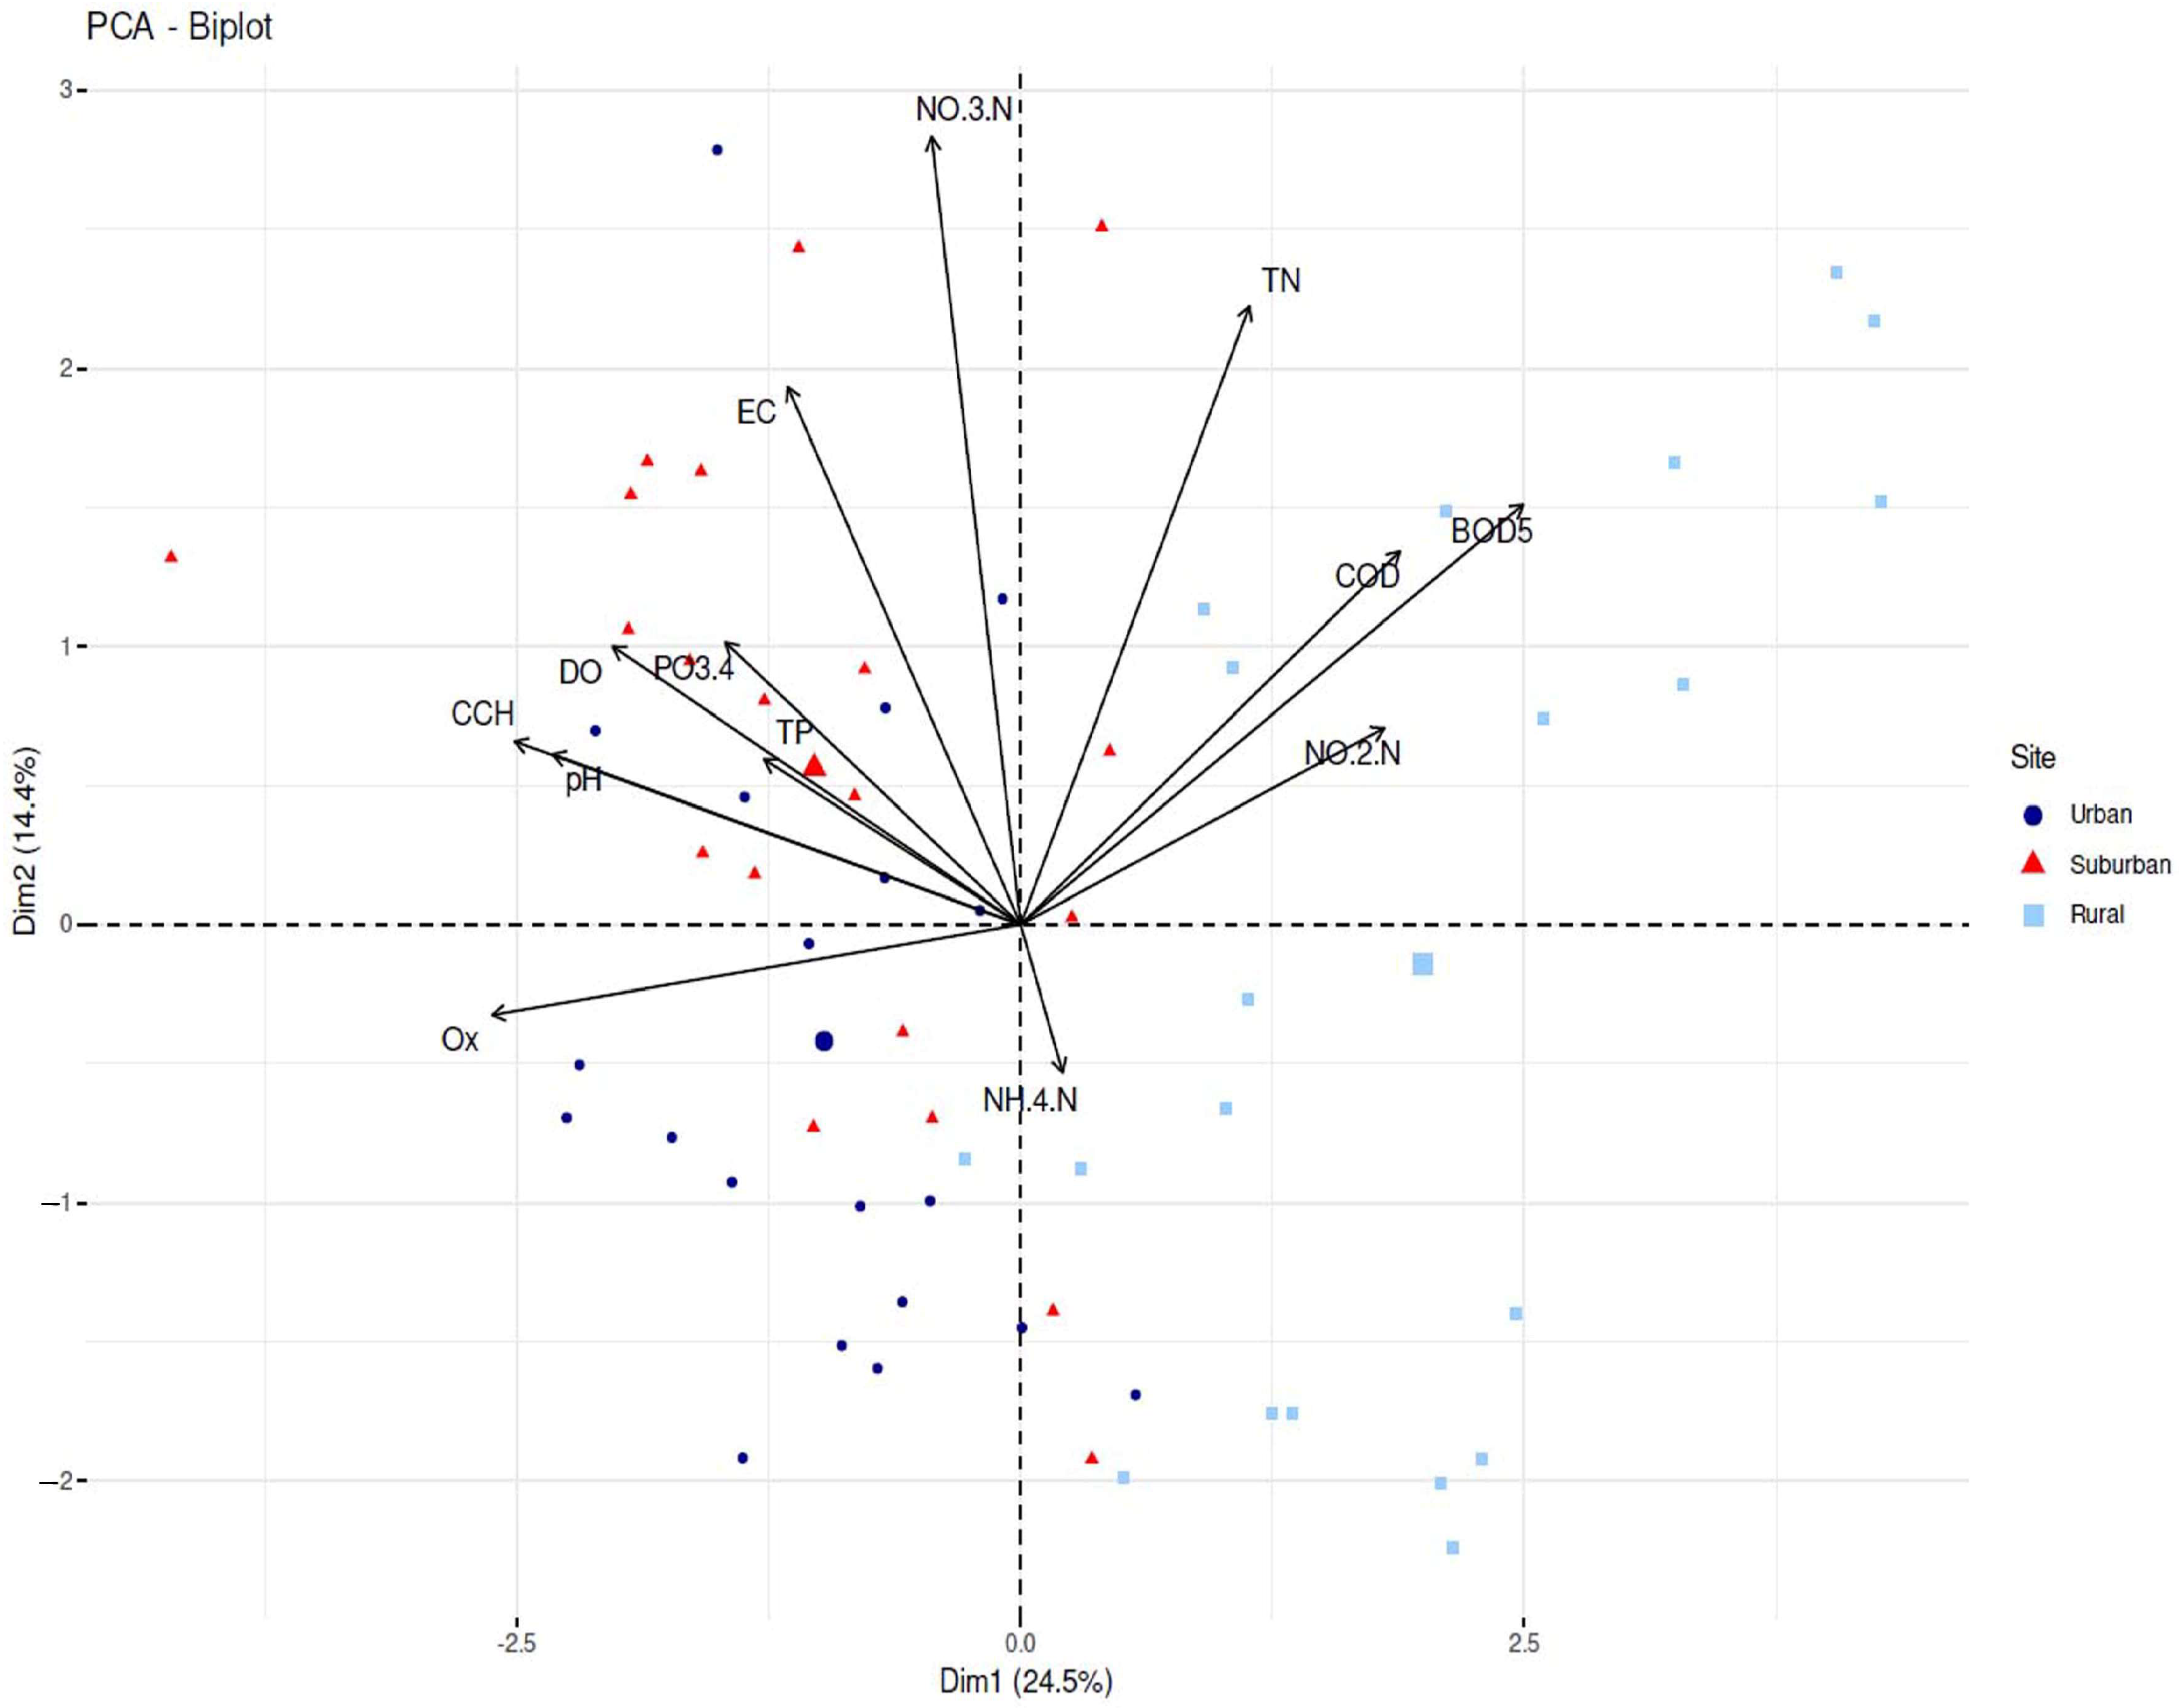
3.1. Ecological Status of The Water at the Studied Sites According to the Data of Physicochemical Analysis

To analyze how the data about physicochemical properties of the water in the three sites discriminate between the sites, we used the monthly data in a biplot analysis. The first two principal components of the PCA explained 38.9% of the variance (Figure 3). Three of the studied parameters had the highest contribution to the formation of the first composite axis—Ox, CCH and BOD5. The former two were negatively correlated with the third one. BOD5 was positively correlated with nitrates and total nitrogen, which were the parameters contributing most to the second axis. It also correlated positively with other nitrogen forms, nitrites and ammonium, but their contributions to the first two axes were insignificant. According to the biplot analysis, the rural site was separated from the other two sites along the PC1, and the measurements for this site were scattered in quadrants one and four, showing higher values for BOD5 and lower ones for Ox and CCH. The measurements for the suburban and urban sites were clustered in quadrants two and three, respectively. These results show that the quality of water in the urban and suburban sites differed predominantly in the content of nitrates and total nitrogen. Interestingly, some of the measurements in the rural site also differed in that respect, as they were separated along the second composite axis.

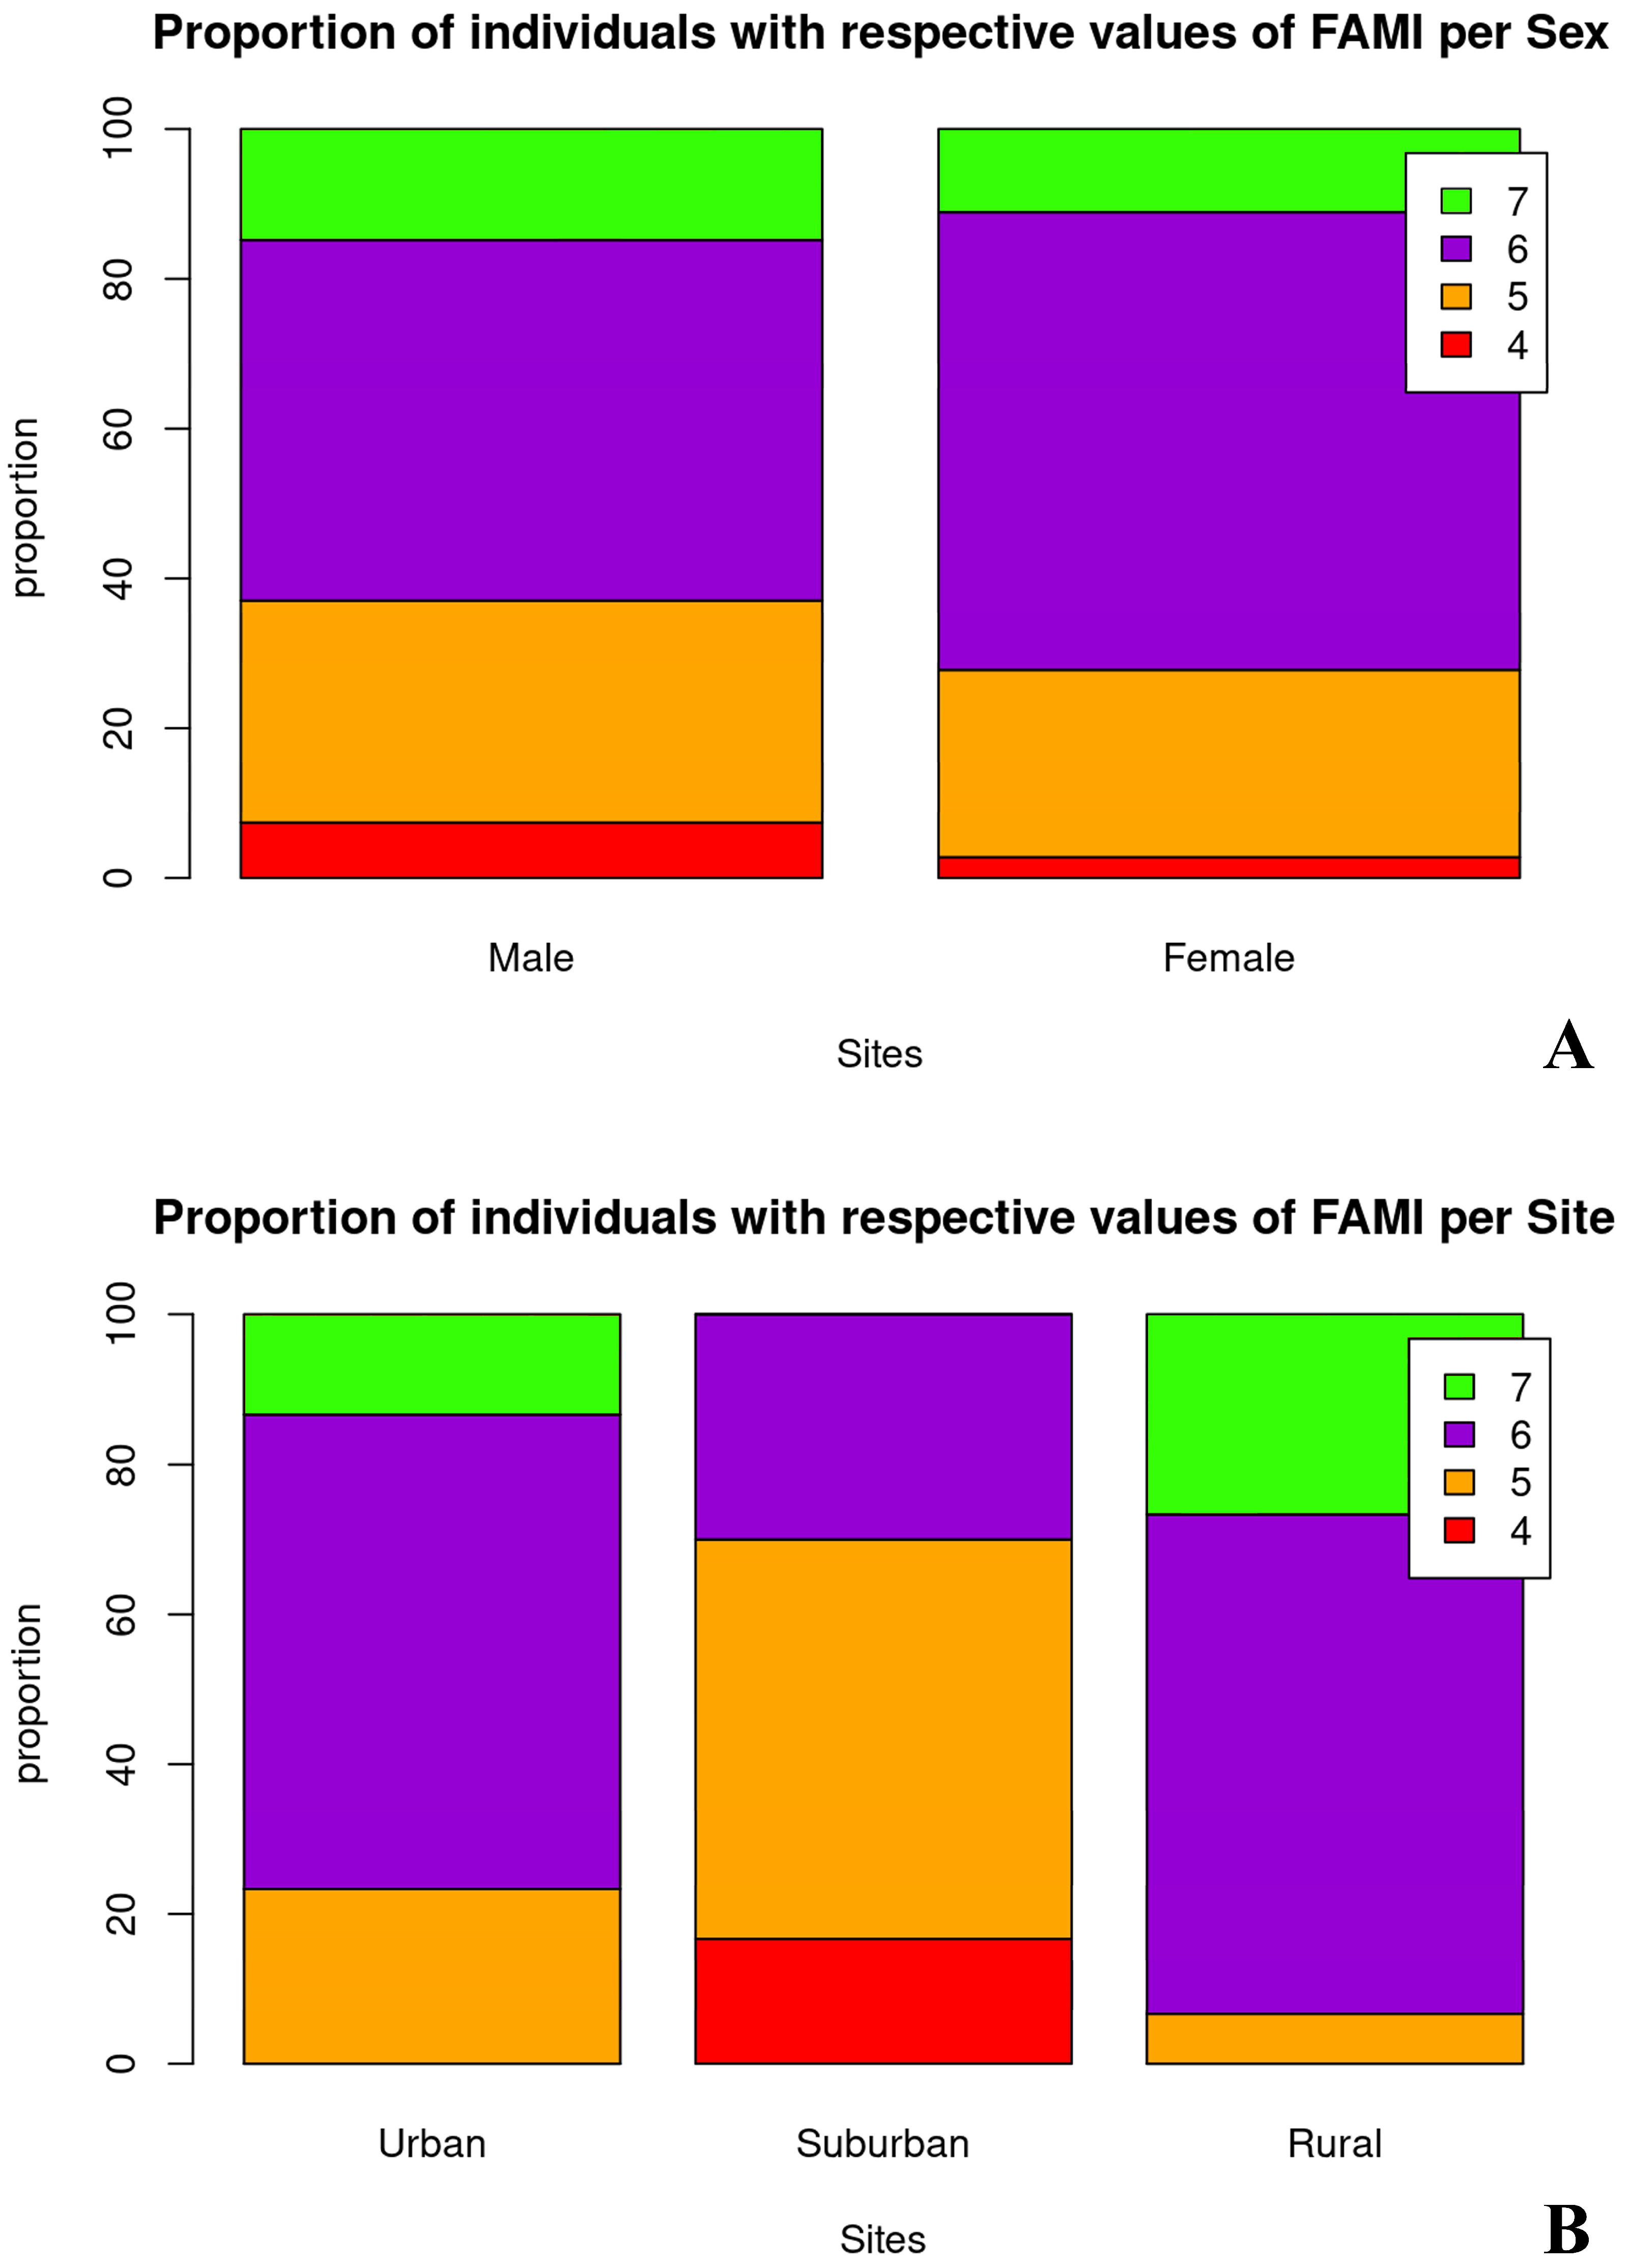
3.2. Fluctuating Asymmetry in P. ridibundus Meristic Traits and Ecological Assessment of Their Habitats

Fewer asymmetric traits were observed in the frogs inhabiting the suburban site. Fifty-three percent of the frogs in this site showed asymmetry in five traits, 30% were asymmetrical in six traits and in 17% of the sampled frogs had four asymmetric traits (Figure 4). In the urban and in the rural sites, the majority of the animals had asymmetries in six of the studied traits (64% and 67%, respectively), and the percentage of the individuals with seven asymmetrical traits were 27% and 23%, for the rural and the urban site, respectively. In the three tested sites, the individuals of P. ridibundus showing asymmetry by ten meristic traits had a relatively even qualitative distribution (Table 2). It is striking that in the three sites, there was the highest share of individuals asymmetric by trait 1 and trait 7, which is probably a sign of directional asymmetry in these traits.
According to the results from the GLM model (Table 2), the effect of the sex of the animals is not important for the manifestation of FA (odds = 0.965, p = 0.802). As is shown in the table, there were no significant differences in the odds for observing asymmetries in the animals from suburban and rural sites compared to the ones from the urban site. However, the post hoc test showed that there was a 56% higher chance for observing asymmetries in the frogs from the rural site compared to the ones from the suburban site (odds = 1.559, p = 0.023, not shown).
The mean FAMI index for P. ridibundus individuals from the urban site was 0.59 ± 0.06, for these from the suburban site it was 0.51 ± 0.07 and for the rural site it was 0.62 ± 0.06, respectively. In the scale of Zakharov et al. [28], the urban and suburban sites are classified as moderately polluted water basin (grade 3), and the rural site is classified as heavily polluted water basin (grade 4).

4. Discussion

The analysis of the changes in FA levels in P. ridibundus for evaluating the ecological quality of their habitat is a relatively new method, which has been used mostly in the eastern and southern areas of the species range in the Russian Federation, Ukraine, Belarus, Georgia, Uzbekistan and Turkey [27,28,29,30,31,32,34,50].
What these studies have in common is the fact that high levels of FA were observed in populations living under conditions of elevated stress resulting from anthropogenic activity. By contrast, low levels of FA were found in populations inhabiting relatively unpolluted habitats, such as protected areas or ones located away from sources of anthropogenic pollution.
Our field studies of P. ridibundus populations inhabiting polluted biotopes on the territory of Bulgaria confirmed FA applicability in field biomonitoring as an alternative to the routine physicochemical analyses [35,36,37,39]. It is particularly appropriate when evaluating the long-term negative effects of various xenobiotics on the biota of freshwater ecosystems, as the physicochemical monitoring assesses the state of the water body only at the time of sampling.
The statistical analysis showed that there were no significant differences in the odds of observing asymmetries in the individuals from the urban site compared to the ones from the other two habitats. The only statistically significant difference was observed between the rural and the suburban site. The animals inhabiting the former had a significantly higher rate of asymmetries. The FAMI index values estimated for the urban site (0.59) and the rural site (0.62) fell on both sites of the boundary value (0.6) dividing the grade 3 and 4 quality habitats in Zakharov’s scale, which, together with the lack of a statistically significant difference between the two, makes it difficult to classify them according to the scale. However, based on the results from the biplot analysis of the data from a physicochemical analysis of water samples from the habitats, showing a greater similarity between the urban and the suburban sites, we classified the latter two as a grade 3 and the rural site as a grade 4 quality habitat. According to the interpretations of Zakharov et al. [27,28], these two populations are in a relatively good condition and are developing at a relatively low ecological risk. Apparently, the levels of anthropogenic stress in the populations of marsh frogs from these two sites are not high enough to cause serious disturbances in the morpho-physiological homeostasis of frogs. The analysis of the ecological status of Maritsa River obtained on the basis of the FAMI index shows a good agreement with the data from the physicochemical water monitoring (see Table 1). A possible explanation for the relatively good condition of the populations of P. ridibundus inhabiting the urban and suburban sites could be sought in the absence of large emitters of domestic and industrial wastewater in this part of Maritsa River. The section of the river passing through the city of Plovdiv is about 13 km, and the wastewater from the industrial enterprises and domestic sewage discharges into the Chaya River after purification in a sewage treatment plant, situated east of the city. In a previous study of ours [39], we found very high levels of asymmetry in the populations of P. ridibundus (FAMI = 0.87 ± 0.01), inhabiting the zone of the river, after passing through the city. The highest levels of asymmetry (0.62 ± 0.01 in the current study were observed in the population inhabiting the rural site. According to Zakharov et al. [27,28], this population is in a critical condition and inhabits a highly polluted water body. The results of the PCA analysis performed with the data from the physicochemical monitoring clearly separated the rural site from the other two sites along the first composite axis (see Figure 3): the quality of the water at this site differs from the other two mainly by the content of NO2-N, TN, BOD5 and COD. The high values of BOD5 and COD in the rural site could be explained by the presence of several smaller industrial sites located in this area and the discharge of domestic wastewater into Maritsa River. The high TN values in the rural site are interesting, because of the possible negative effects on anurans. Nitrogen cycles through the air, water and soils, with many transformations mediated by the actions of specialized bacteria. Some of these transformations require aerobic conditions (nitrification), while others occur only under anaerobic conditions (denitrification). Total nitrogen (TN) includes two components: the inorganic N (NH4+, NH3, NO3, NO2) and soluble organic nitrogen (SON). In the surface layer of most soils, the organic N can be divided into two categories: N from organic residues and N from soil organic matter or humus [51,52]. It is known that reactive water-soluble forms of nitrogen (ammonium nitrogen NH+4-N; nitrate nitrogen NO3-N and nitrite nitrogen NO-2-N) can enter waterbodies through manure from agricultural fields, cattle farms and atmospheric deposition [53]. All three forms of reactive nitrogen are toxic to aquatic frogs and their lethal concentrations are known [54], but the effects of sub lethal concentrations are very poorly studied. How these nitrogen fractions act in water bodies (pulse or static levels) and at what stage of development of the water frogs (after hatching or at different stages of metamorphosis) are both important [55,56]. Static levels of reactive forms of nitrogen begin to accumulate gradually and manifest over long periods of time, while impulses are relatively sudden and short-lived [57]. The stress from impulses is more dynamic and its effects are more difficult to predict [58]. This is particularly important for the correct interpretation of disturbances in the developmental stability of aquatic frogs. Fluctuating asymmetry occurs early in frog development (larval period) and persists in adults [47]. When a population lives for a long time under conditions of static environmental stress, levels of asymmetry may increase and even some morphological traits may shift to directional asymmetry [56]. Conversely, as environmental stress levels decrease, FA values in marsh frog populations may decrease [47]. As noted above, we found the highest FAMI index values in the population of P. ridibundus inhabiting the rural site. This area is remote from the urbanized area of the city, and is dominated by agricultural lands with intensive agriculture (cereals and fruit crops) and pastoralism (large cattle farm). Both the agricultural land and the livestock farm are sources of reactive forms of nitrogen, which can enter the Maritsa River through the flowing groundwater (static levels) or pulses after heavy rains and storms. On the other hand, the high TN levels in the rural site also indicate the presence of high levels of organic nitrogen in the soils of the rural site, but its values are not measured in the routine tests conducted by the state agency (Basin Directorate of Water Management, East Aegean Sea, Plovdiv). It is obvious that high doses of nitrogen, regardless of its origin, create problems for the biota in the rural site. However, it is unlikely that only the high levels of nutrients in the rural site could unequivocally explain the absence of adult P. ridibundus individuals in this site. It is very possible that the accumulation of a series of negative effects, associated with intensive livestock and agriculture at this site, caused the migration of adult frogs to less disturbed habitats. The reasons could be found in the grazing of grassy vegetation by cattle around the river, which inevitably leads to the deterioration of the food base in the area, as well as to the reduction in natural shelters. The use of chemical protection preparations and primarily pesticides and insecticides in areas with agricultural crops should not be excluded; their presence is also not tested during the routine physicochemical monitoring of water. Regardless of the specific reason for the lack of adult P. ridibundus in the rural site, this fact is not only puzzling, but disturbing. Adult individuals are the ones that participate most actively in reproduction (the study was conducted in April) and maintain the gene pool of the population, and thus its spatial structure. Their absence in the rural site could at least mean that there are sources of stress there (in our opinion of anthropogenic origin) which probably caused their migration to neighboring areas. In order to support or reject this thesis, it is necessary to conduct future in situ analyzes related to the assessment of life history populations parameters, food ecology, etc. The main result from this study shows that high levels of urbanization in cities should not always be associated with bad living conditions for the native biota. Moreover, on the other hand, areas with a smaller degree of urbanization but with high anthropogenic pressure caused by agricultural activities can be much more inhospitable to the biota inhabiting them.

5. Conclusions

The present study found that the population of P. ridibundus inhabiting Maritsa River in the central part of the city of Plovdiv has good living conditions in the most intensively built-up and most densely populated part of the city. In the suburban zone, the living conditions are also good and the population of P. ridibundus there is also in a relatively good condition. The worst living conditions are in the rural zone, where the anthropogenic stress caused by intensive pastoral animal husbandry and crop farming have negatively affected the biotope.
The results from this study are further evidence to support the thesis that FA levels in meristic traits on the dorsal side and limbs of P. ridibundus adults have their place in field bioindicator assays. They cannot completely replace the routine physicochemical tests of water, but they can provide a sufficiently reliable method that complements and even precedes physicochemical tests, especially when looking for the long-term effects of the action of anthropogenic stress on the test objects. An additional advantage is the non-invasiveness of the method, its relatively easy implementation in field conditions and the absence of the need for expensive laboratory equipment and consumables.

Author Contributions

Conceptualization, Z.Z. and I.M.; methodology, Z.Z.; software, S.T.; validation, Z.Z., I.M. and S.T.; formal analysis, Z.Z. and S.T.; investigation, I.M.; resources, I.M.; data curation, S.T.; writing—original draft preparation, Z.Z.; writing—review and editing, I.M.; visualization, S.T.; supervision, I.M.; project administration, I.M. All authors have read and agreed to the published version of the manuscript.

Funding

This research received no external funding.

Institutional Review Board Statement

Not applicable.

Data Availability Statement

Not applicable.

Acknowledgments

The authors are grateful to Ivan Delev for his help during the field work.

Conflicts of Interest

The authors declare no conflict of interest.

References

  1. Woodward, G.; Gessner, M.O.; Giller, P.S.; Gulis, V.; Hladyz, S.; Lecerf, A.; Malmqvist, B.; McKie, B.G.; Tiegs, S.D.; Cariss, H.; et al. Continental-Scale Effects of Nutrient Pollution on Stream Ecosystem Functioning. Science 2012, 336, 1438–1440. [Google Scholar] [CrossRef] [Green Version]
  2. Maxwell, S.L.; Fuller, R.A.; Brooks, T.M.; Watson, J.E.M. Biodiversity: The ravages of guns, nets and bulldozers. Nature 2016, 536, 143–145. [Google Scholar] [CrossRef] [Green Version]
  3. Sudhakar, M.; Doble, M.; Murthy, P.S.; Venkatesan, R. Marine microbe-mediated biodegradation of low and high-density polyethylenes. Int. Biodeter. Biodegr. 2008, 61, 203–213. [Google Scholar] [CrossRef]
  4. Monastersky, R. Biodiversity: Life—A status report. Nature 2014, 516, 158–161. [Google Scholar] [CrossRef] [Green Version]
  5. Vollmer, D.; Shaad, K.; Souter, N.J.; Farrell, T.; Dudgeon, D.; Sullivan, C.A.; Fauconnier, I.; MacDonald, G.M.; McCartney, M.P.; Power, A.G.; et al. Integrating the social, hydrological and ecological dimensions of freshwater health: The Freshwater Health Index. Sci. Total. Environ. 2018, 627, 304–313. [Google Scholar] [CrossRef]
  6. Dupler, K.; Guidugli-Cook, M.; Brown, D.R.; Richter, S.C. Rapid Assessment of Wetland Condition Reflects Amphibian Community Composition. Wetlands 2019, 40, 451–464. [Google Scholar] [CrossRef]
  7. Vitt, L.J.; Caldwell, J.P. Herpetology—An Introductory Biology of Amphibians and Reptiles, 4th ed.; Elsevier Science: San Diego, CA, USA, 2013; 53p. [Google Scholar]
  8. Van Meter, R.J.; Glinski, D.A.; Hong, T.; Cyterski, M.; Henderson, W.M.; Purucker, S.T. Estimating terrestrial amphibian pesticide body burden through dermal exposure. Environ. Pollut. 2014, 193, 262–268. [Google Scholar] [CrossRef] [Green Version]
  9. Lajmanovich, R.C.; Cabagna-Zenklusen, M.C.; Attademo, A.M.; Junges, C.M.; Peltzer, P.M.; Bassó, A.; Lorenzatti, E. Induction of micronuclei and nuclear abnormalities in tadpoles of the common toad (Rhinella arenarum) treated with the herbicides Liberty® and glufosinate-ammonium. Mutat. Res. Toxicol. Environ. Mutagen. 2014, 769, 7–12. [Google Scholar] [CrossRef]
  10. Venturino, A.; Rosenbaum, E.; Caballero de Castro, A.; Anguiano, O.L.; Gauna, L.; Fonovich de Schroeder, T.; Pechen de D’Angelo, A.M. Biomarkers of effect in toads and frogs. Biomarkers 2004, 8, 167–186. [Google Scholar] [CrossRef]
  11. Narayan, E.J. Non-invasive reproductive and stress endocrinology in amphibian conservation physiology. Conserv. Physiol. 2013, 1, cot011. [Google Scholar] [CrossRef]
  12. Bjorksten, T.A.; Fowler, K.; Pomiankowski, A. What does sexual trait FA tell us about stress? Trends Ecol. Evol. 2000, 15, 163–166. [Google Scholar] [CrossRef]
  13. Rasmuson, M. Fluctuating asymmetry-indicator of what? Hereditas 2002, 136, 177–183. [Google Scholar] [CrossRef]
  14. Van Valen, L. A Study of Fluctuating Asymmetry. Evolution 1962, 16, 125. [Google Scholar] [CrossRef]
  15. Parsons, P.A. Fluctuating asymmetry: An epigenetic measure of stress. Biol. Rev. 1990, 65, 131–145. [Google Scholar] [CrossRef]
  16. Lens, L.; Dongen, S.; Kark, S.; Matthysen, E. Fluctuating asymmetry as an indicator of fitness: Can we bridge the gap between studies? Biol. Rev. 2002, 77, 27–38. [Google Scholar] [CrossRef] [Green Version]
  17. Lajus, D.; Yurtseva, A.; Birch, G.; Booth, D.J. Fluctuating asymmetry as a pollution monitor: The Australian estuarine smooth toadfish Tetractenos glaber (Teleostei: Tetraodontidae). Mar. Pollut. Bull. 2015, 101, 758–767. [Google Scholar] [CrossRef]
  18. Zakharov, V.M.; Shadrina, E.G.; Trofimov, I.E.; Trofimov, I. Fluctuating Asymmetry, Developmental Noise and Developmental Stability: Future Prospects for the Population Developmental Biology Approach. Symmetry 2020, 12, 1376. [Google Scholar] [CrossRef]
  19. Van Valen, L. The statistics of variation. Var. Evol. Theory 1978, 4, 33–43. [Google Scholar]
  20. Palmer, A.R. Fluctuating Asymmetry Analyses: A Primer. In Instability: Its Origins and Evolutionary Implications; Markow, T.A., Ed.; Dordrecht Publishing, Kluwer: Dordrecht, The Netherlands, 1994; pp. 335–364. [Google Scholar]
  21. Zakharov, V.M.; Trofimov, I.E. Fluctuating asymmetry as an indicator of stress. Emerg. Top. Life Sci. 2022, 6, 295–301. [Google Scholar] [CrossRef]
  22. Eisemberg, C.C.; Bertoluci, J. Fluctuating asymmetry in populations of the South American frog Physalaemus cuvieri (Leptodactylidae) in areas with different degrees of disturbance. J. Nat. Hist. 2016, 50, 1503–1511. [Google Scholar] [CrossRef]
  23. Coda, J.A.; Martínez, J.J.; Steinmann, A.R.; Priotto, J.; Gomez, D.M. Fluctuating asymmetry as an indicator of environmental stress in small mammals. Mastozool. Neotrop. 2017, 24, 313–321. [Google Scholar]
  24. de Gondim, P.M.; Rodrigues, J.F.M.; Cascon, P. Fluctuating Asymmetry and organosomatic indices in anuran populations in agricultural environments in semi-arid Brazil. Herpetol. Conserv. Biol. 2020, 15, 354–366. [Google Scholar]
  25. Rodríguez-González, A.; May-Tec, A.; Herrera-Silveira, J.; Puch-Hau, C.; Quintanilla-Mena, M.; Villafuerte, J.; Velázquez-Abunader, I.; Aguirre-Macedo, M.; Vidal-Martínez, V. Fluctuating asymmetry of sclerotized structures of Haliotrematoides spp. (Monogenea: Dactylogyridae) as bioindicators of aquatic contamination. Ecol. Indic. 2020, 117, 106548. [Google Scholar] [CrossRef]
  26. Maldonado-López, Y.; Prieto-Dueñas, I.S.; Tapia-Torres, Y.; Borges, M.A.Z.; Suazo-Ortuño, I.; Cuevas-Reyes, P. Fluctuating asymmetry and oxidative stress indicate environmental stress of Cane toads Rhinella marina. Zool. Anz.-A J. Comp. Zool. 2022, 299, 234–242. [Google Scholar] [CrossRef]
  27. Zakharov, V.M.; Baranov, A.S.; Borisov, V.I.; Valetsky, A.V.; Kryazheva, N.G.; Chistyakova, E.K.; Chubinishvili, A.T. Health of Environment: Methods of Assessment; Center for Russian Environmental Policy: Moscow, Russia, 2000. (In Russian) [Google Scholar]
  28. Zakharov, V.M.; Chubinishvili, A.T.; Dmitriev, S.G.; Baranov, A.S.; Borisov, V.I.; Valetsky, A.V.; Krysanov, E.Y.; Kryazheva, N.G.; Pronin, A.V.; Chistyakova, E.K. Health of Environment: Practice of the Assessment; Center for Russian Environmental Policy: Moscow, Russia, 2000. (In Russian) [Google Scholar]
  29. Ustyuzhanina, O.A.; Streltsov, A.B. Bio-Indication Assessment of Environmental Quality in the Floodplains of the Oka and the Ugra for Homeostasis of the Marsh Frog Rana ridibunda. In Problems of Herpetology: Proceedings of the 1th Meeting of the Nikolsky Herpetological Society-Pushchino, 1st ed.; Publishing House of the Saint-Petersburg University: Saint-Petersburg, Russia, 2001; pp. 298–299. (In Russian) [Google Scholar]
  30. Ustyuzhanina, O.A.; Streltsov, A.B. Assessing the Impact of Urban Areas on the Marsh Frogs. In The Study of the Nature of the Oka River Basin: Abstracts of Scientific-Practical Conference “Oka River -the Third Millennium” Kaluga, 21–25 May, 1st ed.; KSPU: Kaluga, Russia, 2001; pp. 167–170. (In Russian) [Google Scholar]
  31. Fomin, A.S. Features of the ecology of the lake frog Tagil metallurgical plant. Wat. Sect. Rus. 2006, 6, 50–57. (In Russian) [Google Scholar]
  32. Maksimov, S.V. The Study of Signs of Asymmetry in the Complex European Green Frogs (Rana ridibunda, R. lessonae, R. esculenta). In The Structure, Status and Protection of Ecosystems Prihoperja, 1st ed.; International Collection of Scientific Articles; Lasko, S.K., Ed.; Science: Moscow, Russia, 2007; pp. 93–96. (In Russian) [Google Scholar]
  33. Guo, R.; Zhang, W.; Ai, S.; Ren, L.; Zhang, Y. Fluctuating asymmetry rather than oxidative stress in Bufo raddei can be an accurate indicator of environmental pollution induced by heavy metals. Environ. Monit. Assess. 2017, 189, 1–10. [Google Scholar] [CrossRef]
  34. Dönmez, M.; Şişman, T. The morphometric and erythrometric analyses of Pelophylax ridibundus living in anthropogenic pollution resources. Turk. J. Zool. 2021, 45. [Google Scholar] [CrossRef]
  35. Zhelev, Z.M.; Popgeorgiev, G.; Arnaudov, A.D.; Georgieva, K.N.; Mehterov, N.H. Fluctuating asymmetry in Pelophylax ridibundus (Amphibia: Ranidae) as a response to anthropogenic pollution in south Bulgaria. Arch. Biol. Sci. 2015, 67, 1009–1023. [Google Scholar] [CrossRef]
  36. Zhelev, Z.M.; Tsonev, C.V.; Arnaudova, D.N. Health status of Pelophylax ridibundus (Pallas, 1771) (Amphibia: Ranidae) in a rice paddy ecosystem in southern Bulgaria: Body condition factor and fluctuating asymmetry. Acta Zool. Bulg. 2017, 69 (Suppl. 8), 169–177. [Google Scholar]
  37. Zhelev, Z.M.; Tsonev, S.V.; Angelov, M.V. Fluctuating asymmetry in Pelophylax ridibundus meristic morphological traits and their importance in assessing environmental health. Ecol. Indic. 2019, 107, 105589. [Google Scholar] [CrossRef]
  38. Zhelev, Z.; Mollov, I.; Tsonev, S. Fluctuating asymmetry in meristic morphological traits of Bufotes viridis (Laurenti, 1768) (Anura: Bufonidae): Application for assessing environmental quality of two semi-natural habitats in Plovdiv city, Bulgaria. Acta Zool. Bulg. 2021, 73, 401–407. [Google Scholar]
  39. Zhelev, Z.; Tsonev, S.; Boyadzhiev, P. Using of fluctuating asymmetry in adult Pelophylax ridibundus (Amphibia: Anura: Ranidae) meristic traits as a method for assessing developmental stability of population and environmental quality of their habitat: Industrial area in southern Bulgaria. Turk. J. Zool. 2022, 46, 220–227. [Google Scholar] [CrossRef]
  40. Chubinishvili, A.T. Evaluation of the status of nature population of the marsh frog (Rana ridibunda Pall) in the region of the Nizhniy Volga by the homeostasis of the development: Cytogenetic and morphogenetic approaches. Russ. J. Zool. 1998, 77, 942–946. (In Russian) [Google Scholar]
  41. Loginov, V.V.; Gelashvili, D.B. Morphogenetic and Cytogenetic Characteristics of Natural Populations of Green Frog Hybrid Complex Rana esculenta in Natural Conditions in Nizhny Novgorod Region. In Current Problems of Herpetology and Toxicology; Bakiyev, A.G., Ed.; IEVB: Tolyatti, Georgia, 2001; pp. 62–69. (In Russian) [Google Scholar]
  42. EC. Directive 2000/60/EC of the European Parliament and of the Council establishing a framework for Community action in the field of water policy. OJEU 2000, L327, 1–73. [Google Scholar]
  43. Ordinance No H-4/14.09.2012; On the Characterization of Surface Waters. State Gazette: Sofia, Bulgaria, 2012; Volume 22, pp. 1–54. (In Bulgarian)
  44. Ordinance No 256 of 1.11.2010; For Standards on Environmental Quality for Priority Substances and for Certain Other Pollutants. State Gazette: Sofia, Bulgaria, 2010; Volume 88, pp. 1–20. (In Bulgarian)
  45. Sutherland, W.J. The Conservation Handbook: Research, Management and Policy; Blackwell: Oxford, UK, 2000; 279p. [Google Scholar]
  46. Bannikov, A.G.; Darevskii, I.S.; Ishtenko, V.G.; Rustamov, A.K.; Shterbak, N.N. A Guide to the Amphibians and Reptiles of the USSR; Prosveshtenie: Moscow, Russian, 1977. (In Russian) [Google Scholar]
  47. Zakharov, V.M.; Zhdanova, N.P.; Kirik, E.F.; Shkil, F. Ontogenesis and Population: Evaluation of Developmental Stability in Natural Populations. Russ. J. Dev. Biol. 2001, 32, 336–351. [Google Scholar] [CrossRef]
  48. Molenberghs, G. Statistical methodology in biometry. Biometrics 2003, 1, 1–20. [Google Scholar]
  49. R Core Developmental Team. R: The R Project for Statistical Computing. version 4.2.2. 2022. Available online: http://www.R-project.org (accessed on 12 January 2023).
  50. Chikin, Y.A. Monitoring of toad populations for homeostasis. In Proceedings of the Reserves of Uzbekistan, 3rd ed. Yashchenko, R.V., Ed.; Chinor ENK: Tashkent, Uzbekistan, 2001; pp. 138–146. (In Russian). [Google Scholar]
  51. Jørgensen, N.O.G. Organic Nitrogen. In Encyclopedia of Inland Waters; Likens, G.E., Ed.; Elsevier: Oxford, UK, 2009; Volume 2, pp. 832–851. [Google Scholar]
  52. da Silva, E.F.; Melo, M.F.; Sombra, K.E.S.; Silva, T.S.; de Freitas, D.F.; da Costa, M.E.; da Silva Santos, E.P.; da Silva, L.F.; Serra, A.P.; Neitzke, P.R.D.M.C. Chapter: Organic Nitrogen in Agricultural Systems. In Nitrogen Fixation; BoD: Norderstedt, Germany, 2019. [Google Scholar]
  53. Green, P.A.; Vörösmarty, C.J.; Meybeck, M.; Galloway, J.N.; Peterson, B.J.; Boyer, E.W. Pre-industrial and contemporary fluxes of nitrogen through rivers: A global assessment based on typology. Biogeochemistry 2004, 68, 71–105. [Google Scholar] [CrossRef]
  54. Schuytema, G.S.; Nebeker, A.V. Comparative toxicity of ammonium and nitrate compounds to pacific treefrog and african clawed frog tadpoles. Environ. Toxicol. Chem. 1999, 18, 2251–2257. [Google Scholar] [CrossRef]
  55. Gosner, K.L. A simple table for staging anuran embryos and larvae with notes on identification. Herpetologica 1960, 16, 183–190. [Google Scholar]
  56. Earl, J.E.; Whiteman, H.H. Effects of pulsed nitrate exposure on amphibian development. Environ. Toxicol. Chem. 2009, 28, 1331–1337. [Google Scholar] [CrossRef]
  57. Wetzel, R.G. Limnology: Lake and River Ecosystems, 3rd ed.; Academic: New York, NY, USA, 2001; 1006p. [Google Scholar]
  58. Brown, M.D.; Carter, J.; Thomas, D.; Purdie, D.M.; Kay, B.H. Pulse-Exposure Effects of Selected Insecticides to Juvenile Australian Crimson-Spotted Rainbowfish (Melanotaenia duboulayi). J. Econ. Èntomol. 2002, 95, 294–298. [Google Scholar] [CrossRef]
Figure 1. An indicative map of the sites in Plovdiv City, where P. ridibundus individuals were captured in 2020. Legend: 1: urban site; 2: suburban site; 3: rural site.
Diversity 15 00118 g001
Figure 2. Adult P. ridibundus individual with low levels of asymmetry (a), adult P. ridibundus individual with high levels of asymmetry (b), subadult P. ridibundus individual with high levels of asymmetry (c), asymmetric morphological traits (df): trait 1—number of stripes on the dorsal side of the thigh (femur); trait 2—number of spots on the dorsal side of the thigh; trait 3—number of stripes on the dorsal side of the shank (crus); trait 4—number of spots on the dorsal side of the shank; trait 5—number of stripes on the foot (pes); trait 6—number of spots on the foot; trait 7—number of stripes and spots on the back (dorsum); trait 8—number of white spots on the ventral side of the second finger of the hind leg; trait 9—number of white spots on the ventral side of the third finger of the hind leg; trait 10—number of white spots on the ventral side of the fourth finger of the hind leg.
Diversity 15 00118 g002
Figure 3. Principal components analysis of the 13 physicochemical parameters (factor weights) determining the ecological status on the three sites of Maritsa River for the period 2017–2019.
Diversity 15 00118 g003
Figure 4. Proportion of individuals with respective FAMI values by sexes (A) and by sites (B). The individuals are grouped according to the number of the morphological characters with asymmetries observed, indicated with different colors shown in the legend.
Diversity 15 00118 g004
Table 1. Physicochemical properties of the waters of Maritsa River in the three studied sites, for the period 2017–2019, according to the data of the newsletters of the Basin Directorate of Water Management in the East Aegean Sea—Plovdiv, Ministry of the Environment and Waters (http://www.bg-ibr.org (accessed on 12 January 2023)). Physicochemical data are presented with average annual values and the lowest and highest measured values for each year.
Parameters and Standards for High Water Quality *Urban SiteSuburban SiteRural Site
2017–2019
Moderate **
2017–2019
Moderate
2017–2019
Moderate
Temp °C-(5.0–28.0)(5.0–22.0)(6.0–22.0)
pH units-7.93 (7.5–8.5)7.89 (7.6–8.2)7.73 (7.1–8.3)
EC µS/cm700.0340.83
(212.0–448.0)
393.97
(296.0–515.0)
556.3
(248.0–1096.0)
DO mgO2/dm39.0–7.09.13
(7.2–11.4)
8.9
(7.5–11.2)
9.43
(6.7–12.5)
BOD5 mgO2/dm3<2.01.22
(0.5–2.1)
1.65
(0.5–2.8)
1.73
(0.5–3.3)
COD mgO2/dm325.09.67
(6.0–16.0)
8.4
(6.0–22.0)
13.8
(6.0–30.0)
Ox%100–10594.43
(77.0–115.0)
89
(73.0–100.0)
90.63
(68.0–114.0)
CCH mg CaCO3/dm3<40.0135.86
(80.0–210.0)
158.7
(103.0–275.0)
197.93
(105.0–375.0)
NH+4-N mg/dm3<0.100.18
(0.11–1.01)
0.21
(0.11–0.29)
0.26
(0.12–0.56)
NO2-N mg/L<0.030.02
(0.02–0.06)
0.04
(0.01–0.07)
0.04
(0.02–0.07)
NO3-N mg/L<0.70.51
(0.26–0.72)
1.65
(0.82–2.2)
1.96
(0.47–4.1)
TN mg/L<0.7<0.11.55
(1.3–2.2)
2.62
(1.3–4.0)
PO3−4 mg/L<0.070.02
(0.01–0.03)
0.23
(0.08–0.31)
0.05
(0.02–0.12)
TP mg/L<0.150.03
(0.02–0.07)
0.18
(0.02–0.46)
0.1
(0.05–0.21)
Legend: Parameters, abbrLegLegend: Parameters, abbreviations: Temperature (Temp), electrical-conductivity (EC), dissolved oxygen (DO), oxygenation (Ox), biological oxygen demand five days (BOD5), chemical oxygen demand (COD), calcium carbonate hardness (CCH), ammonium nitrogen (NH+4-N), nitrite nitrogen (NO2-N), nitrate nitrogen (NO-3-N), total nitrogen (TN), orthophosphates (PO3−4), total phosphorus, as P (TP). (*) Standards for high water quality of inland surface water—flat-type rivers and (**) surface water status (according to Annex V of EU water framework directive 2000/60/EC (EC, 2000) and Ordinance No H-4 of 14.09.2012 (State Gazette, No. 22. 5.03.2013) on the characterization of surface waters in Bulgaria.
Table 2. The FAMI values (means ± standard deviation) of asymmetric individuals and the number of individuals asymmetric on any trait (%) in Pelophylax ridibundus populations, inhabiting the sites on the Maritsa River in southern Bulgaria, and results from analyses of the effect of the habitat (site) on the rate of observed asymmetries in the studied individuals Pelophylax ridibundus—April 2019; results of the GLM model.
SitesMeristic Morphological Traits
Trait 1Trait 2Trait 3Trait 4Trait 5Trait 6Trait 7Trait 8Trait 9Trait 10
Urban
n = 30
n = 22
(73%)
n = 12
(40%)
n = 17
(57%)
n = 17
(57%)
n = 17
(57%)
n = 16
(53%)
n = 26
(87%)
n = 18
(60%)
n = 17
(57%)
n = 16
(53%)
FAMI (0.59 ± 0.06); Grade scale (3)
Suburban
n = 30
n = 19
(63%)
n = 11
(37%)
n = 15
(50%)
n = 14
(47%)
n = 17
(57%)
n = 18
(60%)
n = 23
(77%)
n = 13
(43%)
n = 10
(33%)
n = 13
(43%)
FAMI (0.51 ± 0.07); Grade scale (3)
Rural
n = 30
n = 24
(80%)
n = 16
(53%)
n = 19
(63%)
n = 19
(63%)
n = 24
(80%)
n = 14
(47%)
n = 25
(83%)
n = 20
(67%)
n = 11
(37%)
n = 14
(47%)
FAMI (0.62 ± 0.06); Grade scale (4)
GLM modelEstimateStd. ErrorZ valuePr (>|z|)Odds
(Intercept)0.3790.1322.8620.0041.461
Site_Suburban−0.3160.166−1.9020.0570.728
Site_Rural0.1270.1670.7640.4441.136
Sex_Female−0.0350.141−0.2490.8020.965
Legend: n—number of individuals; trait 1—number of stripes on the dorsal side of the thigh (femur); trait 2—number of spots on the dorsal side of the thigh; trait 3—number of stripes on the dorsal side of the shank (crus); trait 4—number of spots on the dorsal side of the shank; trait 5—number of stripes on the foot (pes); trait 6—number of spots on the foot; trait 7—number of stripes and spots on the back (dorsum); trait 8—number of white spots on the ventral side of the second finger of the hind leg; trait 9—number of white spots on the ventral side of the third finger of the hind leg; trait 10—number of white spots on the ventral side of the fourth finger of the hind leg.
Disclaimer/Publisher’s Note: The statements, opinions and data contained in all publications are solely those of the individual author(s) and contributor(s) and not of MDPI and/or the editor(s). MDPI and/or the editor(s) disclaim responsibility for any injury to people or property resulting from any ideas, methods, instructions or products referred to in the content.

