1. Introduction
The European bison (
Bison bonasus), also known as the wisent, is Europe’s largest terrestrial mammal. Population genetics and management of the modern European bison’s gene pool, after its extirpation in nature in the 1920s, is considered an important task and major issue for this species’ conservation [
1]. As a result of past bottlenecks, the current population has experienced a significant loss of genetic variability and a high degree of inbreeding [
2]. The first detailed analysis of the pedigree was conducted by Slatis [
3] and included animals that were living in the 1950s. Slatis found that all European bison were derived from 17 ancestors, but some of these ancestors were represented by only a single descendant. The author decided to refer to the 12 unique genotypes as the founders: 11 individuals of the subspecies
Bison bonasus bonasus and one of the subspecies
Bison bonasus caucasicus.
The species is divided into two genetic lines: a Lowland line (LB) which is pure lowland subspecies (
Bison bonasus bonasus) and a Lowland–Caucasian line (LC) which is a mixture of two subspecies. The gene pool of the present Lowland line (LB) includes only seven founders (BEGRÜNDER pedigree no. 15, PLAVIA pedigree no. 16, PLANTA pedigree no. 42, PLEBEJER pedigree no. 45, BILL pedigree no. 87, BILMA pedigree no. 89, and BISMARCK pedigree no. 147) [
1,
4,
5]. This line is closed because both parents should belong to the LB line. In addition, in the current population, all males in this line have a copy of the Y chromosome from the founder, named Plebejer [
5]. The other 11 individuals, PLEWNA pedigree no. 35, PLACIDA pedigree no. 46, GARDE pedigree no. 95, and GATCZYNA pedigree no. 96, although also belonging to the lowland subspecies
Bison bonasus bonasus, left only hybrid offspring with the Caucasian subspecies
B. b. caucasicus. Their descendants established the second line (LC), containing the genes of a Caucasian founder (KAUKASUS pedigree no. 100), so all 12 founders formed the gene pool of this genetic line [
4,
5].
Most of the papers published thus far in the field of European bison genetics have mainly been concerned with the Lowland line, which cannot be considered a reference for the whole species. Analyses of genetic variability have shown a high degree of homogeneity in the Lowland line compared to the Lowland–Caucasian line [
6]. The genetic lines are kept and bred separately in captivity. According to an International Union for Conservation of Nature (IUCN) study on European bison [
1,
3], the isolation of lines is important for counteracting the loss of genetic variability within the Lowland–Caucasian line. Other authors have pointed out that one of the threats to the genetically pure Lowland subspecies is possible hybridization with the Lowland–Caucasian line [
7]. In both cases, there is the need for a tool that can help distinguish animals belonging to these lines if pedigree data is missing.
Another important issue is the proper assignment of parentage. The European Bison Pedigree Book (EBPB), established in 1923, contains information on the captive part of the population. Although these data are extremely valuable, they should not be used as the only source of information. Genetic monitoring of free-ranging herds cannot be based on pedigrees, so it is necessary to use molecular methods for the species. In addition, in some herds, it might be difficult to assign offspring to their mothers due to the large area of enclosure or the high relationship between females within a herd. For example, individuals in the Pszczyna breeding center are very closely related. The European Bison Pedigree Book shows that, in a given year, calves are born from one or two sires, and the mothers are often sisters or half-sisters [
8]. When many calves are born within a short period, parentage is judged mainly from observations of cow and calf behavior. Another aspect is the identification of individuals to avoid duplication of data. Sometimes an animal is sampled multiple times in different periods. If this is conducted in a captive herd, it is easy to obtain the correct animal ID; but when wisents belonging to a free-ranging population are sampled, identification can pose some difficulties, especially for animals without collars or transponders.
Modern parentage and individual identification employing comprehensive genetic analysis performed with a reliable molecular method are needed as a population management tool to further validate and maintain the genetic diversity of the species.
Commonly used genetic markers in the study of population genetics are Single Nucleotide Polymorphisms (SNPs). SNP is defined as a difference in a single base pair at a particular location in the genome between individuals of the same species. They occur both in non-coding and coding regions of the genome. SNP detection technologies have evolved from labor-intensive and time-consuming processes to some of the most automated and relatively inexpensive methods [
9]. Over the years, many methods have been used to analyze these markers, including PCR-RFLP—restriction fragment length polymorphism, or PCR-SSCP—single-strand conformation polymorphism. However, they only allow SNP analysis within a single amplified DNA fragment during a single test [
10]. Another method for SNP analysis is allele-specific PCR. This technique is based on the amplification of a product that depends on an SNP in the primer binding site. The occurrence of a given allele results in the amplicon or its absence. Detection of the product depends on the technique used, e.g., thermocyclers for Real-Time PCR, whereby the product increment can be read in real-time, which shortens procedures [
11].
A breakthrough in the study of single-nucleotide polymorphism turned out to be DNA microarrays. The use of microarrays has allowed hundreds of thousands of SNP markers to be studied simultaneously [
12]. DNA microarrays are defined as ordered collections of molecular probes, immobilized on different types of surfaces in a well-defined arrangement. Microarrays with short oligonucleotide probes are used in SNP analysis, but the way they are synthesized, labeled, and detected depends on the company’s technology.
Our research aimed to create a small but complex and informative panel of SNP markers that can be used for routine genetic testing of the European bison, maintaining its efficiency at a low cost. For this study, we developed a custom microarray for the European bison and used it to analyze a large pool of samples, which then allowed us to propose a comprehensive set of markers that could serve as a tool for the conservation of the European bison. The panels are designed for the routine use of medium-throughput single nucleotide polymorphism (SNP) genotyping techniques. Based on the panels described in this article, it is possible to perform analyses using different techniques such as KASP, TaqMan [
13], and others, depending on the capabilities of the laboratory. In this paper, we present an effective SNP set to perform the genetic analyses of European bison that are needed for population monitoring and management.
3. Results
The SNPs selected as markers for bovine hybridization provided results for the hybrid sample only. Of 82 markers, 10 with the best quality parameters were selected, but further confirmation of their effectiveness was needed on an even larger sample of European bison. Two of these markers were located on the same chromosome (1) but were approximately 8.6 Mbp apart. The markers selected for the panel to distinguish between European bison and American bison only provided a result in the case of the American bison samples. In total, 10 of the 18 markers were selected for the panel. The two SNPs were located on the same chromosome (4), approximately 28.9 Mbp apart (
Supplement Table S1).
After quality control for call frequency, MAF, PC, PPC, and correct clustering, 1836 SNP markers remained. The list of markers from the designed microarray, which was selected based on the preliminary tests [
5,
9], was compared to the markers that had passed the controls after genotyping a larger number of wisent samples, totaling 455. Subsequently, 713 candidate SNP markers for the Profile panel and 299 SNPs for the Line panel remained for further analysis. LD and HWE analyses allowed the number of markers to be narrowed down. The multilocus match analysis of samples, genotyped twice in independent reactions, allowed the compatibility of genotypes to be checked and confirmed the correctness of laboratory analyses.
3.1. “Profile”—SNP Panel for Individuals and Parentage Identification Assessment
Analysis using an increasing number of loci showed that the probability of identity for unrelated samples had already fallen below 1% at five SNP markers. For PIsibs, 10 SNPs were required to reach values below 1% for a given population size. The estimated expected number of unrelated individuals with the same multilocus genotype for increasing locus combinations (calculated as respective probability x population size) is less than one when combining at least seven markers, and 13 SNPs when based on PIsibs.
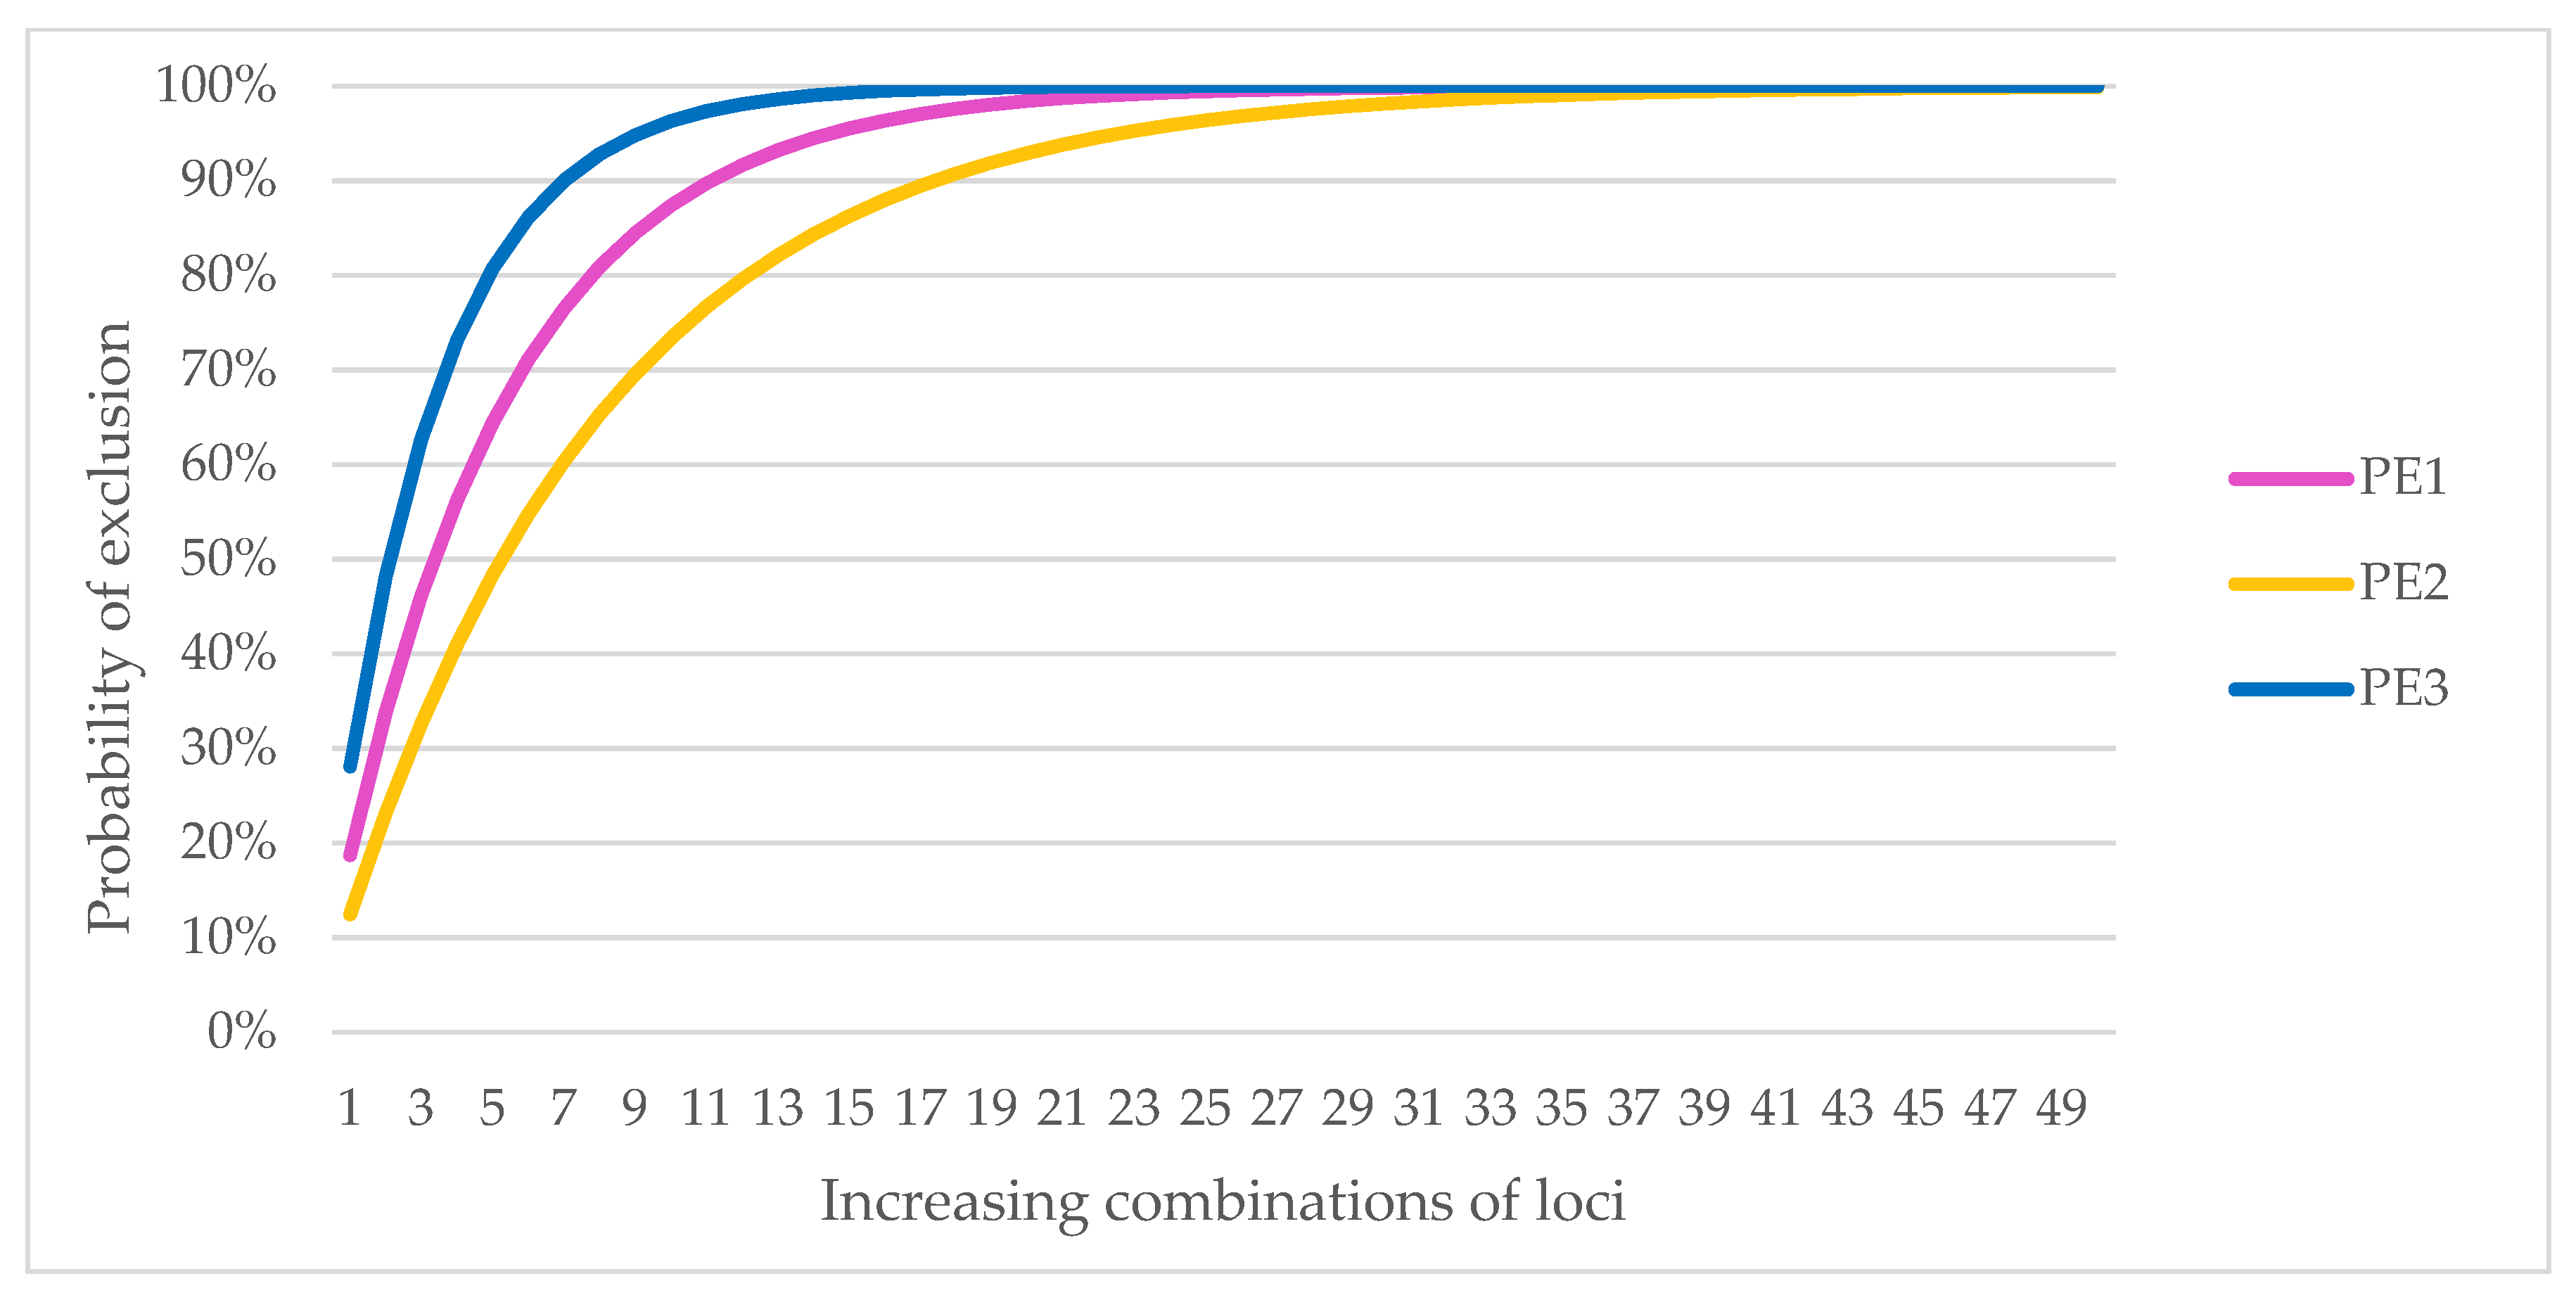
The results of the PE analysis for an increasing number of loci showed that to exclude parenthood at a probability greater than 99%, at least 23 SNP markers would need to be genotyped if the other parent was known (PE1), 38 SNP markers if the genotype of one of the parents was unknown (PE2), and 15 SNP markers if the test was to exclude parentage by a specific pair of individuals (PE3).
Because of the possible differences in results for individuals from different genetic lines, the PE analyses were also performed separately for the LB and LC lines. Parental exclusion at a probability above 99% was possible for LB with 24 markers for PE1, 40 for PE2, and 15 for PE3; for LC, the number of markers was 23 for PE1, 37 for PE2, and 15 for PE3 (
Figure 1). The selection of markers during the preliminary studies eliminated differences arising from the genetic lines so that these markers could be used for individual identification regardless of the origin of the sample.
Based on the results of PE, we assumed that a minimum number of 40 markers was required for individual identification and parentage control. An optimally expanded panel of 50 SNPs was proposed (
Supplement Table S2), selected on the markers’ frequency of genotypes and alleles across all tested samples, regardless of the genetic line. For the combined 50 SNPs, the values were 5.6 × 10
−22 for PI and 5.2 × 10
−12 for PIsibs. Exclusion of parentage is possible in all cases with the selected markers at a probability of more than 99%. Details are shown in
Figure 1. The MS analysis confirmed that there were no matches in the multilocus genotype for all 455 samples, even in closely related individuals from Pszczyna (PL subline).
The accuracy of the ancestry assignment obtained from the CERVUS software was high. At a strict 95% confidence level the assignment rate was 100% in all cases. The first dataset for a known trio (offspring, father, and mother), from Avesta (Sweden), was subjected to two different methods. In the paternity analysis with a known mother and candidate fathers, the highest pair LOD score (7.56) was obtained for the real father and offspring; also, for the given mother and real father, the Trio LOD score (10.19) was higher than for the other combinations of mother–candidate father. The values of the LOD scores for other candidates were negative, which means that these animals were less likely to be real parents than non-real parents. The second parent non-exclusion probability was 3.21 × 10
−5. The full brother of the known father had a pair LOD score equal to −2.76. The second method used in the given data set was the determination of the parent pair (sex unknown). A total of 66 combinations of triplets (offspring, presumed first parent, presumed second parent) were analyzed. The obtained results unequivocally indicated the correct parent pair, even though the studied pool also contained closely related individuals. The best Trio LOD result (20.53) was found when both the true parent and the offspring were combined. The five best Trio LOD results are shown in
Table 2. The parent pair non-exclusion probability was low at 1.86 × 10
−8.
The next dataset for offspring–candidate parents was performed on the Białowieża herd (Poland). The offspring were half-siblings (the common mother was not included in the database). The assignment of the putative second parent was made from a set of 13 wisents that included the true fathers of two of the offspring each and a grandfather of one of the offspring. The first father–son pair had a pair LOD score of 8.10 whereas the other wisents had negative scores. In the case of the second offspring, the highest pair LOD score was also obtained for the father–descendant pair (9.21) with a confidence level of 95%, whereas the grandfather–offspring scored 8.22 for their pair LOD. The probability of a correct parentage assignment increases with the value of the LOD score.
The last set of data, offspring and candidate parents, concerned animals from the breeding center in Pszczyna. The analyses were performed for two offspring and 15 candidate parents, including one true parent for each offspring. In both cases, the highest values for the pair LOD scores were observed for the true parents; this result is promising.
3.2. “Line”—SNP Panel for Assessing Membership of the Lowland (LB) or Lowland–Caucasian (LC) Lines
Of the markers with highly significant differences in allele frequency, a set of 30 SNPs and a set of 17 SNPs with private alleles for LC were selected. Although we found three SNPs with private alleles for the Lowland line, these should not be used to distinguish between lines, primarily because LC is an open line and is a mix of all 12 ancestors, including the seven wisents that created the LB line. The lists of the two sets of selected markers with allele frequencies are shown in
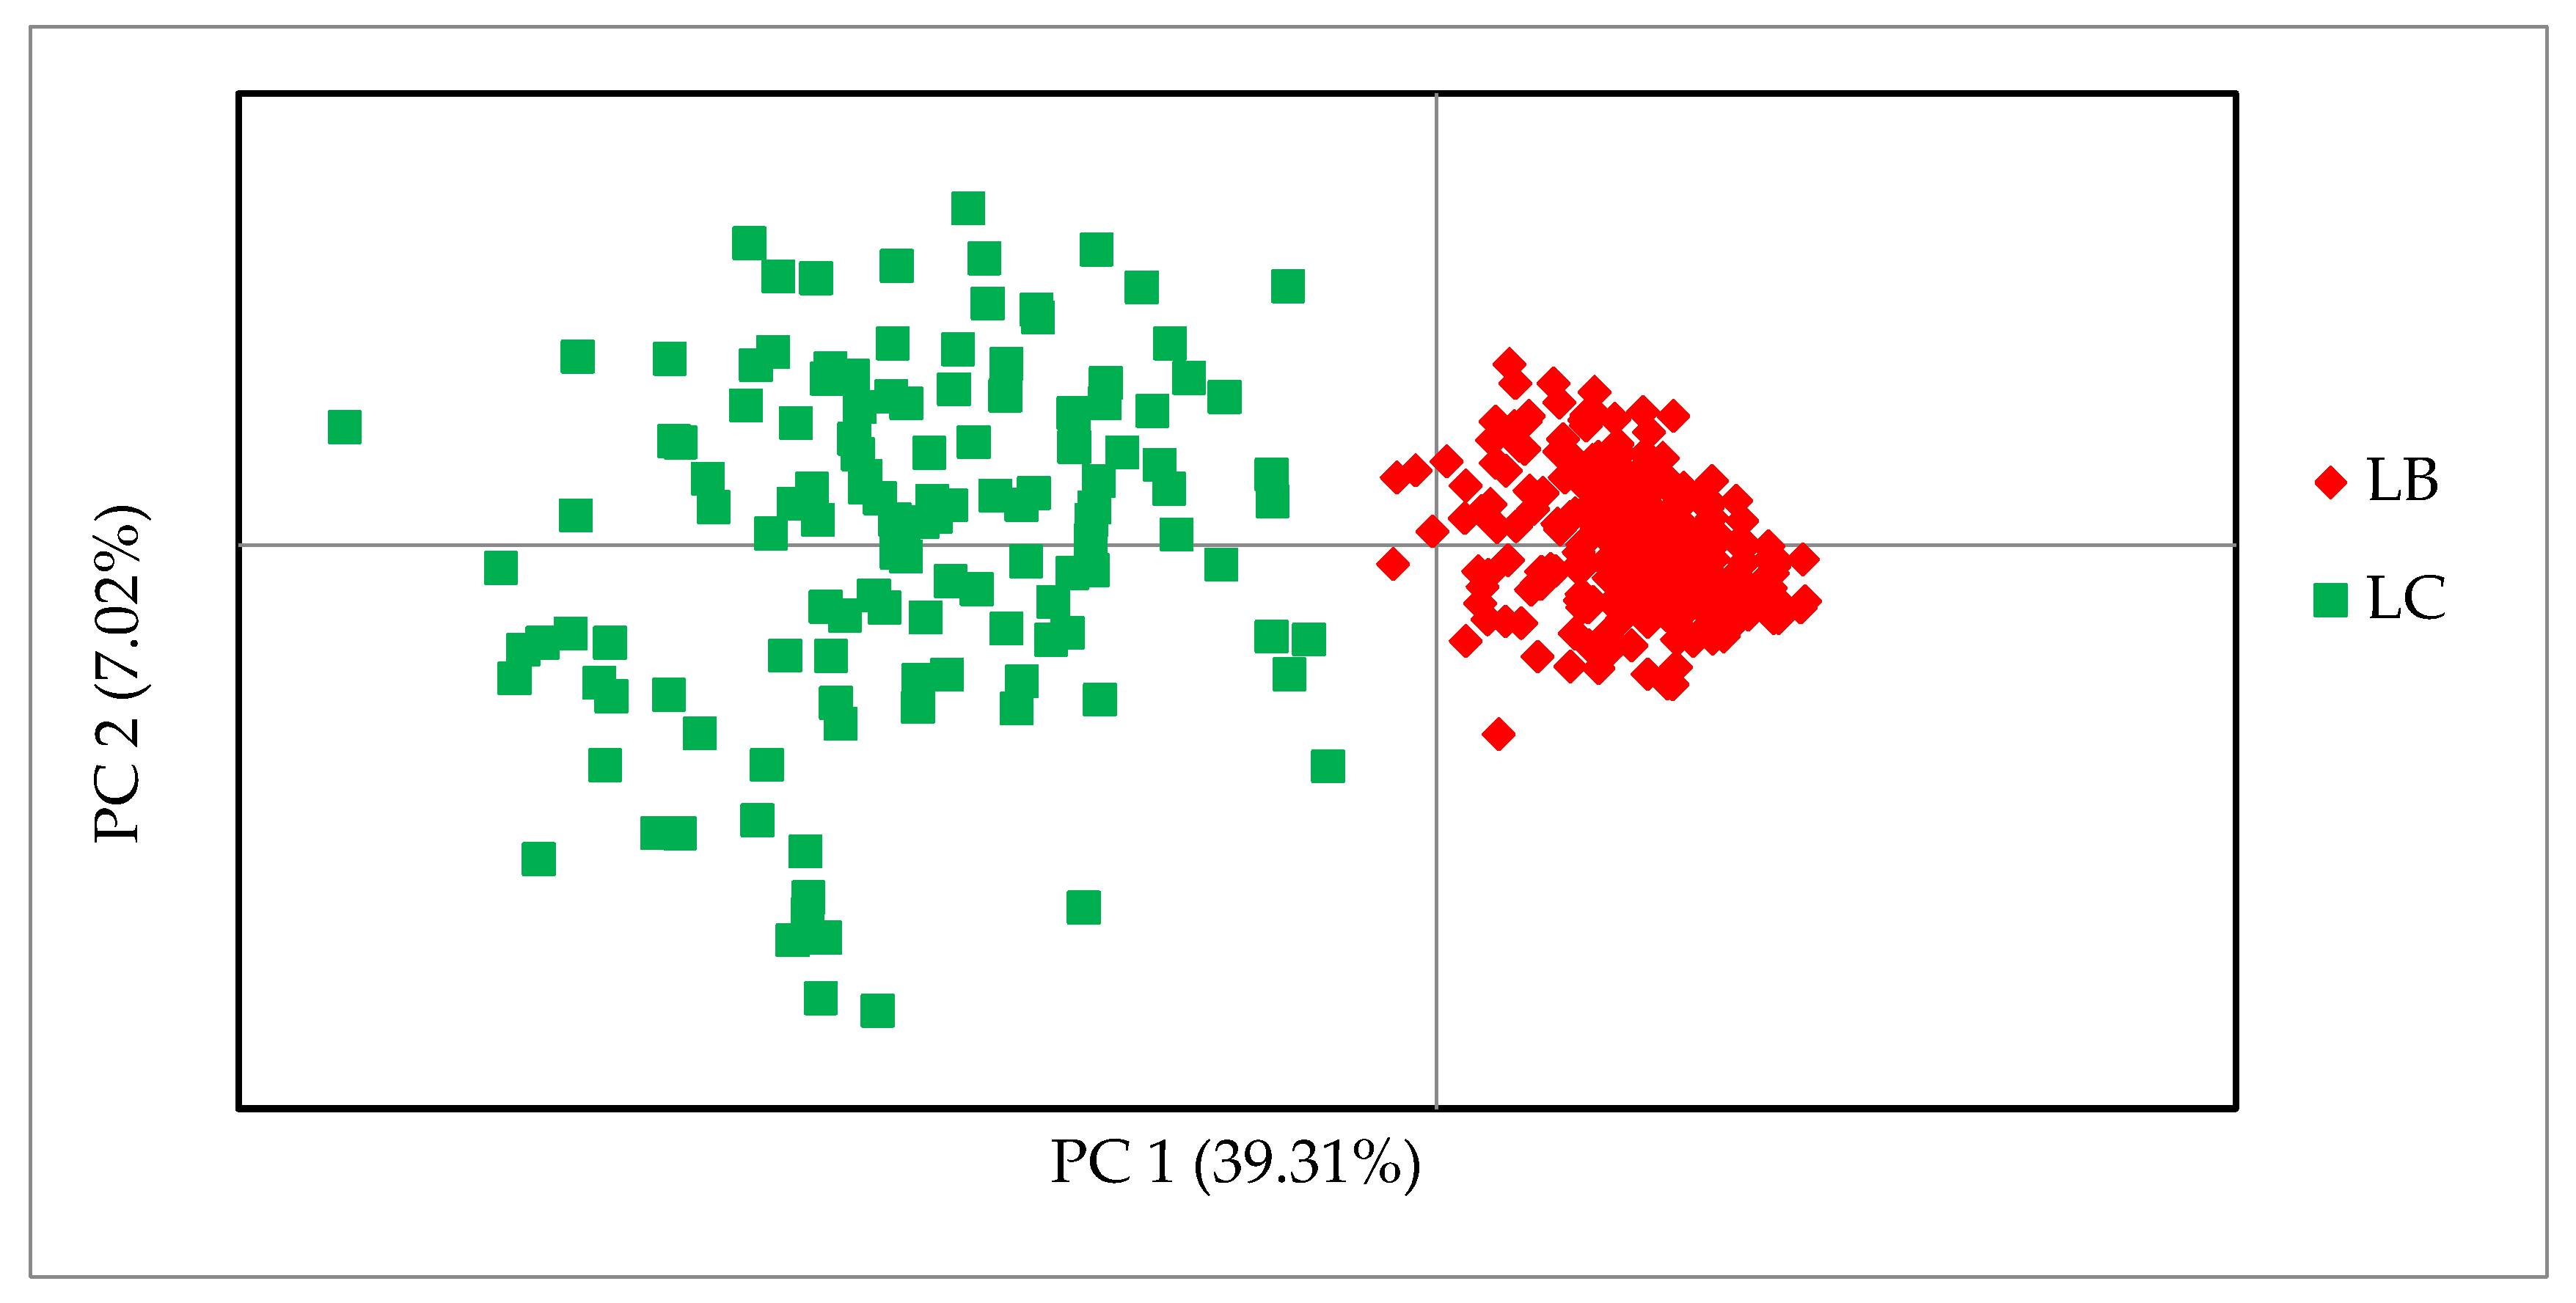
Tables S3 and S4 in the Supplement. Analysis of the principal coordinates of the 30 SNPs proved the effectiveness of the markers and their usefulness in differentiating the lines.
Figure 2 shows that the first coordinate (PC1) separated the samples of the two lines and was responsible for 39.31% of the genetic variability. The second coordinate (PC2) also shows a greater differentiation between the animals of the LC line. Individuals from the LB line were tightly clustered and separated from the more diverse LC individuals, regardless of their origin.
4. Discussion
Our research aimed to provide complex sets of SNPs that could be used as valuable genomic tools for monitoring genetic diversity and the management of European bison populations. An optimally reduced number of markers will allow the cost of analyzing single individuals to be reduced without having to use standard microarrays every time.
Currently, control of the origin of European bison is mainly based on pedigree data published in the European Bison Pedigree Book (EBPB) and on information provided by breeders and people who take care of the animals on a daily basis. However, this information is not always 100% certain or is not verified. Another problem is the identification of individuals in large or semi-free-ranging herds, where it is difficult to constantly observe the animals. Tokarska et al. [
20] compared the effectiveness of using microsatellite and SNP markers for parentage testing. Different numbers of animals were used in simulations in the CERVUS program. In the case of SNPs, 50 animals were tested using the BovineSNP50 microarray, whereas microsatellites were used in the analysis of 276 wisents. It should be mentioned that all the examined animals belonged to the Lowland line. With 17 microsatellites, the mean expected heterozygosity was He = 0.31. To maintain heterozygosity at this level, 68 markers would be required to ensure a 95% probability of correct paternity assignment where the mother is unknown. On the other hand, the authors concluded that a random selection of markers would require 80–90 SNPs, and considering the highest level of heterozygosity, a set of 50–60 markers would be sufficient for selection. The markers (50 SNPs) selected for this purpose in our study had a mean expected heterozygosity of He = 0.498. The result of the CERVUS software gives us confidence that the selected markers can successfully be used for parentage analysis. We performed an evaluation of parentage candidates for offspring on different data sets from both genetic lines, including closely related animals. Thus, confirmation of paternity was unequivocal, even for male full siblings or for the father and grandfather of offspring considered to be potential parents in the data.
Oleński et al. [
21] created an interesting subset of 100 SNPs for parental identification in the European bison Lowland line. However, when the list of markers is compared to the data from our research, it is found that of the 1836 SNP markers that passed basic quality control, only 17 markers were identical; furthermore, our final set of 50 SNPs contained only four identical markers to their subset of SNPs. This drastic difference may be due to the fact that we included individuals from the LC line as well as animals from different LB populations in our analysis. In their study, Oleński et al. [
21] focused only on the Białowieża population, which belongs to the LB line. Nevertheless, parameters such as PI and PE were sufficient for both identifying individuals and parentage control in both cases. Hara et al. [
22] developed a panel of markers for origin control in Japanese Black cattle by selecting 87 SNPs that reached a PE of 0.999998 where one parent was known. A similar power for exclusion probability was obtained in American bison [
23]. Out of 191 SNPs tested, 50 markers resulted in a PE value close to 100%. According to Waits [
24], a PI (Probability of Identity) value of 10
−3–10
−4 is sufficient for wildlife analysis. Of course, if the history of the European bison species is taken into account, this value should be even lower. The combined PI for 100 SNPs in a study by Oleński et al. [
21] was 1.14 × 10
−40, whereas for our Profile panel with 50 SNPs, we obtained PI values of 5.6 × 10
−22 and PIsibs of 5.2 × 10
−12. In the studies on Japanese cattle mentioned earlier [
21], a panel with 87 markers produced a PI of 2.01 × 10
−34. Considering the number of markers, these results are comparable.
In the Yang et al. [
23] study, 17,018 markers were used for subspecies composition analysis to distinguish between the American wood bison and American plains bison. This was a large set of markers, requiring the use of microarrays or other high-throughput methods that may incur additional costs for a large number of samples. In our preliminary studies [
6], the allele frequencies of the studied SNP markers for the LB and LC lines were compared. In this first phase, the marker pool was narrowed down to 1536 SNPs, of which almost 50% were monomorphic in the Lowland line; in the Lowland–Caucasian line more than 80% had a MAF greater than 0.2. These results clearly show the problem of very low genetic variability within the Lowland line. In this study, with only 30 SNPs, it was possible to distinguish the genetic lines of the European bison and to select additional markers with allele characteristics only of the Lowland–Caucasian line. The markers in the Line set separated the genetic lines, but still showed the complex structure of the LC line. The PCoA method resulted in a compact cluster of Lowland line individuals and a more dispersed and diversified group of Lowland–Caucasian individuals.
The purity of the species is as important as membership in a genetic line. In animals threatened with extinction or at risk of losing genetic variability, it is extremely important to control the origin and avoid crosses with other species. In the group of individuals studied, the markers selected for each panel met all the assumed criteria. The markers that allowed for the molecular differentiation of the European bison and its bovine hybrids provided a result only for the Dima sample, the only Bison bonasus x Bos taurus hybrid among the analyzed specimens. It is necessary to confirm these results for a larger number of hybrids. However, these markers also allow wisents to be differentiated from cattle, making them a useful tool, for example, in detecting poaching. Additionally, in the case of distinguishing wisents from American bison, it was possible to select good markers; this, however, requires further analysis. Genotyping of these markers in wisents may indicate hybridization, but it does not have to be unambiguous hybridization with the American bison. Recall that the markers were selected from SNPs that were derived from the Illumina Bovine50SNP and BovineHD microarrays, i.e., markers developed for cattle.
Transferring a known method to a new species is more efficient and less costly than searching for new markers or developing methods de novo. However, when using this type of method transfer from one species to another, one has to reckon with the need to optimize procedures and the possibility of obtaining fewer data or poorer data quality. Miller et al. [
25] compared the applicability of microarrays developed for three domestic animal species, the OvineSNP50 BeadChip, the BovineSNP50 BeadChip, and the EquineSNP50 BeadChip in genome studies of other species. He determined the relationship between the effective use of microarrays and the time of phylogenetic separation of species. A linear decrease in genotyping efficiency, as measured by the call rate parameter, of about 1.5% per million years separating the compared species was observed, whereas a much steeper decrease was observed for polymorphism. In a preliminary study [
6], it was shown that of the markers available on the microarrays Bovine50SNP and BovineHD, as many as 94.5% of SNPs were genotyped in European bison (with call rates equal to or greater than 90%), A similar call rate was reported for American bison in a study by Decker et al. [
26], whereas lower values were obtained by the same author for Water buffalo
Bubalus bubalis 86.4%, or Kudu
Tragelaphus strepsiceros 76.6%. For other species, such as deer, by using BovineSNP50 it was possible to successfully genotype a much lower number of SNPs, 38.7–53.8% of markers [
27,
28]. Nevertheless, microarrays have been successfully used in wildlife research. In the case of animals at threat of extinction or at risk of losing genetic variability, it is extremely important to carry out origin control and avoid interbreeding with other species. One threat can be the occurrence of individuals of two related species or subspecies in the same area. A good example is the situation of the mountain chamois (
Rupicapra rupicapra), whose two subspecies Tatra (
R. r. tatrica) and Alpine
(R. r. rupicapra) occur in close proximity to each other [
29]. Thus, there is a potential threat of hybridization between these subspecies, but the difficulty in obtaining biological material results in studies of a small number of individuals. Demontis et al. [
29] used Bovine 50SNP to study 4 Tatra and 6 Alpine chamois. Only 151 SNPs met the criteria for analysis, and a genetic structure analysis was conducted based on them, showing a split into two groups. Analogously, in European bison, control of genetic lines is an important part of population management.
High-throughput genotyping methods, such as microarrays, have a growing number of proponents because of their advantages, but the high cost of analysis and the need for good quality and high concentration DNA samples are increasingly leading researchers to use microarrays only for the screening and selection of the most valuable markers for a particular analysis, and then to base research on another, cheaper method. An example of this solution is the development of a set for the individual identification and control of the origin of Japanese Black cattle [
22]. The screening was performed using BovineSNP50 microarrays for 50 animals, after which, candidate markers were selected. PCR-RFLP reactions were designed for 60 SNPs, thanks to which another 111 animals were genotyped. Similarly, in the search for markers to distinguish Japanese cattle from foreign breeds, Sasazaki et al. [
30] performed preliminary analyses on 110 animals using the BovineSNP50 BeadChip. After the selection of 29 markers, further tests to confirm the correct selection were performed on 554 individuals, also using PCR-RFLP. Assuming that the number of selected markers is small, a cheaper and quite simple method, namely PCR-RFLP, is the obvious choice. However, this is a multi-step and time-consuming method, so it is not suitable for large SNP panels. In this situation, it may be helpful to use allele-specific PCR methods, which can be performed in a single reaction using standard Real-Time PCR instruments. In a preliminary study [
14], to test the possibility of using this method in European bison research, reactions were designed using the KASP™ technique—KBiosciences Competitive Allele-Specific PCR (LGC Genomics). The advantage of this method is the fact that the reaction can be performed on samples with lower DNA concentrations than on microarrays, which is extremely important in the case of wisents, especially when hair roots are the only available biological material. Despite the much lower number of markers compared to the first phase of the study [
6], the obtained results show that it is possible to use the medium-throughput technique as a tool for routine genotyping.
In this work, we proposed sets of SNP markers for routine genotyping in the population management of European bison. They can be used together or separately, depending on the demand. The sets include markers for detecting hybridization with domestic cattle and American bison, and two separate panels: “Profile”—a panel of 50 SNPs for individuals and parentage identification assessment, as well as “Line”—a panel of 30 SNPs for assessing membership of the Lowland (LB) or Lowland–Caucasian (LC) lines.


 ,
, 


