
Variations in Fish Community Structure at the Lagoon of Yongshu Reef, South China Sea between 1999 and 2016–2019

 and
and 
Abstract
:1. Introduction
2. Materials and Methods
2.1. Study Area
2.2. Data Collection
2.3. Data Analysis
2.3.1. Species Similarity
2.3.2. Catch per Unit Effort and Species per Unit Effort
2.3.3. Index of Relative Importance
2.3.4. Species Diversity Indices
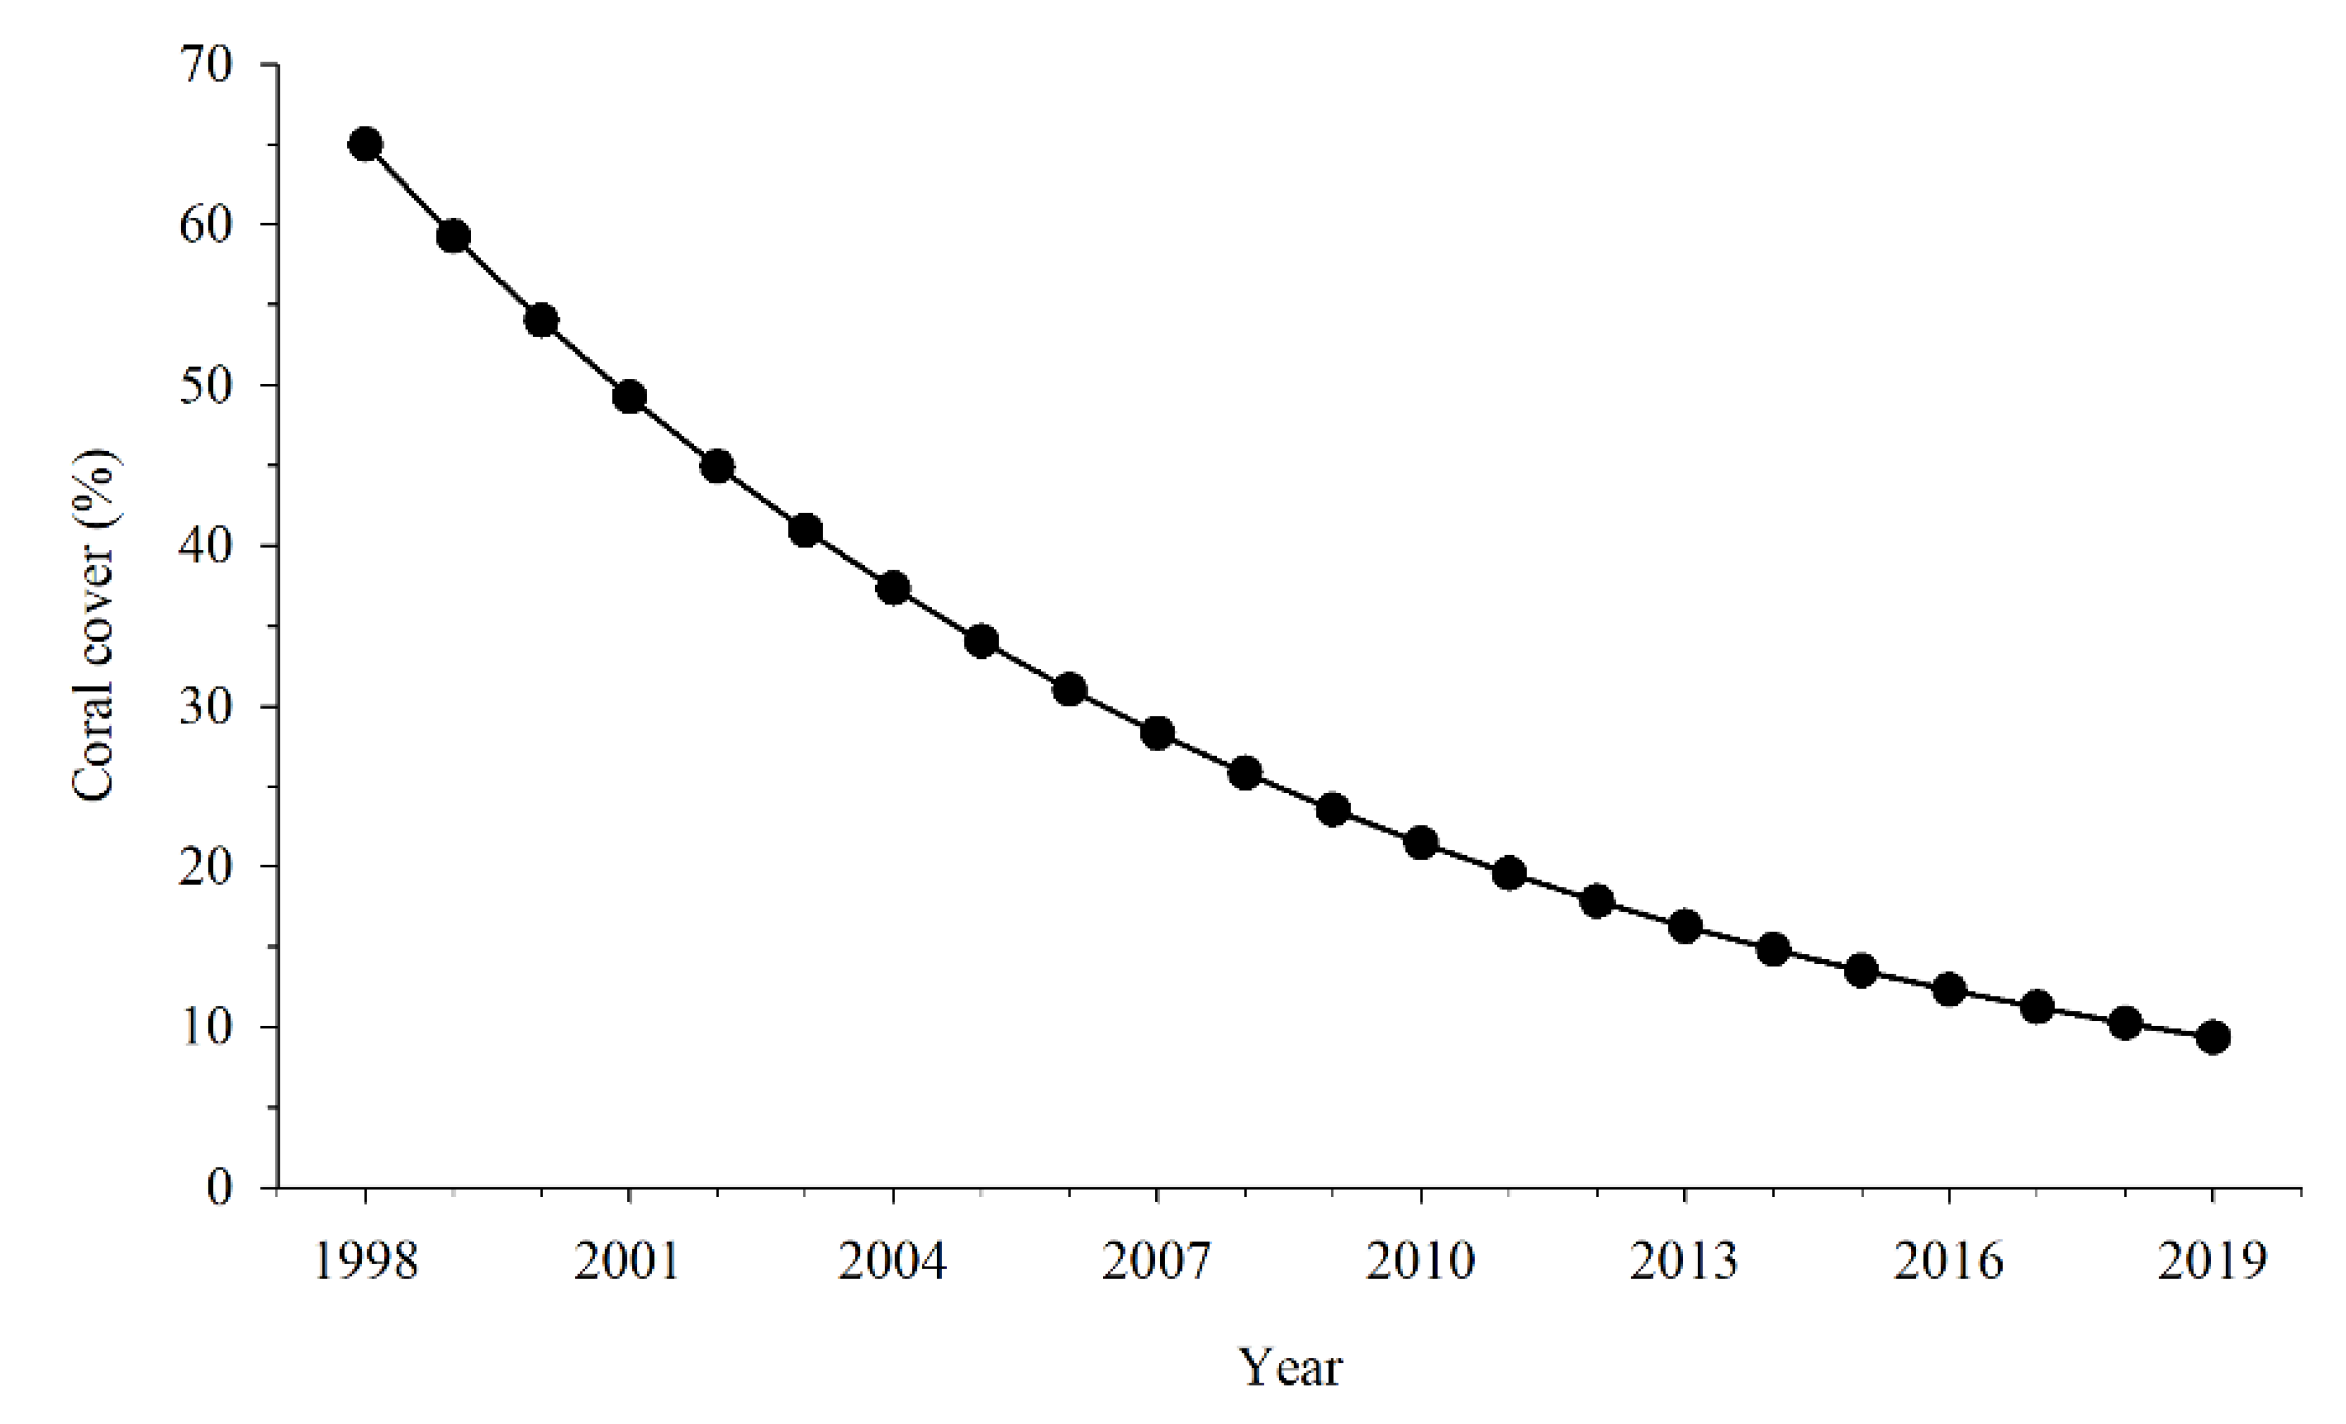
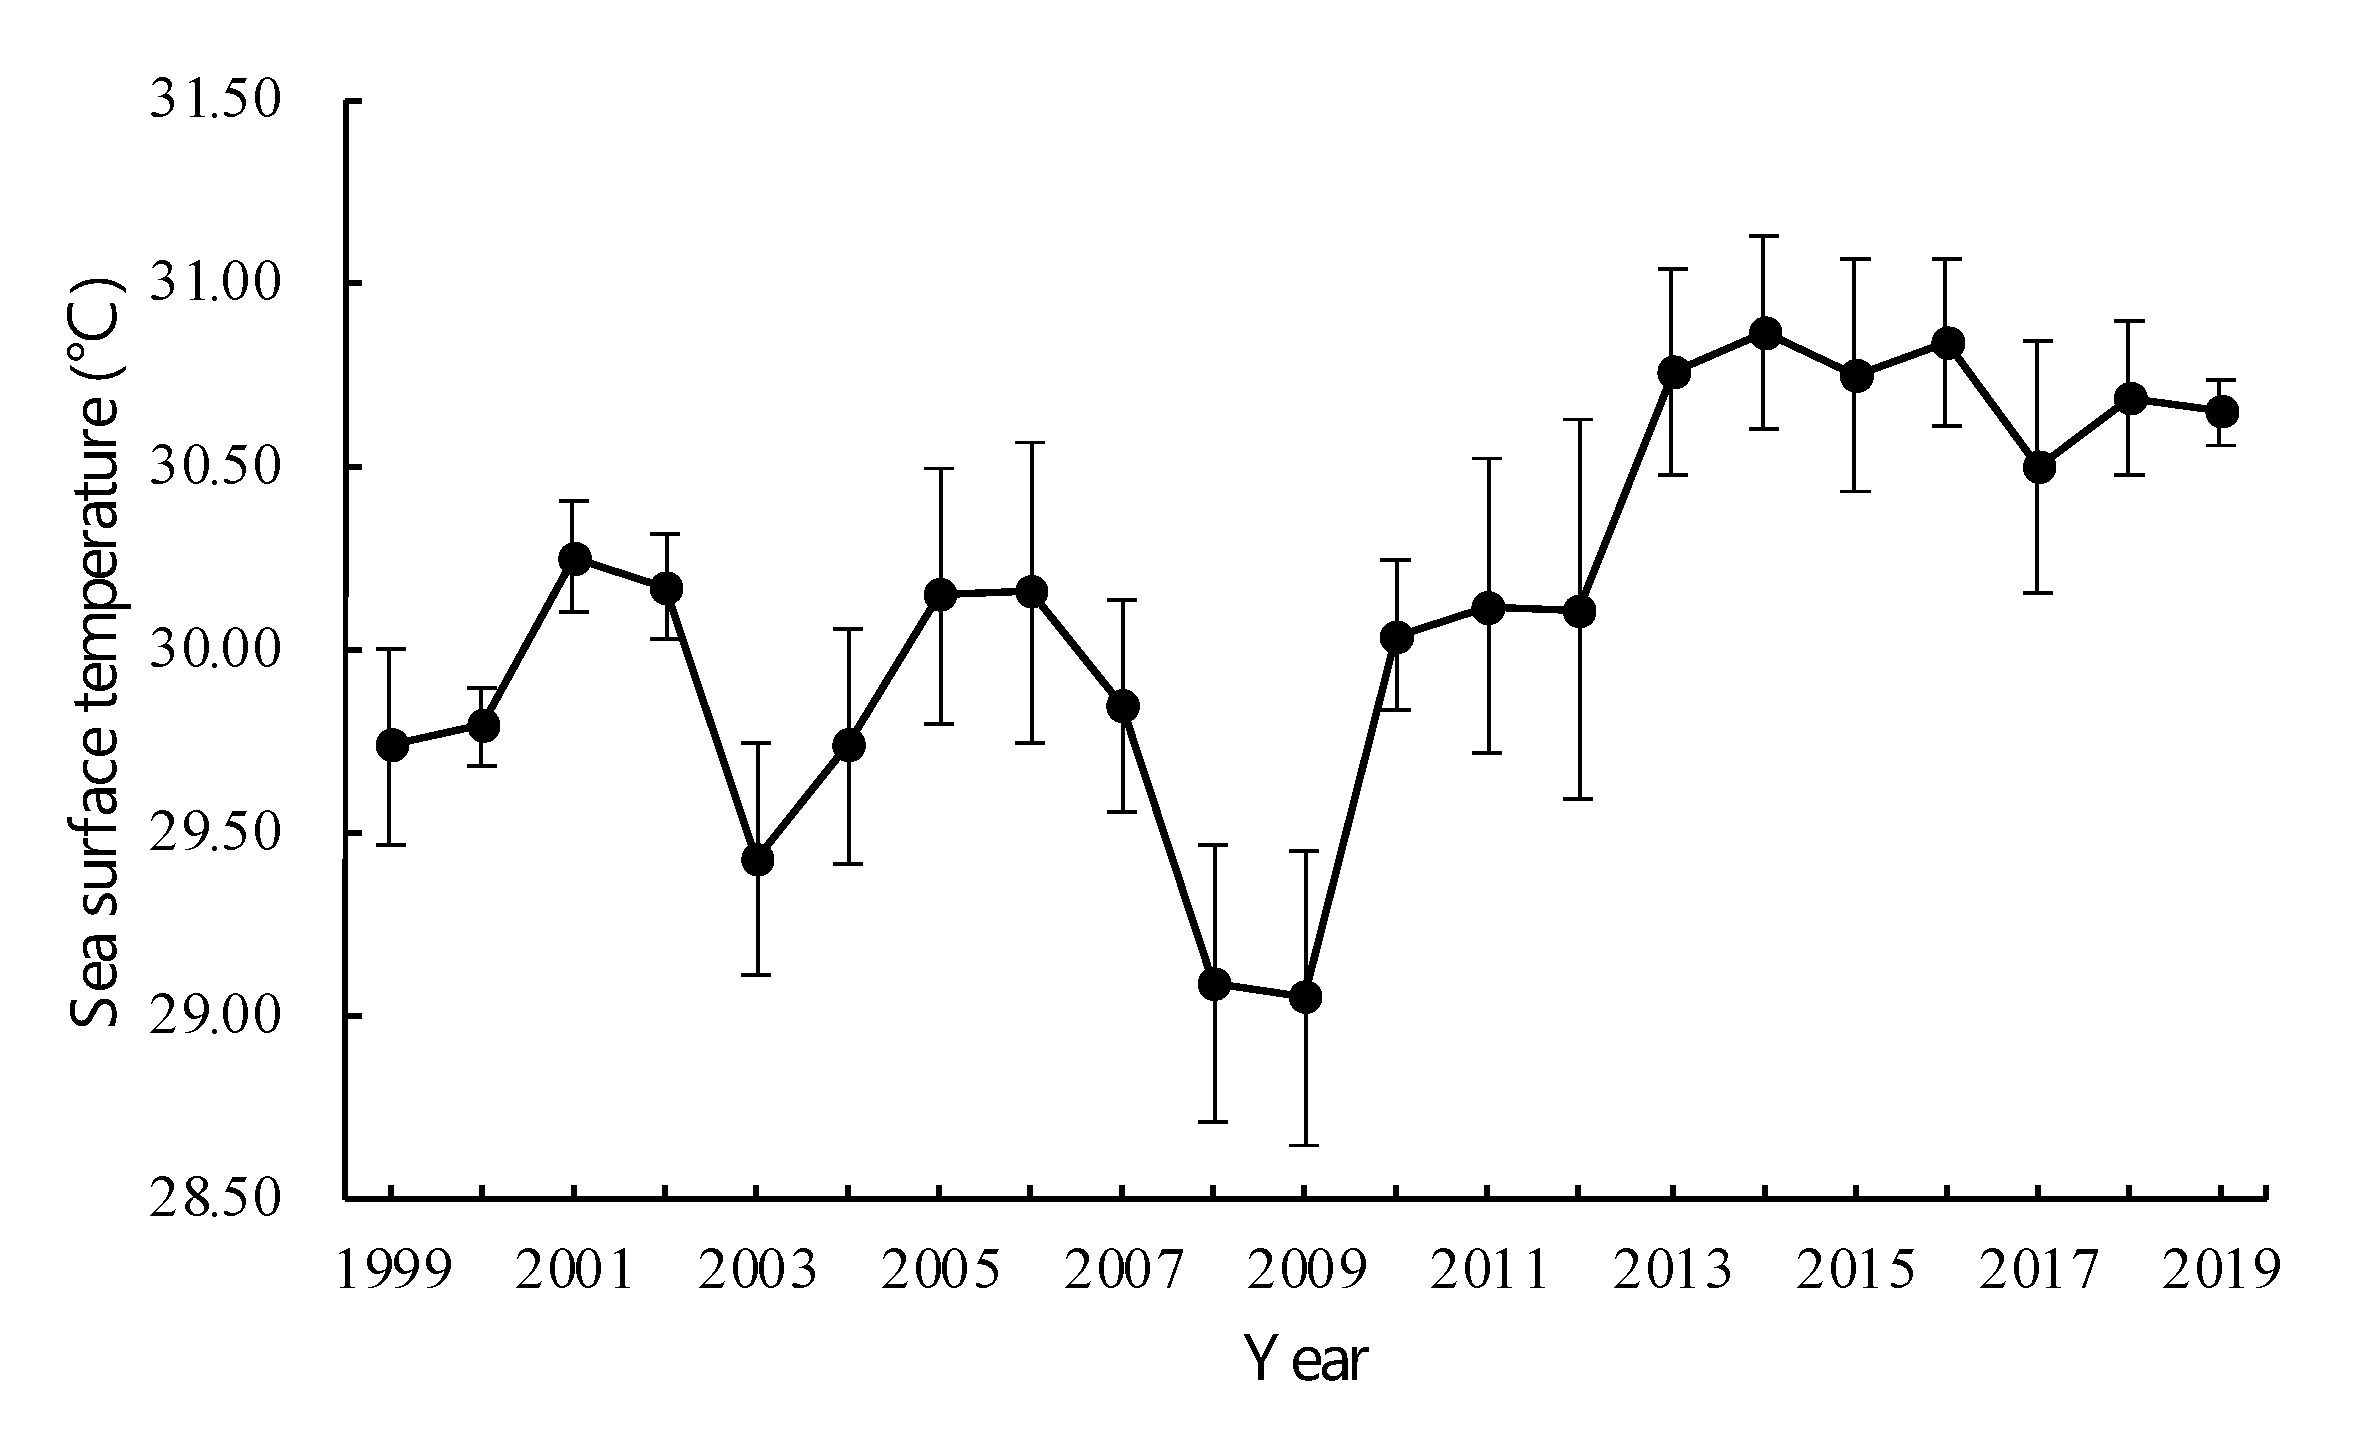
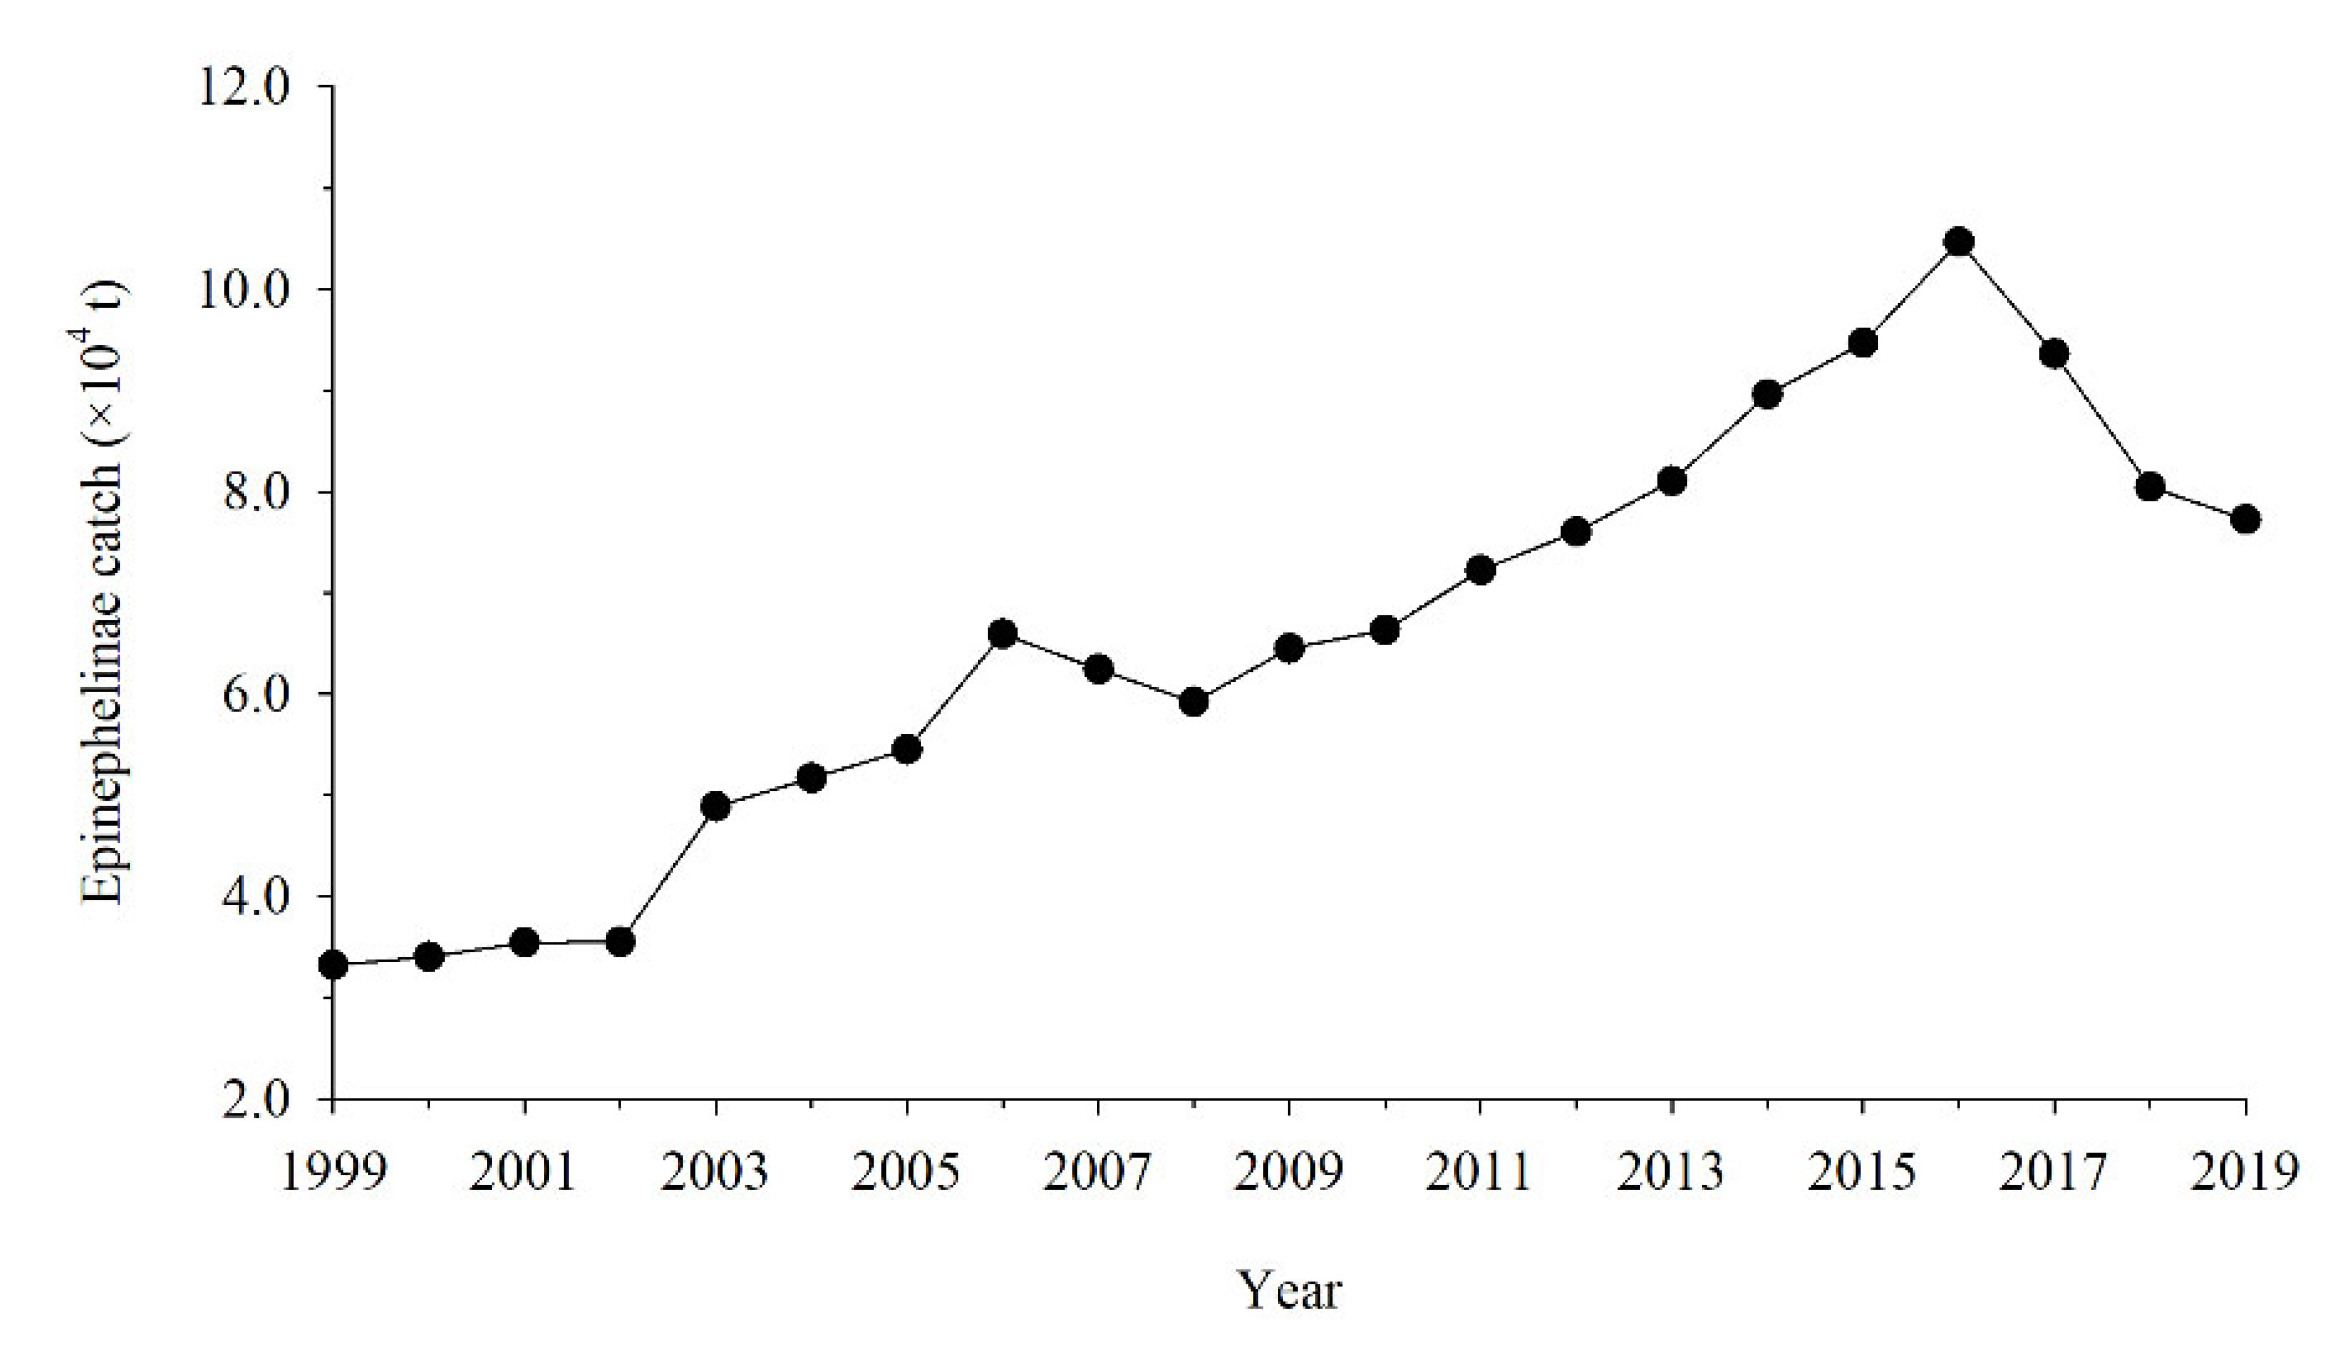
2.4. Effects of Coral Cover, SST, and Fishing on Fish Community
3. Results
3.1. Composition and Similarity of Community
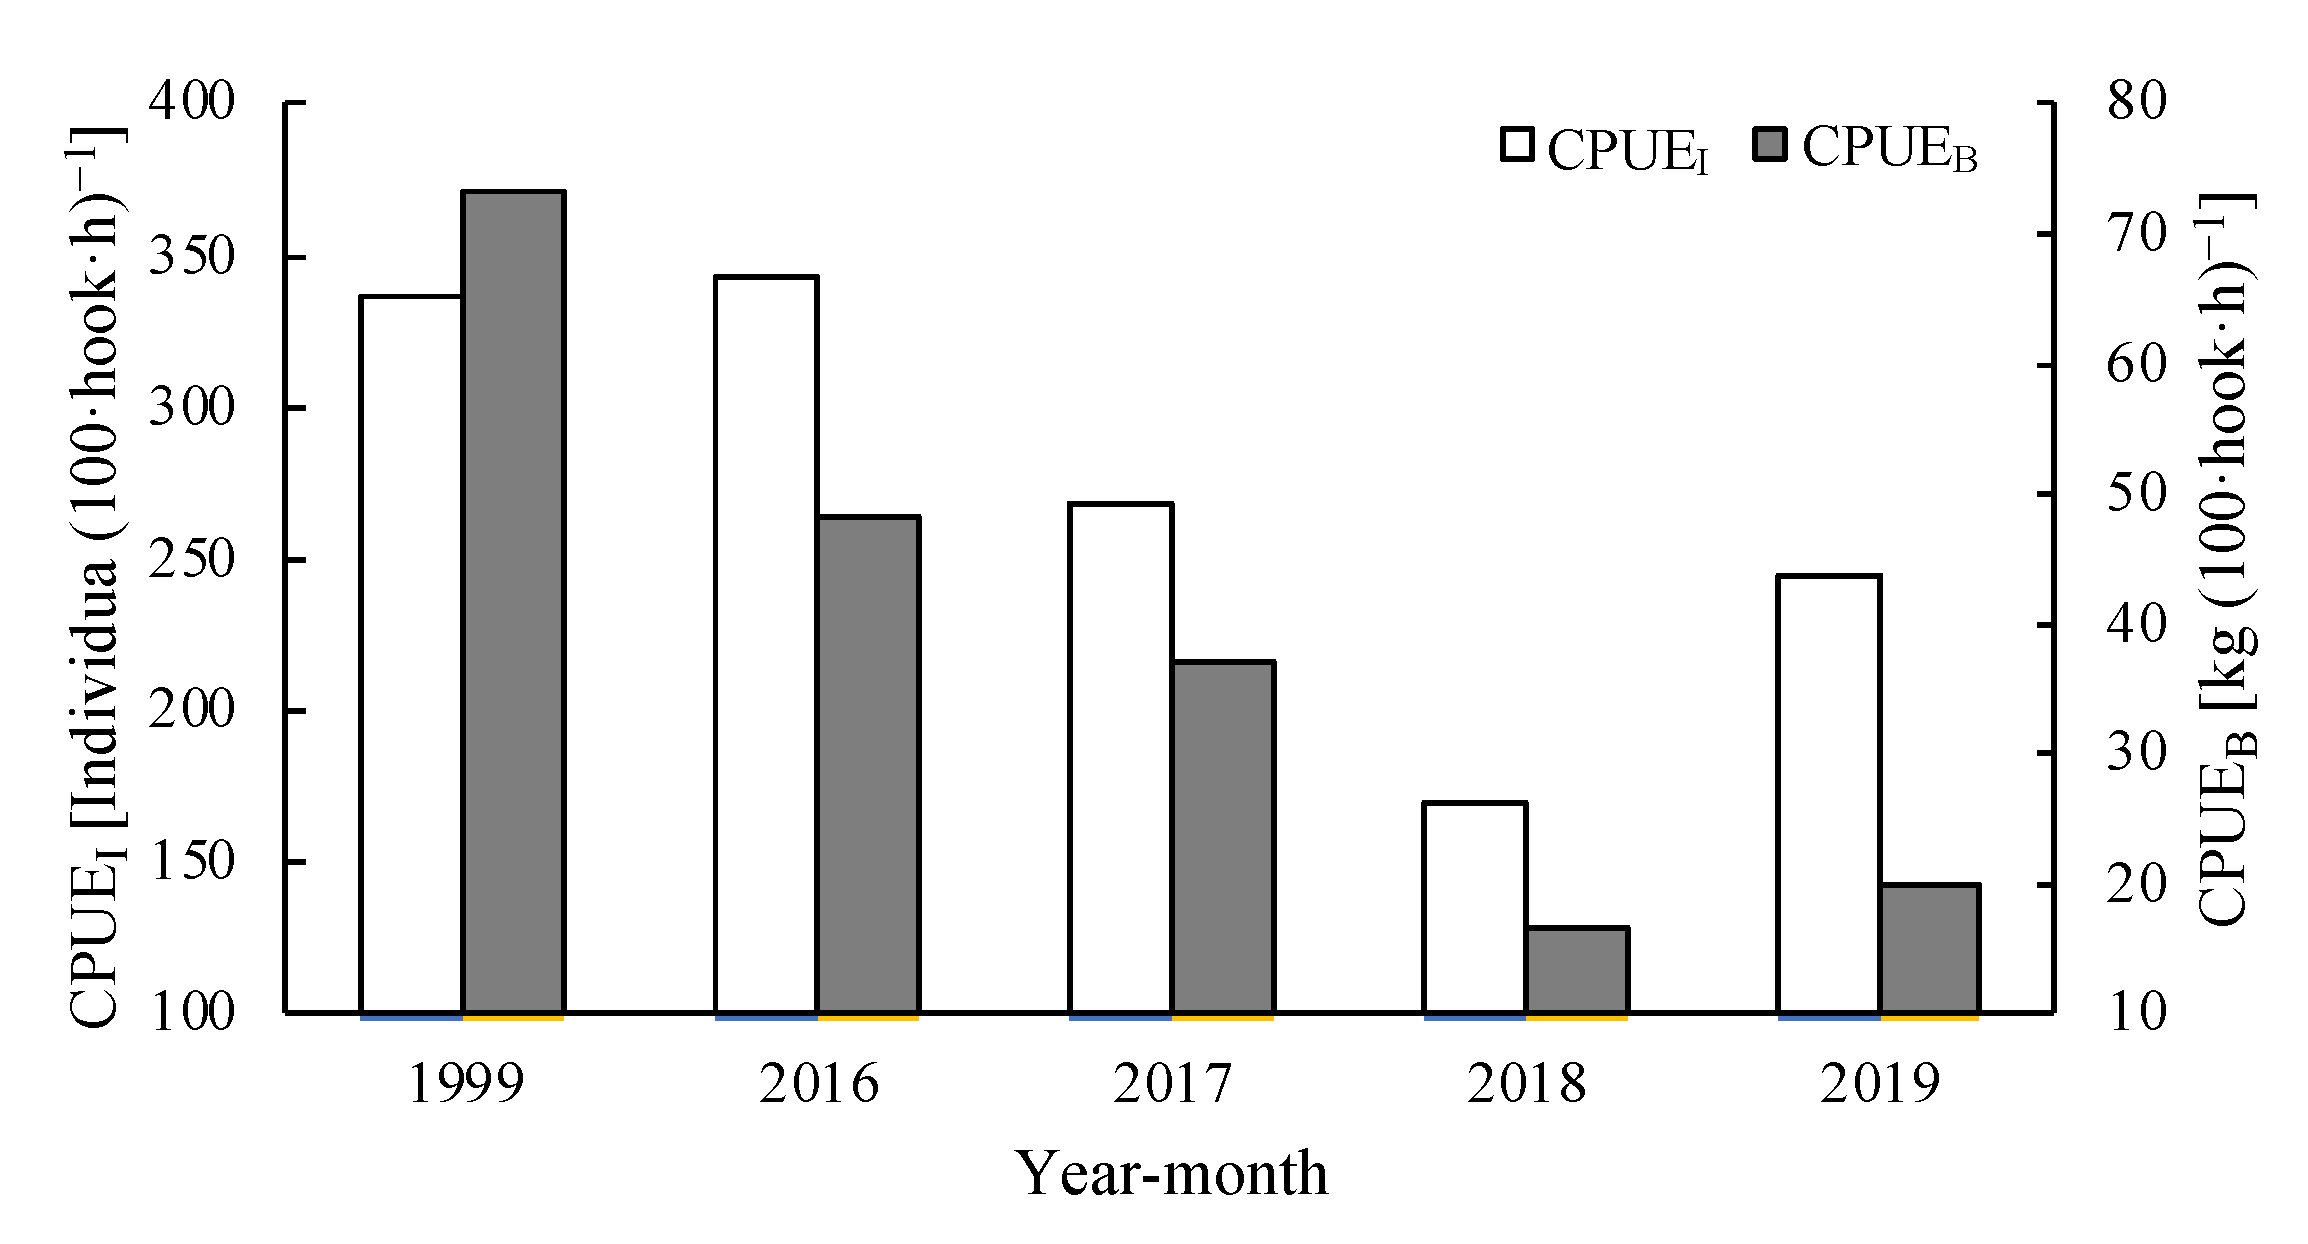
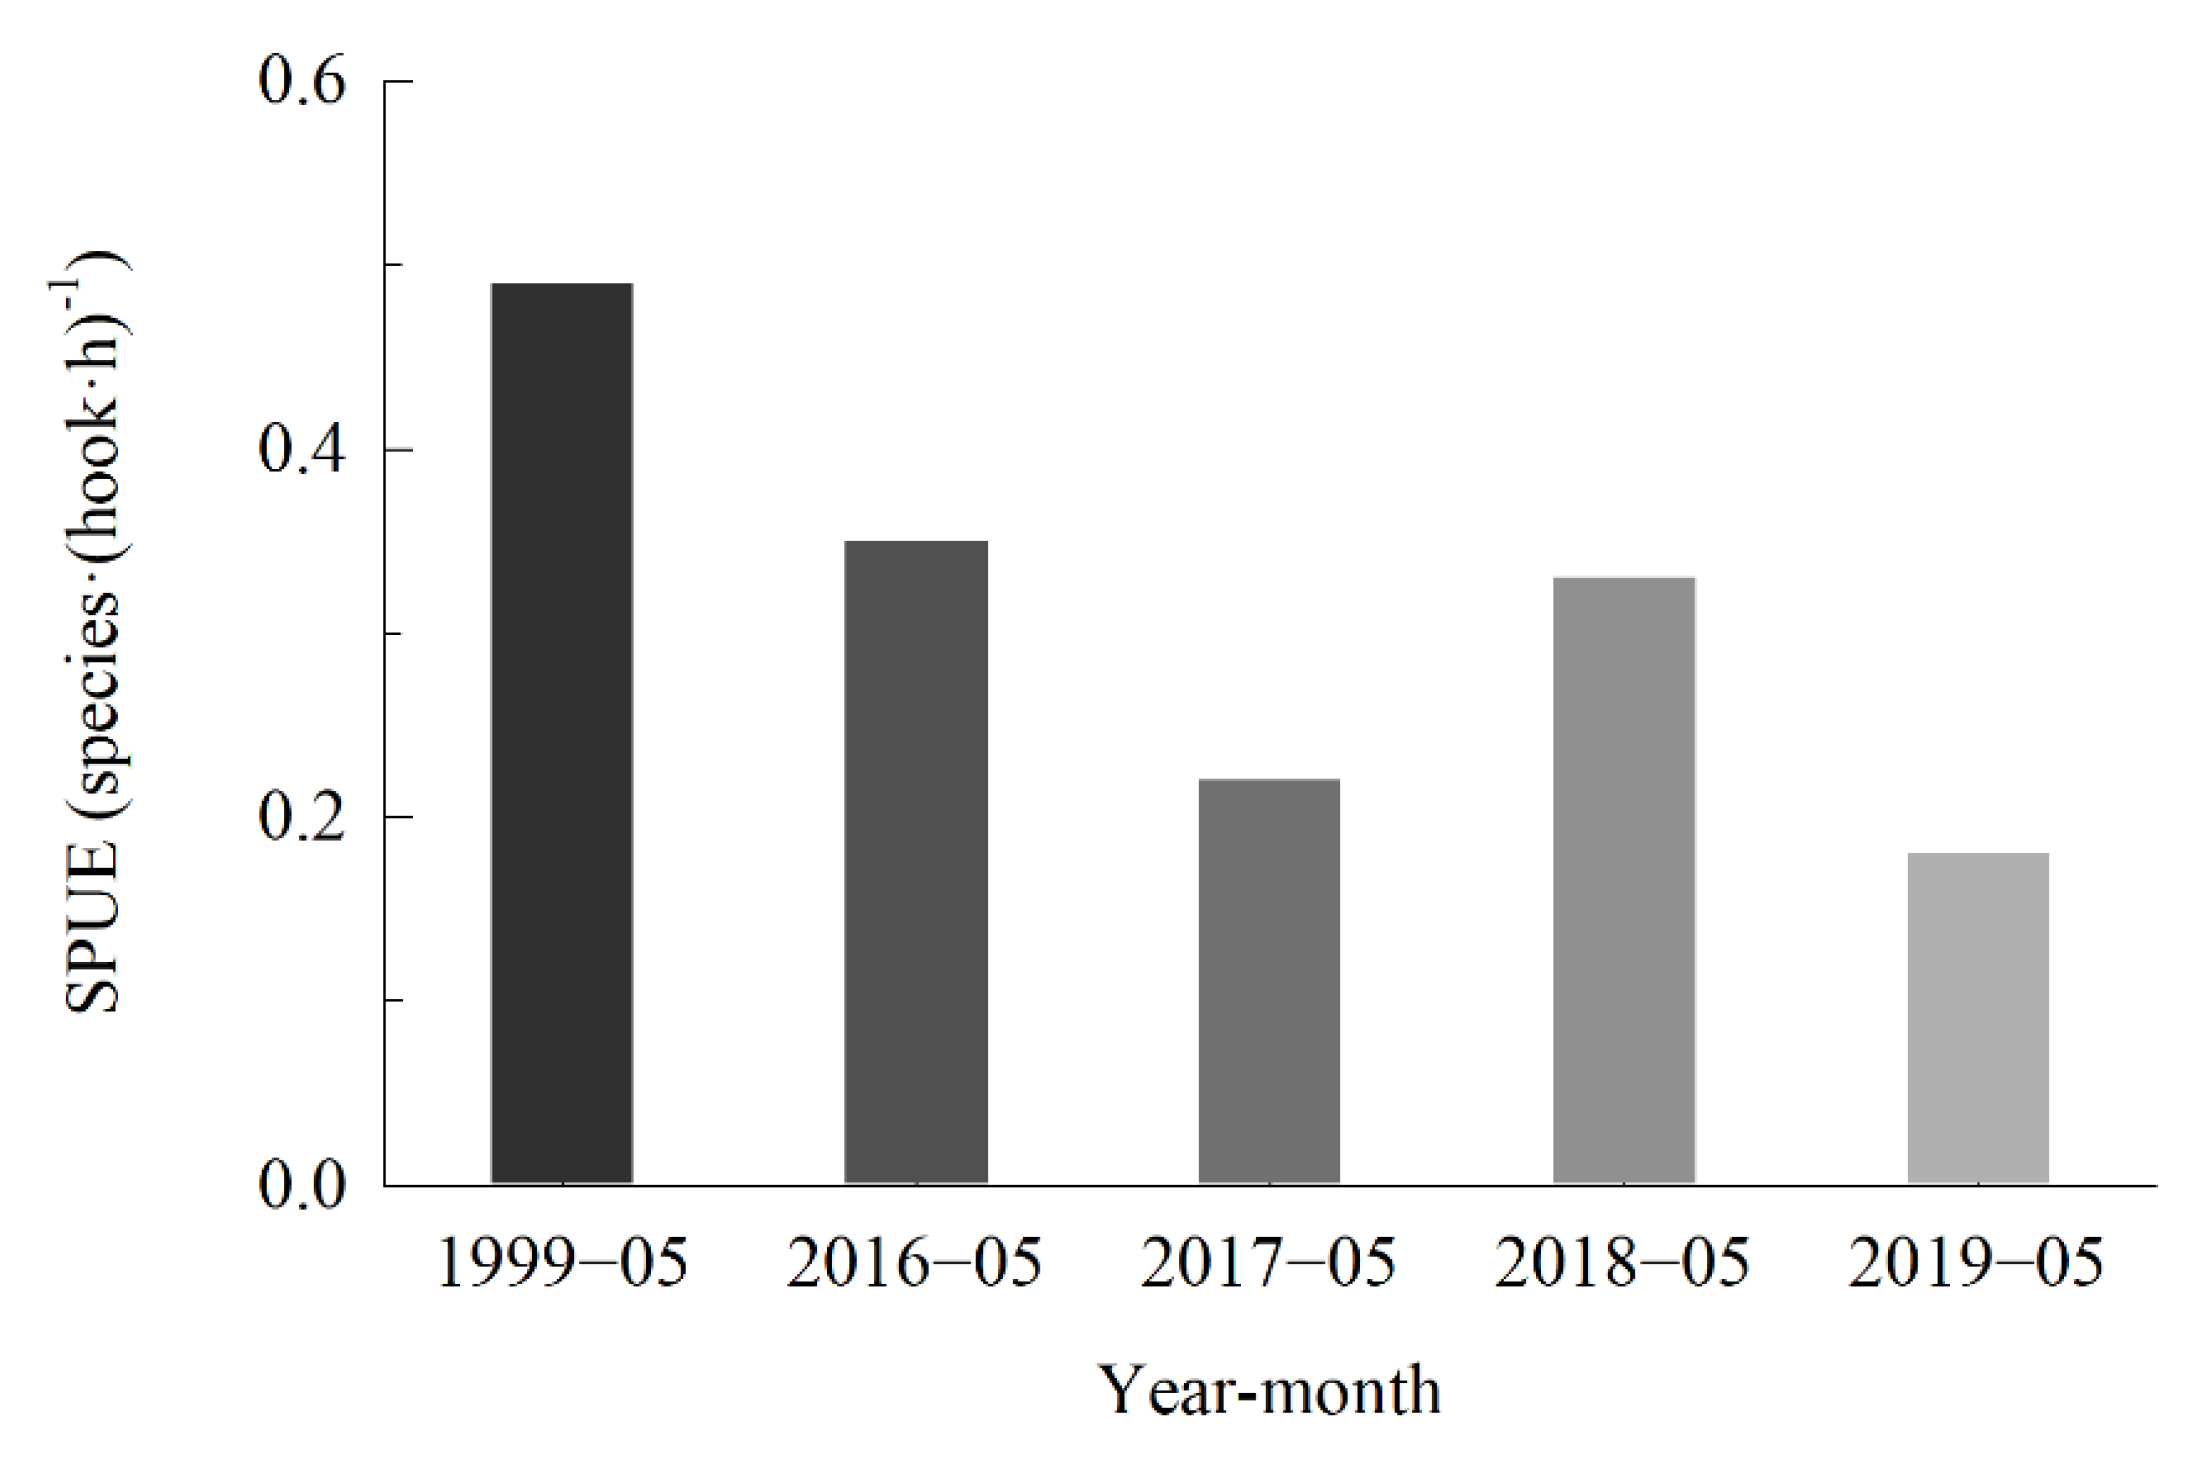
3.2. Catch per Unit Effort and Species per Unit Effort
3.3. Dominant Fish Species
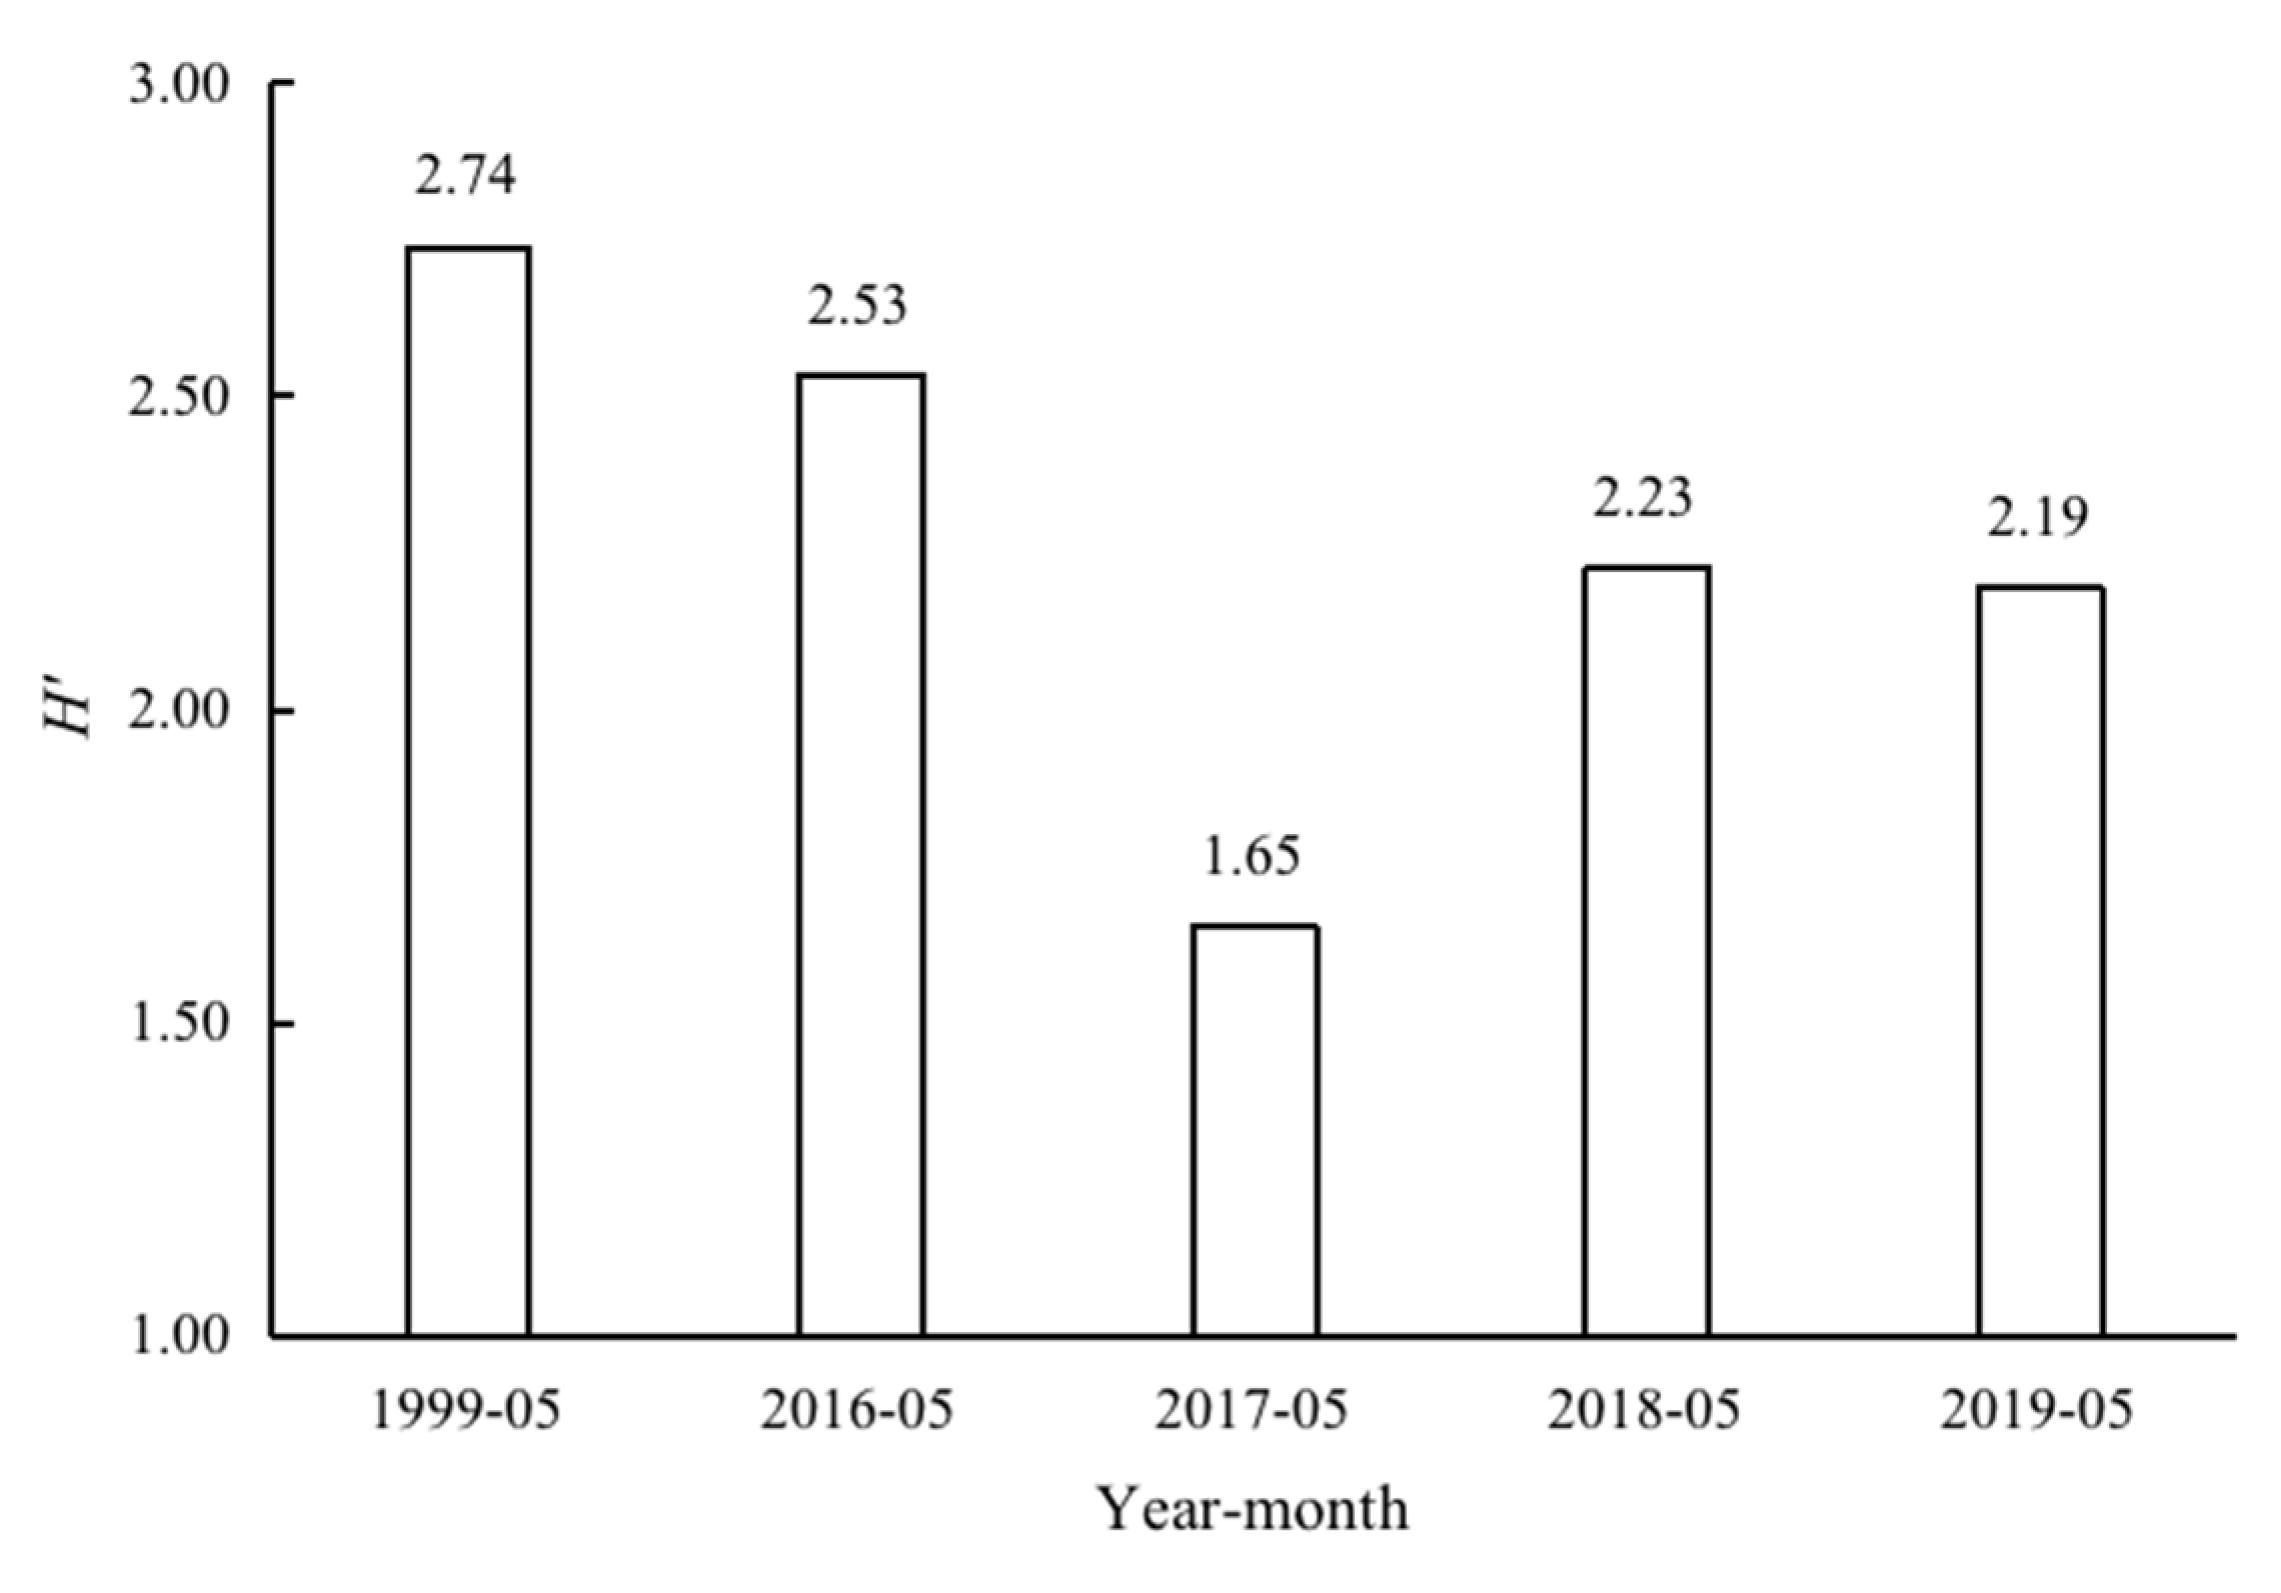
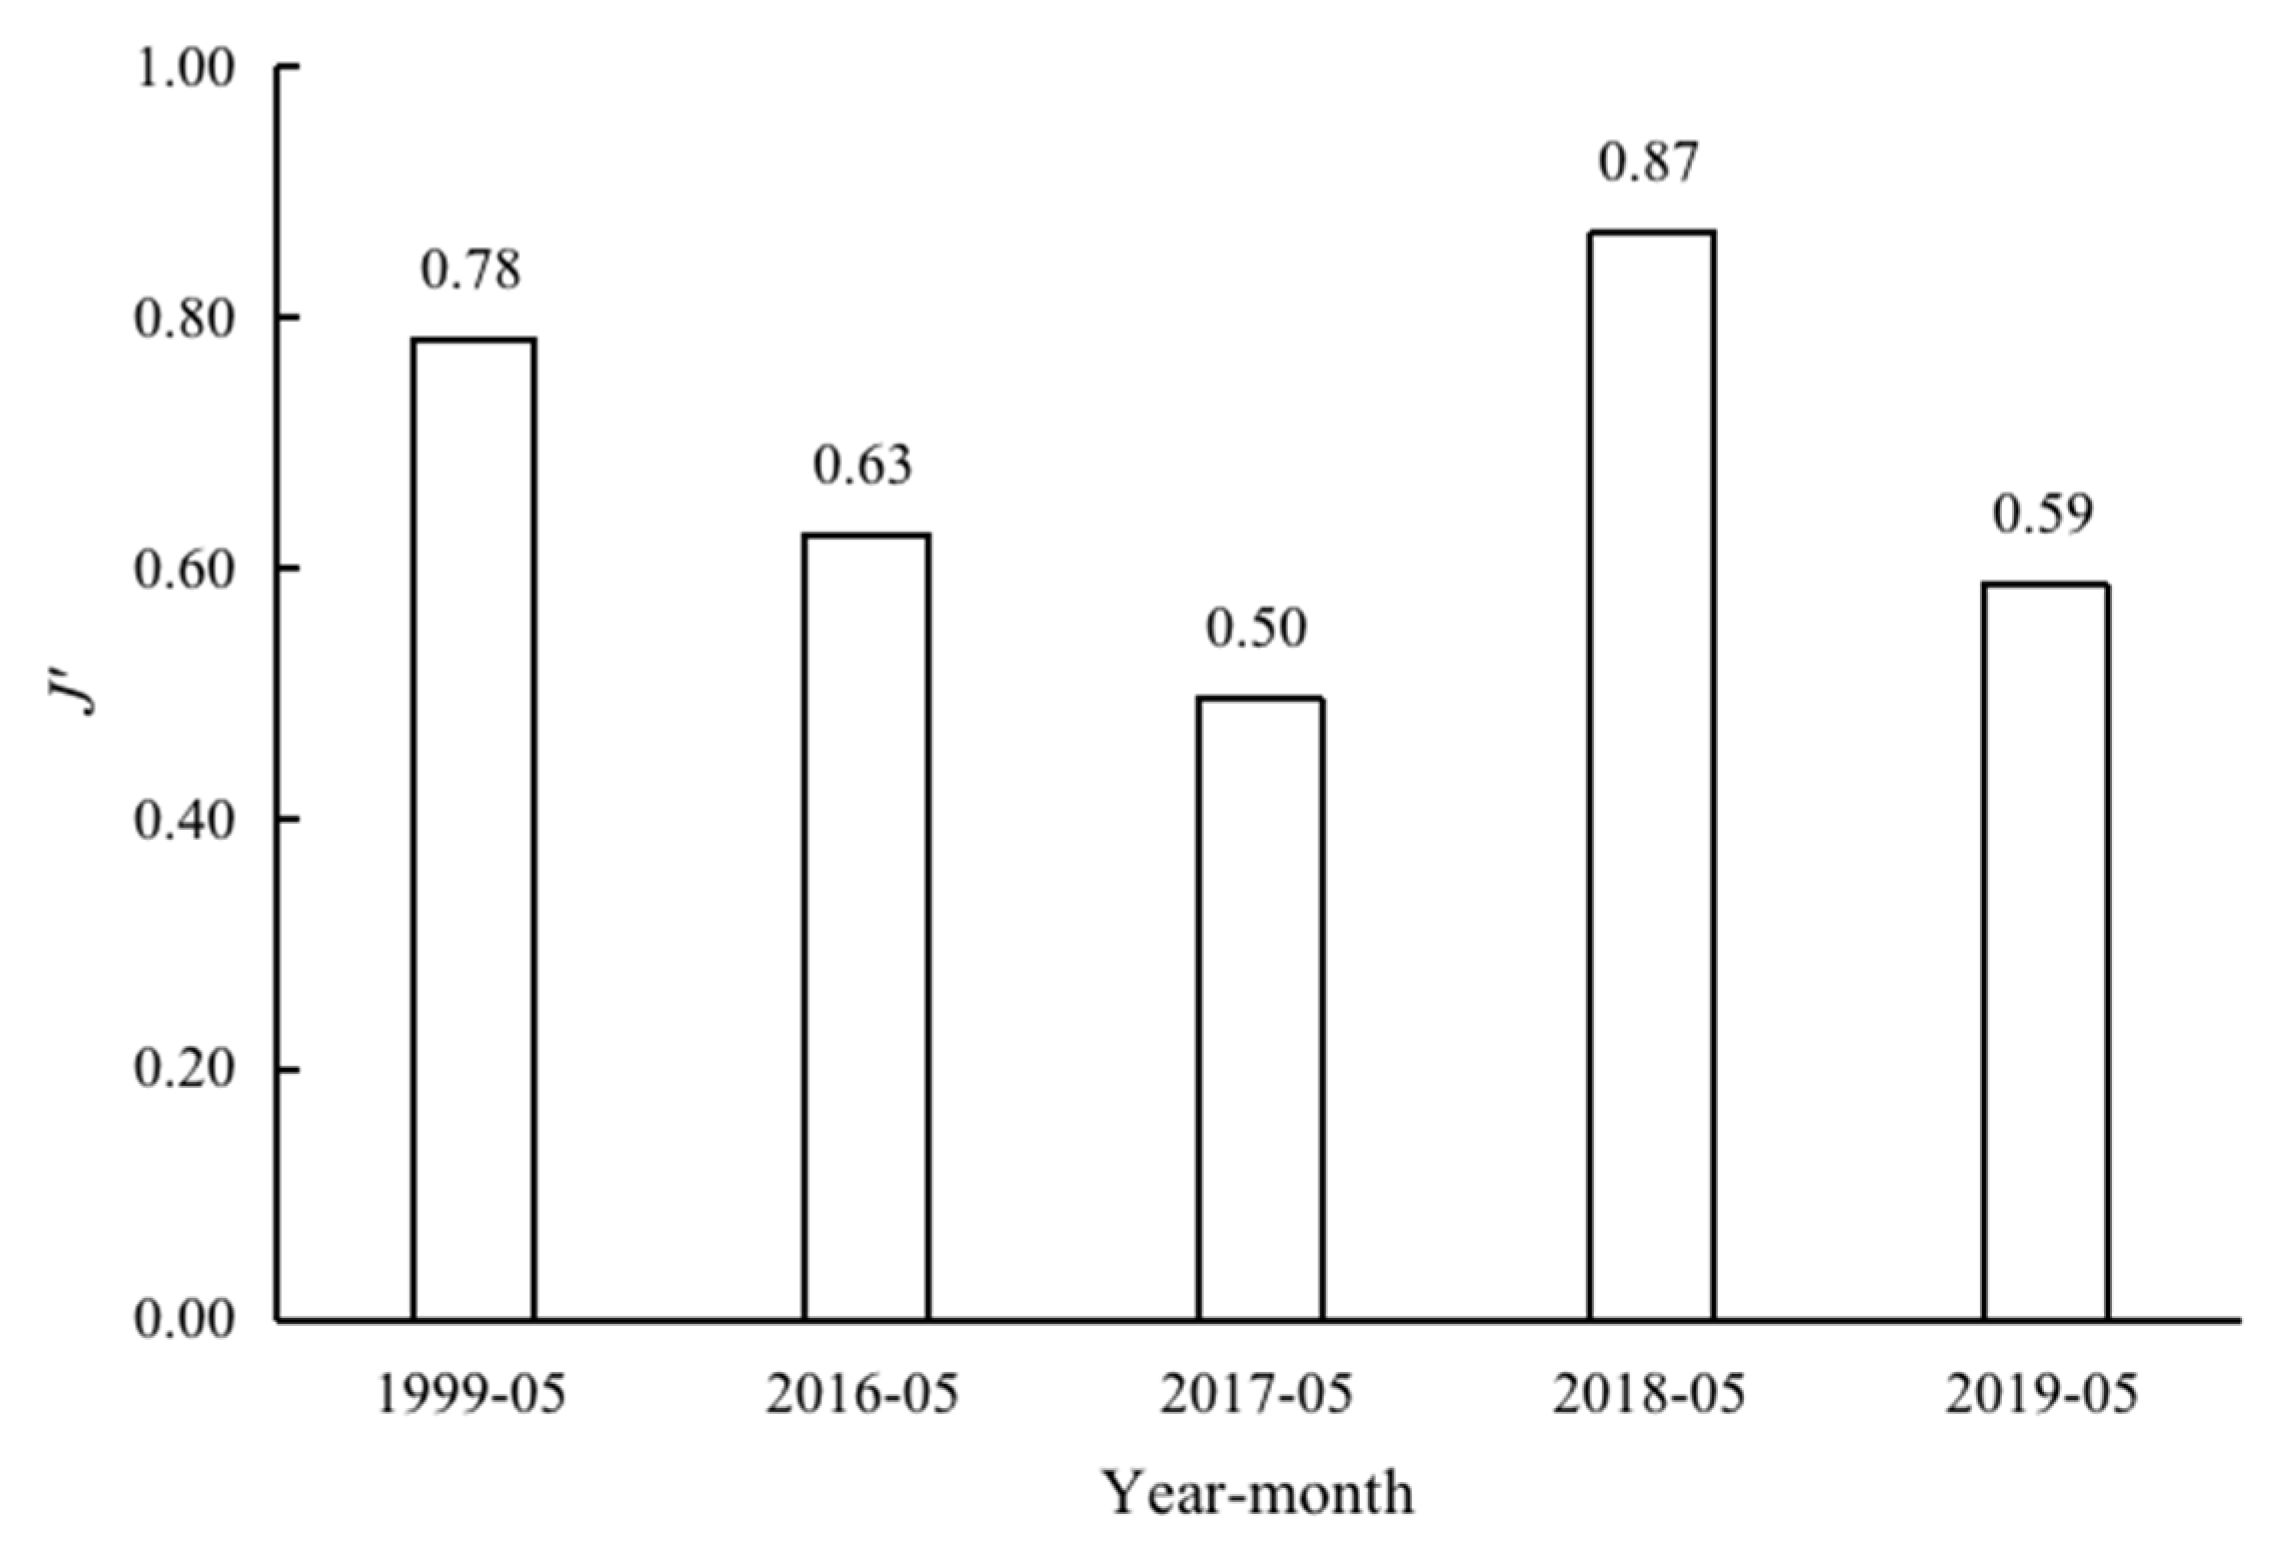
3.4. Species Diversity
3.5. Correlation between External Pressure and Fish Community Decline
4. Discussion
5. Conclusions
Author Contributions
Funding
Institutional Review Board Statement
Informed Consent Statement
Data Availability Statement
Acknowledgments
Conflicts of Interest
Appendix A

| Taxon | Year-Month | SUM | ||||
|---|---|---|---|---|---|---|
| 1999-05 | 2016-04 | 2017-05 | 2018-05 | 2019-05 | ||
| Holocentridae | ||||||
| Sargocentron rubrum | + | 1 | ||||
| Sargocentron diadema | + | + | + | 3 | ||
| Sargocentron caudimaculatum | + | + | 2 | |||
| Sargocentron ittodai | + | 1 | ||||
| Sargocentron microstoma | + | 1 | ||||
| Myripristis murdjan | + | + | + | + | 4 | |
| Myripristis botche | + | 1 | ||||
| Myripristis vittata | + | 1 | ||||
| Neoniphon sammara | + | 1 | ||||
| Acanthuridae | ||||||
| Naso brevirostris | + | 1 | ||||
| Naso lituratus | + | + | 2 | |||
| Naso vlamingii | + | 1 | ||||
| Acanthurus olivaceus | + | 1 | ||||
| Acanthurus mata | + | 1 | ||||
| Paracanthurus hepatus | + | 1 | ||||
| Priacanthidae | ||||||
| Priacanthus sagittarius | + | 1 | ||||
| Priacanthus blochii | + | 1 | ||||
| Priacanthus hamrur | + | 1 | ||||
| Heteropriacanthus cruentatus | + | 1 | ||||
| Lutjanidae | ||||||
| Aphareus furca | + | + | 2 | |||
| Aphareus rutilans | + | 1 | ||||
| Lutjanus bohar | + | + | + | 3 | ||
| Lutjanus sanguineus | + | 1 | ||||
| Lutjanus gibbus | + | + | 2 | |||
| Lutjanus kasmira | + | + | + | + | 4 | |
| Lutjanus argentimaculatus | + | 1 | ||||
| prion virescens | + | 1 | ||||
| Pristipomoides multidens | + | 1 | ||||
| Pristipomoides typus | + | 1 | ||||
| Pristipomoides auricilla | + | 1 | ||||
| Pristipomoides filamentosus | + | + | 2 | |||
| Paracaesio sordida | + | + | 2 | |||
| Paracaesio xanthura | + | 1 | ||||
| Macolor niger | + | 1 | ||||
| Sparidae | ||||||
| Acanthopagrus latus | + | 1 | ||||
| Haemulidae | ||||||
| Plectorhinchus flavomaculatus | + | 1 | ||||
| Chaetodontidae | ||||||
| Chaetodon melannotus | + | 1 | ||||
| Chaetodon wiebeli | + | 1 | ||||
| Chaetodon auriga | + | 1 | ||||
| Pinguipedidae | ||||||
| Parapercis muronis | + | 1 | ||||
| Parapercis decemfasciata | + | 1 | ||||
| Parapercis clathrata | + | + | 2 | |||
| Parapercis millepunctata | + | 1 | ||||
| Parapercis hexophtalma | + | 1 | ||||
| Nemipteridae | ||||||
| Parascolopsis inermis | + | 1 | ||||
| Pentapodus aureofasciatus | + | 1 | ||||
| Pentapodus caninus | + | + | 2 | |||
| Siganidae | ||||||
| Siganus canaliculatus | + | + | 2 | |||
| Siganus argenteus | + | + | 2 | |||
| Labridae | ||||||
| Cheilinus fasciatus | + | 1 | ||||
| Cheilinus oxycephalus | + | 1 | ||||
| Halichoeres hartzfeldii | + | + | + | 3 | ||
| Halichoeres trimaculatus | + | 1 | ||||
| Oxycheilinus unifasciatus | + | + | + | 3 | ||
| Oxycheilinus orientalis | + | + | 2 | |||
| Oxycheilinus digramma | + | 1 | ||||
| Hologymnosus annulatus | + | 1 | ||||
| Hologymnosus doliatus | + | 1 | ||||
| Iniistius pavo | + | 1 | ||||
| Lethrinidae | ||||||
| Gnathodentex aureolineatus | + | + | + | + | 4 | |
| Monotaxis grandoculis | + | + | + | 3 | ||
| Gymnocranius griseus | + | + | 2 | |||
| Lethrinus semicinctus | + | 1 | ||||
| Lethrinus harak | + | 1 | ||||
| Lethrinus rubrioperculatus | + | + | 2 | |||
| Lethrinus xanthochilus | + | 1 | ||||
| Lethrinus erythracanthus | + | 1 | ||||
| Lethrinus microdon | + | 1 | ||||
| Lethrinus variegatus | + | 1 | ||||
| Lethrinus miniatus | + | + | 2 | |||
| Serranidae | ||||||
| Variola albimarginata | + | 1 | ||||
| Variola louti | + | + | + | 3 | ||
| Cephalopholis leopardus | + | 1 | ||||
| Cephalopholis spiloparaea | + | + | 2 | |||
| Cephalopholis boenak | + | 1 | ||||
| Cephalopholis sonnerati | + | 1 | ||||
| Cephalopholis urodeta | + | + | + | + | + | 5 |
| Plectropomus oligacanthus | + | 1 | ||||
| Epinephelus quoyanus | + | 1 | ||||
| Epinephelus merra | + | 1 | ||||
| Epinephelus fasciatus | + | + | + | 3 | ||
| Epinephelus sexfasciatus | + | 1 | ||||
| Epinephelus chlorostigma | + | 1 | ||||
| Epinephelus miliaris | + | 1 | ||||
| Scombridae | ||||||
| Euthynnus alletteratus | + | 1 | ||||
| Gymnosarda unicolor | + | 1 | ||||
| Pomacentridae | ||||||
| Neoglyphidodon melas | + | 1 | ||||
| Amphiprion clarkii | + | 1 | ||||
| Malacanthidae | ||||||
| Malacanthus brevirostris | + | + | 2 | |||
| Carangidae | ||||||
| Elagatis bipinnulata | + | 1 | ||||
| Carangoides orthogrammus | + | 1 | ||||
| Apogonidae | ||||||
| Nectamia fusca | + | 1 | ||||
| Pristiapogon fraenatus | + | 1 | ||||
| Pristiapogon kallopterus | + | + | 2 | |||
| Mullidae | ||||||
| Parupeneus multifasciatus | + | 1 | ||||
| Parupeneus pleurostigma | + | + | 2 | |||
| Parupeneus trifasciatus | + | + | + | 3 | ||
| Mulloidichthys vanicolensis | + | 1 | ||||
| Scaridae | ||||||
| Scarus forsteni | + | 1 | ||||
| Scarus ghobban | + | 1 | ||||
| Sphyraenidae | ||||||
| Sphyraena forsteri | + | 1 | ||||
| Balistidae | ||||||
| Sufflamen chrysopterum | + | + | 2 | |||
| Sufflamen fraenatum | + | + | + | 3 | ||
| Pseudobalistes flavimarginatus | + | 1 | ||||
| Balistapus undulatus | + | + | + | + | + | 5 |
| Odonus niger | + | + | + | 3 | ||
| Melichthys vidua | + | + | + | + | + | 5 |
| Melichthys niger | + | 1 | ||||
| Balistoides conspicillum | + | + | 2 | |||
| Balistoides viridescens | + | 1 | ||||
| Synodontidae | ||||||
| Synodus ulae | + | 1 | ||||
| Synodus variegatus | + | 1 | ||||
| SUM | 33 | 57 | 28 | 13 | 42 | |
References
- Fisher, R.; O’Leary, R.; Low-Choy, S.; Mengersen, K.; Knowlton, N.; Brainard, R.; Caley, M. Species richness on coral reefs and the pursuit of convergent global estimates. Curr. Biol. 2015, 25, 500–505. [Google Scholar] [CrossRef]
- Burke, L.M.; Reytar, K.; Spalding, M.; Perry, A.L. Reefs at Risk Revisited; World Resources Institute: Washington, DC, USA, 2011; pp. 1–10. [Google Scholar]
- Roberts, C.M. Effects of fishing on the ecosystem structure of coral-reefs. Conserv. Biol. 1995, 9, 988–995. [Google Scholar] [CrossRef]
- Bozec, Y.-M.; O’Farrell, S.; Bruggemann, J.H.; Luckhurst, B.E.; Mumby, P.J. Tradeoffs between fisheries harvest and the resilience of coral reefs. Proc. Natl. Acad. Sci. USA 2016, 113, 4536–4541. [Google Scholar] [CrossRef]
- Fenner, D. Challenges for managing fisheries on diverse coral reefs. Diversity 2012, 4, 105–160. [Google Scholar] [CrossRef]
- Cramer, K.L.; O’Dea, A.; Clark, T.R.; Zhao, J.-x.; Norris, R.D. Prehistorical and historical declines in Caribbean coral reef accretion rates driven by loss of parrotfish. Nat. Commun. 2017, 8, 1–8. [Google Scholar] [CrossRef]
- Magris, R.A.; Grech, A.; Pressey, R.L. Cumulative human impacts on coral reefs: Assessing risk and management implications for Brazilian coral reefs. Diversity 2018, 10, 26–40. [Google Scholar] [CrossRef]
- McClenachan, L. Documenting Loss of Large Trophy Fish from the Florida Keys with Historical Photographs. Conserv. Biol. 2009, 23, 636–643. [Google Scholar] [CrossRef]
- Munday, P.L.; Jones, G.P.; Pratchett, M.S.; Williams, A.J. Climate change and the future for coral reef fishes. Fish Fish. 2008, 9, 261–285. [Google Scholar] [CrossRef]
- Rassweiler, A.; Lauer, M.; Lester, S.E.; Holbrook, S.J.; Schmitt, R.J.; Madi Moussa, R.; Munsterman, K.S.; Lenihan, H.S.; Brooks, A.J.; Wencelius, J.; et al. Perceptions and responses of Pacific Island fishers to changing coral reefs. Ambio 2020, 49, 130–143. [Google Scholar] [CrossRef]
- Graham, N.A.J.; McClanahan, T.R.; MacNeil, M.A.; Wilson, S.K.; Cinner, J.E.; Huchery, C.; Holmes, T.H. Human disruption of coral reef trophic structure. Curr. Biol. 2017, 27, 231–236. [Google Scholar] [CrossRef] [Green Version]
- Robinson, J.P.W.; Wilson, S.K.; Robinson, J.; Gerry, C.; Lucas, J.; Assan, C.; Govinden, R.; Jennings, S.; Graham, N.A.J. Productive instability of coral reef fisheries after climate-driven regime shifts (vol 3, pg 183, 2018). Nat. Ecol. Evol. 2019, 3, 502. [Google Scholar] [CrossRef] [PubMed]
- Chen, G.; Li, Y.; Chen, X. Species diversity of fishes in the coral reefs of South China Sea. Biodivers. Sci. 2007, 4, 373–381. [Google Scholar]
- Li, Y.; Shi, Y.; Ai, H.; Dong, L.N.; Li, N.; Li, X.; Gao, T. Large scale distribution patterns of taxonomic diversity of fish in coral reef waters, South China Sea. J. Fish. Sci. China 2011, 18, 619–628. [Google Scholar] [CrossRef]
- Zhang, J.; Chen, Z.; Chen, G. A preliminary study on biology of Glowfish (Gnathodentex aureolineatus) in Yongshu Reef of Nansha area in the South China Sea. South China Fish. Sci. 2015, 11, 108–116. [Google Scholar]
- Zhang, J.; Zhang, K.; Chen, Z.; Dong, J.; Qiu, Y. Hydroacoustic studies on Katsuwonus pelamis and juvenile Thunnus albacares associated with light fish-aggregating devices in the South China Sea. Fish. Res. 2021, 233–247, 105765. [Google Scholar] [CrossRef]
- Hoeksema, B.W. Delineation of the Indo-Malayan centre of maximum marine biodiversity: The Coral Triangle. In Biogeography, Time and Place: Distributions, Barriers and Islands; Renema, W., Ed.; Springer: Dordrecht, The Netherlands, 2007; pp. 117–178. [Google Scholar]
- Hughes, T.P.; Huang, H.; Young, M.A.L. The wicked problem of China’s disappearing coral reefs. Conserv. Biol. 2013, 27, 261–269. [Google Scholar] [CrossRef]
- Zhang, J.; Chen, Z.; Dong, J.; Zhang, K.; Lin, Z.; Sun, D. Variation in the population characteristics of Blue-striped Snapper Lutjanus kasmira in the South China Sea in recent 20 years. Oceanol. Et Limnol. Sin. 2020, 51, 114–124. [Google Scholar]
- Arai, T. Diversity and conservation of coral reef fishes in the Malaysian South China Sea. Rev. Fish. Biol. Fish. 2015, 25, 85–101. [Google Scholar] [CrossRef]
- Zhao, H.; Wang, L.; Yuan, J. Sustainable development of the coral reefs in the South China Sea Islands. Trop. Geogr. 2016, 36, 55–65. [Google Scholar]
- Hughes, T.P.; Kerry, J.T.; Alvarez-Noriega, M.; Alvarez-Romero, J.G.; Anderson, K.D.; Baird, A.H.; Babcock, R.C.; Beger, M.; Bellwood, D.R.; Berkelmans, R.; et al. Global warming and recurrent mass bleaching of corals. Nature 2017, 543, 373–377. [Google Scholar] [CrossRef]
- Li, Y.; Wu, Z.; Chen, S.; Cai, Z.; Lan, J.; Tong, Y.; Yao, H. Discussion of the diversity of the coral reef fish in the shallow reefs along the Yongxing and Qilianyu island. Mar. Environ. Sci. 2017, 36, 509–516. [Google Scholar]
- Yang, W.; Hu, J.; Lin, B.; Huang, H.; Liu, M. Species diversity of coral reef fishes in Zhaoshu Island waters, Xisha Islands. J. Xianmen Univ. (Nat. Sci.) 2018, 57, 819–826. [Google Scholar]
- Zhang, J.; Chen, Z.; Cai, Y.; Li, Y.; Lin, Z. Long-term variation in dominant species and biodiversity of fish in the lagoon of Meiji Reef in the South China Sea based on hand fishing and gill net. J. Fish. Sci. China 2021, 28, 1466–1476. [Google Scholar]
- Li, Y.; Jia, X.; Chen, G.; Chen, P.; Shu, L.; Zeng, X. The South China Sea Coral Reef Fish Resources; China Ocean Press: Beijing, China, 2007. [Google Scholar]
- Tang, Q.; Zhang, J.; Feng, Y.; Li, J.; Yao, Y.; Sun, J.; Zhan, W. Numerical simulation for shallow strata stability of coral reef in the southwest of Yongshu Reef (South China Sea). J. Ocean. Univ. China 2018, 17, 763–772. [Google Scholar] [CrossRef]
- Zhu, C.-Q.; Qin, Y.; Meng, Q.-S.; Wang, X.-Z.; Wang, R. Formation and sedimentary evolution characteristics of Yongshu Atoll in the South China Sea Islands. Ocean. Eng. 2014, 84, 61–66. [Google Scholar] [CrossRef]
- Chen, D.; Zhang, M. Marine Fishes of China; China Ocean University Press: Qingdao, China, 2015; Volume 1, pp. 1–743. [Google Scholar]
- Chen, Q. Fishes from Nansha Islands to South China Coastal Waters 1; Science Press: Beijing, China, 1997; pp. 1–202. [Google Scholar]
- Sun, D.; Chen, Z. Fish Retrieval in South China Sea; China Ocean Press: Beijing, China, 2013; Volume 1, pp. 1–619. [Google Scholar]
- Lieske, E.; Myers, R. Coral Reef fishes Indopacific and Caribbean: Collins Pocket Guide; Princeton University: Princeton, NJ, USA, 1994; pp. 1–110. [Google Scholar]
- Simpson, E.H. Measurement of diversity. Nature 1949, 163, 688. [Google Scholar] [CrossRef]
- Pinkas, L.; Oliphant, M.S.; Iverson, I.L.K. Food Habits of Albacore, Bluefin Tuna, and Bonito in Californian Waters; Fish Bulletin: Long Beach, CA, USA, 1971; pp. 1–105. [Google Scholar]
- Shannon, C.E.; Weaver, W.; Blahut, R.E.; Hajek, B. The mathematical theory of communications. Philos. Rev. 1951, 60, 398–400. [Google Scholar]
- Pielou, E.C. An introduction to mathematical ecology. Bioscience 2011, 24, 7–12. [Google Scholar]
- Zhao, M.; Yu, K.; Shi, Q.; Chen, T.; Zhang, H.; Chen, T. Coral communities of the remote atoll reefs in the Nansha Islands, southern South China Sea. Environ. Monit. Assess. 2013, 185, 7381–7392. [Google Scholar] [CrossRef] [Green Version]
- Huang, H. State of China’s Coral Reefs Report (2010–2019); Ocean Press: Beijing, China, 2021; Volume 4, pp. 1–126. (In Chinese) [Google Scholar]
- Bonin, M.C.; Bostroem-Einarsson, L.; Munday, P.L.; Jones, G.P. The prevalence and importance of competition among coral reef fishes. Annu. Rev. Ecol. Evol. Syst. 2015, 46, 169–190. [Google Scholar] [CrossRef]
- Nash, K.L.; Graham, N.A.J.; Jennings, S.; Wilson, S.K.; Bellwood, D.R. Herbivore cross-scale redundancy supports response diversity and promotes coral reef resilience. J. Appl. Ecol. 2016, 53, 646–655. [Google Scholar] [CrossRef]
- Darling, E.S.; D’agata, S. Coral reefs: Fishing for sustainability. Curr. Biol. 2017, 27, R65–R68. [Google Scholar] [CrossRef] [PubMed]
- Bijoux, J.P.; Dagorn, L.; Gaertner, J.-C.; Cowley, P.D.; Robinson, J. The influence of natural cycles on coral reef fish movement: Implications for underwater visual census (UVC) surveys. Coral Reefs 2013, 32, 1135–1140. [Google Scholar] [CrossRef]
- Rummer, J.L.; Munday, P.L. Climate change and the evolution of reef fishes: Past and future. Fish Fish. 2017, 18, 22–39. [Google Scholar] [CrossRef]
- Alvarez-Filip, L.; Dulvy, N.K.; Gill, J.A.; Cote, I.M.; Watkinson, A.R. Flattening of Caribbean coral reefs: Region-wide declines in architectural complexity. Proc. R. Soc. B-Biol. Sci. 2009, 276, 3019–3025. [Google Scholar] [CrossRef]
- Fukunaga, A.; Kosaki, R.K.; Pascoe, K.H.; Burns, J.H.R. Fish assemblage structure in the northwestern Hawaiian Islands is associated with the architectural complexity of coral-reef habitats. Diversity 2020, 12, 430–448. [Google Scholar] [CrossRef]
- Graham, N.A.J.; Wilson, S.K.; Jennings, S.; Polunin, N.V.C.; Bijoux, J.P.; Robinson, J. Dynamic fragility of oceanic coral reef ecosystems. Proc. Natl. Acad. Sci. USA 2006, 103, 8425–8429. [Google Scholar] [CrossRef]
- Moh’d, M.N. The Use of Butterflyfishes (Chaetodontidae) as Bioindicators of Coral Reef Degradation Along the Coast of Tanzania; University of Dar es Salaam: Dar es Salaam, Tanzania, 2003; pp. 16–49. [Google Scholar]
- Jia, D.; Chen, Z.; Zhang, W.; Yu, K.; Wang, J.; Ma, X.; Xu, H. Analysis of temporal and spatial characteristics of sea surface temperature variabilities over the past 34 years in coral reef areas of the South China Sea. Acta Oceanol. Sin. 2018, 40, 112–120. [Google Scholar]
- Allgeier, J.E.; Valdivia, A.; Cox, C.; Layman, C.A. Fishing down nutrients on coral reefs. Nat. Commun. 2016, 7, 61–66. [Google Scholar] [CrossRef]
- Robinson, J.P.W.; Williams, I.D.; Edwards, A.M.; McPherson, J.; Yeager, L.; Vigliola, L.; Brainard, R.E.; Baum, J.K. Fishing degrades size structure of coral reef fish communities. Glob. Chang. Biol. 2017, 23, 1009–1022. [Google Scholar] [CrossRef]
- Riniwati, H.; Harahab, N.; Abidin, Z. A vulnerability analysis of coral reefs in coastal ecotourism areas for conservation management. Diversity 2019, 11, 107–121. [Google Scholar] [CrossRef] [Green Version]


| Species | Diet | Human Use | Resilience | Vulnerability | Economic Value |
|---|---|---|---|---|---|
| Acanthurus olivaceus | dt | F and A | H | L | M |
| Sphyraena forsteri | ip | F | M | M | M |
| Chaetodon melannotus | iv | A | L | M–H | unknown |
| Cephalopholis boenak | ip | F and A | M | L–M | VH |
| Balistoides conspicillum | iv | F and A | M | M | M |
| Acanthurus mata | pk | F and A | L | M | M |
| Scarus forsteni | hb | F | H | L | H |
| Chaetodon wiebeli | hb | A | H | L | unknown |
| Chaetodon auriga | iv | F and A | H | L | unknown |
| Month Year | Month Year | ||||
|---|---|---|---|---|---|
| May 1999 | May 2016 | May 2017 | May 2018 | May 2019 | |
| May 1999 | 15 | 9 | 5 | 11 | |
| May 2016 | 0.20 | 15 | 5 | 17 | |
| May 2017 | 0.17 | 0.21 | 4 | 9 | |
| May 2018 | 0.12 | 0.08 | 0.11 | 7 | |
| May 2019 | 0.17 | 0.21 | 0.15 | 0.15 | |
| Number of species | 33 | 57 | 28 | 13 | 42 |
| Month Year | Species | IRI | pIRI | mIRI | Trophic Level |
|---|---|---|---|---|---|
| May 1999 | Gymnosarda unicolor | 4892.14 | 24.46 | 2164.90 | 4.5 ± 0.75 se |
| Cephalopholis urodeta | 3103.57 | 15.52 | 4.0 ± 0.69 se | ||
| Gnathodentex aureolineatus | 1520.02 | 7.60 | 3.7 ± 0.57 se | ||
| Epinephelus fasciatus | 1239.11 | 6.20 | 3.7 ± 0.4 se | ||
| Oxycheilinus orientalis | 1181.69 | 5.91 | 3.8 ± 0.62 se | ||
| Lutjanus kasmira | 1052.84 | 5.26 | 3.9 ± 0.3 se | ||
| May 2016 | Lutjanus kasmira | 6072.87 | 30.36 | 3682.19 | 3.9 ± 0.3 se |
| Odonus niger | 3264.13 | 16.32 | 3.2 ± 0.32 se | ||
| Gnathodentex aureolineatus | 1709.58 | 8.55 | 3.7 ± 0.57 se | ||
| May 2017 | Lutjanus kasmira | 9307.90 | 46.54 | 4128.95 | 3.9 ± 0.3 se |
| Euthynnus alletteratus | 2014.07 | 10.07 | 4.0 ± 0.0 se | ||
| Aphareus furca | 1064.89 | 5.32 | 4.1 ± 0.73 se | ||
| May 2018 | Melichthys vidua | 7610.84 | 38.05 | 2694.47 | 3.4 ± 0.39 se |
| Lutjanus kasmira | 2848.68 | 14.24 | 3.9 ± 0.3 se | ||
| Malacanthus brevirostris | 1720.68 | 8.60 | 3.5 ± 0.37 se | ||
| Cephalopholis urodeta | 1606.89 | 8.03 | 4.0 ± 0.69 se | ||
| Sufflamen chrysopterum | 1245.88 | 6.23 | 3.5 ± 0.41 se | ||
| Naso vlamingii | 1133.85 | 5.67 | 2.2 ± 0.11 se | ||
| May 2019 | Gnathodentex aureolineatus | 8557.39 | 42.79 | 3477.16 | 3.7 ± 0.57 se |
| Melichthys vidua | 2598.03 | 12.99 | 3.4 ± 0.39 se | ||
| Cephalopholis spiloparaea | 1724.59 | 8.62 | 4.1 ± 0.7 se | ||
| Cephalopholis urodeta | 1028.62 | 5.14 | 4.0 ± 0.69 se |
| Factor | CPUEB | SPUE | mIRI | pIRI | H′ | J′ |
|---|---|---|---|---|---|---|
| Cover | 0.805 | 0.826 | −0.738 | −0.760 | 0.645 | 0.387 |
| Fishing | −0.468 | −0.622 | 0.840 | 0.540 | −0.530 | −0.498 |
| SST | −0.709 | −0.657 | 0.657 | 0.531 | −0.404 | −0.274 |
Publisher’s Note: MDPI stays neutral with regard to jurisdictional claims in published maps and institutional affiliations. |
© 2022 by the authors. Licensee MDPI, Basel, Switzerland. This article is an open access article distributed under the terms and conditions of the Creative Commons Attribution (CC BY) license (https://creativecommons.org/licenses/by/4.0/).
Share and Cite
Dai, X.; Li, Y.; Cai, Y.; Gong, Y.; Zhang, J.; Chen, Z. Variations in Fish Community Structure at the Lagoon of Yongshu Reef, South China Sea between 1999 and 2016–2019. Diversity 2022, 14, 763. https://doi.org/10.3390/d14090763
Dai X, Li Y, Cai Y, Gong Y, Zhang J, Chen Z. Variations in Fish Community Structure at the Lagoon of Yongshu Reef, South China Sea between 1999 and 2016–2019. Diversity. 2022; 14(9):763. https://doi.org/10.3390/d14090763
Chicago/Turabian StyleDai, Xuejiao, Yuanjie Li, Yancong Cai, Yuyan Gong, Jun Zhang, and Zuozhi Chen. 2022. "Variations in Fish Community Structure at the Lagoon of Yongshu Reef, South China Sea between 1999 and 2016–2019" Diversity 14, no. 9: 763. https://doi.org/10.3390/d14090763
APA StyleDai, X., Li, Y., Cai, Y., Gong, Y., Zhang, J., & Chen, Z. (2022). Variations in Fish Community Structure at the Lagoon of Yongshu Reef, South China Sea between 1999 and 2016–2019. Diversity, 14(9), 763. https://doi.org/10.3390/d14090763