Communication

13C-Labeled Artificial Root Exudates Are Immediately Respired in a Peat Mesocosm Study

1
Department of Geography and Regional Research, Geoecology, Faculty of Earth Sciences, Geography and Astronomy, University of Vienna, Josef-Holaubek-Platz 2, 1090 Vienna, Austria
2
Vienna Doctoral School of Ecology and Evolution (VDSEE), Faculty of Life Sciences, University of Vienna, Djerassiplatz 1, 1030 Vienna, Austria
3
Department of Forest- and Soil Sciences, Institute of Soil Research, University of Natural Resources and Life Sciences, Peter-Jordan Straße 82, 1190 Vienna, Austria
4
Department of Agricultural Mechanization Engineering, College of Biological and Agricultural Engineering, Jilin University, Changchun 130022, China
*
Author to whom correspondence should be addressed.
Diversity 2022, 14(9), 735; https://doi.org/10.3390/d14090735
Submission received: 12 August 2022 / Revised: 24 August 2022 / Accepted: 2 September 2022 / Published: 7 September 2022
(This article belongs to the Special Issue Peatland Ecosystems under Climate Change)

Abstract

:
Globally, peatlands have been recognized as important carbon sinks while only covering approximately 3% of the earth’s land surface. Root exudates are known key drivers of C cycling in soils and rhizosphere priming effects have been studied extensively in terrestrial ecosystems. Their role for decomposition of peat still remains unclear, as little research about their fate and potential priming effects in peat exists. In this study, we aimed to evaluate pathways of root exudates and their short-term priming effects by daily determination of stable carbon isotope fluxes of C O 2 and C H 4 . As the drainage of peatlands strongly alters processes of decomposition, we included measurements after drainage as well. Results revealed the immediate respiration of root exudates in peat, mainly as C O 2 , while C H 4 release was associated with a lag time of several days. However, the largest proportion of added root exudates remained in the solid and liquid phase of peat. In conclusion, our findings suggest that no priming occurred as added substrates remained immobile in peat.

1. Introduction

Peatlands cover only 4.23 million km2 of the world’s land area [1] but have been shown to be key players in global carbon (C) cycles. Remarkably reduced decomposition of detritus over thousands of years enables peatlands to sequester at least between 600 Gt [2] and 1105 Gt [3] carbon in their peat layers. Root exudates are complex substances that are released by plants into the soil. They typically contain compounds such as sugars, amino acids and organic acids, and are used especially for the acquisition of nutrients [4]. They are known to play a crucial role in plant–soil mediated processes, as they actively change the surrounding soil’s physico-chemical characteristics [5] and substantially contribute to biogeochemical cycling in soils [4,6].
Stimulated microbial activity and significantly increased mineralization of soil organic matter (SOM) after adding labile carbon compounds are known as positive priming effects [7] and have received special attention due to their critical role in the global C cycle. In addition to frequently used substrates (such as glucose) for studying priming effects in soils, also root exudates have received attention as a possible source for priming. Recent studies have shown that root exudates that contain oxalic acid promote C losses in mineral soils due to the liberation of organic compounds, acting as a favorable source of energy for microorganisms [8]. In organic peat soils, root exudates have been found to control substrate quality, methane release [9] and the decomposition in undisturbed peat cores with intact vegetation [10]. Additionally, decomposition of recalcitrant dissolved organic carbon (DOC) has been stimulated by root exudates in peat due to favorable C/N relations for microbial communities [11]. On the other hand, other laboratory studies detected only negligible increases of C O 2 release from peat slurries amended with artificial root exudates, and questioned the importance of priming in peatland ecosystems [12]. These contradictory conclusions are not only explained by different experimental setups but also show that further research on the process scale is necessary.
Most research on priming effects has been carried out in mineral soils, although one might assume that results are valid for organic soils too. However, our knowledge on priming effects in organic soils is still patchy. Recent studies suggest that changing environmental conditions, such as increasing temperatures [13] or C O 2 -enrichment [14], may enhance the release of root exudates into soils, underlining not only the need of understanding the impact of root exudates on C dynamics in organic soils, but also of gaining knowledge about their fate in peat.
In this light, the mesocosm study presented here aims to elucidate the short-term effects of artificial root exudates on the decomposition of peat and to reveal the major pathways and fractionation of added root exudates in peat. We hypothesized that the addition of artificial root exudates significantly increases the evolution of C O 2 , C H 4 , DOC, and microbial biomass C due to positive priming effects of added substrates. By adding 13C-labeled root exudates, we detected positive priming, as the release of 12C from decomposing peat should be significantly promoted by added root exudates.

2. Materials and Methods
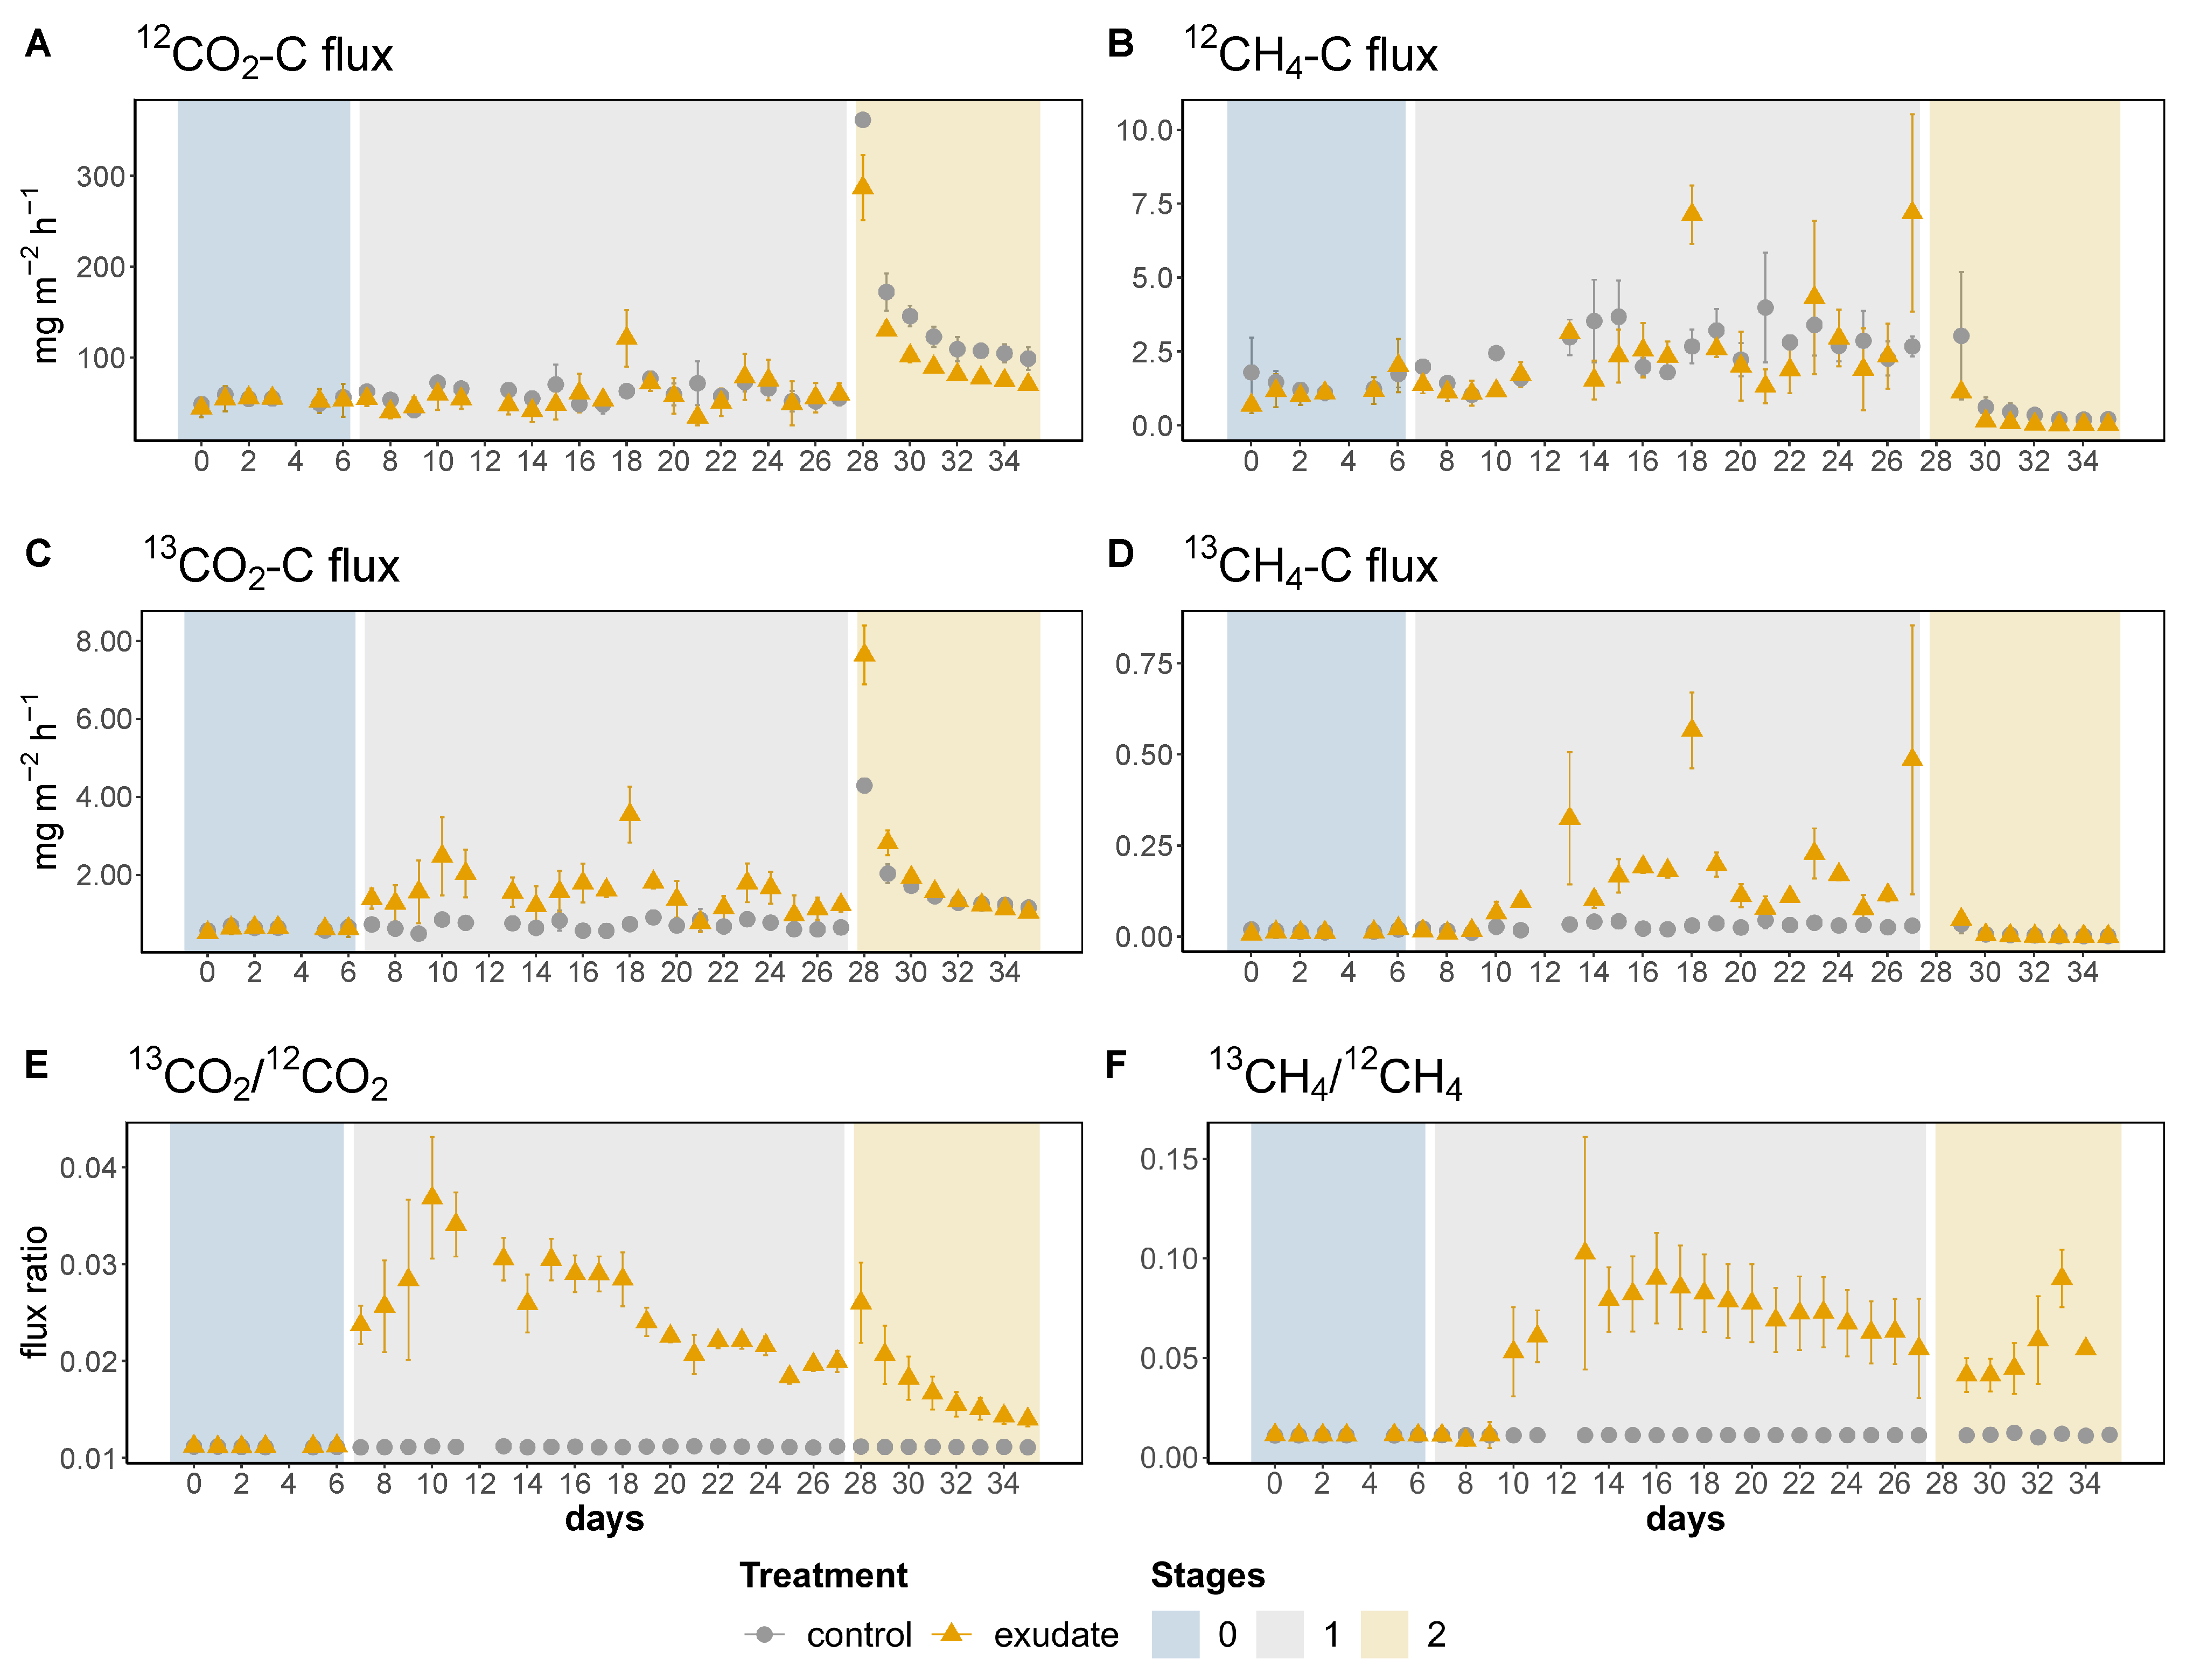
We sampled six undisturbed peat cores (length of core 35 cm) from the ombrotrophic peat bog “Pürgschachen Moor” (Austria, N 47°34′53.34″, E 14°20′47.79″, an intermediately degraded site described by Drollinger et al. [15], site 5), in close proximity (within 2 m) using PVC tubes (Marley DN 160, Ø 150 mm, length: 50 cm), and stored them in daylight with intact vegetation. Temperature was set at 22 °C over the whole experiment, assuring constant conditions. Cores were equipped with ports (Festo tubes mounted with Luer-Lock stopcock) in 5, 15 and 25 cm depths below surface to allow weekly pore water extraction. The water table was held constant (3 cm below the surface) using deionized water (pH adjusted with acetic acid). The experiment was separated into a pre-treatment phase (stage 0, duration 7 days), treatment phase (stage 1, duration 22 days), and a drainage phase (stage 2, duration 8 days). After finishing the experiment, peat from cores was separated for each depth (0 to 5 cm, 5 to 15 cm, and 15 to 25 cm below the surface) and used for further analyses.
13C labeled artificial root exudates were prepared following Basiliko et al. [12] using a relative ratio of 6:2:2 (glucose-C:amino acid-C:acetic acid-C, chemicals: D-glucose 13C6 (99%, manufacturer: Sigma-Aldrich, St. Louis, MO, USA, 389374), algal amino acid mixture (uniformly 13C, manufacturer: Sigma-Aldrich, MO, USA, 426199), acetic acid 13C2 (99%, manufacturer: Sigma-Aldrich, MO, USA, 282022)). Three cores were spiked with bog water (controls); remaining cores were spiked in 15 cm depth with a root exudate mixture using a syringe (each core received 46.7 mg C based on calculated amounts for 0.083 mg C g−1 dry peat; i.e., suggested as a medium daily exudation rate in a bog [12]).
Using the dynamic dark closed chamber approach, C O 2 and C H 4 fluxes of stable C isotopes (12C and 13C) were calculated daily on the basis of measurements carried out with a Picarro G2201-i CRDS Analyzer (Picarro Inc., Santa Clara, CA, USA). Due to the short chamber closure duration (<5 min), the fluxes could be approximated by a linear regression model [16]. Fluxes with R 2 values of at least 0.94 were used for further calculations. The total amount of gaseous 13C release from treatment cores was calculated after subtracting the sum of gaseous 13C release from control cores (for 13 C O 2 and 13 C H 4 ), and proportions of gaseous 13C from the initially added 13C were calculated. Sums of total gaseous C release were calculated for each core and experimental stage.
13C of solid peat was measured for sampled depths using oven-dried (60 °C) and finely ground peat samples. To account for the remaining label in solid peat, the mean natural abundance of 13C of control cores was subtracted from treatment cores and the excess 13C was multiplied by the total C amount of each sample. We calculated the amount of remaining 13C in peat at each soil depth by multiplying the total 13C of each sample by the bulk density (0.06 g cm−3) and volume (176.71 cm−3).
Microbial biomass C of each depth was determined using an adapted chloroform fumigation-extraction procedure [17]. To ensure consistent results of the following isotopic signatures of extracts, a low concentration of extractant (0.05 M K 2 S O 4 ) was used [18]. All extracts and liquid DOC samples were filtered (using a 0.45 µm nylon syringe filter) prior to analysis using a Shimadzu NPOC/TN analyzer (Shimadzu TOC-L and ASI-L, Shimadzu Corp., Kyoto, Japan). Results are expressed in mg C g−1 dry weight (dw).
Data analysis, visualization and statistical tests were performed using R [19] and the following packages: dplyr [20], ggpubr [21], lubridate [22], and rstatix [23]. A Shapiro–Wilk test was performed to check data for normal distribution. As no normal distribution was found p < 0.05), the non-parametric Wilcoxon rank sum test was used to detect significant differences between groups. p-values ≤ 0.05 of all statistical tests were seen as significant. Results are presented as mean ± SD unless otherwise noted.

3. Results

3.1. Gaseous Carbon Release and Stable Isotopic Flux Ratios

3.1.1. Stage 0: Pre-Treatment Phase

During the pre-treatment phase (stage 0), 12 C O 2 -C and 13 C O 2 -C fluxes (Figure 1A,C) showed a slight increase after the start of the experiment but remained constant without great variations. Comparisons of mean fluxes throughout this stage showed no significant differences between treatment groups (12 C O 2 -C: 54.1 ± 8.7 m−2 h−1 (control), 52.6 ± 18.6 mg m−2 h−1 (exudate); 13 C O 2 -C: 0.64 ± 0.11 (control), 0.63 ± 0.22 mg m−2 h−1 (exudate)). 12 C H 4 -C fluxes (Figure 1B) showed variations especially for the control group during stage 0 but means showed no significant differences (control: 1.43 ± 0.87 m−2 h−1, exudate: 1.19 ± 0.85 mg m−2 h−1). 13 C H 4 -C fluxes (Figure 1D) remained constant during this stage without significant differences of mean fluxes (control: 0.016 ± 0.009 m−2 h−1, exudate: 0.014 ± 0.009 mg m−2 h−1). Stable isotopic flux ratios of C O 2 (Figure 1E) and C H 4 (Figure 1F) remained constant during stage 0.

3.1.2. Stage 1: Treatment Phase

12 C O 2 -C fluxes (Figure 1A) remained constant for both groups during stage 1 and mean amounts showed no significant differences between them (control: 60.4 ± 16.1 m−2 h−1, exudate: 57.3 ± 29.7 mg m−2 h−1). 13 C O 2 -C fluxes (Figure 1C) of treatment group increased after adding labeled artificial root exudates while fluxes of the control group remained below amounts of treated cores. Mean amounts showed significant differences between groups (control: 0.72 ± 0.02 m−2 h−1, exudate: 1.58 ± 0.94 mg m−2 h−1; p < 0.01, effect size r = 0.62). 12 C H 4 -C fluxes (Figure 1B) showed a more variable pattern during stage 1 for both groups. Mean values did not differ significantly between treatment groups (control: 2.49 ± 1.32 m−2 h−1, exudate: 2.44 ± 2.17 mg m−2 h−1). 13 C H 4 -C fluxes (Figure 1D) of treated cores started to increase several days after the addition of root exudates and stayed above the fluxes of the control group. Mean fluxes differed significantly between groups (control: 0.029 ± 0.015 m−2 h−1, exudate: 0.145 ± 0.165 mg m−2 h−1; p < 0.01, effect size r = 0.51). C O 2 stable isotopic flux ratios (Figure 1E) of treated cores decoupled immediately from the control after adding labeled root exudates on day 7 and steadily increased until reaching a maximum on day 10. Ratios further decreased until the end of stage 1 on day 27. C H 4 stable isotopic flux ratios (Figure 1F) of treated cores did not respond immediately after the addition of root exudates and increased with a lag time of four days starting at day 10. After a maximum at day 13, ratios decreased continuously until the end of stage 1 (day 27).

3.1.3. Stage 2: Drainage Phase

12 C O 2 -C fluxes of both groups (Figure 1A) increased immediately when starting drainage of cores. After reaching peak values on day 28, fluxes decreased until the end of the experiment but remained higher than in the stages before. Fluxes of the exudate group were constantly below fluxes of the control group. Mean amounts showed significant lower amounts for treated cores (control: 152.9 ± 85.8 m−2 h−1, exudate: 114.2 ± 71.9 mg m−2 h−1; p = 0.003, effect size r = 0.46). 13 C O 2 -C fluxes (Figure 1C) followed a similar pattern with insignificant higher mean fluxes of treated cores (control: 1.82 ± 1.02 m−2 h−1, exudate: 2.34 ± 2.17 mg m−2 h−1). 12 C H 4 -C fluxes (Figure 1B) decreased steadily after drainage and remained below the amounts observed in stage 0 and 1. Daily fluxes of control cores were constantly higher than those of treated ones and mean fluxes of the control group were significantly higher than treatment group (control: 0.78 ± 1.63 m−2 h−1, exudate: 0.23 ± 0.39 mg m−2 h−1; p = 0.011, effect size r = 0.46). 13 C H 4 -C fluxes (Figure 1D) decreased after drainage and daily mean fluxes of treated cores were lower than the in control group (except for day 29). The mean fluxes of stage 2 showed no significant differences between groups (control: 0.009 ± 0.019, exudate: 0.01 ± 0.018 mg m−2 h−1). Drainage increased C O 2 stable isotopic flux ratios (Figure 1E) of treated cores following a steady decrease until the end of the experiment, while ratios of the control group remained constant. C H 4 stable isotopic flux ratios (Figure 1F) of the treatment group slightly decreased after drainage and stayed constant until day 30. After rising until reaching a local maximum on day 33, ratios dropped.

3.2. Stable Carbon Isotopes in Solid Peat

Analysis of solid peat revealed that δ 13C values were less depleted in the upper horizons (5 cm depth) of treatment cores (−27.24 ± 0.99‰) compared to the control cores (−28.08 ± 0.09‰). In the injection depth of artificial root exudates (15 cm depth), labeled cores revealed an increment to −20.55 ± 1.54‰ compared to −26.75 ± 0.73‰ of the control cores. The deepest horizons showed only small differences between groups (exudates: −26.52 ± 0.39‰, control: −26.39 ± 0.54‰). From 140.1 mg 13C added to treatment cores as artificial root exudates, a total of 84.64 mg 13C remained in the solid peat of treated cores.

3.3. DOC and Microbial Biomass Carbon

DOC concentrations, presented in Table 1, decreased over the course of the experiment. Mean DOC concentrations per depth (data not shown) and mean DOC concentrations of cores (Table 1) showed no significant differences between groups. Nevertheless, a slight decrease of mean DOC concentrations in the depth of 15 cm was observed after the addition of root exudates (time 2).
Microbial biomass C for each depth showed no significant differences between treatment and control (data not shown). The lowest amounts were observed in the top horizon (5 cm) of both groups (48.8 ± 3.8 mg C g−1 dw: control group; 50.9 ± 12.8 mg C g−1 dw: treatment group), whereas the highest amounts were measured in the intermediate horizon (15 cm depth, 61.7 ± 1.9 mg C g−1 dw: control group; 74.1 ± 13.9 mg C g−1 dw: treatment group). The deepest horizons (25 cm depth) amounted to 55.8 ± 3.2 mg C g−1 dw (control group) and 68.5 ± 8.4 mg C g−1 dw (treatment group).

3.4. Fate of 13C-Labeled Artificial Root Exudates

We assumed that the amount of 13C in the liquid phase ended up in the solid peat after drying it at 60 °C. Therefore, from a total of 140.1 mg 13C added to treatment cores, 66% (92.5 mg 13C) remained in solid peat (together with the amount from the liquid phase). Just 34% (47.6 mg 13C) of added label was released as gaseous C, of which 92.2% account for 13 C O 2 -C and 7.8% for 13 C H 4 -C. In sum, the release of 13 C O 2 -C accounted for 31.4% (43.9 mg 13C), and 13 C H 4 -C for 2.6% (3.7 mg 13C) of added 13C of root exudates.

4. Discussion

4.1. C O 2

During our experiment, we did not observe priming effects after adding artificial root exudates in water-saturated peat. Nevertheless, we found an instant use of the added labile C source, as 13 C O 2 fluxes increased immediately, whereas 12 C O 2 fluxes stayed constant, indicating a preferential use of root exudates instead of more recalcitrant peat. Slight but insignificant increases of C O 2 release rates were also observed in other studies where a priming effect was not shown clearly after adding artificial root exudates to peat slurry [12]. Aaltonen et al. [24] identified changing water tables as a more important factor for C O 2 release from fertile peat, as glucose addition was not causing a visible priming effect, probably because C was not the limiting factor for decomposition.
Lowering the water table during drainage in phase 2 in our experiment led to strong and immediate changes in the C O 2 release from treated and control cores. Both 13 C O 2 -C and 12 C O 2 -C fluxes increased after starting drainage, while stable isotopic ratios stayed constant for the control group. On the contrary, stable isotopic C ratios of treated cores increased again. This decoupling shows that added root exudates are again used preferentially as energy source by microorganisms upon establishment of oxic conditions. The lower water table allows aerobic decomposition of organic matter, leading to higher C O 2 production rates after drainage started and already small changes in water table levels can increase C O 2 releases in peat [24,25]. Previous studies reported only a small influence of lower water tables on C O 2 production in peat, probably due to a lack of labile organic C sources [26]. In our case, added artificial root exudates such as labile organic C source were available for aerobic decomposers after lowering water tables. In addition, increases of C O 2 may occur due to oxygenation of upper peat horizons after drainage started, as C H 4 from lower, wet horizons, can be oxidized by methanotrophic bacteria passing through aerated horizons [27,28,29].

4.2. C H 4

Organic matter decomposition by anaerobes involves multiple preliminary steps and different methanogenic bacteria, as single groups are not able to decompose organic materials completely. Generally, complex organic polymers are hydrolyzed to simpler monomeric compounds, which are further fermented to products (short-chain fatty acids, alcohols, H 2 , C O 2 , and other organic acids) that are utilized for the production of acetate (acetogenesis). Finally, acetate is used by acetotrophic methanogens, while H 2 and C O 2 are used by hydrogenotrophic methanogens conducting methanogenesis [29,30]. In acidic environments with recalcitrant organic matter such as peat, hydrogenotrophic methanogenesis contributes to higher proportions to C H 4 production than in other wetland systems [30,31] but both pathways occur simultaneously [32]. Our observed lag time of at least three days between the addition of root exudates and the response of C H 4 fluxes and stable isotopic flux ratios illustrate that the added substrate was not immediately available for methanogens, and pre-processing steps of glucose and acetic acid is needed. This finding is in line with experiments where added acetic acid to lowland soils responded to C H 4 emissions after three days [33]. Additionally, a lag between the addition of glucose and increased C H 4 release was observed for water-saturated paddy soils [34], as glucose cannot be used directly by methanogens [28,35,36]. Drainage of peat columns in stage 2 was accomplished by opening the lower part of the columns, allowing water to drain slowly. Therefore, the peat was not water-saturated but stayed wet until the end of the experiment, while drying out gradually. After starting drainage, also C H 4 fluxes decreased continuously, while stable isotopic C ratios of C H 4 increased again. Our observed reduction in C H 4 fluxes during stage 2 are in line with general observations of decreased methanogenesis rates in dryer peat [37]. Increased stable isotopic ratios of C H 4 fluxes of treatment cores indicate that added artificial root exudates (acetic acid, glucose, and amino acids) were preferentially used as substrates for methanogens. Using more recalcitrant peat as a source of energy for methanogenesis seems to be less valuable compared to added labile 13C sources from artificial root exudates.

4.3. Stable Carbon Isotope Ratios of Solid Peat

Stable C isotope ratios of untreated cores were in line with findings from previous site-specific studies, where similar depth-related increases were observed [15]. They can be explained by selective use of 12C during decomposition, which leads to higher δ 13C values due to relative enrichment. In our study, treatment cores showed a similar pattern in the uppermost and lowermost horizons. In the depth of injection, lower ratios were observed, as a high proportion of added 13C remained in the solid and liquid phase of the peat. These findings suggest that added artificial root exudates are very immobile within water-saturated peat columns and remain at the point of injection. Therefore, interactions with other horizons are limited, explaining the relatively low proportion of 13C losses via gaseous release (34%). Attenuation of solute movement in peat has been subjected to retardation mechanisms including filtration, biological uptake, adsorption, physical properties of peat, and temporal entrapment in closed pores [38]. Our findings support the idea of immobile liquid phases in peat; however, our understanding of solute transport in peat is limited, as it is mainly based on concepts ignoring complex interactions of biological processes and the special structure of peat [39].

4.4. DOC and Microbial Biomass

In our experiment, the injection of artificial root exudates had no significant effect on mean DOC concentrations over time, indicating that no priming occurred in the liquid phase. These findings are in line with Aaltonen et al. [24], who found that high water tables and water saturation of peat did not lead to positive priming of DOC after adding glucose. Nonetheless, we observed a slight decrease in DOC concentration in the depth of injection of treatment cores instantly after the injection of root exudates. After the third DOC sampling in week 3, mean DOC concentrations of both groups decreased steadily in all depths.
We found no significant differences between treatments for microbial biomass C. However, comparison of means showed slightly higher amounts in treatment cores and the highest microbial biomass C in the depth of injection of root exudates (15 cm depth). It should be noted, though, that the variability of microbial biomass C in treated cores increased strongly as well. In our case, the addition of a labile C source (i.e., artificial root exudates) slightly enhanced microbial biomass growth. Other studies showed that the addition of glucose alone did not stimulate microbial biomass growth [40], while the addition of mimicked root exudates in higher concentrations may stimulate growth and activity of microbial communities in peat [11]. Our observed increase, together with the rapid loss of 13 C O 2 -C after adding root exudates, indicate stimulated metabolic activity, even under water-saturated conditions, which is consistent with findings that adding a readily available C source increased the metabolic rate of microbes rapidly [41].

5. Conclusions

We were able to differentiate gaseous pathways of added root exudates in peat, as we traced C O 2 and C H 4 and their stable C isotopes on a daily basis and under different water table regimes. In water-saturated peat, root exudates were immediately used and released as C O 2 , whereas C H 4 was released with a lag time of at least three days. Drainage of peat led to an immediate use of root exudates by aerobic decomposers while methanogens responded with a certain lag time. In addition, we detected no visible priming effect after adding root exudates, as gaseous C, DOC, and microbial biomass showed no significant differences between experimental groups. Our findings thus question the importance of priming caused by the exudation of labile C sources in water-saturated, nutrient-poor peat. This is further corroborated by a high immobility of released solutes in peat, since the largest proportion of root exudates remained in the solid and liquid phases of the peat. However, it should be noted that our laboratory conditions (constant temperature and water table) aim to simplify process observations and do not represent natural conditions, as they might have more complex interactions.

Author Contributions

R.M., data curation, formal analysis, visualization, writing—original draft; A.M., methodology, formal analysis, investigation; E.I., writing—review and editing, investigation; R.P. and G.W., investigation; S.G., conceptualization, funding acquisition, project administration, supervision, writing—review and editing. All authors have read and agreed to the published version of the manuscript.

Funding

Open access funding provided by University of Vienna.

Institutional Review Board Statement

Not applicable.

Informed Consent Statement

Not applicable.

Acknowledgments

We thank Claudia Blauensteiner for her valuable support during laboratory analysis and GHG measurements and the Open Access Funding by the University of Vienna.

Conflicts of Interest

The authors declare no conflict of interest.

References

  1. Xu, J.; Morris, P.J.; Liu, J.; Holden, J. PEATMAP: Refining estimates of global peatland distribution based on a meta-analysis. Catena 2018, 160, 134–140. [Google Scholar] [CrossRef]
  2. Yu, Z.; Loisel, J.; Brosseau, D.P.; Beilman, D.W.; Hunt, S.J. Global peatland dynamics since the Last Glacial Maximum. Geophys. Res. Lett. 2010, 37, 1–5. [Google Scholar] [CrossRef]
  3. Nichols, J.E.; Peteet, D.M. Rapid expansion of northern peatlands and doubled estimate of carbon storage. Nat. Geosci. 2019, 12, 917–921. [Google Scholar] [CrossRef]
  4. Canarini, A.; Kaiser, C.; Merchant, A.; Richter, A.; Wanek, W. Root Exudation of Primary Metabolites: Mechanisms and Their Roles in Plant Responses to Environmental Stimuli. Front. Plant Sci. 2019, 10, 157. [Google Scholar] [CrossRef]
  5. Yan, F.; Schubert, S.; Mengel, K. Soil pH increase due to biological decarboxylation of organic anions. Soil Biol. Biochem. 1996, 28, 617–624. [Google Scholar] [CrossRef]
  6. Girkin, N.T.; Turner, B.L.; Ostle, N.; Craigon, J.; Sjögersten, S. Root exudate analogues accelerate CO2 and CH4 production in tropical peat. Soil Biol. Biochem. 2018, 117, 48–55. [Google Scholar] [CrossRef]
  7. Kuzyakov, Y. Priming effects: Interactions between living and dead organic matter. Soil Biol. Biochem. 2010, 42, 1363–1371. [Google Scholar] [CrossRef]
  8. Keiluweit, M.; Bougoure, J.J.; Nico, P.S.; Pett-Ridge, J.; Weber, P.K.; Kleber, M. Mineral protection of soil carbon counteracted by root exudates. Nat. Clim. Chang. 2015, 5, 588–595. [Google Scholar] [CrossRef]
  9. Ström, L.; Ekberg, A.; Mastepanov, M.; Røjle Christensen, T. The effect of vascular plants on carbon turnover and methane emissions from a tundra wetland. Glob. Chang. Biol. 2003, 9, 1185–1192. [Google Scholar] [CrossRef]
  10. Crow, S.E.; Wieder, R.K. Sources of CO2 Emission from a Northern Peatland: Root Respiration, Exudation, and Decomposition. Ecology 2005, 86, 1825–1834. [Google Scholar] [CrossRef]
  11. Mastný, J.; Bárta, J.; Kaštovská, E.; Picek, T. Decomposition of peatland DOC affected by root exudates is driven by specific r and K strategic bacterial taxa. Sci. Rep. 2021, 11, 18677. [Google Scholar] [CrossRef]
  12. Basiliko, N.; Stewart, H.; Roulet, N.T.; Moore, T.R. Do Root Exudates Enhance Peat Decomposition? Geomicrobiol. J. 2012, 29, 374–378. [Google Scholar] [CrossRef]
  13. Wang, Q.; Chen, L.; Xu, H.; Ren, K.; Xu, Z.; Tang, Y.; Xiao, J. The effects of warming on root exudation and associated soil N transformation depend on soil nutrient availability. Rhizosphere 2021, 17, 100263. [Google Scholar] [CrossRef]
  14. Phillips, R.P.; Finzi, A.C.; Bernhardt, E.S. Enhanced root exudation induces microbial feedbacks to N cycling in a pine forest under long-term CO2 fumigation. Ecol. Lett. 2011, 14, 187–194. [Google Scholar] [CrossRef]
  15. Drollinger, S.; Kuzyakov, Y.; Glatzel, S. Effects of peat decomposition on δ13C and δ15N depth profiles of Alpine bogs. Catena 2019, 178, 1–10. [Google Scholar] [CrossRef]
  16. Rochette, P.; Ellert, B.; Gregorich, E.G.; Desjardins, R.L.; Pattey, E.; Lessard, R.; Johnson, B.G. Description of a dynamic closed chamber for measuring soil respiration and its comparison with other techniques. Can. J. Soil Sci. 1997, 77, 195–203. [Google Scholar] [CrossRef]
  17. Vance, E.D.; Brookes, P.C.; Jenkinson, D.S. An extraction method for measuring soil microbial biomass C. Soil Biol. Biochem. 1987, 19, 703–707. [Google Scholar] [CrossRef]
  18. Makarov, M.I.; Malysheva, T.I.; Menyailo, O.V.; Soudzilovskaia, N.A.; van Logtestijn, R.S.P.; Cornelissen, J.H.C. Effect of K2SO4 concentration on extractability and isotope signature (δ13C and δ15N) of soil C and N fractions. Eur. J. Soil Sci. 2015, 66, 417–426. [Google Scholar] [CrossRef]
  19. R Core Team. R: A Language and Environment for Statistical Computing; R Core Team: Vienna, Austria, 2020. [Google Scholar]
  20. Wickham, H.; François, R.; Henry, L.; Müller, K. Dplyr: A Grammar of Data Manipulation. 2020. Available online: https://CRAN.R-project.org/package=dply (accessed on 1 September 2022).
  21. Kassambara, A. Ggpubr: ’Ggplot2’ Based Publication Ready Plots. 2020. Available online: https://CRAN.R-project.org/package=ggpubr (accessed on 1 September 2022).
  22. Grolemund, G.; Wickham, H. Dates and Times Made Easy with lubridate. J. Stat. Softw. 2011, 40, 1–25. [Google Scholar] [CrossRef]
  23. Kassambara, A. Rstatix: Pipe-Friendly Framework for Basic Statistical Tests. 2021. Available online: https://CRAN.R-project.org/package=rstatix (accessed on 1 September 2022).
  24. Aaltonen, H.; Zhu, X.; Khatun, R.; Laurén, A.A.; Palviainen, M.; Könönen, M.; Peltomaa, E.; Beringer, F.; Köster, K.; Ojala, A.; et al. The effects of glucose addition and water table manipulation on peat quality of drained peatland forests with different management practices. Soil Sci. Soc. Am. J. 2022, 2022, 1–32. [Google Scholar] [CrossRef]
  25. Yan, W.; Wang, Y.; Ju, P.; Huang, X.; Chen, H. Water level regulates the rhizosphere priming effect on SOM decomposition of peatland soil. Rhizosphere 2022, 21, 100455. [Google Scholar] [CrossRef]
  26. Ellis, T.; Hill, P.W.; Fenner, N.; Williams, G.G.; Godbold, D.; Freeman, C. The interactive effects of elevated carbon dioxide and water table draw-down on carbon cycling in a Welsh ombrotrophic bog. Ecol. Eng. 2009, 35, 978–986. [Google Scholar] [CrossRef]
  27. Blodau, C. Carbon cycling in peatlands—A review of processes and controls. Environ. Rev. 2002, 10, 111–134. [Google Scholar] [CrossRef]
  28. Conrad, R. Methane Production in Soil Environments-Anaerobic Biogeochemistry and Microbial Life between Flooding and Desiccation. Microorganisms 2020, 8, 881. [Google Scholar] [CrossRef] [PubMed]
  29. Whalen, S.C. Biogeochemistry of Methane Exchange between Natural Wetlands and the Atmosphere. Environ. Eng. Sci. 2005, 22, 73–94. [Google Scholar] [CrossRef]
  30. Lai, D. Methane Dynamics in Northern Peatlands: A Review. Pedosphere 2009, 19, 409–421. [Google Scholar] [CrossRef]
  31. Galand, P.E.; Fritze, H.; Conrad, R.; Yrjälä, K. Pathways for methanogenesis and diversity of methanogenic archaea in three boreal peatland ecosystems. Appl. Environ. Microbiol. 2005, 71, 2195–2198. [Google Scholar] [CrossRef]
  32. Kotsyurbenko, O.R.; Chin, K.J.; Glagolev, M.V.; Stubner, S.; Simankova, M.V.; Nozhevnikova, A.N.; Conrad, R. Acetoclastic and hydrogenotrophic methane production and methanogenic populations in an acidic West-Siberian peat bog. Environ. Microbiol. 2004, 6, 1159–1173. [Google Scholar] [CrossRef]
  33. Moscôso, J.S.C.; Da Silva, L.S.; Pujol, S.B.; Giacomini, S.J.; Severo, F.F.; Marzari, L.B.; Molin, G.D. Methane emission induced by short-chain organic acids in lowland soil. Rev. Bras. Ciênc. Solo 2019, 43, 1–15. [Google Scholar] [CrossRef]
  34. Luo, D.; Li, Y.; Yao, H.; Chapman, S.J. Effects of different carbon sources on methane production and the methanogenic communities in iron rich flooded paddy soil. Sci. Total Environ. 2022, 823, 153636. [Google Scholar] [CrossRef]
  35. Segers, R. Methane production and methane consumption: A review of processes underlying wetland methane fluxes. Biogeochemistry 1998, 41, 23–51. [Google Scholar] [CrossRef]
  36. Ye, R.; Keller, J.K.; Jin, Q.; Bohannan, B.J.; Bridgham, S.D. Peatland types influence the inhibitory effects of a humic substance analog on methane production. Geoderma 2016, 265, 131–140. [Google Scholar] [CrossRef]
  37. Estop-Aragonés, C.; Blodau, C. Effects of experimental drying intensity and duration on respiration and methane production recovery in fen peat incubations. Soil Biol. Biochem. 2012, 47, 1–9. [Google Scholar] [CrossRef]
  38. Hoag, R.S.; Price, J.S. The effects of matrix diffusion on solute transport and retardation in undisturbed peat in laboratory columns. J. Contam. Hydrol. 1997, 28, 193–205. [Google Scholar] [CrossRef]
  39. McCarter, C.; Rezanezhad, F.; Quinton, W.L.; Gharedaghloo, B.; Lennartz, B.; Price, J.; Connon, R.; van Cappellen, P. Pore-scale controls on hydrological and geochemical processes in peat: Implications on interacting processes. Earth Sci. Rev. 2020, 207, 103227. [Google Scholar] [CrossRef]
  40. Di Lonardo, D.P.; de Boer, W.; Zweers, H.; van der Wal, A. Effect of the amount of organic trigger compounds, nitrogen and soil microbial biomass on the magnitude of priming of soil organic matter. PLoS ONE 2019, 14, e0216730. [Google Scholar] [CrossRef]
  41. Schimel, J. The implications of exoenzyme activity on microbial carbon and nitrogen limitation in soil: A theoretical model. Soil Biol. Biochem. 2003, 35, 549–563. [Google Scholar] [CrossRef]
Figure 1. Daily mean 12 C O 2 -C fluxes (A), 12 C H 4 -C fluxes (B), 13 C O 2 -C fluxes (C), 13 C H 4 -C fluxes (D) and stable isotopic flux ratios of C O 2 (E) and C H 4 (F) for experimental stages (mean values, error bars indicate SE). Colored backgrounds indicate experimental stages (0: pre-treatment phase; 1: treatment phase; 2: drainage phase).
Diversity 14 00735 g001
Table 1. Dissolved organic carbon (DOC) in pore water of the control and treatment groups for each sampling week. Amounts represent mean values over all core depths.
Time
(Week)
DOC Control Group
(mg L−1)
DOC Treatment Group
(mg L−1)
1 (stage 0)113.6 ± 22.5129.8 ± 37.6
2 (stage 1)115.4 ± 20.4 ns122.9 ± 35.5 ns
3 (stage 1)119.2 ± 22.5 ns128.7 ± 38.6 ns
4 (stage 1)95.7 ± 20.5 ns109.8 ± 34.5 ns
5 (stage 1)93.1 ± 21.9 ns94.1 ± 35.4 ns
6 (stage 2)104.3 ± 8.4 ns87.9 ± 9.7 ns
ns No significant differences between comparisons of amounts from the previous week, (stage 0 and 1: n = 9 (samples of 3 cores and 3 depths), stage 2: n = 2 (treated) and 3 (control) (sample of drainage water of 3 cores)).
Publisher’s Note: MDPI stays neutral with regard to jurisdictional claims in published maps and institutional affiliations.

