Abstract
Global Red List assessments are powerful tools for informing large-scale conservation decision-making processes, however, they can also be used to inform more localised research and conservation priorities. Here, a conservation status assessment was conducted for the marine vertebrate biodiversity of two recently designated marine protected areas in the Republic of Seychelles. International Union for Conservation of Nature (IUCN) Red List assessments were compiled and trends in data analysed for the 524 species recorded locally. Findings suggest that 5.5–23.1% of all marine vertebrate biodiversity at the site is threatened or near-threatened with extinction (combined as ‘elevated risk’), and highlights sharks and rays as contributing two thirds (67.9%) to the ‘elevated risk’ biodiversity of the site. Fishing activities constitute the largest threat to every ‘elevated risk’ species using the site, with sharks and rays being most impacted. Species richness analysis across major habitat types evidence the high value of coral reef areas to almost all species and the importance of adjacent deep-water areas for ‘elevated risk’ species. Theoretical national assessments showed that the majority of globally ER species remained in the same Red List category in their respective national assessment. This study demonstrates the value of global Red List data for optimising research efforts and conservation practices on a localised scale and for informing the design and zonation of marine protected areas.
1. Introduction
Given the ever-growing evidence for global declines in biodiversity [1,2,3,4,5,6,7], there is a greater need than ever for species research to have tangible and meaningful contributions to conservation [8] and for conservation measures to be informed by species priorities [9]. The IUCN Red List is a critical tool to this end, with its explicit and objective system classifying species according to their extinction risk [10,11]. Global Red List assessments are the culminative product of all best available data at the time relating to the extinction risk of species, making them a powerful means to inform conservation on a large-scale [12]. Conservation policy, however, is largely enacted at the national level [13], and guidelines for national Red List assessments were developed to support the objective and comparable assessment of the conservation status of species within a particular region or nation boundary [14].
Small island developing states (SIDS) are home to some of the greatest levels of biodiversity in the world, regarded as making contributions to global biodiversity disproportionate to their size [15]. SIDS tend to be areas that are most dependent on natural resources but where the capacity to sustainably manage those resources is lowest [16,17,18]. As threats to biodiversity persist, these developing states stand to lose the most from the continued degradation of natural resources [19]. This makes SIDS prime candidates for the application of conservation tools such as national Red Lists. National Red List assessments have the advantage of focusing the scale of assessments to correspond with localised threats, and are a valuable tool in achieving species conservation. National Red Lists, however, are not coordinated and compiled by IUCN, and all processes associated with the production of the species assessments must be completed by experts, scientists and/or conservation practitioners in the country. This requires the mobilisation of significant human and financial resources; assessments take time to produce and their outputs depend on the availability and quality of local data. This can make such assessments infeasible or impractical in SIDS, for example, where resources and data are often limited.
The present study investigates the value of global Red List data to inform localised research and conservation priorities where national assessments remain unavailable. By compiling data from these publicly available assessments, it is possible to generate a conservation status assessment of an area or site, relative to the global extinction risk of the biodiversity therein. This can then be used to inform localised research priorities, conservation activities and marine protected area design and zonation, for example. Crucially, such assessments can also be upscaled to identify data gaps and inform species priorities at the national level.
The Republic of Seychelles is a small island developing state in the Western Indian Ocean comprised of 115 mostly uninhabited islands. The nation’s land mass accounts for only 455 km2, but its exclusive economic zone stretches across 1.37 million km2 [20,21]. The country’s economy is largely centred around two sectors, fisheries and tourism [22], the latter of which is mostly marine-focused. Tourism contributes 26% to the global domestic product of Seychelles and fisheries is a vital sector for national food security [23]. Given the nation’s vast marine area and reliance on marine resources, assessing marine species conservation priorities should be valuable. Sustainable development goal (SDG) number 14 focuses on the conservation and sustainable use of ocean resources and is particularly important for African island states in the Indian Ocean [18]. However, there are currently no national Red List assessment efforts underway in Seychelles. For this study, a site-specific conservation status assessment was produced for the D’Arros Island and St Joseph atoll site in Seychelles. Research conducted at the site for over fifteen years has evidenced the high level of biodiversity around the islands and the importance of local habitats to marine life across the broader region [24,25,26,27,28,29]. A rapid biodiversity assessment conducted at D’Arros and St Joseph in 2017 showed that species recorded at the site constituted almost two thirds of all reef-associated species documented in Seychelles to date [26]. This makes the area ideal to not only assess both site-specific research and conservation priorities for marine species, but also to provide a representative assessment of the conservation status of marine biodiversity across Seychelles. Both D’Arros and St Joseph were recently formally gazetted as marine protected areas (MPAs) by the Seychelles government (Official Gazette No 34—Ministry of Agriculture, Climate Change and Environment, 2020), as part of a broader MPA network and commitment to protect 30% of the nation’s EEZ [22]. This means that findings here should offer valuable information to help refine the implementation process for these MPAs. Finally, such an assessment as described herein could help identify species priorities and catalyse more targeted and achievable national Red Listing efforts in the future. Specifically, the study approaches four objectives, to: (1) assess the global conservation status of the marine vertebrate biodiversity of the site, identifying key threats as well as research and conservation needs; (2) evaluate trends in the distribution and habitat use of marine species at the site; (3) produce theoretical national Red List assessments for all threatened and near threatened species to assess the relevance of global assessments at a localised scale; and (4) consider these findings within the context of research prioritisation and conservation application on a national scale in Seychelles.
2. Methods
The D’Arros Island and St Joseph atoll site (5.43° S, 53.35° E) are located in the centre of the Amirante Island group of the Republic of Seychelles in the Western Indian Ocean (Figure 1). This site has hosted research activities for over two decades, and surveys have produced a comprehensive record of marine species. In 2020, both D’Arros Island and St Joseph atoll were officially gazetted as MPAs, with D’Arros receiving a ‘Zone 1′ designation and St Joseph Atoll being part of a larger ‘Zone 2′ designation (Official Gazette No 34—Ministry of Agriculture, Climate Change and Environment, 2020). A Zone 1 site represents a high biodiversity protection area and is designated for the conservation and protection of habitats and species that may be rare, endangered, unique, or with narrow distribution ranges. A Zone 2 site gains medium biodiversity protection and sustainable use, and is an area where conservation and some level of extraction and seabed alteration can take place (Seychelles Marine Spatial Plan—Zoning Framework).
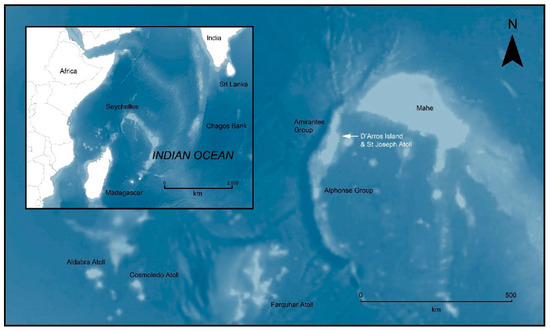
Figure 1.
Map displaying the D’Arros island and St Joseph atoll site, situated on the Amirantes bank, Republic of Seychelles. Inset displays broader geographic reference in Western Indian Ocean. Map created in ArcGIS 10.5 using GEBCO_08 bathymetry data: GEBCO Compilation Group (2020) GEBCO 2020 Grid (doi:10.5285/a29c5465-b138-234d-e053-6c86abc040b9).
The species list compiled for this assessment comprises all known marine vertebrate biodiversity of D’Arros and St Joseph and is largely taken from the 2017 rapid biodiversity assessment [26]. The list of 514 fish and elasmobranch (sharks and rays) species was supplemented here with the inclusion of newly described fish species occupying the area and all other marine vertebrate species known to use the site, as based on research and local knowledge.
Species conservation status were derived from published IUCN global Red List assessments for each species [30], with the exception of those listed as Not Evaluated, for which no assessment has been produced. Red List assessments are compiled by species experts and externally reviewed before being published on the IUCN Red List website (iucnredlist.org accessed on 30 June 2022). The product of each assessment is a Red List Category that indicates a species current risk of extinction. There are nine global categories. Critically Endangered (CR), Endangered (EN) and Vulnerable (VU) categories include all species currently deemed to be at a high risk of extinction, with the Critically Endangered category representing the highest risk. These are known as the threatened categories. A species qualifies for a threatened category by meeting quantitative thresholds for at least one of five IUCN Criteria (A–E: [10]). These criteria evaluate population decline (A), restricted geographic distribution (B), small population size and decline (C), very small or restricted population size (D), and high probability of potential extinction (E) [10,31]. Near Threatened (NT) species are those that almost meet the quantitative thresholds to qualify as threatened. Least Concern (LC) applies to species that do not qualify for (and are not close to qualifying for) a threatened category. Least Concern species are often those that are broad ranging and occur in large numbers with no known major threats. The Data Deficient category (DD) is assigned to those species for which an assessment has been conducted but there is not enough information to make a judgement on its risk of extinction. Not Evaluated (NE) is the category given to all species that have not yet been through the Red List assessment process and where the conservation status is unknown. Extinct in the Wild (EW) species only exist in ex situ environments, no longer found in the wild, and Extinct (EX) species, through exhaustive survey, are deemed to no longer exist [11].
All species listed as threatened (CR, EN, VU), or Near Threatened (NT), were combined and treated as species of ‘elevated risk’ for the purpose of this study, henceforth abbreviated to ER. To account for uncertainty in the status of DD and NE species, a range of estimates were calculated for the total number of ER species. Lower, upper and best estimates were all calculated. The lower estimate assumed no DD and NE species were classified as ER [(CR + EN + VU + NT)/(total assessed)], and the upper estimate assumed all DD and NE species were classified as ER [(CR + EN + VU + NT + DD + NE)/(total assessed)]. The best estimate represented the total percentage of ER species if the same proportion of DD and NE species are Threatened or Near Threatened [(CR + EN + VU + NT)/(total assessed − DD − NE)] as in [32,33].
Summary statistics were compiled and species-specific information on population trends and threat types were taken from coded information included in Red List assessments. Species were grouped as either ‘high residency’ or ‘low residency’ based on their time spent using the site at any life stage. Species that spend prolonged periods at the site over the year, correlating with repeated seasonal occurrence (≥3 months), or remaining on site year-round at any life stage, were listed as high residency, and all others not meeting this criterion were listed as low residency. Classification of residency was based on long-term survey data, published literature and local scientific knowledge. IUCN Red List assessments compile classifications of research and conservation needs for each species assessed. For this study, data from these coded research and conservation needs were compared across ER species to help inform and direct priorities.
A detailed habitat map of the study site, including all major marine habitat types, was generated from n + p biologists (www.nplusp.ch accessed on 30 June 2022) using supervised image classification of 2 m 8 band MS 16-bit orthorectified WorldView-2 high-resolution satellite images from LAND INFO Worldwide Mapping, LLC (Denver, CO, USA), and is Copyright Save Our Seas Foundation.
Species richness analyses were produced to assess patterns in habitat use of marine vertebrate biodiversity within the study site. Though some species cover large areas beyond the study area, the purpose of the analysis in this case was to better understand species habitat use within these MPAs. Every species was assigned a value of “1” or “0” for its presence or absence in each habitat type (1: Lagoon, 2: Seagrass and macroalgae, 3: Coral reef, 4: Deep-water). Species were assigned to habitat types based on their ecology and known habitat preferences (taken from Red List assessments and published literature), as well as local knowledge. Sums of species presence in different habitat types were mapped to the study site in ArcMap v10.6.1 (Esri Corp., Redlands, CA, USA).
Finally, theoretical national assessments were produced for all ER species for comparison against global assessments. National assessments were compiled using best available data in Seychelles and applied using ‘Guidelines for Application of IUCN Red List Criteria at Regional and National Levels’ [34]. Comparisons were made between global and theoretical national assessments to help identify species priorities and important data gaps.
3. Results
A total list of 524 species comprises the known marine vertebrate diversity of the site, including marine fish, sharks and rays, sea turtles, whales and dolphins. Overall, 5.3–22.9% of all marine vertebrate species of the D’Arros Island and St Joseph atoll marine area were estimated as being categorized as ER. A best estimate of 6.5% was calculated, incorporating uncertainty around the status of DD and NE species. Twenty-eight marine vertebrate species occurring at the site are currently classified as either Threatened (CR, EN, VU) or Near Threatened (NT) by the IUCN Red List, and thus listed as ER here (Table 1). Of all ER species, 82.1% (23 of 28) were considered highly resident to D’Arros Island and St Joseph atoll. Taxonomically, by order, the number of ER species varies between species groups with some groups comprised entirely of ER species and others exclusively being of Least Concern. Six of twenty-eight taxonomic groups had >80% ER species contribution, and thirteen of twenty-eight groups contained >80% LC species (Figure 2). All sharks and rays were listed as ER and they comprise two thirds (67.9%) of all ER species using the site. 28.6% of all cetacean species known from the islands are listed as ER, and hawksbill and green turtles are listed as CR and EN, respectively. Comparatively, only 1.2% of teleost fish are listed as ER (five species), including the humphead wrasse (EN), shortjaw bonefish (VU), camouflage grouper (VU), brown-marbled grouper (VU), and chevron butterflyfish (NT). All threatened species are listed under Criterion A due to past, present, or predicted declines in their global populations, and all but two ER species were, at the time of their respective assessments, experiencing a decreasing population trend. Twenty-six different threatening activities were recorded as impacting species populations globally, but fishing, at varying scales, is highlighted as a ubiquitous threat across all ER species. Sharks and rays are most impacted by fishing, with fishing threats contributing to 89.6% of total recorded threats to them. Unintentional impacts from fishing alone, via bycatch, constitutes more than half of all threatening activities impacting the global populations of the shark and ray species found at D’Arros and St Joseph. Beyond fishing threats, natural systems modification, agriculture and aquaculture were also found to impact more than 10% of ER species.

Table 1.
List of ER species using the D’Arros and St Joseph site. Global Red List categories and criteria, as well as global population trend, were taken from current Red List assessments for each species. National Red List categories and criteria were based on theoretical national assessments conducted for each ER species, using IUCN guidelines and best available data.
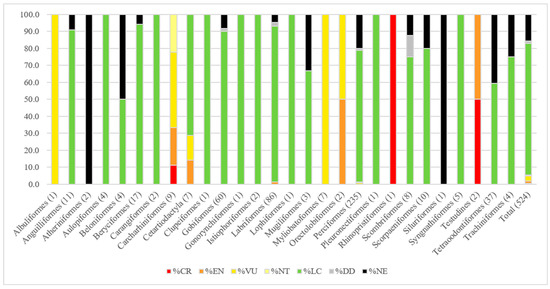
Figure 2.
Percentage of species in different Red List categories, arranged taxonomically, by order, with number of species in each order included in parentheses.
Data from coded research needs show that the majority (>50%) of species require research into the size, distribution and trends of their populations, ongoing monitoring of population trends, as well as research into species life history and ecology. Site/area protection and species management were identified as conservation needs for the majority of species (Figure 3).
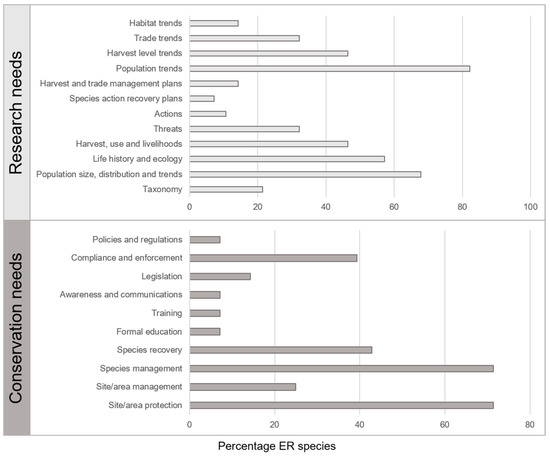
Figure 3.
Listed research and conservation needs for all ER species, presented as percentage of species requiring a particular research or conservation action.
Species richness analyses identified patterns in habitats use across the study site for all marine vertebrate biodiversity (Figure 4a). Overall, reef areas are used by the majority of species (92.7%) and almost half of all species occupy the St Joseph lagoon (44.7%). Seagrass and deep-water areas are used by 18.5 and 12.6% of all species, respectively. For ER species, analyses show that that deep-water and reef areas are used by most (85.2 and 81.5%, respectively) (Figure 4b). The lagoon habitat is used by more than half of all ER species (55.6%) and seagrass habitats by more than a third (40.1%).
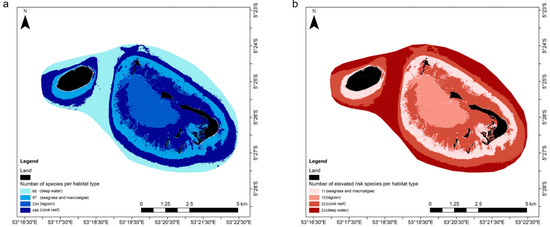
Figure 4.
Species richness map of D’Arros and St Joseph for (a) all species and (b) ER species, with major marine habitat types displayed. Lighter to darker colour represents increasing number of species using the habitat type.
Theoretical national Red List assessments of all ER species showed that the majority of species remained in the same category as their respective global assessments (67.9%). Nine species required adjustment from global Red List categories, with six species being uplisted and three downlisted (Table 1, for assessments see Supplementary Material). Five of the six uplisted species were sharks, and inferred or suspected population declines due to overfishing and/or reliance on coral reef habitats were the major drivers for these uplistings.
4. Discussion
This study demonstrates the applicability of freely available global Red List data to delineate site-specific research and conservation priorities, as well as providing information relevant to national-scale conservation decision-making. Findings here highlight that sharks and rays comprise the majority of ER species using the D’Arros and St Joseph site, with all sharks and ray species being listed as ER. Comparatively, across the Western Indian Ocean, a best estimate of 43% of the 243 species of occurring sharks and rays were deemed threatened [33]. This suggests that D’Arros and St Joseph represent an important area for globally threatened sharks and rays, and the site could be a good candidate for inclusion in discrete areas of significance, such as Key Biodiversity Areas [35], or the Important Shark and Ray Areas currently in development (ISRAs: sharkrayareas.org/isra). Further, the timely implementation of the recently gazetted MPAs will be important for ensuring the protection of this particular site.
Compilation of coded research needs highlighted the need for population data in ER species. Future research might seek to quantify the population-level significance of this area (and others like it in Seychelles) for elasmobranchs and other ER species through long-term mark-recapture studies and genetic sampling. Novel methods to improve the resolution of mark-recapture experiments [36] offer reliable means to estimate population sizes of species [37]. Such information is critical to the application of Red List Criterion A, which considers declines in species populations and under which, most threatened marine fish species are assessed [11]. Key global conservation needs identified for ER species were species management (via harvest management) and site/area protection. Regarding species management, fishing threats were shown here to be dominant drivers of global population decline and extinction risk in the site’s vertebrate biodiversity, particularly its shark and ray species. In Seychelles, though species-specific data are lacking, significant declines in shark stocks have been reported, and shark populations in Seychelles have been exploited to such an extent that populations were considered over-exploited by the end of the 1950s [20,38,39]. Seychelles banned the finning of sharks by foreign vessels in 2006, though the effectiveness of these bans has not been confirmed [20]. Illegal, unreported and unregulated (IUU) fishing also constitutes a major problem for elasmobranch species conservation globally [40], and IUU fishing continues to be reported across Seychelles [20,41]. Various measures are necessary in order to mitigate population declines in both globally and nationally threatened species. Appropriate catch limits, measures to reduce shark bycatch and refinement in the quality, resolution and recording of fisheries data could all help to improve the status of sharks and rays in Seychelles. Relating to site/area protection, particularly in the face of pervasive fishing threats, tropical coastal habitats can be vital areas for many elasmobranch species [42,43,44]. Sites such as D’Arros and St Joseph can offer import refugia and nursery areas which help maintain elasmobranch populations. Indeed, much research has already evidenced the importance of these islands in this regard to many of the ER elasmobranch species [25,27,45,46], and the high degree of site residency amongst ER species further underscores the site’s conservation importance and the necessity to ensure its protection.
Marine protected areas are a valuable tool for protecting species, supporting populations and mitigating biodiversity loss, however, MPA placement should be informed of where protected areas interact with threats that they can effectively mitigate [47]. Mapping threatened species habitat use provides insightful means to inform decisions on human activities and space use within the context of marine spatial planning and MPA management. Here, species richness analyses across habitat types evidenced the importance of reef areas to the biodiversity of the site and the significance of their inclusion within MPA boundaries. Interestingly, analysis of only ER species also highlighted the importance of adjacent deep-water areas that are often less likely to be factored into MPA design. Many of the ER shark and ray species using the D’Arros and St Joseph site are resident and spend a large amount of time over the reef and in other internal habitats, but all 16 ‘high residency’ ER elasmobranch species also use the deep-water areas adjacent to the reefs. Though some of these species move far offshore, research at D’Arros and St Joseph shows that many remain close to the island for prolonged periods, showing high site fidelity [25,48]. MPAs are diverse in their design and function, many allowing ‘conditional uses’ within their boundaries, rather than complete prohibition of activities. Seychelles has recently committed to protecting 30% of its waters in a “debt-for-nature” swap program with the Nature Conservancy. The country aims to achieve this commitment, at least in part, through the designation of a network of MPAs [22] Findings here offer insights that could help refine protected area placement moving forward. The implementation of the Seychelles Marine Spatial Plan (SMSP) is currently underway, and in the design and zonation of its MPAs, it could offer a significant benefit to the protection of coastal elasmobranch species, as well as many other reef-associated species, if areas of higher protection and stricter usage limits extended to include a fringing zone of deep-water adjacent to coral reef and other coastal habitats. Generally, the quantification of habitat use by threatened species using a particular site, as presented here, offers much to help tailor MPA design and implementation.
The extinction risk category assigned to a species through a global Red List assessment is relative to the global-scale threats that the species faces. This means that care must be taken when interpreting the data and information in global assessments when applied to a particular country or region. In some cases, species globally listed as Critically Endangered might be listed as Least Concern in a national assessment and vice versa. More often, however, global and national assessments concur [49] and this means global data can offer insights into potential species conservation priorities on a national scale, especially where national assessments remain unavailable. Here, theoretical national assessments showed that the majority of globally ER species remained in the same Red List category as their respective national assessment. This supports findings in Brito et al. (2010) and suggests that global assessments can represent a suitable indicator for national conservation priorities for marine species in Seychelles. Though national Red List assessments are ultimately a more refined tool for accurately categorizing species conservation status at a national scale, given the restrictions in their application, global data offer a rapid and relatively robust means to identify species priorities that can help to define more targeted, and thus more feasible, national assessment processes in the future. Here, nine species did warrant a change in category, with six species, mostly sharks, uplisted into higher threat categories. Any future national Red Listing efforts in Seychelles should consider sharks and rays as a species group of precedence. Species-specific population and fisheries data will help improve resolution of estimates relating to their national conservation status.
5. Conclusions
Generally, this study presents a computationally and statistically straightforward approach to produce site-specific assessments that are informed by globally relevant conservation data and that have value in optimising national-scale conservation. Sharks and rays are highlighted as a key threatened species group, both within the study site and across the Seychelles. Research into their populations is a prime concern for scientists in the country. MPA boundaries could be tailored to maximise their efficacy for threatened species, and potential future national Red Listing efforts should prioritise the assessment of sharks and rays in Seychelles.
Supplementary Materials
The following supporting information can be downloaded at: https://www.mdpi.com/article/10.3390/d14080681/s1, Table S1: Species list with habitat classifications; PDF S2: Theoretical national Red List assessments—Seychelles ER species.
Author Contributions
R.W.B.: Conceptualization (equal), Methodology, Data Curation, Investigation, Resources, Formal Analysis (lead), Writing—Original Draft, Writing—Review and Editing, Visualization; H.M.V.G.: Conceptualization (equal), Methodology, Resources, Formal Analysis (supporting), Writing—Review and Editing, Visualization; E.E.M.: Methodology, Resources, Formal Analysis (supporting), Writing—Review and Editing, Visualization; D.K.P.: Methodology, Resources, Formal Analysis (supporting), Writing—Review and Editing, Visualization; J.S.E.L.: Conceptualization (equal), Methodology, Resources, Formal Analysis (supporting), Writing—Review and Editing, Visualization, Supervision. All authors have read and agreed to the published version of the manuscript.
Funding
The D’Arros Research Centre is owned by, and operates under, the banner of the Save Our Seas Foundation and, as such, all research activities are funded by the foundation. The funding source had no involvement in the collection, interpretation and/or analysis of material, nor in the writing of the report. The funding source did have involvement in the decision to submit the article for publication.
Institutional Review Board Statement
Not applicable.
Data Availability Statement
Not applicable.
Acknowledgments
The authors would like to acknowledge Gina Ralph for her assistance in producing the species maps. We would also like to acknowledge and thank the founder of the Save Our Seas Foundation for providing all facilities for this work.
Conflicts of Interest
The authors declare no conflict of interest.
References
- Reynolds, J.D.; Dulvy, N.K.; Goodwin, N.B.; Hutchings, J.A. Biology of extinction risk in marine fishes. Proc. R. Soc. B 2005, 272, 1579. [Google Scholar] [CrossRef] [PubMed] [Green Version]
- Halpern, B.S.; Walbridge, S.; Selkoe, K.A.; Kappel, C.V.; Micheli, F.; D’Agrosa, C.; Bruno, J.F.; Casey, K.S.; Ebert, C.; Fox, H.E.; et al. A Global Map of Human Impacts on Marine Ecosystems. Science 2008, 319, 948–952. [Google Scholar] [CrossRef] [PubMed] [Green Version]
- Butchart, S.H.M.; Walpole, M.; Collen, B.; van Strien, A.; Scharlemann, J.P.W.; Almond, R.E.A.; Baillie, J.E.M.; Bomhard, B.; Brown, C.; Brunox, J.; et al. Global Biodiversity: Indicators of Recent Declines. Science 2010, 328, 1164–1168. [Google Scholar] [CrossRef] [PubMed]
- Selig, E.R.; Turner, W.R.; Troeng, S.; Wallace, B.P.; Halpern, B.S.; Kaschner, K.; Lascelles, B.G.; Carpenter, K.E.; Mittermeier, R.A. Global Priorities for Marine Biodiversity Conservation. PLoS ONE 2014, 9, e82898. [Google Scholar] [CrossRef] [PubMed]
- Halpern, B.S.; Frazier, M.; Potapenko, J.; Casey, K.S.; Koenig, K.; Longo, C.; Lowndes, J.S.; Rockwood, R.C.; Selig, E.R.; Selkoe, K.A.; et al. Spatial and temporal changes in cumulative human impacts on the world’s oceans. Nat. Commun. 2015, 6, 7615. [Google Scholar] [CrossRef] [PubMed] [Green Version]
- MacNeil, M.A.; Chapman, D.D.; Heupel, M.; Simpfendorfer, C.A.; Heithaus, M.; Meekan, M.; Harvey, E.; Goetze, J.; Kiszka, J.; Bond, M.E.; et al. Global status and conservation potential of reef sharks. Nature 2020, 583, 801–806. [Google Scholar] [CrossRef]
- Pacoureau, N.; Rigby, C.L.; Kyne, P.M.; Sherley, R.B.; Winker, H.; Carlson, J.K.; Fordham, S.V.; Barreto, R.; Fernando, D.; Francis, M.P.; et al. Half a Century of Global Decline in Oceanic Sharks and Rays. Nature 2021, 589, 567–571. [Google Scholar] [CrossRef]
- Cooke, S.J. Biotelemetry and biologging in endangered species research and animal conservation: Relevance to regional, national and IUCN Red List threat assessments. Endanger. Species Res. 2008, 4, 165–185. [Google Scholar] [CrossRef] [Green Version]
- Baillie, J.E.M.; Butcher, E.R. Priceless or Worthless: The World’s Most Threatened Species; Zoological Society of London: London, UK, 2012. [Google Scholar]
- Mace, G.M.; Collar, N.G.; Gaston, K.J.; Hilton-Taylor, C.; Akcakaya, H.R.; Leader-Williams, N.; Milner-Gulland, E.J.; Stuart, S.N. Quantification of Extinction Risk: IUCN’s System for Classifying Threatened Species. Conserv. Biol. 2008, 22, 1424–1442. [Google Scholar] [CrossRef]
- IUCN. IUCN Red List Categories and Criteria: Version 3.1, 2nd ed.; IUCN: Gland, Switzerland; Cambridge, UK, 2012; p. iv + 32.
- Rodrigues, A.S.L.; Pilgrim, J.D.; Lamoreux, J.F.; Hoffmann, M.; Brooks, T.M. The Value of IUCN Red List for Conservation. Trends Ecol. Evol. 2006, 21, 71–76. [Google Scholar] [CrossRef]
- Rodriguez, J.P. National Red Lists: The largest global market for IUCN Red List Categories and Criteria. Endanger. Species Res. 2008, 6, 193–198. [Google Scholar] [CrossRef]
- Miller, R.M.; Rodriguez, J.P.; Aniskowicz-Fowler, T.; Bambardeniya, C.; Boles, R.; Eaton, M.A.; Gardenfors, U.; Keller, V.; Molur, S.; Walker Pollock, C. National Threatened Species Listing Based on IUCN Criteria and Regional Guidelines: Current Status and Future Perspectives. Conserv. Biol. 2007, 21, 684–696. [Google Scholar] [CrossRef] [PubMed]
- UN-OHRLLS. Small Island Developing States in Numbers: Biodiversity and Oceans; United Nations Office of the High Representative for the Least Developed Countries, Landlocked Developing Countries and Small Island Developing States: New York, NY, USA, 2017. [Google Scholar]
- Barlow, J.; França, F.; Gardner, T.A.; Hicks, C.C.; Lennox, G.D.; Berenguer, E.; Castello, L.; Economo, E.P.; Ferreira, J.; Guénard, B.; et al. The future of hyperdiverse tropical ecosystems. Nature 2018, 559, 517–526. [Google Scholar] [CrossRef] [PubMed]
- Schutter, M.S.; Hicks, C.C. Networking the Blue Economy in Seychelles: Pioneers, resistance and the power of influence. J. Political Ecol. 2019, 26, 323–465. [Google Scholar]
- Techera, E.J.; Appadoo, K.A. Achieving SDG 14 in the African Small Island Developing States of the Indian Ocean. In Africa and the Sustainable Development Goals; Springer: Cham, Switzerland, 2019; pp. 219–227. [Google Scholar]
- Teelucksingh, S.S.; Nunes, P.A.L.D. Biodiversity Valuation in Developing Countries: A Focus on Small Island Developing States (SIDS). FEEM Working Paper No. 111.2010. 2021. Available online: https://ssrn.com/abstract=1688302 (accessed on 15 June 2022).
- Nevill, J.; Robison, J.; Giroux, F.; Isidore, M. Seychelles National Plan of Action for the Conservation and Management of Sharks; Seychelles Fishing Authority: Victoria, Seychelles, 2007.
- Mason-Parker, C.; Daly, R.; Keating, C.; Stevens, G. Reef Fishes of Seychelles; John Beaufoy Publishing Limited: Oxford, UK, 2021. [Google Scholar]
- Silver, J.J.; Campbell, L.M. Conservation, development and the blue frontier: The Republic of Seychelles’ Debt Restructuring for Marine Conservation and Climate Adaptation Program. Int. Soc. Sci. J. 2018, in press. [CrossRef]
- Government of Seychelles. Fifth National Report to the United Nations Convention on Biological Diversity; Ministry of Environment and Energy: Victoria, Republic of Seychelles, 2014.
- Mortimer, J.A.; Camille J-CAnd Boniface, N. Seasonality and Status of Nesting Hawksbill (Eretmochelys imbricata) and Green Turtles (Chelonia mydas) at D’Arros Island, Amirantes Group, Seychelles. Chelonian Conserv. Biol. 2011, 10, 26–33. [Google Scholar] [CrossRef]
- Lea, J.S.E.; Humphries, N.E.; von Brandis, R.; Clarke, C.R.; Sims, D.W. Acoustic telemetry and network analysis reveal the space use of multiple reef predators and enhance marine protected area design. Proc. R. Soc. B 2016, 283, 1834. [Google Scholar] [CrossRef]
- Daly, R.; Stevens, G.; Keating-Daly, C. Rapid marine biodiversity assessment records 16 new marine fish species for Seychelles, Western Indian Ocean. Mar. Biodivers. Rec. 2018, 11, 6. [Google Scholar] [CrossRef]
- Weideli, O.C.; Papastamatiou, Y.P.; Planes, S. Size frequency, dispersal and variable growth rates of young sharks in a multi-species aggregation. J. Fish Biol. 2019, 94, 789–797. [Google Scholar] [CrossRef]
- Peel, L.R.; Stevens, G.M.W.; Daly, R.; Keating Daly, C.; Colin, S.P.; Nogues, J.; Meekan, M. Regional Movements of Reef Manta Rays (Mobula alfredi) in Seychelles Waters. Front. Mar. Sci. 2020, 7, 558. [Google Scholar] [CrossRef]
- Daly, R.; Filmalter, J.D.; Peel, L.R.; Mann, B.Q.; Lea, J.; Clarke, C.R.; Cowley, P.D. Ontogenetic Shifts in Home Range Size of a Top Predatory Reef-associated Fish (Caranx ignoblis): Implications for Conservation. Mar. Ecol. Prog. Ser. 2021, 664, 165–182. [Google Scholar] [CrossRef]
- IUCN. The IUCN Red List of Threatened Species. Version 2020-2. 2020. Available online: https://www.iucnredlist.org (accessed on 25 June 2022).
- Akçakaya, H.R.; Ferson, S.; Burgman, M.A.; Keith, D.A.; Mace, G.M.; Todd, C.R. Making consistent IUCN classifications under uncertainty. Conserv. Biol. 2000, 14, 1001–1013. [Google Scholar] [CrossRef] [Green Version]
- Nieto, A.; Ralph, G.M.; Comeros-Raynal, M.T.; Kemp, J.; García Criado, M.; Allen, D.J.; Dulvy, N.K.; Walls, R.H.L.; Russell, B.; Pollard, D.; et al. European Red List of Marine Fishes; Publications Office of the European Union: Luxembourg, 2015.
- Bullock, R.; Ralph, G.; Stump, E.; Al Abdali, F.; Al Asfoor, J.; Al Buwaiqi, B.; Al Kindi, A.; Ambuali, A.; Birge, T.; Borsa, P.; et al. The Conservation Status of Marine Biodiversity of the Western Indian Ocean; IUCN: Gland, Switzerland, 2021; p. vii + 32. [Google Scholar]
- IUCN. Guidelines for Application of IUCN Red List Criteria at Regional and National Levels: Version 4.0; IUCN: Gland, Switzerland; Cambridge, UK, 2012; p. iii + 41. [Google Scholar]
- Eken, G.; Bennun, L.; Brooks, T.M.; Darwall, W.; Fishpool, L.D.C.; Foster, W.; Knox, D.; Langhammer, P.; Matiku, P.; Radford, E.; et al. Key Biodiversity Areas as Site Conservation Targets. BioScience 2004, 54, 1110–1118. [Google Scholar] [CrossRef] [Green Version]
- Bravington, M.V.; Skaug, H.J.; Anderson, E.C. Close-kin Mark Recapture. Stat. Sci. 2016, 31, 259–274. [Google Scholar] [CrossRef]
- Ruzzante, D.E.; McCracken, G.R.; Forland, B.; MacMillan, J.; Notte, D.; Buhariwalla, C.; Flemming, J.M.; Skaug, H. Validation of close-kin mark recapture (CKMR) methods for estimating population abundance. Methods Ecol. Evol. 2019, 10, 1445–1453. [Google Scholar] [CrossRef]
- Marshall, N.T. The Seychelles shark fishery. In The Trade in Sharks and Shark Products in the Western Indian and Southern Indian and South East Atlantic Oceans; Marshall, N.T., Barnett, R., Eds.; TRAFFIC International: Nairobi, Kenya, 1997; pp. 13–18. [Google Scholar]
- Le Manach, F.; Bach, P.; Boistol, L.; Robinson, J.; Pauly, D. Artisanal Fisheries in the World’s Second Largest Tuna Fishing Ground–Reconstruction of the Seychelles Marine Fisheries Catch, 1950–2010. In Fisheries Catch Reconstructions in the Western Indian Ocean, 1950–2010; Fisheries Centre Research Reports 23(2); Le Manach, F., Pauly, D., Eds.; Fisheries Centre, University of British Columbia: Vancouver, BC, Canada, 2015; ISSN 1198–6727. [Google Scholar]
- Petrossian, G.A. Preventing illegal, unreported and unregulated (IUU) fishing: A situational approach. Biol. Conserv. 2015, 189, 39–48. [Google Scholar] [CrossRef]
- Seychelles News Agency. Available online: http://www.seychellesnewsagency.com/articles/13367/ (accessed on 25 June 2022).
- Chapman, D.D.; Pikitch, E.K.; Babcock, E.; Shivji, M.S. Marine Reserve Design and Evaluation Using Automated Acoustic Telemetry: A Case-study Involving Coral Reef-associated Sharks in the Mesoamerican Caribbean. Mar. Technol. Soc. J. 2005, 39, 42–55. [Google Scholar] [CrossRef] [Green Version]
- Heupel, M.R.; Carlson, J.K.; Simpfendorfer, C. Shark nursery areas: Concepts, definitions, characterization and assumptions. Mar. Ecol. Prog. Ser. 2007, 337, 287–297. [Google Scholar] [CrossRef]
- Heithaus, M.R. Nursery areas as essential shark habitats: A theoretical perspective. Am. Fish. Soc. Symp. 2007, 50, 3–13. [Google Scholar]
- Elston, C.; Cowley, P.D.; von Brandis, R.G.; Fisk, A. Dietary niche differentiation in a mesopredatory dasyatid assemblage. Mar. Biol. 2020, 167, 89. [Google Scholar] [CrossRef]
- Lea, J.S.E.; Humphries, N.E.; Bortoluzzi, J.; Daly, R.; von Brandis, R.G.; Patel, E.; Patel, E.; Clarke, C.; Sims, D.W. At the Turn of the Tide: Space Use and Habitat Partitioning in Two Sympatric Shark Species is Driven by Tidal Phase. Front. Mar. Sci. 2020, 7, 624. [Google Scholar] [CrossRef]
- Kuempel, C.D.; Jones, K.R.; Watson, J.E.M.; Possingham, H.P. Quantifying biases in marine protected area placement relative to abatable threats. Conserv. Biol. 2019, 33, 1350–1359. [Google Scholar] [CrossRef] [PubMed] [Green Version]
- Peel, L.R.; Stevens, G.M.W.; Daly, R.; Keating Daly, C.A.; Lea, J.S.E.; Clarke, C.R.; Collin, S.P.; Meekan, M.G. Movement and residency patterns of reef manta rays Mobula alfredi in the Amirante Islands, Seychelles. Mar. Ecol. Prog. Ser. 2019, 621, 169–184. [Google Scholar] [CrossRef] [Green Version]
- Brito, D.; Ambal, R.G.; Brooks, T.; De Silva, N.; Foster, M.; Hao, W.; Hilton-Taylor, C.; Paglia, A.; Rodriguez, J.P.; Rodrigues, J.V. How similar are national red lists and the IUCN Red List? Biol. Conserv. 2010, 143, 1154–1158. [Google Scholar] [CrossRef]
Publisher’s Note: MDPI stays neutral with regard to jurisdictional claims in published maps and institutional affiliations. |
© 2022 by the authors. Licensee MDPI, Basel, Switzerland. This article is an open access article distributed under the terms and conditions of the Creative Commons Attribution (CC BY) license (https://creativecommons.org/licenses/by/4.0/).