Article

Runs of Homozygosity and Gene Identification in Pelibuey Sheep Using Genomic Data

by
Wilber Hernández-Montiel
1,*,
Nubia Noemi Cob-Calan
2,
Lilia E. Cahuich-Tzuc
3,
José A. Rueda
1,
Jorge Quiroz-Valiente
4,
Víctor Meza-Villalvazo
5 and
Roberto Zamora-Bustillos
3,*
1
Instituto de Agroingeniería, Universidad del Papaloapan, Av. Ferrocarril s/n, Ciudad Universitaria, Campus Loma Bonita, Oaxaca 68400, Oaxaca, Mexico
2
Instituto Tecnológico Superior de Calkiní en el Estado de Campeche Av. Ah-Canul S/N por Carretera Federal Campeche-Mérida, Calkiní 24900, Campeche, Mexico
3
TecNM/Instituto Tecnológico de Conkal, Av. Tecnológico S/N, Conkal 97345, Yucatán, Mexico
4
Instituto Nacional de Investigaciones Forestales, Agrícolas y Pecuaria (INIFAP), Campo Experimental Huimanguillo, Huimanguillo 86400, Tabasco, Mexico
5
Laboratorio de Biotecnología Animal, Universidad del Papaloapan, Circuito Central No. 200, Parque Industrial, Tuxtepec 68301, Oaxaca, Mexico
*
Authors to whom correspondence should be addressed.
Diversity 2022, 14(7), 522; https://doi.org/10.3390/d14070522
Submission received: 10 June 2022 / Revised: 22 June 2022 / Accepted: 24 June 2022 / Published: 28 June 2022

Abstract

:
The runs of homozygosity (ROHs), the inbreeding coefficient, and the effective population size (Ne) in Pelibuey sheep were analyzed in 24 Pelibuey ewes from two lambs at parturition and 24 ewes that gave birth to a single lamb using the Ilumina OvineSNP50 BeadChip. The Ne decreased from 535 to 192 in the first ten generations. A total of 2194 ROHs were identified on the basis of single nucleotide polymorphisms (SNPs), were identified in the prolific group and 2185 SNPs in ROH in the non-prolific group. The distribution of the lengths of the ROH, considering both groups, were found to be: 4065 less than 6 Mb, 213 between 6 and 12 Mb, 72 between 12 and 24 Mb, twenty between 24 and 48 Mb and 8 greater than 48 Mb. In prolific sheep, the ROH associated with prolificacy were identified near the LINGO2, FLRT2, ADGRB3 genes, related to “positive regulation of synapse assembly”; and the DGKG, DGKE, DGKB and DGKI genes, related to “protein kinase C-activating G-protein coupled receptor signaling pathway”. The present work present genes that can function as signal mediators or have activity in embryonic development, which is relevant to the economic activity of this species.

1. Introduction

The genetic diversity of domestic species allows humans to exploit these animals in different production systems [1]. However, domestic species must thrive and reproduce in environments modified by humans; e.g., through conducted artificial selection. Nonetheless, despite the environmental conditions, the productive traits exhibited are determined by both, their ancestors [2] and genetic variability [3].
The sheep was domesticated approximately 9000 years ago. Ever since, it has been among the most economically important domestic species [4]. The Pelibuey sheep is present in all the agroecological regions of Mexico, it was introduced to the Caribbean from the Canary Islands two centuries earlier [5]. It is one of the most important genetic resources for food production in Mexico, due to its high fertility (92%) and average prolificacy (1.2–1.5 lambs per ewe lambing) [6]. The increasing demand for sheep meat has led farmers to exploit hybrid vigor for improving traits of economic interest, through the practice of crossbreeding [7]. This has generated important changes in the genetic architecture of the population.
The understanding of the evolutionary adaptation of the species, as well as the conservation and the proper use of genetic resources, is essential in breeding programs [8]. Importantly, targeted selection based on specific genomic regions reduces both the diversity and the runs of homozygous loci [9].
Prolificacy is a trait of a quantitative nature [10], regulated by multiple genes that act on fertility and ovulation rate. However, inheritance of this type of traits occurs at a low rate [11]. The main genes associated with increased prolificacy in mammals are: the growth differentiation factor 9 (GDF9), the bone morphogenetic protein (BMP15), and the bone morphogenetic protein receptor IB (BMPR-IB) [12]. In sheep, various SNPs modify the ovulation rate and prolificacy [12,13]. SNPs are the result of single base substitutions, which allow the study of the genomic fragments in runs of homozygosity (ROH), the inbreeding coefficient (F), and Ne [14]. ROH are considered genomic regions that have been modified by selection, showing reduced genetic diversity and high homozygosity [15,16]. Genome-wide association studies (GWAS) have made it possible to understand the genetic mechanisms associated with prolificacy in sheep [17,18], as well as the identification of differentiated genomic regions (within the same breed or between breeds) [19]. ROH are blocks of hereditary homozygous haplotypes. These sections of DNA determine both the structure of the population and its evolution [9,20].
Furthermore, gene rearrangement is an important part of genomic structural variation [21]. It occurs as a result of deletions, insertions, duplications, inversions, or translocations in DNA [22,23]. The degree of structural variation determines the genetic diversity of a species and tends to be constant within each population. The latter represents a key aspect in terms of evolutionary adaptation [24]. Interestingly, a low magnitude of both ROH and the inbreeding coefficient would account for hybridization and gene flow induced by migration [25]. In Derivata di Siria goats and Maltese breeds, long blocks of ROH (>16 Mb) were found; which, according to the authors, may have a considerable effect on milk production [25]. In Laiwu pigs, Fang et al. [26], detected a total of 7508 ROHs larger than 1 Mb, with average length of 3.76 Mb. The short segments (1–5 Mb) predominated, which represents 78.46% of the total number of ROH. On the other hand, in Merino sheep, 6039 ROH larger than 1 Mb have been identified. The short segments (1–5 Mb and 5–10 Mb) predominated, representing 88.8% of the total. Interestingly, the identified genes (LCORL, FGF11 and TP53) were related to body size [27].
The objective of the present study was to identify genomic regions in ROH that have been subject of pressure by artificial selection, using medium-density SNP genotyping to identify genes related to prolificacy in Pelibuey sheep. The ROH regions in genes can be useful to characterize the populations of this breed and carry out better selection strategies and conservation of these sheep genetic resources.

2. Materials and Methods

2.1. Animals

The analysis was performed using a sample of 48 Pelibuey sheep: 24 prolific and 24 non-prolific, were obtained from four commercial sheep farms (Table 1). Each ewe was assigned to one of the two groups, based on production records from three consecutive lambing. The prolific females were those that registered two lambs per parturition, while the non-prolific ones were those that gave birth to a single lamb. This last group served as control, in accordance with Hernández-Montiel et al. [28]. Blood extraction was following the official Mexican standard (NOM-033-SAG/ZOO-2014).

2.2. Genotyping and Data Quality Control

The blood sample was obtained using a vacutainer tube with K2 EDTA 7.2 mg (Vacutainer Hemogar®), extracting 4 mL of blood from the jugular vein of each sheep. Genomic DNA was genotyped using the Illumina Ovine SNP50 BeadChip®. For data quality control, procedures were performed using PLINK v1.9 [29]. SNPs were removed based in call-rate ≥0.95, and SNPs with minor allele frequency (MAF) were eliminated (p-value ≥ 0.05) and the Hardy-Weinberg equilibrium was subsequently applied (p-value > 0.001).

2.3. Linkage Disequilibrium

Initially, a dataset containing 54,241 SNPs was filtered using the command ″–indep-pairwise option 50 5 0.5 [30], and excluding SNPs in Linkage Desequilibrium (LD). The calculation was carried out using a window of 50 SNPs shifted at a rate of five SNPs. Additionally, SNPs with r2 < 0.05 were removed. The genetic variation of the population was performed using the command: r2, ld, window 1000, ld-window-r2 0.8; in accordance with Abied et al. [8]. A list of LD was obtained using the SNeP v1.1 particularly, using the PLINK’s bfile formats [31].

2.4. Genetic Structure of the Population, Inbreeding Coefficient, and Effective Population Size

The genetic structure of the population was calculate using the het function in PLINK v1.9 [29]. F is the ratio of the SNP within an individual, relative to the He of the alleles and randomly drawn from the population [32]. F of an individual in subpopulation was calculated as Fis =  1 − Ho/He [33]; where He and Ho are the expected and observed heterozygotes, respectively. Subsequently, these values were averaged for both the case and control groups [9]. Historical trends in Ne were estimated using the SNeP v1.1 (Default parameters) [31], based on the extent of r2 within the length of each SNP, through the entire genome [14].

2.5. Detection of Runs of Homozygosity

The ROH detection was performed in a window of 20 SNPs (homo-zyg-window-snp 20), allowing no more than one missing SNP (homozyg-window-missing 1). The parameters were set as follows: minimum length of a ROH segment, 1 Mb (homozyg-kb 100); minimum SNP density, 1 SNP per 100 kb (homozyg-density 100); maximum gap between two consecutive SNPs, 1000 kb (homozyg-gap 1000); and rate at which a SNP was included in the scan window, p < 0.05 (homo-zyg-window-threshold 0.05) [29,30,34]. ROH were calculated for SNP-based consecutive detection and estimated for each animal, prior to size categorization (0–6 Mb, 6–12 Mb, 12–24 Mb, 24–48 Mb, >48 Mb). The calculation was carried out using the R package “detectRUNs” v0.9.6 [35]. The plots of ROH were obtained using the R package “DetectRUNs” v 0.9.6 [35].

2.6. Annotation of Significant Genomic Regions

Genes identified to be associated with SNP loci were aligned to confirm their original chromosome and physical location. The latter was carried out using the ovine reference genome OARv3.1 with the Visor genome data [17] (https://www.ncbi.nl/m.nih.gov/genome/gdv/?org=ovis-aries, accessed on 20 August 2021). A SNP was considered to belong to a particular gene if it mapped within it.

3. Results

3.1. Dataset

For the data quality control analysis 54,241 SNPs were available, from which 1702 presented a low call rate (<95%) and 94 markers were eliminated according to the HWE test (p < 0.001). The total genotyping rate in the remaining individuals was 0.9847, leaving a total of 53,356 SNPs from which 4394 were removed due to its low allele frequency (MAF ≥ 0.05). Therefore, only 48,683 SNPs passed the quality analysis. The density of the entire genome, according to the distribution of 48,683 SNPs, is shown in Figure 1.
The color gradient has been scaled considering all markers in ROH, i.e., green color for low density and red color for high density.

3.2. Linkage Disequilibrium (LD)

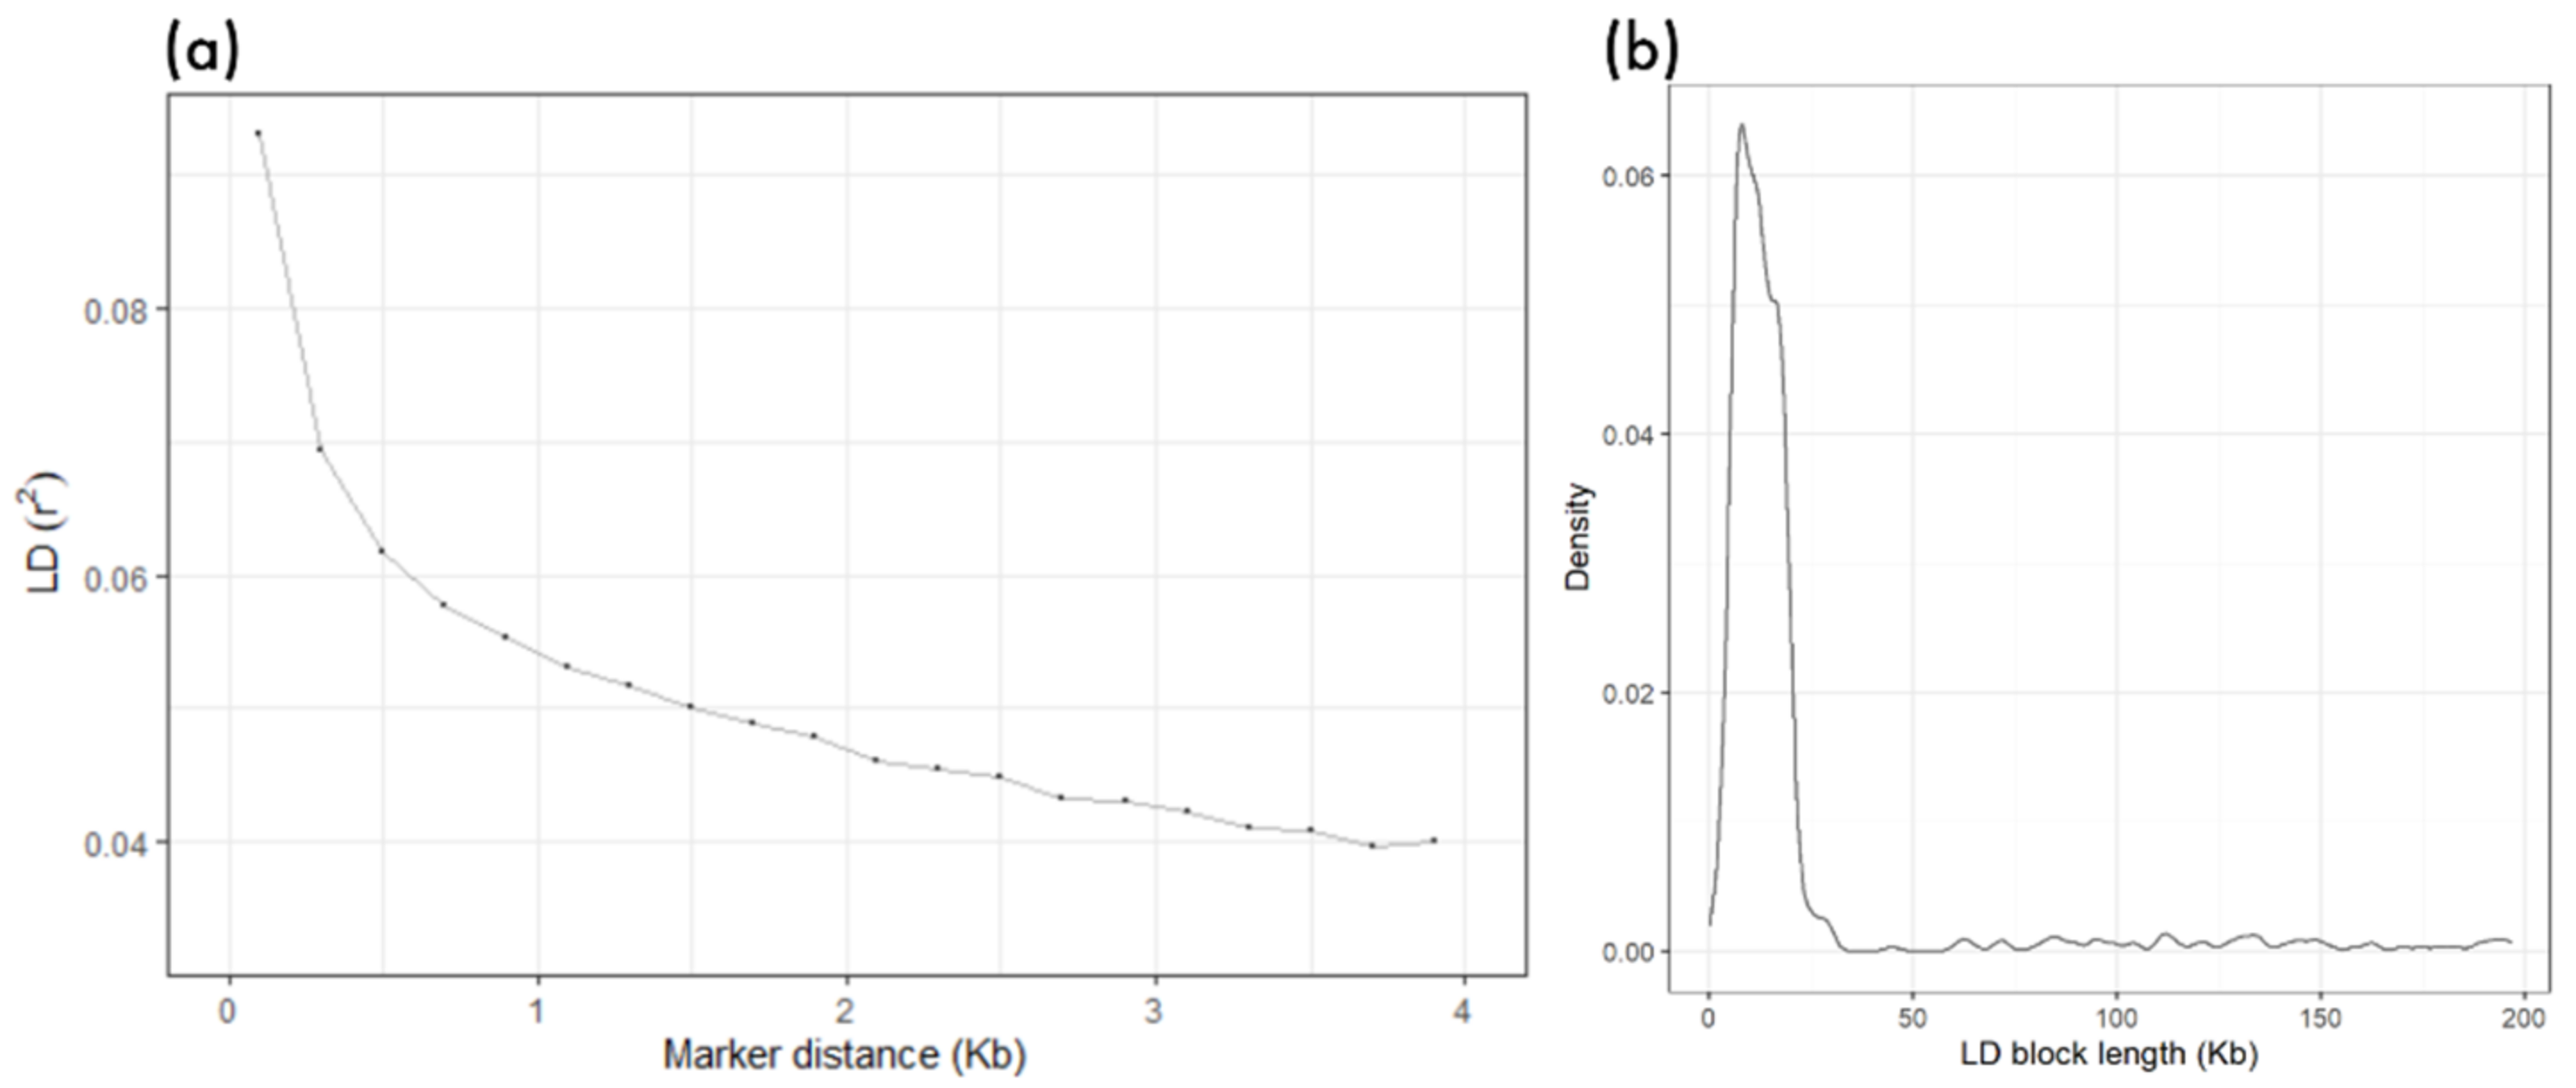
In the present study, a total of 1,797 SNPs were obtained, which were distributed in the 27 pairs of chromosomes. The LD levels decreased with increasing genomic distance between SNPs, as shown in Figure 2a,b. The indicated physical distance between SNPs is 100 kb to 1 Mb over the increase in the distance between markers in the population. The LD patron has been related to parameters of the population genetic structure. Moreover, LD can cause short and common ROH throughout the genome [36].

3.3. Genetic Diversity, Inbreeding Coefficient, and Effective Population Size

In this study, the mean inbreeding coefficient based on SNP was −0.044, 0.006, 0.064, and 0.001 for prolific ewes; and −0.026, −0.029, and 0.010 for non-prolific ewes (Table 2). This result indicates that there is an excess of heterozygotes. Interestingly, the excess of heterozygotes may be caused by interracial crossbreeding in previous generations.
We obtained a mean value F of −0.044 in the prolific group of the subpopulation El Cortijo, −0.026 and −0.029 in the non-prolific group of the subpopulations of San Alberto and the Potrancas. Interestingly, negative values of F were found in the non-prolific ewes, indicating a low value of outbreeding. However, a slight excess of heterozygotes was observed. On the other hand, positive values of F were found in the prolific ewes. Although, they moved away from each other with an excess of heterozygotes.
Analysis of Ne showed a total of 27 generations from 192 to 3,591 (Table S2), based on the average of the r2 calculated at the different SNP distances. Table 3 shows the Ne from 13 to 54 generations in the 27 chromosomes with MAF (p ≥ 0.05) and the necessary Ne from 535 to 192 in the first 54 generations (Table 3).
The study of Ne helps understand the evolutionary process of a species, by quantifying the rate at which genetic variability is eroded due to genetic drift [37].
In the present study we observed a decrease in Ne between generations. Preservation of genetic diversity is generally achieved by maximizing Ne, or equivalently, minimizing the rate of inbreeding in a population. Genomic selection may reduce the rate of inbreeding per generation, but could also lead to a higher rate of inbreeding per year [38].

3.4. ROH Identification

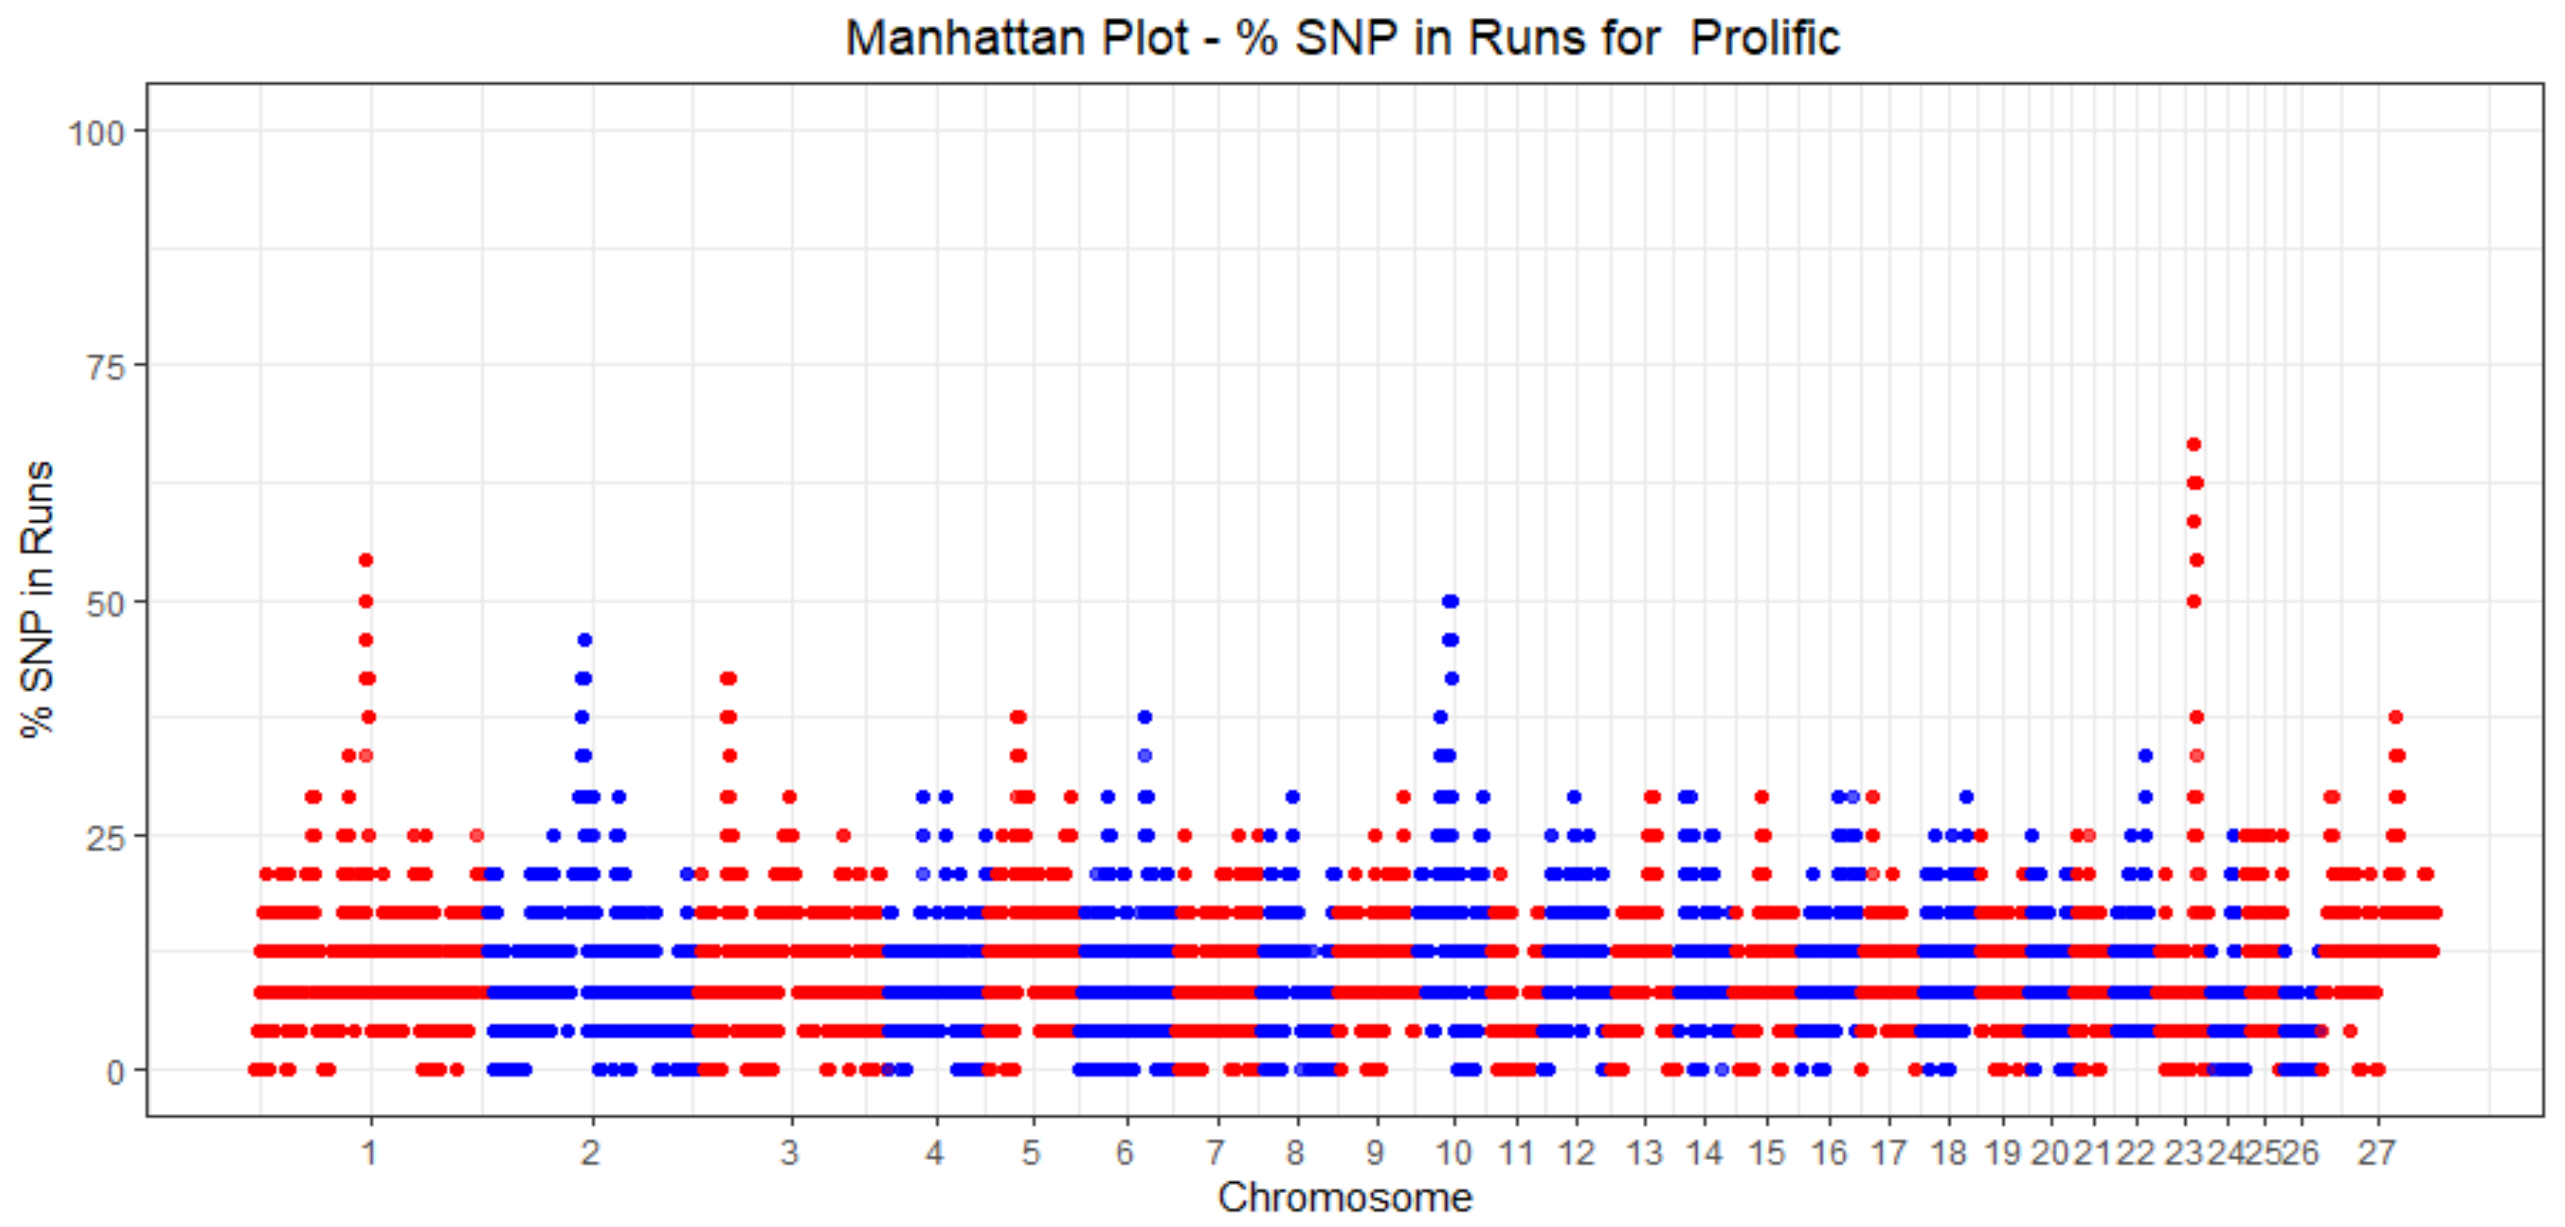
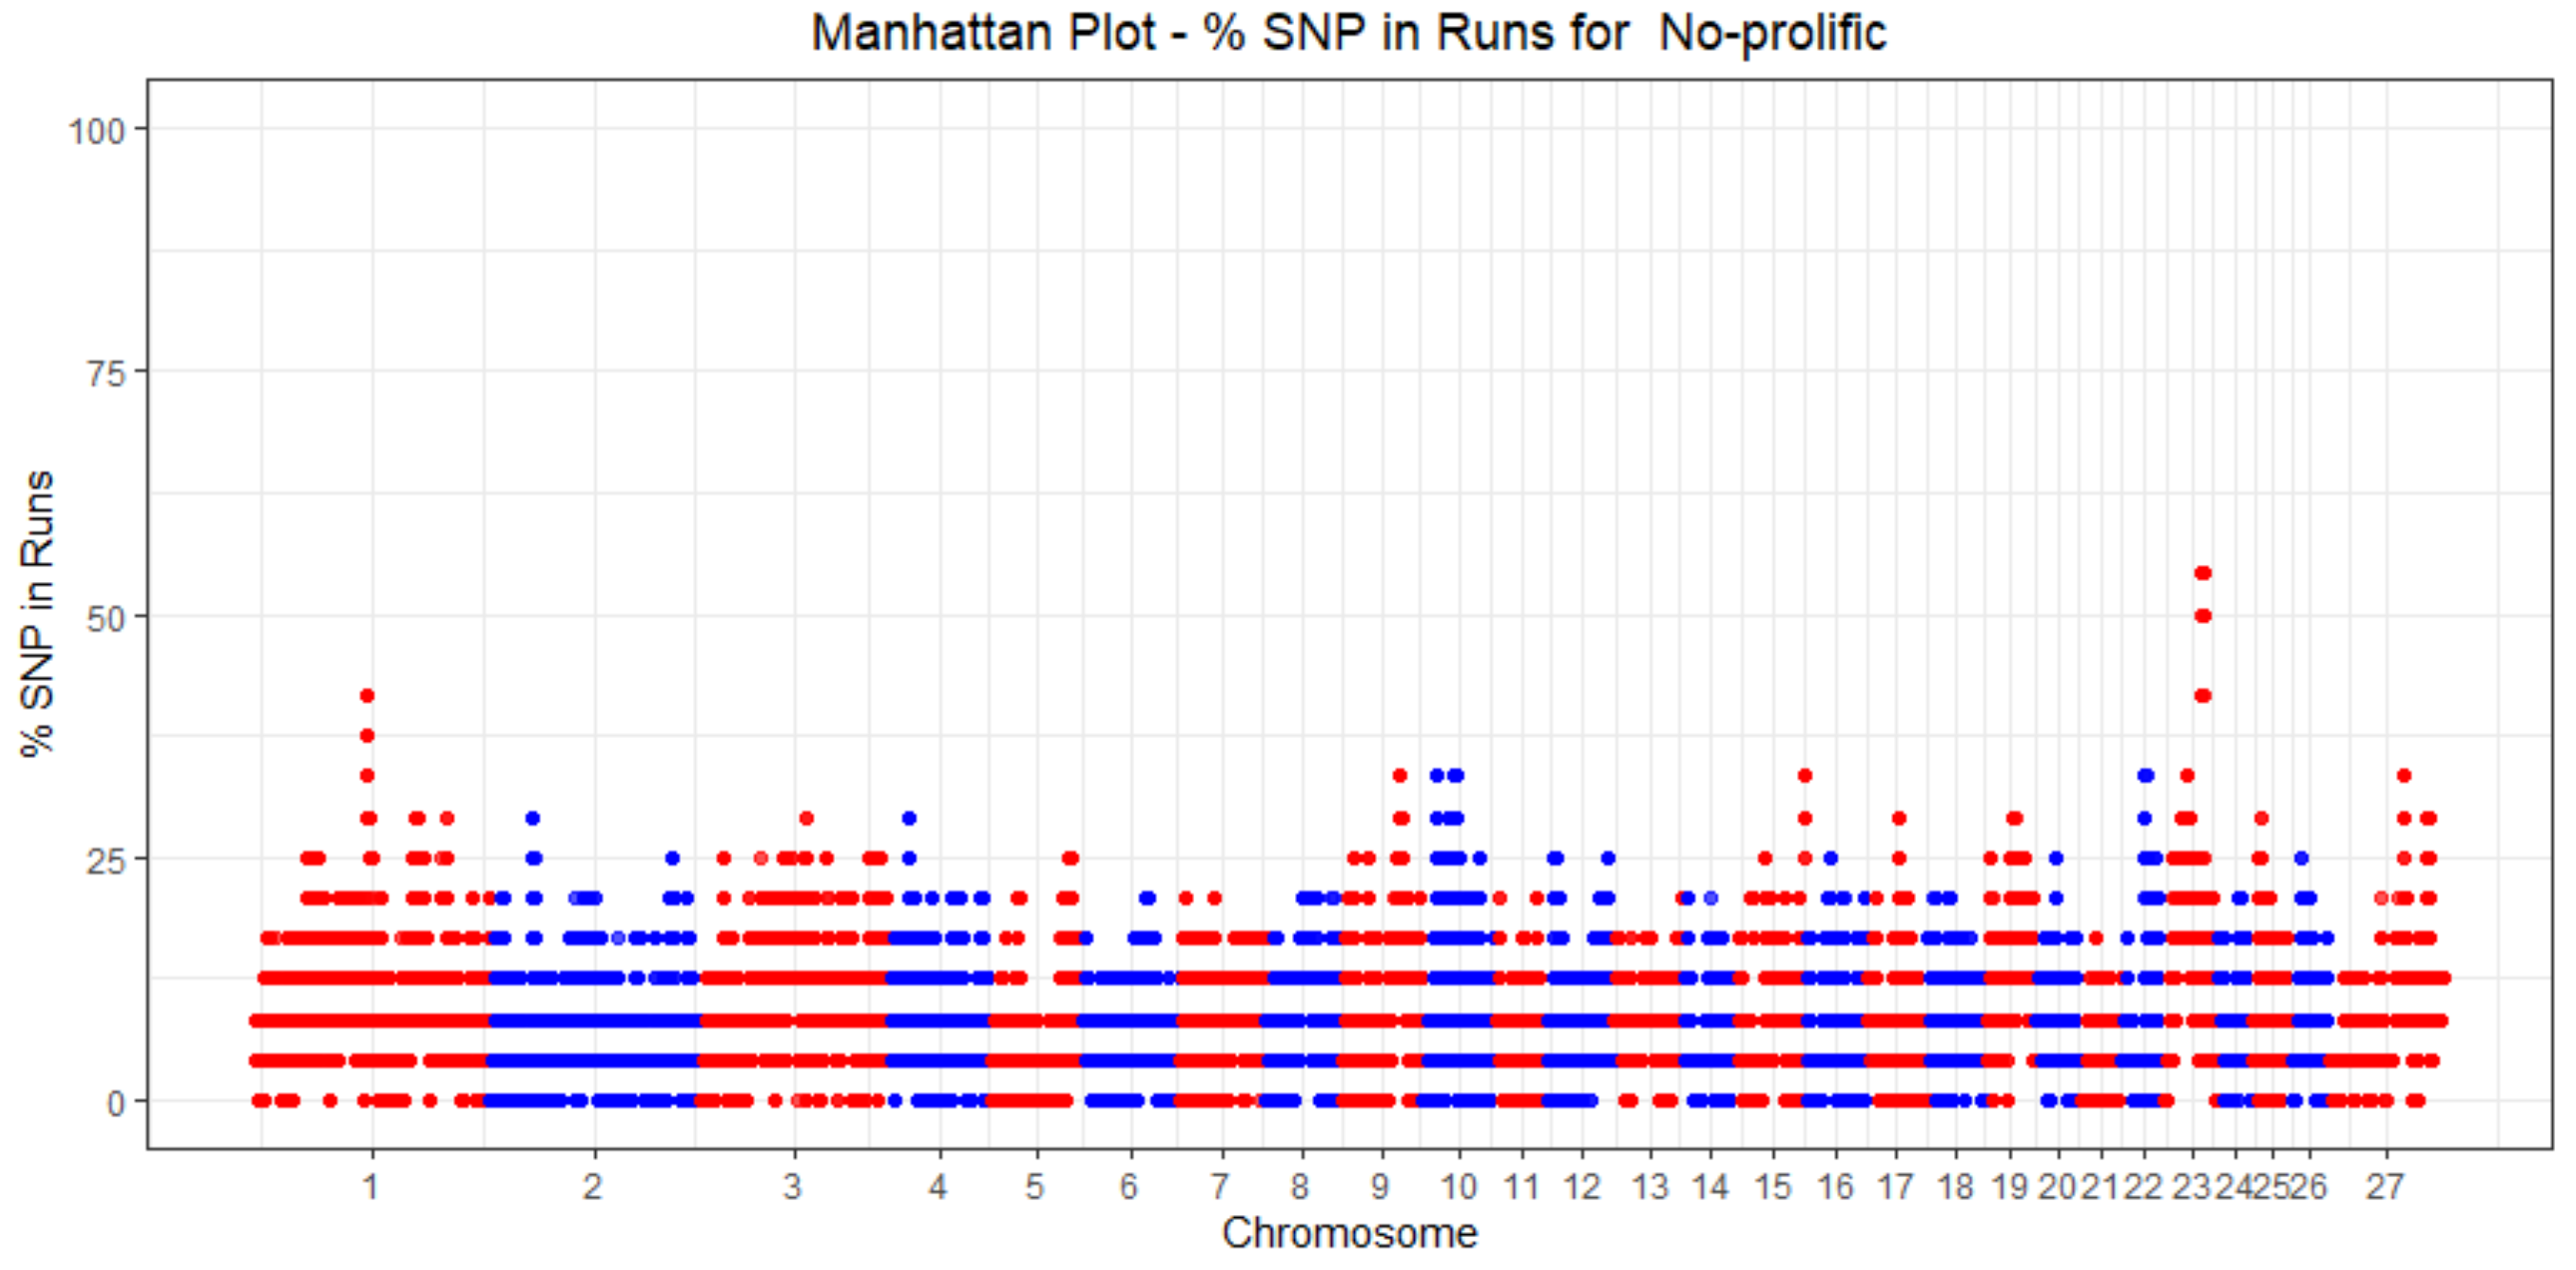
348 homozygosity regions were identified in 48 Pelibuey sheep (Table S3). A total of 2,194 SNPs were identified in ROH of Prolific sheep and 2185 SNPs in ROH of non-prolific sheep. The percentage of SNPs in ROH against the positions of the SNPs along the chromosomes was obtained for the two groups (Figure 3 and Figure 4). Notably, short-frequency ROH (0–6 Mb) predominated, accounting for 85% of the total ROH (Table 4).
In chromosome 23 it is seen that a series of SNPs fall with relative frequency within a ROH in prolific Pelibuey ewes (Figure 3). Among the ROH identified, 4,065 ROH were obtained with a length of less than 6 Mb, 213 from 6 to 12 Mb, 72 from 12 to 24 Mb, 20 from 24 to 48 Mb, and eight with a length greater than 48 Mb. ROH could arise due to autozygosity, where the same chromosome segment has been passed down and the offspring have extended identical tracts by descent or homozygosity series [39]. Consequently, ROH of older origin are expected to be shorter, which results from recombination resulting from repeated meiosis, which breaks up identical segments through descent. On the other hand, ROH originated by recent inbreeding are expected to be longer, because the probability of breaking identical segments through descent is reduced [40].

3.5. Functional Annotation of ROH in Prolific Sheep

A total of 349 ROH were obtained (Table S3); however, only 317 genes were annotated according to their position on the chromosome. The main genes associated with reproductive processes are DGKG, LINGO2, PKP2, FLRT2, ADGRB3, CACNB2, CDH12, and NRG3, Table 5. The genes were associated with seventeen metabolic pathways, as shown in Supplementary Tables S4 and S5. The metabolic pathways that are associated with the reproductive characteristic are “oas04921: Oxytocin signaling pathway” and “oas04020: Calcium signaling pathway”, as shown in Table 6.
The analysis of the functions, through the Genetic Ontology pathways, showed seven genes (LINGO2, NLGN1, FLRT2, ADGRB3, ADGRB1, IL1RAP and EPHB1) related to the biological processes “positive regulation of synapse assembly” (GO:0051965); two genes (ACVR1 and MAGI2) to “negative regulation of activin receptor signaling pathway” (GO:0032926); and two genes (SLC8A3, and SLC8A1) to the molecular function “calcium: sodium antiporter activity” (GO:0005432).

4. Discussion

4.1. Genetic Diversity, Inbreeding Coefficient, and Effective Population Size

The Ho and He in Pelibuey sheep show averages of 0.29 and 0.28 in the Prolific population, respectively (Table S1). Both Ho and He, resulted lower than those previously reported for other sheep in Latin American populations. For example, He = 0.36 to 0.39 were found in indigenous sheep from Colombia [41]. In other study, heterozygosity ranged from 0.35 to 0.38 for Coopworth, Romney, Perendale, and Texel breeds [42], being a little higher than the ones obtained here.
This result suggests high inbreeding in prolific ewes, while in non-prolific ewes, the negative value could indicate an introduction of contrasting breeds in previous generations. Tao et al. [43], reported inbreeding depression reductions for mean litter size in Hu sheep of 0.016, 0.02, and 0.02; which was accompanied by the detection of larger ROH (4.89 Mb). In contrast, McHugo et al. [44], found high values of F in Soay (0.308) and Wiltshire (0.299) sheep, corresponding to small populations. Additionally, mean values of F in Australian Merino (0.045) and Scottish Blackface (0.060) have been reported. Nonetheless, low values of F, were also found in seven breeds of sheep: Border Leicester (0.243), Dorset Horn (0.169), Finnish Landrace (0.087), Galway (0.127), Irish Suffolk (0.185), Romney (0.086), and Scottish Texel (0.111). It is worth noting that the study of the genomic imprint of sheep throughout their evolutionary history, by artificial or natural selection, has made it possible to identify genes involved in productive and health traits, particularly in the Galway and Leicester breeds [44].
Small genetically isolated populations lose genetic variability, mainly by random processes, becoming more inbred with each generation. These populations suffer from inbreeding depression, which consists of loss of fitness in the short term. In the long term, low genetic variance conducts to less adaptability upon changing environments, causing poor population growth and high risk of extinction [45].

4.2. Functional Annotation of ROH in Prolific Sheep

The following genes of importance for reproduction were identified: DGKG, with activity in steroid hormones between the fetus and the placenta in cattle [46]; LINGO2, potential regulator in synapse development and function [47]; PKP2, which has a role in embryonic development in bovines [48]; FLRT2, related to embryonic development in mice [49]; ADGRB3 and CACNB2, enable the activity of synapses [50]; CDH12, associated with loin strength in bovine reproductive activity Holstein [51]; NRG3, which affects reproduction in sheep [43]; and LINGO2 and FLRT2, which are involved in the processes of embryonic development and synapses [47,49].
The DGKG (Diacylglycerol kinase) gene is important in insulin signaling and lipid metabolism, and is a regulator of diacylglycerol and phosphatidic acid. The latter are important mediators of signal transduction [52]. The FLRT2 gene is involved in several physiological processes that are hormone and sex dependent, such as menarche [53]. The LINGO2 (Leucine-Rich Repeat and Immunoglobulin-Like Domain-Containing Nogo Receptor-Interacting Protein 2) gene promotes the development and maturation of embryos in mice [54]. The ADGRB3 (Brain-Specific Angiogenesis Inhibitor 3) and NRG3 (Pro-Neuregulin-3, Membrane-Bound Isoform) genes have been recently identified as genes with possible relation to fertilization and litter size, through the regulation of the oocyte development in Hu sheep [43]. The CDH12 (Cadherin 12) gene is considered an enricher of granulosa cells, which makes cell adhesion to the extracellular matrix possible. Thus, it is considered a promising gene with reproductive activity [55]. The PKP2 (Plakophilin 2) gene has been identified as a regulator of granulosa cells in humans [56]. The CACNB2 (Calcium Voltage-Gated Channel Auxiliary Subunit Beta 2) gene contributes to the release of follicle-stimulating hormone from the anterior pituitary gland. The latter modulates and facilitates conception in cattle [57]. The ABCA1 (ATP-Binding Cassette, Sub-Family A (ABC1), Member 1) gene is associated to cholesterol, in particular with lipid transport in Sertoli cells [58]. A mutation in this gene is linked to Tangier disease and familial high-density lipoprotein deficiency [59]. Finally, the FHIT (AP3Aase) gene has been reported active in molecular mechanisms of cancer [60], potentially implicated in cervical tumor-genesis in humans [61].
Among the candidate genes in ROH, associated with the “Oxytocin signaling pathway” and “Calcium signaling pathway” metabolic pathways, is the ITPR1 (Inositol 1,4,5-trisphosphate receptor Type 1) gene. It contributes to endocrine control [62] and acts on GnRH, estrogen, oxytocin, and TGF-beta signaling pathways [63]. The CACNB2 (Calcium Voltage-Gated Channel Auxiliary Subunit Beta 2) gene is associated to ion channel function, which acts on uterine contraction during labor in humans [64]. The SLC8A3 (Solute Carrier Family 8 Member A3) gene affects the oocyte development [65] and fertility in sheep [66]. Lastly, FGF12 (Fibroblast Growth Factor 12) gene belongs to the FGF family, which are signaling molecules, likewise it participates in the methylation of the ovaries during estrus in goats [67].

5. Conclusions

A total of 349 ROH were obtained, from which only 317 SNPs were annotated close to the genes. Gene ontology analysis showed only 36 terms. Economically important genes such as DGKG, LINGO2, PKP2, FLRT2, ADGRB3, CACNB2, CDH12, and NRG3 were identified. Two metabolic pathways were identified in Pelibuey sheep: “Oxytocin signaling pathway” and “Calcium signaling pathway”, which may have activity in prolificacy. According to our results, ROH may act as signal mediators and interfere with embryonic development, in addition to explaining reproductive characteristics. This study provides information for future selection strategies based on the genetic characterization of the structure in sheep, reducing the pressure of artificial genetic management by crosses between different breeds. However, it is necessary to carry out conservation programs for the Pelibuey breed with more genetically diverse animals.

Supplementary Materials

The following supporting information can be downloaded at: https://www.mdpi.com/article/10.3390/d14070522/s1, Table S1: Inbreeding coefficient (F) for each individual; Table S2: Generation Ago; Table S3: RHO in Pelibuey Sheep; Table S4: Category of Gen Ontology in genes; Table S5: Keep_paway in genes identified to ROH.

Author Contributions

Conceptualization, L.E.C.-T., R.Z.-B., J.A.R. and W.H.-M.; methodology, R.Z.-B., L.E.C.-T. and W.H.-M.; software, W.H.-M.; validation, W.H.-M., R.Z.-B.; formal analysis, L.E.C.-T., N.N.C.-C. and W.H.-M.; investigation, L.E.C.-T., J.A.R. and W.H.-M.; resources, R.Z.-B.; data curation, W.H.-M., R.Z.-B. and J.Q.-V.; writing-original draft preparation, R.Z.-B., N.N.C.-C., W.H.-M. and L.E.C.-T.; writing-review and editing, R.Z.-B., J.A.R. and W.H.-M.; visualization, W.H.-M.; supervision, N.N.C.-C., V.M.-V. and W.H.-M.; project administration, R.Z.-B. and W.H.-M.; funding acquisition, R.Z.-B. All authors have read and agreed to the published version of the manuscript.

Funding

This work was financially supported by TecNM (Grant No. 13817.22-P).

Institutional Review Board Statement

In this study, the animals were not subjected to experimental treatments leading to sacrifice.

Informed Consent Statement

Not applicable.

Data Availability Statement

The SNP-genotypes presented in this study are available on requesfrom the corresponding author.

Acknowledgments

L.E.C.-T. acknowledges the Conacyt awarded to carry out his Master in Science studies within the Master of Science in Tropical Livestock Production, of the Technological Institute of Conkal.

Conflicts of Interest

The authors declare that they have no conflict of interest.

References

  1. Groeneveld, L.F.; Lenstra, J.A.; Eding, H.; Toro, M.A.; Scherf, B.; Pilling, D.; Negrini, R.; Finlay, E.K.; Jianlin, H.; Groeneveld, E.; et al. Genetic diversity in farm animals—A review. Anim. Genet. 2010, 41, 6–31. [Google Scholar] [CrossRef] [PubMed] [Green Version]
  2. Mirkena, T.; Duguma, G.; Haile, A.; Tibbo, M.; Okeyo, A.M.; Wurzinger, M.; Sölkner, J. Genetics of adaptation in domestic farm animals: A review. Livest. Sci. 2010, 132, 1–12. [Google Scholar] [CrossRef]
  3. Diamond, J. Evolution, consequences and future of plant and animal domestication. Nature 2002, 418, 700–707. [Google Scholar] [CrossRef] [PubMed]
  4. Chessa, B.; Pereira, F.; Arnaud, F.; Amorim, A.; Goyache, F.; Mainland, I.; Kao, R.R.; Pemberton, J.M.; Beraldi, D.; Stear, M.J.; et al. Revealing the history of sheep domestication using retrovirus integrations. Science 2009, 324, 532–536. [Google Scholar] [CrossRef] [Green Version]
  5. Delgado, J.V.; Perezgrovas, R.; Camacho, M.E.; Fresno, M.; Barba, C. The Wool-Less Canary Sheep and their relationship with the present breeds in America. Anim. Genet. Resour. Inf. 2000, 28, 27–35. [Google Scholar] [CrossRef]
  6. Aguilar-Martinez, C.U.; Berruecos-Villalobos, J.M.; Espinoza-Gutiérrez, B.; Segura-Correa, J.C.; Valencia-Méndez, J.; Roldán-Roldán, A. Origen, historia y situacion actual de la oveja pelibuey en Mexico. Trop. Subtrop. Agroecosyst. 2017, 20, 429–439. [Google Scholar]
  7. Gutiérrez, J.; Rubio, M.S.; Méndez, R.D. Effects of crossbreeding Mexican Pelibuey sheep with Rambouillet and Suffolk on carcass traits. Meat Sci. 2005, 70, 1–5. [Google Scholar] [CrossRef]
  8. Abied, A.; Bagadi, A.; Bordbar, F.; Pu, Y.; Augustino, S.M.A.; Xue, X.; Xing, F.; Gebreselassie, G.; Han, J.-L.; Mwacharo, J.M.; et al. Genomic Diversity, Population Structure, and Signature of Selection in Five Chinese Native Sheep Breeds Adapted to Extreme Environments. Genes 2020, 11, 494. [Google Scholar] [CrossRef]
  9. Purfield, D.C.; Berry, D.P.; McParland, S.; Bradley, D.G. Runs of homozygosity and population history in cattle. BMC Genet. 2012, 13, 70. [Google Scholar] [CrossRef] [Green Version]
  10. Miao, X.; Luo, Q. Genome-wide transcriptome analysis between Small-tail Han sheep and the Surabaya fur sheep using high-throughput RNA sequencing. Reproduction 2013, 145, 587–596. [Google Scholar] [CrossRef] [Green Version]
  11. Jansson, T. Genes Involved in Ovulation Rate and Litter Size in Sheep. Bachelor’s Thesis, Department of Animal Breeding and Genetics, SLU, Uppsala, Sweden, 2014; pp. 1–14. [Google Scholar]
  12. Abdoli, R.; Zamani, P.; Mirhoseini, S.Z.; Ghavi Hossein-Zadeh, N.; Nadri, S. A review on prolificacy genes in sheep. Reprod. Domest. Anim. 2016, 51, 631–637. [Google Scholar] [CrossRef]
  13. Gootwine, E. Invited review: Opportunities for genetic improvement toward higher prolificacy in sheep. Small Rumin. Res. 2020, 186, 106090. [Google Scholar] [CrossRef]
  14. Chhotaray, S.; Panigrahi, M.; Pal, D.; Ahmad, S.F.; Bhanuprakash, V.; Kumar, H.; Parida, S.; Bhushan, B.; Gaur, G.K.; Mishra, B.P.; et al. Genome-wide estimation of inbreeding coefficient, effective population size and haplotype blocks in Vrindavani crossbred cattle strain of India. Biol. Rhythm Res. 2019, 52, 666–679. [Google Scholar] [CrossRef]
  15. Olšanská, B.; Kasarda, R.; Lehocká, K.; Moravčíková, N. Genome-wide characterisation of regions under intense selection based on runs of homozygosity in Charolais cattle. Acta Fytotech. Zootech. 2020, 23, 350–355. [Google Scholar] [CrossRef]
  16. Zhan, H.; Zhang, S.; Zhang, K.; Peng, X.; Xie, S.; Li, X.; Zhao, S.; Ma, Y. Genome-wide patterns of homozygosity and relevant characterizations on the population structure in Piétrain pigs. Genes 2020, 11, 577. [Google Scholar] [CrossRef]
  17. Mastrangelo, S.; Tolone, M.; Sardina, M.T.; Sottile, G.; Sutera, A.M.; Di Gerlando, R.; Portolano, B. Genome-wide scan for runs of homozygosity identifies potential candidate genes associated with local adaptation in Valle del Belice sheep. Genet. Sel. Evol. 2017, 49, 84. [Google Scholar] [CrossRef] [Green Version]
  18. Xu, S.S.; Gao, L.; Xie, X.L.; Ren, Y.L.; Shen, Z.Q.; Wang, F.; Shen, M.; Eypórsdóttir, E.; Hallsson, J.H.; Kiseleva, T.; et al. Genome-wide association analyses highlight the potential for different genetic mechanisms for litter size among sheep breeds. Front. Genet. 2018, 9, 118. [Google Scholar] [CrossRef]
  19. Mastrangelo, S.; Ben Jemaa, S.; Sottile, G.; Casu, S.; Portolano, B.; Ciani, E.; Pilla, F. Combined approaches to identify genomic regions involved in phenotypic differentiation between low divergent breeds: Application in Sardinian sheep populations. J. Anim. Breed. Genet. 2019, 136, 526–534. [Google Scholar] [CrossRef]
  20. Magi, A.; Giangregorio, T.; Semeraro, R.; Carangelo, G.; Palombo, F.; Romeo, G.; Seri, M.; Pippucci, T. AUDACITY: A comprehensive approach for the detection and classification of Runs of Homozygosity in medical and population genomics. Comput. Struct. Biotechnol. J. 2020, 18, 1956–1967. [Google Scholar] [CrossRef]
  21. Jiang, R.; Cheng, J.; Cao, X.K.; Ma, Y.L.; Chaogetu, B.; Huang, Y.Z.; Lan, X.Y.; Lei, C.Z.; Hu, L.Y.; Chen, H. Copy number variation of the SHE gene in sheep and its association with economic traits. Animals 2019, 9, 531. [Google Scholar] [CrossRef] [Green Version]
  22. Escaramís, G.; Docampo, E.; Rabionet, R. A decade of structural variants: Description, history and methods to detect structural variation. Brief. Funct. Genom. 2015, 14, 305–314. [Google Scholar] [CrossRef] [Green Version]
  23. Tobar, K.M.C.; Álvarez, D.C.L.; Franco, L.Á.Á. Genome-wide association studies in sheep from Latin America. Review. Rev. Mex. Cienc. Pecu. 2020, 11, 659–683. [Google Scholar] [CrossRef]
  24. Xiong, H.; Xiong, H.; He, X.; Li, J.; Li, J.; Liu, X.; Peng, C.; Xi, D.; Deng, W. Genetic diversity and genetic origin of Lanping black-boned sheep investigated by genome-wide single-nucleotide polymorphisms (SNPs). Arch. Anim. Breed. 2020, 63, 193–201. [Google Scholar] [CrossRef]
  25. Mastrangelo, S.; Di Gerlando, R.; Sardina, M.T.; Sutera, A.M.; Moscarelli, A.; Tolone, M.; Cortellari, M.; Marletta, D.; Crepaldi, P.; Portolano, B. Genome-wide patterns of homozygosity reveal the conservation status in five italian goat populations. Animals 2021, 11, 1510. [Google Scholar] [CrossRef]
  26. Fang, Y.; Hao, X.; Xu, Z.; Sun, H.; Zhao, Q.; Cao, R.; Zhang, Z.; Ma, P.; Sun, Y.; Qi, Z.; et al. Genome-Wide Detection of Runs of Homozygosity in Laiwu Pigs Revealed by Sequencing Data. Front. Genet. 2021, 12, 463. [Google Scholar] [CrossRef]
  27. He, S.; Di, J.; Han, B.; Chen, L.; Liu, M.; Li, W. Genome-wide scan for runs of homozygosity identifies candidate genes related to economically important traits in Chinese merino. Animals 2020, 10, 524. [Google Scholar] [CrossRef] [Green Version]
  28. Hernández-Montiel, W.; Martínez-Núñez, M.A.; Ramón-Ugalde, J.P.; Román-Ponce, S.I.; Calderón-Chagoya, R.; Zamora-Bustillos, R. Genome-Wide Association Study Reveals Candidate Genes for Litter Size Traits in Pelibuey Sheep. Animals 2020, 10, 434. [Google Scholar] [CrossRef] [Green Version]
  29. Chang, C.C.; Chow, C.C.; Tellier, L.C.A.M.; Vattikuti, S.; Purcell, S.M.; Lee, J.J. Second-generation PLINK: Rising to the challenge of larger and richer datasets. Gigascience 2015, 4, 1–16. [Google Scholar] [CrossRef]
  30. Purcell, S.; Neale, B.; Todd-Brown, K.; Thomas, L.; Ferreira, M.A.R.; Bender, D.; Maller, J.; Sklar, P.; De Bakker, P.I.W.; Daly, M.J.; et al. PLINK: A tool set for whole-genome association and population-based linkage analyses. Am. J. Hum. Genet. 2007, 81, 559–575. [Google Scholar] [CrossRef] [Green Version]
  31. Barbato, M.; Orozco-terWengel, P.; Tapio, M.; Bruford, M.W. SNeP: A tool to estimate trends in recent effective population size trajectories using genome-wide SNP data. Front. Genet. 2015, 6, 109. [Google Scholar] [CrossRef] [Green Version]
  32. Ceballos, F.C.; Hazelhurst, S.; Ramsay, M. Runs of Homozygosity in sub-Saharan African populations provide insights into a complex demographic and health history Francisco. bioRxiv 2018, 3. [Google Scholar] [CrossRef] [Green Version]
  33. Ballan, M.; Bovo, S.; Schiavo, G.; Schiavitto, M.; Negrini, R.; Fontanesi, L. Genomic diversity and signatures of selection in meat and fancy rabbit breeds based on high-density marker data. Genet. Sel. Evol. 2022, 54, 3. [Google Scholar] [CrossRef] [PubMed]
  34. Meyermans, R.; Gorssen, W.; Buys, N.; Janssens, S. How to study runs of homozygosity using plink? a guide for analyzing medium density snp data in livestock and pet species. BMC Genom. 2020, 21, 94. [Google Scholar] [CrossRef] [PubMed]
  35. Biscarini, F.; Cozzi, P.; Gaspa, G.; Marras, G. Detect Runs of Homozygosity and Runs of Heterozygosity in Diploid Genomes. Available online: https://www.semanticscholar.org/paper/detectRUNS%3A-Detect-runs-of-homozygosity-and-runs-of-Biscarini-Cozzi/ccc3091c370ae99f7c1b56aa5521b80cd47a4258 (accessed on 20 August 2021).
  36. Zhao, G.; Zhang, T.; Liu, Y.; Wang, Z.; Xu, L.; Zhu, B.; Gao, X.; Zhang, L.; Gao, H.; Liu, G.E.; et al. Genome-wide assessment of runs of homozygosity in chinese wagyu beef cattle. Animals 2020, 10, 1425. [Google Scholar] [CrossRef]
  37. Woodruff, D.S. Populations, Species, and Conservation Genetics. In Encyclopedia of Biodiversity; Levin, S.A., Ed.; Academic Press: Cambridge, MA, USA, 2020; pp. 811–829. [Google Scholar]
  38. Daetwyler, H.D.; Villanueva, B.; Bijma, P.; Woolliams, J.A. Inbreeding in genome-wide selection. J. Anim. Breed. Genet. 2007, 124, 369–376. [Google Scholar] [CrossRef]
  39. McQuillan, R.; Leutenegger, A.L.; Abdel-Rahman, R.; Franklin, C.S.; Pericic, M.; Barac-Lauc, L.; Smolej-Narancic, N.; Janicijevic, B.; Polasek, O.; Tenesa, A.; et al. Runs of Homozygosity in European Populations. Am. J. Hum. Genet. 2008, 83, 359–372. [Google Scholar] [CrossRef] [Green Version]
  40. Rodríguez-Ramilo, S.T.; Elsen, J.M.; Legarra, A. Inbreeding and effective population size in French dairy sheep: Comparison between genomic and pedigree estimates. J. Dairy Sci. 2019, 102, 4227–4237. [Google Scholar] [CrossRef]
  41. Ortiz Sanchéz, Y.; Martínez Guzmán, M.; Kübler, I.; Ariza, M.F.; Castro Molina, S.; Infante-González, J. Diversidad genética del Ovino Criollo de Pelo Colombiano mediante el uso del marcador molecular de tipo polimorfismos de nucleótido simple (SNP). Rev. Investig. Vet. Perú 2021, 32, e19487. [Google Scholar] [CrossRef]
  42. Prieur, V.; Clarke, S.M.; Brito, L.F.; McEwan, J.C.; Lee, M.A.; Brauning, R.; Dodds, K.G.; Auvray, B. Estimation of linkage disequilibrium and effective population size in New Zealand sheep using three different methods to create genetic maps. BMC Genet. 2017, 18, 68. [Google Scholar] [CrossRef]
  43. Tao, L.; He, X.; Wang, X.; Di, R.; Chu, M. Litter size of sheep (Ovis aries): Inbreeding depression and homozygous regions. Genes 2021, 12, 109. [Google Scholar] [CrossRef]
  44. McHugo, G.P.; Browett, S.; Randhawa, I.A.S.; Howard, D.J.; Mullen, M.P.; Richardson, I.W.; Park, S.D.E.; Magee, D.A.; Scraggs, E.; Dover, M.J.; et al. A Population Genomics Analysis of the Native Irish Galway Sheep Breed. Front. Genet. 2019, 10, 927. [Google Scholar] [CrossRef] [Green Version]
  45. Weeks, A.R.; Stoklosa, J.; Hoffmann, A.A. Conservation of genetic uniqueness of populations may increase extinction likelihood of endangered species: The case of Australian mammals. Front. Zool. 2016, 13, 31. [Google Scholar] [CrossRef] [Green Version]
  46. Sigdel, A.; Bisinotto, R.S.; Peñagaricano, F. Genes and pathways associated with pregnancy loss in dairy cattle. Sci. Rep. 2021, 11, 13329. [Google Scholar] [CrossRef]
  47. Williams, S.M.; An, J.Y.; Edson, J.; Watts, M.; Murigneux, V.; Whitehouse, A.J.O.; Jackson, C.J.; Bellgrove, M.A.; Cristino, A.S.; Claudianos, C. An integrative analysis of non-coding regulatory DNA variations associated with autism spectrum disorder. Mol. Psychiatry 2019, 24, 1707–1719. [Google Scholar] [CrossRef] [Green Version]
  48. Killeen, A.P.; Morris, D.G.; Kenny, D.A.; Mullen, M.P.; Diskin, M.G.; Waters, S.M. Global gene expression in endometrium of high and low fertility heifers during the mid-luteal phase of the estrous cycle. BMC Genom. 2014, 15, 234. [Google Scholar] [CrossRef] [Green Version]
  49. Müller, P.S.; Schulz, R.; Maretto, S.; Costello, I.; Srinivas, S.; Bikoff, E.; Robertson, E. The fibronectin leucine-rich repeat transmembrane protein Flrt2 is required in the epicardium to promote heart morphogenesis. Development 2011, 138, 1297–1308. [Google Scholar] [CrossRef] [Green Version]
  50. Gonda, X.; Eszlari, N.; Torok, D.; Gal, Z.; Bokor, J.; Millinghoffer, A.; Baksa, D.; Petschner, P.; Antal, P.; Breen, G.; et al. Genetic underpinnings of affective temperaments: A pilot GWAS investigation identifies a new genome-wide significant SNP for anxious temperament in ADGRB3 gene. Transl. Psychiatry 2021, 11, 337. [Google Scholar] [CrossRef]
  51. Lu, X.; Abdalla, I.M.; Nazar, M.; Fan, Y.; Zhang, Z.; Wu, X.; Xu, T.; Yang, Z. Genome-wide association study on reproduction-related body-shape traits of chinese holstein cows. Animals 2021, 11, 1927. [Google Scholar] [CrossRef]
  52. Sinha, N.; Roy, S.; Huang, B.; Wang, J.; Padmanabhan, V.; Sen, A. Developmental programming: Prenatal testosterone-induced epigenetic modulation and its effect on gene expression in sheep ovary. Biol. Reprod. 2020, 102, 1045–1054. [Google Scholar] [CrossRef]
  53. Cicvaric, A.; Yang, J.; Bulat, T.; Zambon, A.; Dominguez-Rodriguez, M.; Kühn, R.; Sadowicz, M.G.; Siwert, A.; Egea, J.; Pollak, D.D.; et al. Enhanced synaptic plasticity and spatial memory in female but not male FLRT2-haplodeficient mice. Sci. Rep. 2018, 8, 3703. [Google Scholar] [CrossRef]
  54. Li, Y.; Liu, H.; Yu, Q.; Liu, H.; Huang, T.; Zhao, S.; Ma, J.; Zhao, H. Growth Hormone Promotes in vitro Maturation of Human Oocytes. Front. Endocrinol. 2019, 10, 485. [Google Scholar] [CrossRef] [PubMed] [Green Version]
  55. Abedel-Majed, M.A.; Romereim, S.M.; Davis, J.S.; Cupp, A.S. Perturbations in Lineage Specification of Granulosa and Theca Cells May Alter Corpus Luteum Formation and Function. Front. Endocrinol. 2019, 10, 832. [Google Scholar] [CrossRef] [PubMed]
  56. Poulsen, L.C.; Bøtkjær, J.A.; Østrup, O.; Petersen, K.B.; Yding Andersen, C.; Grøndahl, M.L.; Englund, A.L.M. Two waves of transcriptomic changes in periovulatory human granulosa cells. Hum. Reprod. 2020, 35, 1230–1245. [Google Scholar] [CrossRef] [PubMed]
  57. Sugimoto, M.; Sasaki, S.; Gotoh, Y.; Nakamura, Y.; Aoyagi, Y.; Kawahara, T.; Sugimoto, Y. Genetic variants related to gap junctions and hormone secretion influence conception rates in cows. Proc. Natl. Acad. Sci. USA 2013, 110, 19495–19500. [Google Scholar] [CrossRef] [Green Version]
  58. Selva, D.M.; Hirsch-Reinshagen, V.; Burgess, B.; Zhou, S.; Chan, J.; McIsaac, S.; Hayden, M.R.; Hammond, G.L.; Vogl, A.W.; Wellington, C.L. The ATP-binding cassette transporter 1 mediates lipid efflux from Sertoli cells and influences male fertility. J. Lipid Res. 2004, 45, 1040–1050. [Google Scholar] [CrossRef] [Green Version]
  59. Qian, H.; Zhao, X.; Cao, P.; Lei, J.; Yan, N.; Gong, X. Structure of the Human Lipid Exporter ABCA1. Cell 2017, 169, 1228–1239.e10. [Google Scholar] [CrossRef] [Green Version]
  60. Bibikova, M.; Le, J.; Barnes, B.; Saedinia-Melnyk, S.; Zhou, L.; Shen, R.; Gunderson, K.L. Genome-wide DNA methylation profiling using Infinium® assay. Epigenomics 2009, 1, 177–200. [Google Scholar] [CrossRef]
  61. Hendricks, D.T.; Taylor, R.; Reed, M.; Birrer, M.J. FHIT Gene Expression in Human Ovarian, Endometrial, and Cervical Cancer Cell Lines. Cancer Res. 1997, 57, 2112–2115. [Google Scholar]
  62. Fan, T.; Hu, Y.; Xin, J.; Zhao, M.; Wang, J. Analyzing the genes and pathways related to major depressive disorder via a systems biology approach. Brain Behav. 2020, 10, e01502. [Google Scholar] [CrossRef] [Green Version]
  63. La, Y.; Liu, Q.; Zhang, L.; Chu, M. Single nucleotide polymorphisms in SLC5A1, CCNA1, and ABCC1 and the association with litter size in small-tail han sheep. Animals 2019, 9, 432. [Google Scholar] [CrossRef] [Green Version]
  64. Brubaker, D.; Liu, Y.; Wang, J.; Tan, H.; Zhang, G.; Jacobsson, B.; Muglia, L.; Mesiano, S.; Chance, M.R. Finding lost genes in GWAS via integrative-omics analysis reveals novel sub-networks associated with preterm birth. Hum. Mol. Genet. 2016, 25, 5254–5264. [Google Scholar] [CrossRef] [Green Version]
  65. Wang, H.; Zhang, L.; Cao, J.; Wu, M.; Ma, X.; Liu, Z.; Liu, R.; Zhao, F.; Wei, C.; Du, L. Genome-wide specific selection in three domestic sheep breeds. PLoS ONE 2015, 10, e0128688. [Google Scholar] [CrossRef] [Green Version]
  66. Eydivandi, S.; Roudbar, M.A.; Karimi, M.O.; Sahana, G. Genomic scans for selective sweeps through haplotype homozygosity and allelic fixation in 14 indigenous sheep breeds from Middle East and South Asia. Sci. Rep. 2021, 11, 2834. [Google Scholar] [CrossRef]
  67. An, X.; Ma, H.; Han, P.; Zhu, C.; Cao, B.; Bai, Y. Genome-wide differences in DNA methylation changes in caprine ovaries between oestrous and dioestrous phases. J. Anim. Sci. Biotechnol. 2018, 9, 85. [Google Scholar] [CrossRef]
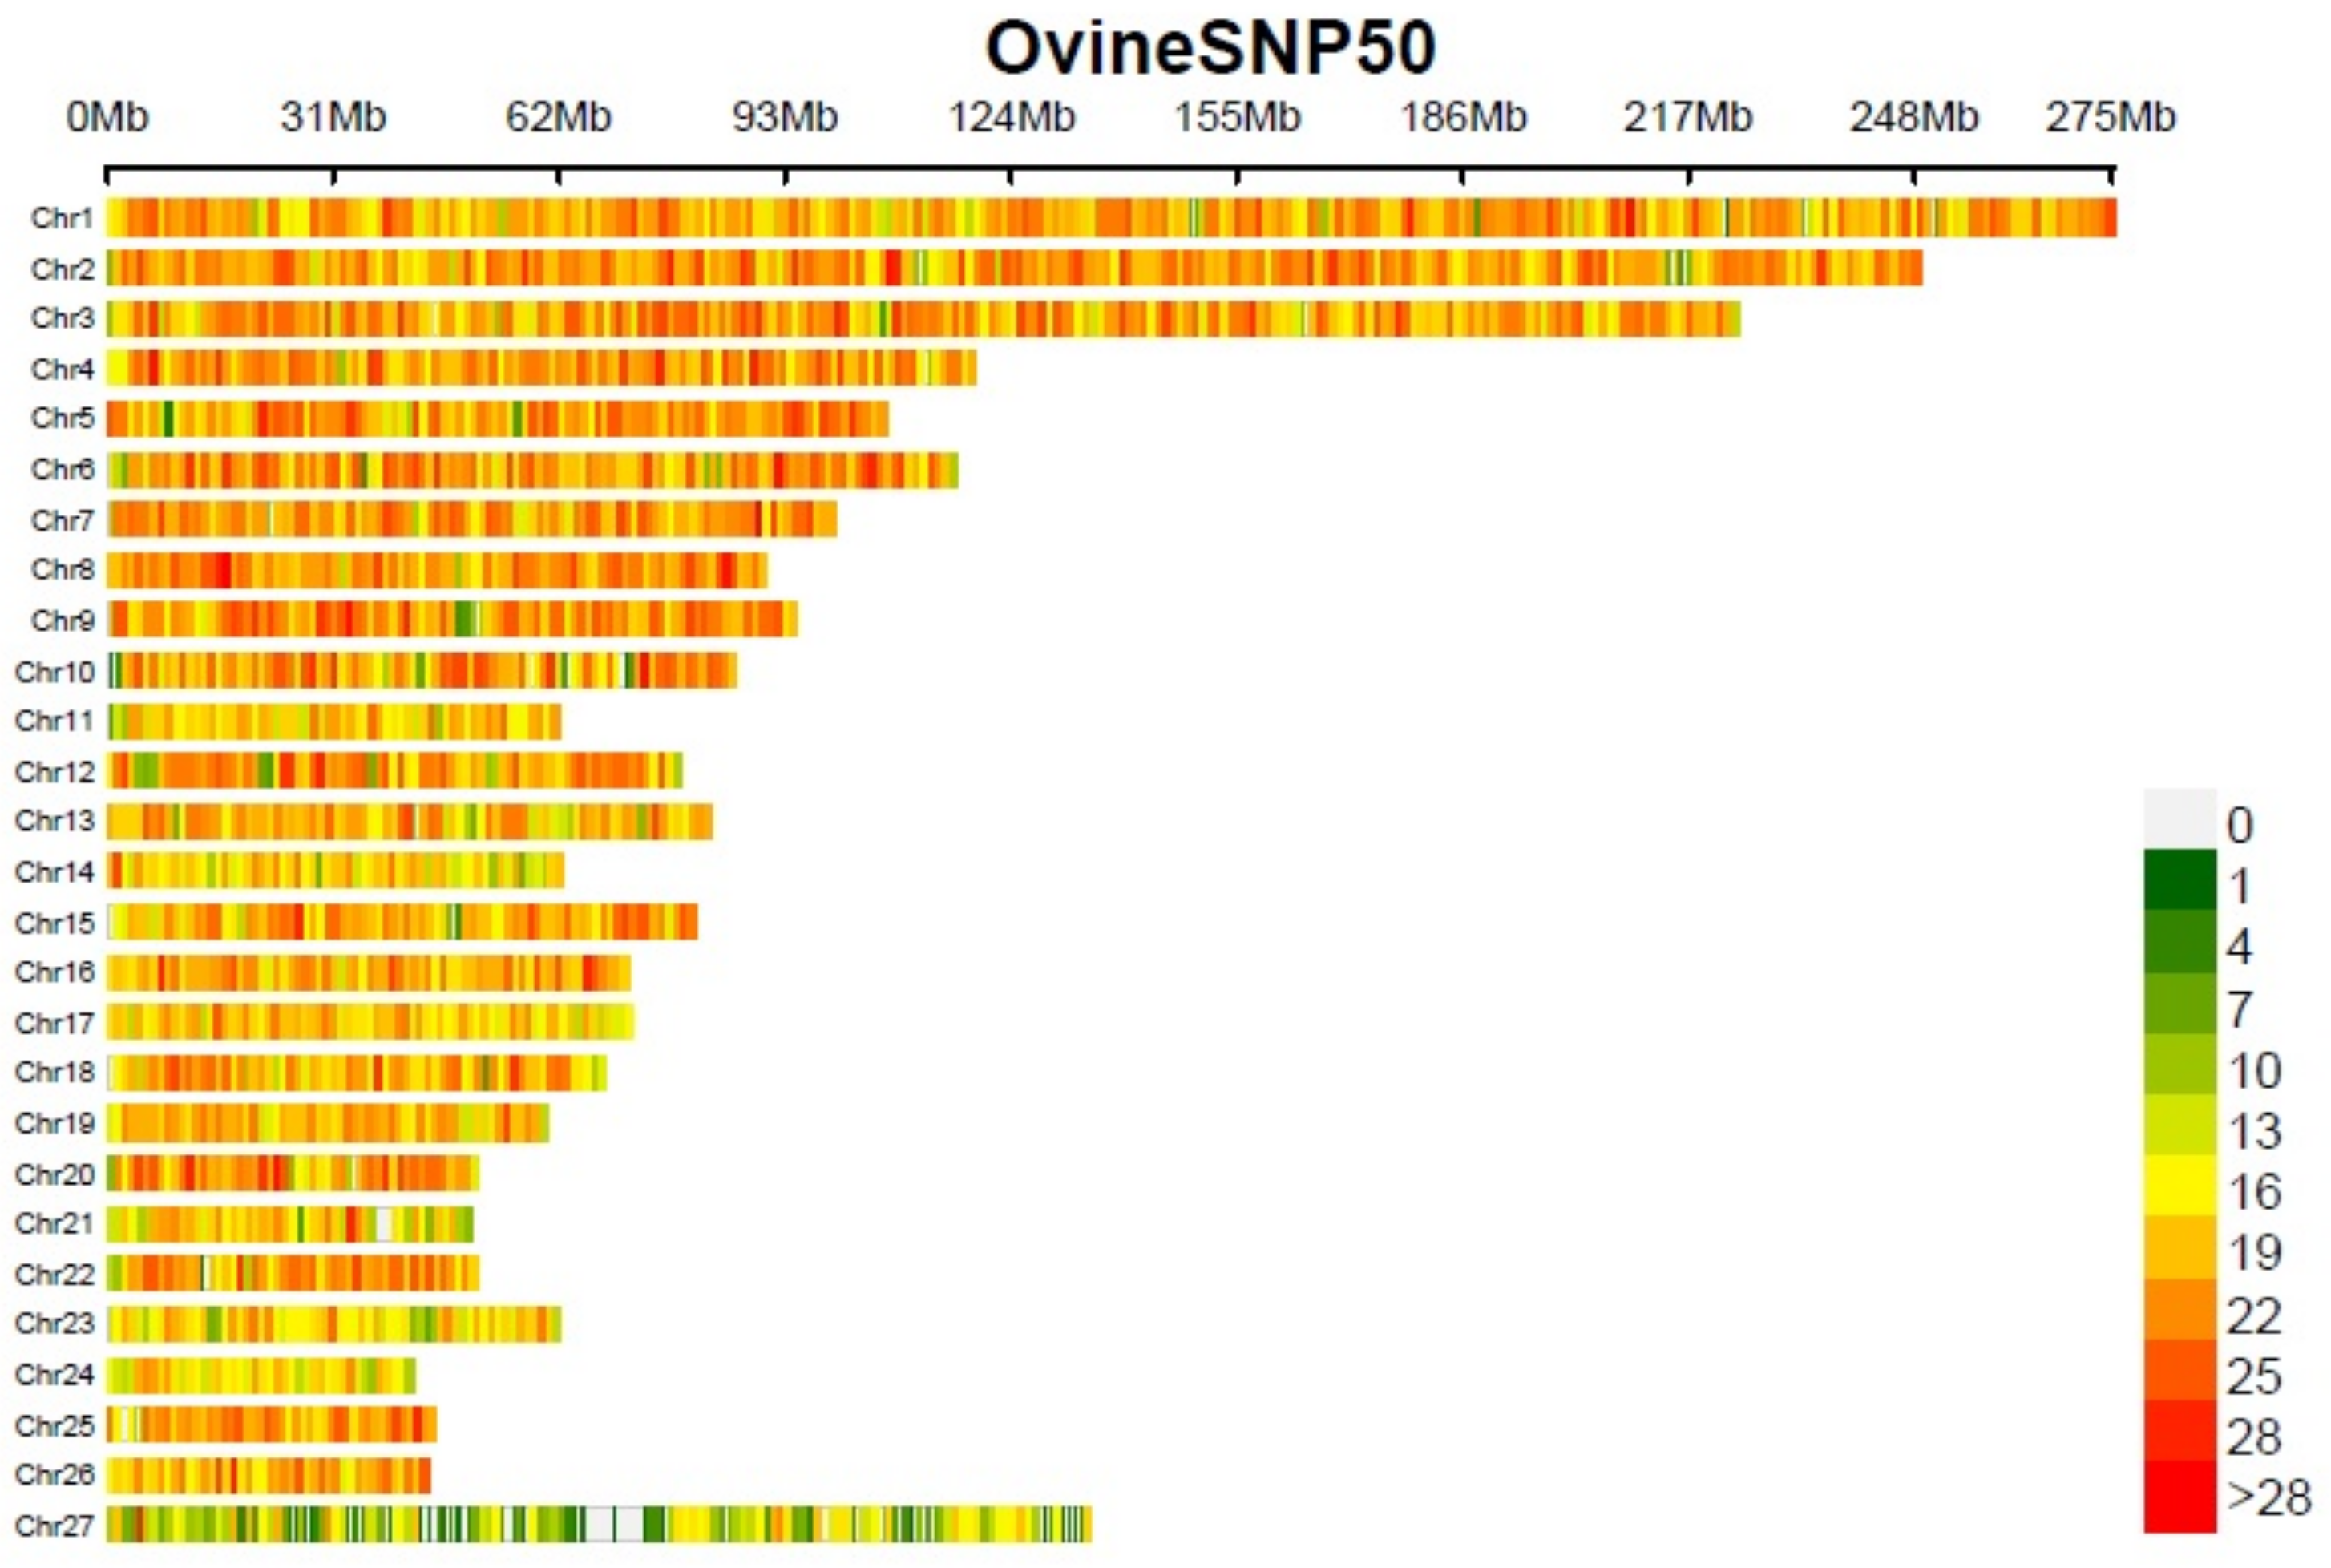
Figure 1. Density of the markers in the 27 chromosomes of the Pelibuey sheep.
Diversity 14 00522 g001
Figure 2. Identification of genomic characteristics. (a) Decay of the distance of markers in ligament disequilibrium (LD), as a function of the distance between markers in the entire Pelibuey sheep genome. (b) Distribution of the l LD block length for case-control.
Diversity 14 00522 g002
Figure 3. Manhattan plot of the frequencies (%) of SNPs in homozygosity runs in prolific Pelibuey sheep.
Diversity 14 00522 g003
Figure 4. Manhattan plot of the frequencies (%) of SNPs in homozygosity runs in non-prolific Pelibuey sheep.
Diversity 14 00522 g004
Table 1. Integration of the samples of prolific and non-prolific sheep from four Pelibuey sheep herds.
Farmn
ProlificNo Prolific
Las Potrancas713
El Rodeo86
San Alberto55
El Cortijo4-
Total2424
Table 2. Expected and observed heterozygosity (He and Ho), inbreeding coefficient (F), and inbreeding coefficient of an individual in subpopulation (Fis).
IDFarmAnimalsHoHe ± SDFFis
ProlificEl Cortijo40.2800.216 × 104−0.0440.027
Las Potrancas70.2890.288 × 1040.006−0.004
El Rodeo80.2990.288 × 1040.064−0.040
San Alberto50.2880.288 × 1040.0010.001
No-prolificSan Alberto50.2830.288 × 104−0.0261.56 × 102
Las Potrancas130.2000.284 × 104−0.0292.936 × 101
El Rodeo60.2890.288 × 1040.010−0.006
Table 3. Effective population size (Ne) within 54 generations of the Pelibuey sheep.
Generation AgoNeDistr2r2 ± SD
131923,749,4830.03352090.045845
152123,273,2370.03469970.0475146
172352,844,3280.03607880.0494267
202602,459,8110.03767150.0514669
232902,116,2450.03910510.0537381
273271,811,1530.04051710.0552067
323641,541,2040.04261740.057825
384111,303,3530.04461240.0606928
454681,095,1520.04646750.0632997
54535914,2140.04866550.065538
Dist, average distance between the loci.
Table 4. Summary of the number of runs of homozygosity (ROH) in different categories in case-control.
Category0–6 Mb6–12 Mb12–24 Mb24–48 Mb>48 Mb
Prolific201011444178
No-prolific2055992830
Table 5. Genomic regions and genes identified to be associated with prolificacy in sheep.
ChrSNP1Gen 1SNP2Gen 2Pos1 pbPos2 pbSNPKbDensity
1OAR1_215101913.1DGKGOAR1_221977733.1PEX5L19,915,766520,534,28351076185.157.8
2OAR2_103911840.1LINGO2DU300339_104.1--96,505,29311,001,227928313,506.947.7
3OAR3_195973885.1PKP2OAR3_209916841.1--18,173,243819,472,480226112,992.349.7
7s07208.1FLRT2OAR7_108923470.1TRIM6994,069,57999,977,2311255907.647.2
9OAR9_5634331.1ADGRB3OAR9_18493683.1--5,696,21817,666,65114311,970.451.1
13OAR13_35436626.1CACNB2s11802.1DIP2C32,041,72745,925,12526513,883.352.3
16OAR16_55041078.1CDH12OAR16_62246248.1--50,543,43957,002,0281326458.548.9
25s62494.1NRG3OAR25_48288071_X.1--36,775,57645,193,6051778418.047.5
Kb, kilo base pairs; Pos1 and Pos2, position in base pairs on the chromosome.
Table 6. Gene Ontology (GO) and Encyclopedia of Genes and Genomes (KEGG) pathway analysis of gene-based enrichment (p < 0.01) in ROH.
TermsGenesList of Genesp-Value
GO Biological Process
(GO:0051965) positive regulation of synapse assembly7.97 × 105LINGO2, NLGN1, FLRT2, ADGRB3, ADGRB1, IL1RAP, EPHB12.88
(GO:0035556) intracellular signal transduction9.05 × 105DGKG, SRPK2, DGKE, PRKCH, DGKB, STAC, PRKCE, DCDC2, STK38, ARHGEF3, ARHGEF4, DGKI, RGS65.34
(GO:0007205) protein kinase C-activating G-protein coupled receptor signaling pathway1.646090535DGKG, DGKE, DGKB, DGKI1.64
(GO:0007155) cell adhesion0.004436121DSCAM, CNTN5, NINJ2, PRKCE, NCAM1, CTNNA3, NCAM22.880658436
(GO:0032926) negative regulation of activin receptor signaling pathway0.099286868ACVR1, MAGI20.823045267
GO Molecular Function
(GO:0005096) GTPase activator activity0.026660316ARHGAP10, ADGRB3, NPRL3, DAB2IP, SMAP1, RGS62.469135802
(GO:0005432) calcium: sodium antiporter activity0.054904043SLC8A3, SLC8A10.823045267
(GO:0005548) phospholipid transporter activity0.06815558ABCA1, ABCG10.823045267
GO Cellular Component
(GO:0005887) integral component of plasma membrane0.029326849ABCA1, SLC8A3, ALK, NLGN1, DSCAM, FLRT2, EPHB1, HCN1, DDR23.703703704
(GO:0048471) perinuclear region of cytoplasm0.048576171ABCA1, SLC8A3, PKHD1, ATP7B, DAB1, PRKCE, PTPRM, TMEM192, DGKI3.703703704
(GO:1990454) L-type voltage-gated calcium channel complex0.052429865CACNB2, CACNA2D10.823045267
KEGG pathway
oas04921: Oxytocin signaling pathway CACNB2, PPP3R2, CACNB4, CACNA2D1, CACNA2D3, ITPR10.026681693
oas04020: Calcium signaling pathway SLC8A3, ITPKB, PPP3R2, ITPR1, SLC8A1, GRM10.053913811
Publisher’s Note: MDPI stays neutral with regard to jurisdictional claims in published maps and institutional affiliations.