
Beyond Site-Specific Criteria: Conservation of Migratory Birds and Their Habitats from a Network Perspective

 ,
,  , ,
, ,
Abstract
1. Introduction
2. International Conservation Frameworks for Prioritizing Site Conservation for Birds
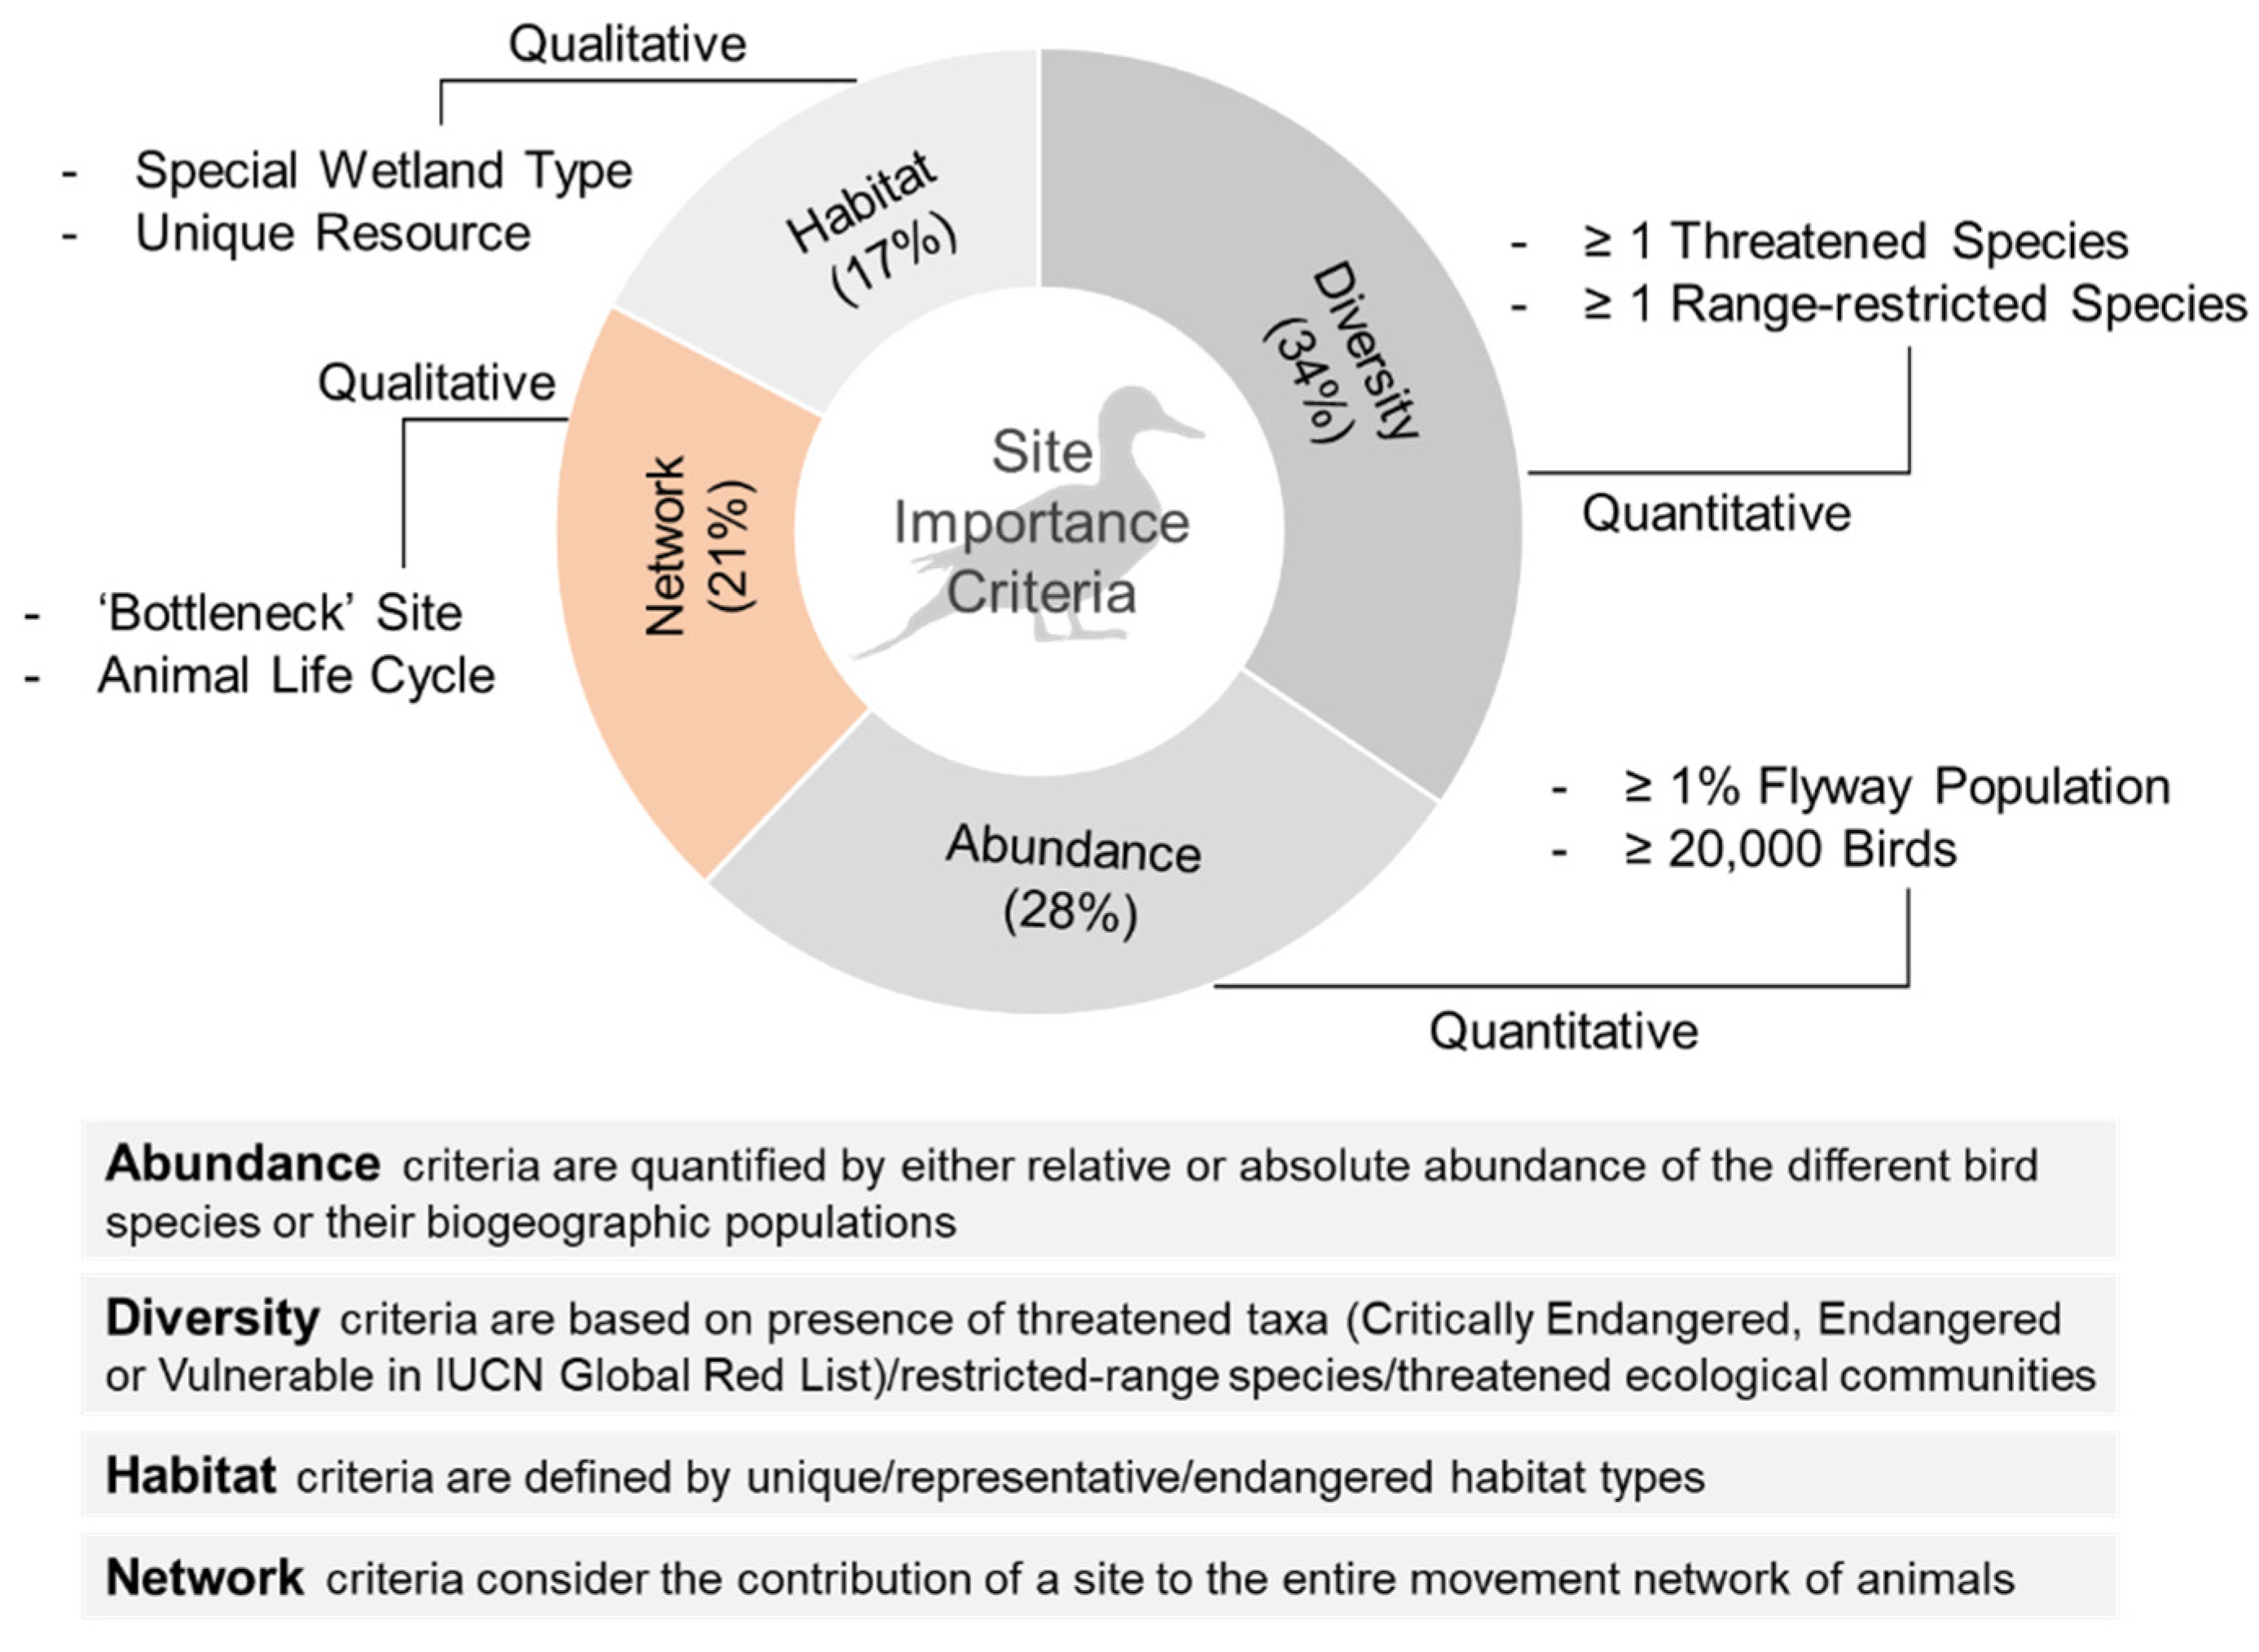
2.1. Diversity/Species Threat Status Criteria
2.2. Abundance Criteria
2.3. Habitat Property Criteria
2.4. Network Criteria
2.5. Current Emphasis on Network Conservation
3. A Quantitative Approach Regarding Bird Movements
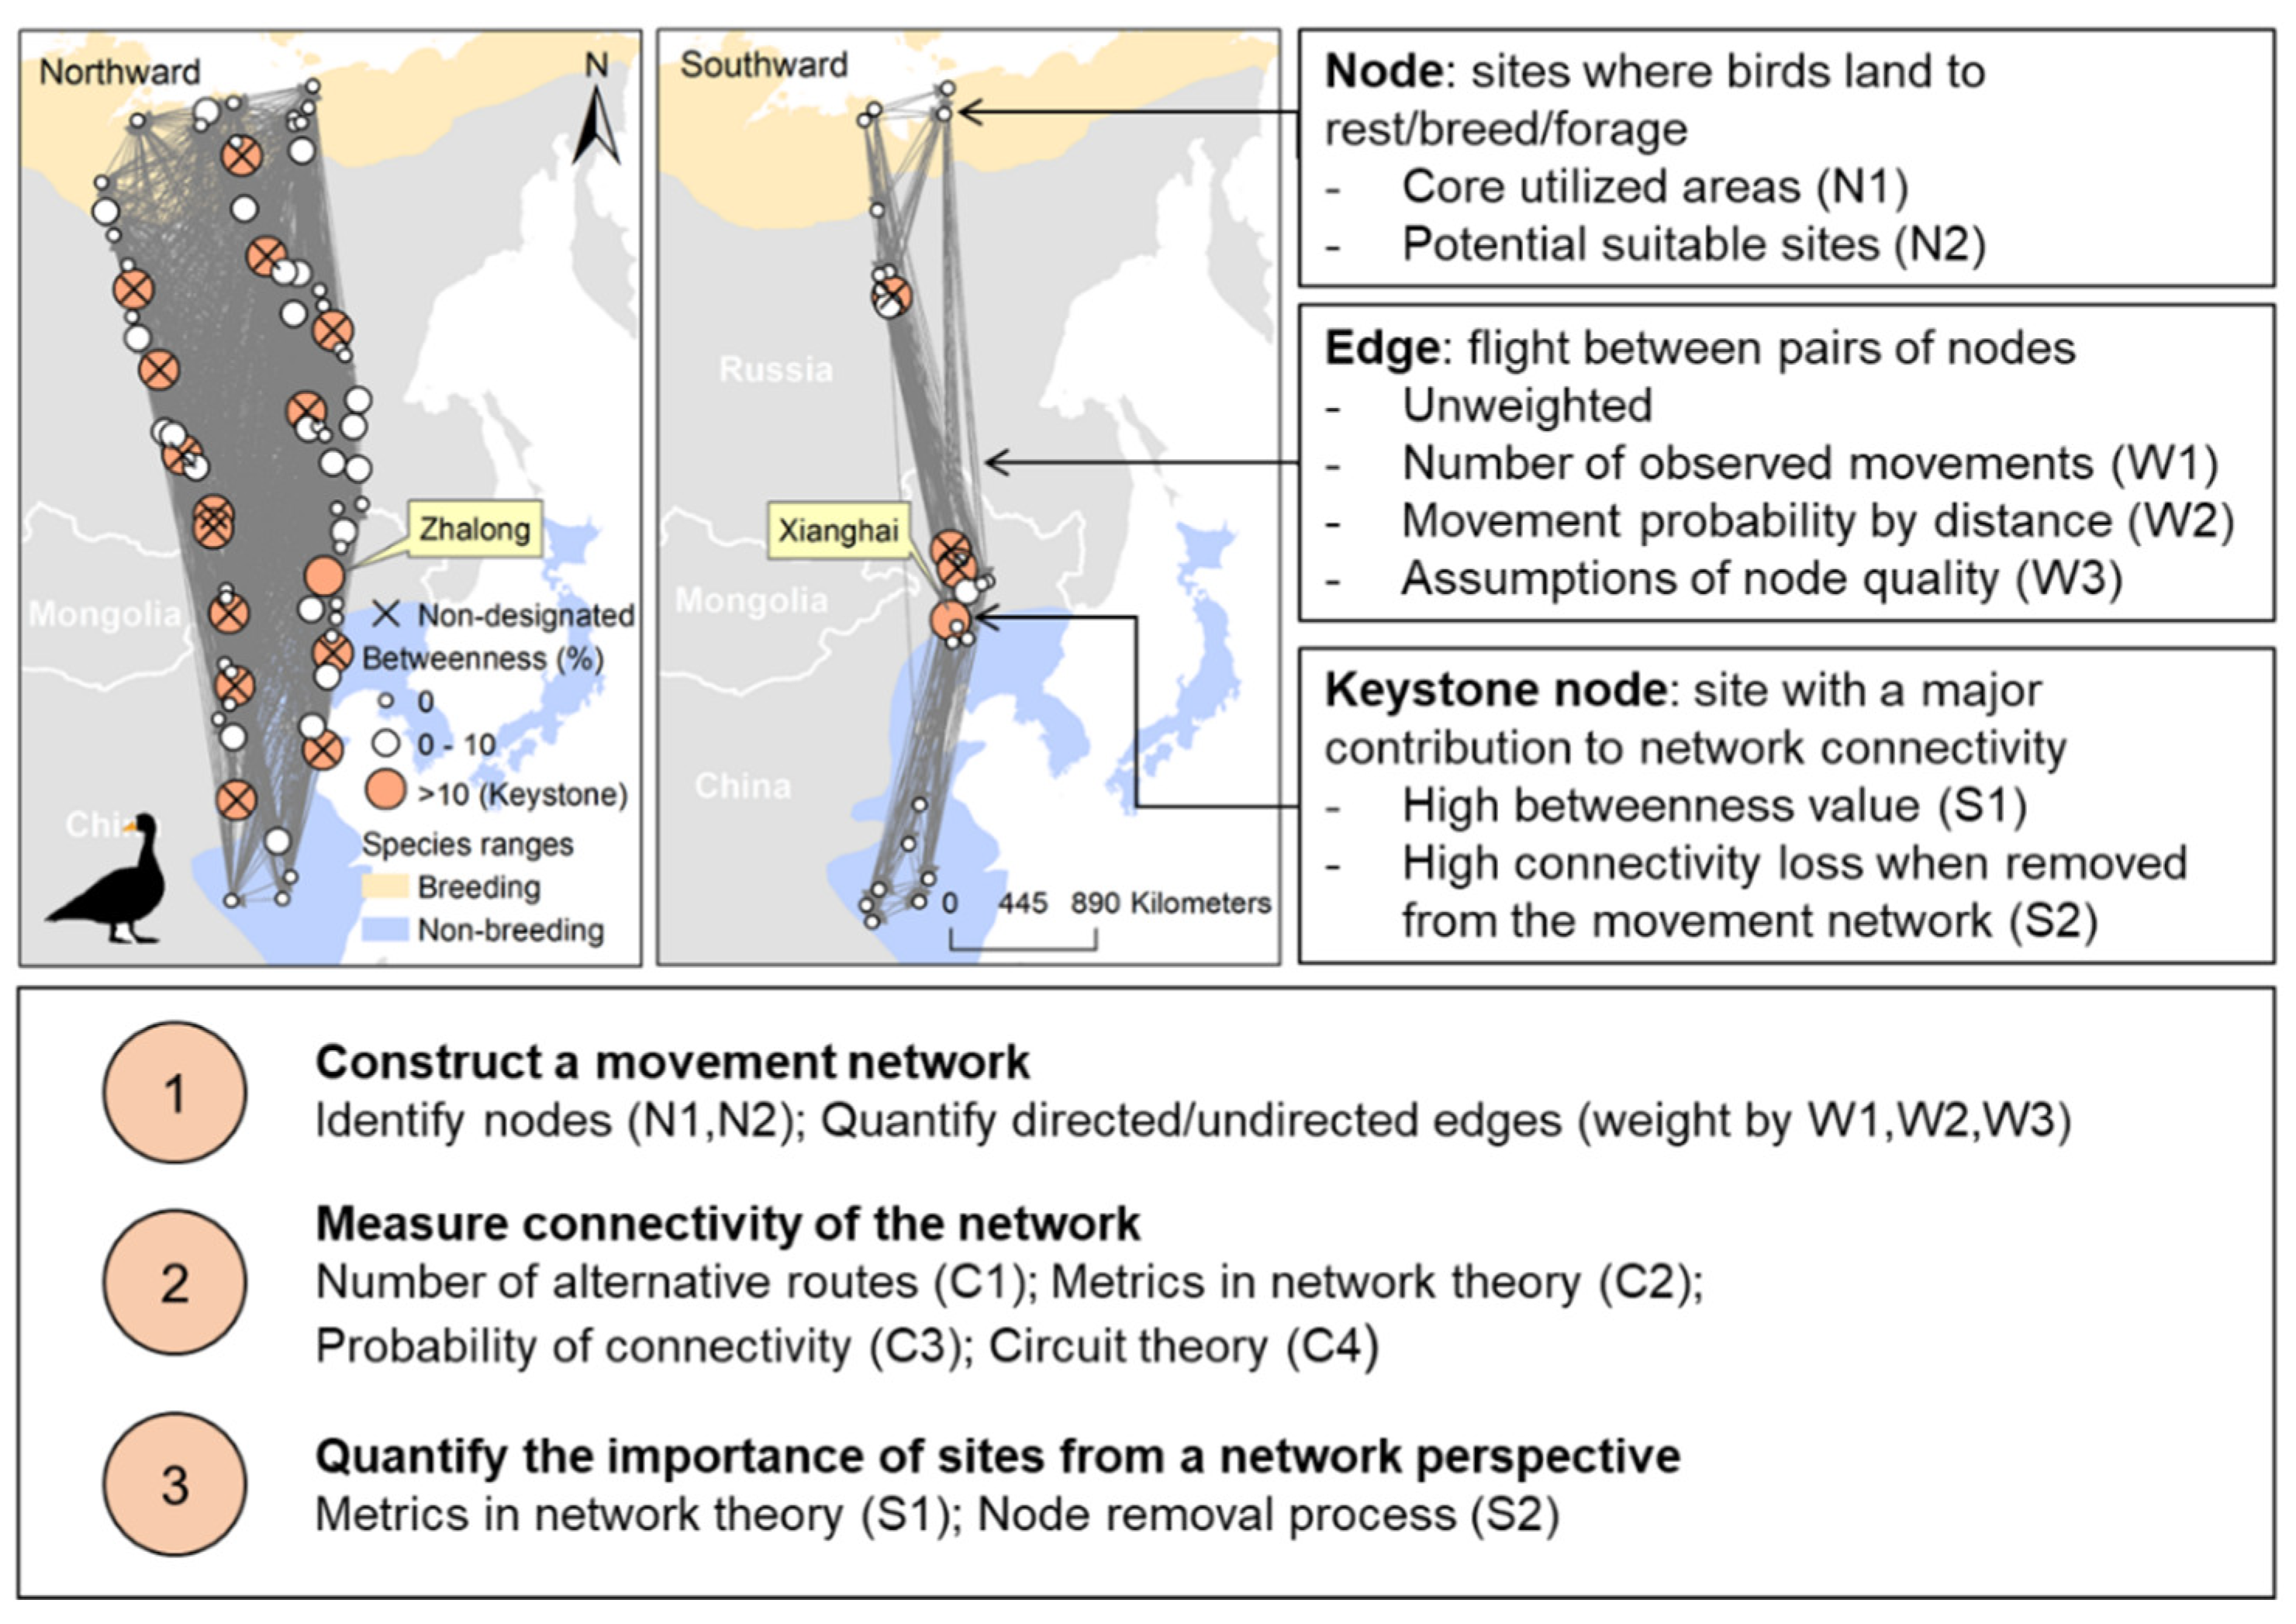
3.1. Step 1: Constructing a Bird Movement Network
3.1.1. Identifying Nodes
- Nodes can be defined as areas that birds regularly or frequently visit (Approach N1), which can be identified from existing diversity, abundance or habitat criteria (Table 1), through count, marking, or capture data (e.g., bird banding and recovery sites), or by applying home range estimators to bird tracking data [25]. This approach assumes the sites where birds were observed, marked, or captured to be staging areas for birds, and are widely defined as nodes in a species’ movement network [26,27,28]. Potential sampling biases may be taken into account, e.g., poor visualization at night reduces the observation rate for nocturnal feeding, or roosting sites that are intensively used by some species (e.g., dabbling ducks [29]). Such potential biases may be tackled by home range estimators to bird tracking data, which identify areas with intensive animal movements based on spatio-temporal point patterns [25]. Main home range estimators include Maximum Convex Polygons Methods (MCP), Kernel Density Estimators (KDE), and Brownian Bridge Movement Models (BBMM), among which dynamic BBMM and movement-based KDE were shown to be the most accurate estimators for home ranges [25]. An equally good alternative is the Guéguen method [30,31], using a Bayesian division algorithm to classify animal behaviour according to turning angles and step lengths.
- Nodes can also be identified by classification of all sites that are potentially suitable for a species of conservation interest for resting, breeding, moulting, or foraging, based on relevant environmental factors (Approach N2). A straightforward way is to identify areas classified as a suitable land cover class for the focal species, e.g., wetland patches for waterbirds [19], and forest patches for woodpeckers [32]. Some studies define protected areas as nodes within a movement network to measure the efficiency of current conservation efforts for conserving the movements of animals [33,34]. We suggest adding other crucial variables that shape the distribution of species such as, for instance, fish densities for fish-eating birds, and climatic conditions for migratory birds. Species distribution models can incorporate a variety of relevant environmental factors to identify potential suitable sites by, e.g., Generalized Linear Models, Maximum Entropy, Random Forests, or ensemble models [35,36,37]. Taking advantage of abundant bird occurrence data and remote sensing data for environmental monitoring, these models can take most crucial factors shaping distribution of a species into account [38]. Furthermore, notes identified by these models could also be compared to the nodes identified by bird counting because they are often protected areas that are already known to harbour concentrations or combinations of species.
3.1.2. Quantifying Edges
- The most straightforward quantification for the weight is the count of movements between two nodes from tracked or marked individuals (Approach W1; [26]). The more representative the covered individuals are to the focal population, the closer the distribution of this count is to that of the movement probability distribution. This approach is suitable for ringing/banding recapture datasets. This approach also works for high-resolution datasets of local bird movements, e.g., the Wytham tit study in which the majority of wild birds in the population were tracked [41].
- Another empirical approach is weighting the edges in terms of the distribution of bird flight distances (e.g., from tracking data) and the geodesic distances between nodes (Approach W2; Figure S1). A decreasing exponential function of distances [42], assuming that greater node-to-node distance is associated with increased cost of movements between nodes, resulting subsequently in a decreased between-nodes dispersal probability (Figure S1), is widely used for weighting edges in movement networks [4,19,34]. In addition, for migration, or immigration, angles that the bird take to move from one node to another can be added to edge weighting [23], based on, e.g., the angle distribution of bird flights and the angles between nodes. Approach W2 is suitable for bird tracking data, which cover a limited number of individuals but provide precise distances and angle distributions of their movements.
- When empirical bird movement data are not available, assumptions regarding, e.g., predation risk, forage abundance, costs of searching and settling in target nodes (sites that birds move to) can be used to weigh the edges (Approach W3). As an example, the migration flow quantified by differences between node attractiveness of start and target nodes [43] can be an index for weighting the edges. Predation risk or disturbance, forage abundance and/or quality, costs of searching and settling in target nodes [44] can also be included as components to weight edges. We suggest considering other environmental factors en route, such as prevailing winds and landscape barriers (i.e., oceans, high mountains, and deserts), that may play an important role in avian movements [45,46].
3.2. Step 2: Measuring the Connectivity of the Movement Network
- For unweighted networks, the number of alternative routes between two representative nodes (e.g., breeding and non-breeding sites) [13] can measure the connectivity (Approach C1). The number of alternative routes is an index for how flexible birds can be when moving in the network, and the degree to which birds can cope with network changes due to, e.g., environmental disturbances such as extreme drought events.
- For weighted networks, the Probability of Connectivity index (Approach C2) [4] is widely used to quantify functional connectivity in animal movement networks [19,34]. This approach uses a graph-based algorithm that quantifies functional connectivity by both the area/suitability of habitat in each node and the probability of movements between nodes; thus, both local habitat availability and between-site connectivity are measured. This approach requires data on the landscape configuration, e.g., the node-specific area of different habitat classes, which can be measured by analyzing land cover maps derived from remote sensing images.
- Classic global metrics in network theory can also be usefully deployed for quantifying the connectivity of site networks (Approach C3, Box 1), although they were originally designed for other fields, e.g., social science. As an example, the modularity [47] of a network, based on classified community memberships [48], can be used to measure the degree to which the movement network is divided into sub-networks (i.e., modules) located in smaller separate spatial regions [26,49]. This is important for identifying spatial units for different functional activities of birds, e.g., day roosting and nocturnal feeding of dabbling ducks [29,50], night roosting and daytime feeding of gulls [51], or high tide roosting of shorebirds [52], which is important for targeted conservation efforts. The generalized clustering coefficient algorithm for weighted directed networks [53] measures the strength of nodes clustering together, which is an alternative to measuring the connectivity of local movements of birds [27]. Degree counts the number of edges pointing to (in-degree) or from (out-degree) the focal node, which is useful for defining hubs and sources of avian movements. Specifically, in a directed network, in-degree and out-degree define hubs (i.e., where birds fly to) and sources (where birds fly from) of the nutrients, contaminants, seeds, or diseases transported by avian movements.
- a.
- Main componentsNodes are points in networks, which can represent e.g. individuals, locations, or communication endpoints. In a bird movement network, we define nodes as the sites that birds use for foraging, resting, moulting, or breeding.Edges are connections between nodes, which represent bird movements between the sites in a bird migration network.Modules are groups of nodes which are intensively connected with each other, but sparsely connected to other nodes from a different module in the network [47].Shortest paths are the least-cost path from one node to the other, in which other nodes in the network may be included as stepping stones [54]. Here a path is a potential route for moving from one node to the other, which includes one or more edges.Keystone nodes are nodes with a major contribution to the network connectivity.
- b.
- Global metrics (the structural characteristics of an entire network)Network size is the number of nodes, which e.g., represent the number of sites used by birds from a given species during regular movements.Number of edges represent the number of direct connections between sites in a network.Average path length is the mean length of all shortest paths, which measures the average cost of moving from one site to the other in a network.Graph path length is the maximum length of all shortest paths (including the shortest paths between each combination of nodes in the network), which measures the maximum cost of moving from one site to another in a network.Transitivity is a generalized clustering coefficient [53], which measures the strength of sites clustering together.Modularity measures the strength of dividing a network into smaller modules based on classified module memberships [47,48].Effective resistance uses ecological circuit theory [8] to quantify the flexibility of bird movements within a site network.
- c.
- Ego metrics (the degree to which a site contributes to the connectivity of the network)Degree is the number or summed weight of edges connected to a focal node [54], which measures to what extent a site is directly connected to other sites in a network.Closeness is the inverse sum of the (weighted) shortest distances to all other nodes [54], which measures the extent to which a site is closely connected to other sites in a network.Betweenness is the number of shortest paths going through a node [55,56], which measures to what extent a site acts as a stepping stone in a network.Bridging centrality is the local bridging centrality value [57], which measures to what extent a site connects different modules in a network.
- 4.
- Electrical circuit theory for ecological processes [58] is another promising pathway for measuring the connectivity (Approach C4), which introduces effective resistance as a measure for the difficulty of movements in a site network (e.g., a higher effective resistance when there are fewer alternative edges for movements). Other algorithms based on resistance surfaces for quantifying connectivity and identifying least-cost paths [59] are comparable to this approach. We suggest using Approach C4 when data allows, because it directly measures the degree to which the site network or landscape facilitates/impedes bird movements.
3.3. Step 3: Determining the Importance of Nodes by Their Contribution to the Connectivity of the Movement Network
- Classic ego metrics in network theory (Box 1) express the contribution of a node to the connectivity of its network (centrality), which is useful for quantifying node importance in a site network (Approach S1) [26,49]. There are three main measures of node centrality: betweenness, closeness, and degree [12] (Box 1). Among these metrics, ‘betweenness’ better captures keystone nodes, because nodes with high betweenness values are important stepping-stones, which, when lost, can result in rapid decreases in network connectivity [12]. In addition, other node-level metrics may be used, depending on specific objectives. For instance, bridging centrality [57] is important when measuring crossroads between different flyways or movement modules.
- Another approach uses a node removal process (Approach S2), which enables quantifying the changes in connectivity of the site network (measurements from Step 2) when removing nodes in different orders [12]. There are three main methods for node removal: single removal, group removal, and cumulative removal. Single removal removes one node at a time from a site network and quantifies node importance by the difference in network connectivity before and after removing it [60]. Group removal removes a group of nodes with certain attributes (e.g., unprotected nodes or nodes in the same geographical zone) [13]. Cumulative removal removes nodes one by one in a certain order without replacements, until the network collapses (e.g., in order of high to low degree of habitat loss [12]).
3.4. Summary and Example of the Three-Step Approach
4. Prospects
Supplementary Materials
Author Contributions
Funding
Institutional Review Board Statement
Data Availability Statement
Acknowledgments
Conflicts of Interest
References
- Runge, C.A.; Watson, J.E.M.; Butchart, S.H.M.; Hanson, J.O.; Possingham, H.P.; Fuller, R.A. Protected areas and global conservation of migratory birds. Science 2015, 350, 1255–1258. [Google Scholar] [CrossRef] [PubMed]
- Gilg, O.; Yoccoz, N.G. Explaining bird migration. Science 2010, 327, 276–277. [Google Scholar] [CrossRef] [PubMed]
- Kiat, Y.; Vortman, Y.; Sapir, N. Feather moult and bird appearance are correlated with global warming over the last 200 years. Nat. Commun. 2019, 10, 2540. [Google Scholar] [CrossRef] [PubMed]
- Saura, S.; Bodin, Ö.; Fortin, M.J. Stepping stones are crucial for species’ long-distance dispersal and range expansion through habitat networks. J. Appl. Ecol. 2014, 51, 171–182. [Google Scholar] [CrossRef]
- Martín-Vélez, V.; Mohring, B.; van Leeuwen, C.H.A.; Shamoun-Baranes, J.; Thaxter, C.B.; Baert, J.M.; Camphuysen, C.J.; Green, A.J. Functional connectivity network between terrestrial and aquatic habitats by a generalist waterbird, and implications for biovectoring. Sci. Total Environ. 2020, 705, 135886. [Google Scholar] [CrossRef] [PubMed]
- Kurvers, R.H.; Straates, K.; Ydenberg, R.C.; van Wieren, S.E.; Swierstra, P.S.; Prins, H.H.T. Social information use by barnacle geese Branta leucopsis, an experiment revisited. Ardea 2014, 102, 173–180. [Google Scholar] [CrossRef]
- Verhagen, J.H.; Herfst, S.; Fouchier, R.A. How a virus travels the world. Science 2015, 347, 616–617. [Google Scholar] [CrossRef]
- Kleyheeg, E.; Treep, J.; de Jager, M.; Nolet, B.A.; Soons, M.B. Seed dispersal distributions resulting from landscape-dependent daily movement behaviour of a key vector species. J. Ecol. 2017, 105, 1279–1289. [Google Scholar] [CrossRef]
- Rosenberg, K.V.; Dokter, A.M.; Blancher, P.J.; Sauer, J.R.; Smith, A.C.; Smith, P.A.; Stanton, J.C.; Panjabi, A.; Helft, L.; Parr, M.; et al. Decline of the North American avifauna. Science 2019, 366, 120–124. [Google Scholar] [CrossRef]
- Studds, C.E.; Kendall, B.E.; Murray, N.J.; Wilson, H.B.; Rogers, D.I.; Clemens, R.S.; Gosbell, K.; Hassell, C.J.; Jessop, R.; Melville, D.S.; et al. Rapid population decline in migratory shorebirds relying on Yellow Sea tidal mudflats as stopover sites. Nat. Commun. 2017, 8, 14895. [Google Scholar] [CrossRef]
- Runge, C.A.; Martin, T.G.; Possingham, H.P.; Willis, S.G.; Fuller, R.A. Conserving mobile species. Front. Ecol. Environ. 2014, 12, 395–402. [Google Scholar] [CrossRef]
- Xu, Y.; Si, Y.; Takekawa, J.; Liu, Q.; Prins, H.H.T.; Yin, S.; Prosser, D.J.; Gong, P.; de Boer, W.F. A network approach to prioritize conservation efforts for migratory birds. Conserv. Biol. 2020, 34, 416–426. [Google Scholar] [CrossRef]
- Shimazaki, H.; Tamura, M.; Darman, Y.; Andronov, V.; Parilov, M.P.; Nagendran, M.; Higuchi, H. Network analysis of potential migration routes for Oriental White Storks (Ciconia boyciana). Ecol. Res. 2004, 19, 683–698. [Google Scholar] [CrossRef]
- Xu, Y.; Si, Y.; Wang, Y.; Zhang, Y.; Prins, H.H.T.; Cao, L.; de Boer, W.F. Loss of functional connectivity in migration networks induces population decline in migratory birds. Ecol. Appl. 2019, 29, e01960. [Google Scholar] [CrossRef] [PubMed]
- Iwamura, T.; Possingham, H.P.; Chadès, I.; Minton, C.; Murray, N.J.; Rogers, D.I.; Treml, E.A.; Fuller, R.A. Migratory connectivity magnifies the consequences of habitat loss from sea-level rise for shorebird populations. Proc. R. Soc. B 2013, 280, 20130325. [Google Scholar] [CrossRef] [PubMed]
- Green, A.J.; Elmberg, J. Ecosystem services provided by waterbirds. Biol. Rev. 2014, 89, 105–122. [Google Scholar] [CrossRef]
- Amezaga, J.; Santamaría, L.; Green, A.J. Biotic wetland connectivity—Supporting a new approach for wetland policy. Acta Oecol. 2002, 23, 213–222. [Google Scholar] [CrossRef]
- Weber, T.P.; Houston, A.I.; Ens, B.J. Consequences of habitat loss at migratory stopover sites: A theoretical investigation. J. Avian Biol. 1999, 30, 416–426. [Google Scholar] [CrossRef]
- Merken, R.; Deboelpaep, E.; Teunen, J.; Saura, S.; Koedam, N. Wetland suitability and connectivity for trans-Saharan migratory waterbirds. PLoS ONE 2015, 10, e0135445. [Google Scholar] [CrossRef]
- Ridgill, S.; Fox, A.D. Cold Weather Movements of Waterfowl in Western Europe; IWRB Special Publication: Slimbridge, UK, 1990. [Google Scholar]
- Wiederholt, R.; Mattsson, B.J.; Thogmartin, W.E.; Runge, M.C.; Diffendorfer, J.E.; Erickson, R.A.; Federico, P.; López-Hoffman, L.; Fryxell, J.; Norris, D.R.; et al. Estimating the per-capita contribution of habitats and pathways in a migratory network: A modelling approach. Ecography 2018, 41, 815–824. [Google Scholar] [CrossRef]
- Erickson, R.A.; Diffendorfer, J.E.; Norris, D.R.; Bieri, J.A.; Earl, J.E.; Federico, P.; Fryxell, J.M.; Long, K.R.; Mattsson, B.J.; Sample, C.; et al. Defining and classifying migratory habitats as sources and sinks: The migratory pathway approach. J. Appl. Ecol. 2018, 55, 108–117. [Google Scholar] [CrossRef]
- Dhanjal-Adams, K.L.; Klaassen, M.; Nicol, S.; Possingham, H.P.; Chadès, I.; Fuller, R.A. Setting conservation priorities for migratory networks under uncertainty. Conserv. Biol. 2017, 31, 646–656. [Google Scholar] [CrossRef] [PubMed]
- Piersma, T.; Gill, R.E., Jr.; Ruthrauff, D.R.; Guglielmo, C.G.; Conklin, J.R.; Handel, C.M. The Pacific as the world’s greatest theater of bird migration: Extreme flights spark questions about physiological capabilities, behavior, and the evolution of migratory pathways. Ornithology 2022, 139, 1–29. [Google Scholar] [CrossRef]
- Walter, W.D.; Onorato, D.P.; Fischer, J.W. Is there a single best estimator? Selection of home range estimators using area-under-the-curve. Mov. Ecol. 2015, 3, 10. [Google Scholar] [CrossRef]
- Calder, J.L.; Cumming, G.S.; Maciejewski, K.; Oschadleus, H.D. Urban land use does not limit weaver bird movements between wetlands in Cape Town, South Africa. Biol. Conserv. 2015, 187, 230–239. [Google Scholar] [CrossRef]
- Grange, Z.L.; van Andel, M.; French, N.P.; Gartrell, B.D. Network analysis of translocated Takahe populations to identify disease surveillance targets. Conserv. Biol. 2014, 28, 518–528. [Google Scholar] [CrossRef]
- Herbert, R.J.; Broderick, L.G.; Ross, K.; Moody, C.; Cruz, T.; Clarke, L.; Stillman, R.A. Artificial coastal lagoons at solar salt-working sites: A network of habitats for specialised, protected and alien biodiversity. Estuar. Coast. Shelf Sci. 2018, 203, 1–16. [Google Scholar] [CrossRef]
- Guillemain, M.; Devineau, O.; Brochet, A.-L.; Fuster, J.; Fritz, H.; Green, A.J.; Gauthier-Clerc, M. What is the spatial unit for a wintering teal Anas crecca? Weekly day roost fidelity inferred from nasal saddles in the Camargue, southern France. Wildlife Biol. 2010, 16, 215–220. [Google Scholar] [CrossRef]
- Xu, Y.; Kieboom, M.; van Lammeren, R.J.A.; Si, Y.; de Boer, W.F. Indicators of site loss from a migration network: Anthropogenic factors influence waterfowl movement patterns at stopover sites. Glob. Ecol. Conserv. 2021, 25, e01435. [Google Scholar] [CrossRef]
- Gueguen, L. Segmentation by Maximal Predictive Partitioning According to Composition Biases. In Proceedings of the International Conference on Biology, Informatics and Mathematics, Montpellier, France, 3–5 May 2000; Springer: Berlin/Heidelberg, Germany, 2001; pp. 32–44. [Google Scholar]
- Gil-Tena, A.; Brotons, L.; Fortin, M.J.; Burel, F.; Saura, S. Assessing the role of landscape connectivity in recent woodpecker range expansion in Mediterranean Europe: Forest management implications. Eur. J. For. Res. 2013, 132, 181–194. [Google Scholar] [CrossRef]
- Bellisario, B. Conserving migration in a changing climate, a case study: The Eurasian spoonbill, Platalea leucorodia leucorodia. Biol. Conserv. 2018, 217, 222–231. [Google Scholar] [CrossRef]
- Santini, L.; Saura, S.; Rondinini, C. Connectivity of the global network of protected areas. Divers. Distrib. 2016, 22, 199–211. [Google Scholar] [CrossRef]
- Bucklin, D.N.; Basille, M.; Benscoter, A.M.; Brandt, L.A.; Mazzotti, F.J.; Romanach, S.; Speroterra, C.; Watling, J.I. Comparing species distribution models constructed with different subsets of environmental predictors. Divers. Distrib. 2015, 21, 23–35. [Google Scholar] [CrossRef]
- Rather, Z.A.; Ahmad, R.; Dar, T.U.H.; Khuroo, A.A. Ensemble modelling enables identification of suitable sites for habitat restoration of threatened biodiversity under climate change: A case study of Himalayan Trillium. Ecol. Eng. 2022, 176, 106534. [Google Scholar] [CrossRef]
- Dondina, O.; Orioli, V.; Torretta, E.; Merli, F.; Bani, L.; Meriggi, A. Combining ensemble models and connectivity analyses to predict wolf expected dispersal routes through a lowland corridor. PLoS ONE 2020, 15, e0229261. [Google Scholar] [CrossRef]
- Somveille, M.; Rodrigues, A.S.L.; Manica, A. Why do birds migrate? A macroecological perspective. Glob. Ecol. Biogeogr. 2015, 24, 664–674. [Google Scholar] [CrossRef]
- Schmaljohann, H.; Both, C. The limits of modifying migration speed to adjust to climate change. Nat. Clim. Chang. 2017, 7, 573–576. [Google Scholar] [CrossRef]
- Buhnerkempe, M.G.; Webb, C.T.; Merton, A.A.; Buhnerkempe, J.E.; Givens, G.H.; Miller, R.S.; Hoeting, J.A. Identification of migratory bird flyways in North America using community detection on biological networks. Ecol. Appl. 2016, 26, 740–751. [Google Scholar] [CrossRef]
- Somveille, M.; Firth, J.A.; Aplin, L.M.; Farine, D.R.; Sheldon, B.C.; Thompson, R.N. Movement and conformity interact to establish local behavioural traditions in animal populations. PLoS Comput. Biol. 2018, 14, e1006647. [Google Scholar] [CrossRef]
- Keitt, T.H.; Urban, D.L.; Milne, B.T. Detecting critical scales in fragmented landscapes. Conserv. Ecol. 1997, 1, 4. [Google Scholar] [CrossRef]
- Yin, S.; de Knegt, H.J.; de Jong, M.C.M.; Si, Y.; Prins, H.H.T.; Huang, Z.Y.X.; de Boer, W.F. Effects of migration network configuration and migration synchrony on infection prevalence in geese. J. Theor. Biol. 2020, 502, 110315. [Google Scholar] [CrossRef] [PubMed]
- Dokter, A.M.; Farnsworth, A.; Fink, D.; Ruiz-Gutierrez, V.; Hochachka, W.M.; La Sorte, F.A.; Robinson, O.J.; Rosenberg, K.V.; Kelling, S. Seasonal abundance and survival of North America’s migratory avifauna determined by weather radar. Nat. Ecol. Evol. 2018, 2, 1603–1609. [Google Scholar] [CrossRef] [PubMed]
- Harel, R.; Duriez, O.; Spiegel, O.; Fluhr, J.; Horvitz, N.; Getz, W.M.; Bouten, W.; Sarrazin, F.; Hatzofe, O.; Nathan, R. Decision-making by a soaring bird: Time, energy and risk considerations at different spatio-temporal scales. Philos. Trans. R. Soc. B 2016, 371, 20150397. [Google Scholar] [CrossRef]
- Bishop, C.M.; Spivey, R.J.; Hawkes, L.A.; Batbayar, N.; Chua, B.; Frappell, P.B.; Milsom, W.K.; Natsagdorj, T.; Newman, S.H.; Scott, G.R.; et al. The roller coaster flight strategy of bar-headed geese conserves energy during Himalayan migrations. Science 2015, 347, 250–254. [Google Scholar] [CrossRef]
- Newman, M.E.J. Modularity and community structure in networks. Proc. Natl. Acad. Sci. USA 2006, 103, 8577–8582. [Google Scholar] [CrossRef]
- Clauset, A.; Newman, M.E.; Moore, C. Finding community structure in very large networks. Phys. Rev. E 2004, 70, 066111. [Google Scholar] [CrossRef] [PubMed]
- Knight, S.M.; Bradley, D.W.; Clark, R.G.; Gow, E.A.; Belisle, M.; Berzins, L.L.; Blake, T.; Bridge, E.S.; Burke, L.; Dawson, R.D.; et al. Constructing and evaluating a continent-wide migratory songbird network across the annual cycle. Ecol. Monogr. 2018, 88, 445–460. [Google Scholar] [CrossRef]
- Tamisier, A. Rythmes nycthéméraux des sarcelles d’hiver pendant leur hivernage en Camargue. Alauda 1972, 40, 235–256. [Google Scholar]
- Martín-Vélez, V.; Sánchez, M.I.; Shamoun-Baranes, J.; Thaxter, C.B.; Stienen, E.W.M.; Camphuysen, K.C.J.; Green, A.J. Quantifying nutrient inputs by gulls to a fluctuating lake, aided by movement ecology methods. Freshw. Biol. 2019, 64, 1821–1832. [Google Scholar] [CrossRef]
- Rogers, D.I. High-tide roost choice by coastal waders. Wader Study Group Bull. 2003, 100, 73–79. [Google Scholar]
- Opsahl, T.; Panzarasa, P. Clustering in weighted networks. Soc. Netw. 2009, 31, 155–163. [Google Scholar] [CrossRef]
- Opsahl, T.; Agneessens, F.; Skvoretz, J. Node centrality in weighted networks: Generalizing degree and shortest paths. Soc. Netw. 2010, 32, 245–251. [Google Scholar] [CrossRef]
- Brandes, U. A faster algorithm for betweenness centrality. J. Math. Sociol. 2001, 25, 163–177. [Google Scholar] [CrossRef]
- Freeman, L.C. Centrality in social networks conceptual clarification. Soc. Netw. 1979, 1, 215–239. [Google Scholar] [CrossRef]
- Macker, J.P. An improved local bridging centrality model for distributed network analytics. In Proceedings of the MILCOM 2016—2016 IEEE Military Communications Conference, Baltimore, MD, USA, 1–3 November 2016; pp. 600–605. [Google Scholar] [CrossRef]
- McRae, B.H.; Dickson, B.G.; Keitt, T.H.; Shah, V.B. Using circuit theory to model connectivity in ecology, evolution, and conservation. Ecology 2008, 89, 2712–2724. [Google Scholar] [CrossRef] [PubMed]
- Peterman, W.E. ResistanceGA: An R package for the optimization of resistance surfaces using genetic algorithms. Methods Ecol. Evol. 2018, 9, 1638–1647. [Google Scholar] [CrossRef]
- Saura, S.; Torne, J. Conefor Sensinode 2.2: A software package for quantifying the importance of habitat patches for landscape connectivity. Environ. Model. Softw. 2009, 24, 135–139. [Google Scholar] [CrossRef]
- Firth, J.A.; Voelkl, B.; Crates, R.A.; Aplin, L.M.; Biro, D.; Croft, D.P.; Sheldon, B.C. Wild birds respond to flockmate loss by increasing their social network associations to others. Proc. R. Soc. B 2017, 284, 20170299. [Google Scholar] [CrossRef]
- Teitelbaum, C.S.; Converse, S.J.; Fagan, W.F.; Böhning-Gaese, K.; O’Hara, R.B.; Lacy, A.E.; Mueller, T. Experience drives innovation of new migration patterns of whooping cranes in response to global change. Nat. Commun. 2016, 7, 12793. [Google Scholar] [CrossRef]
- Fox, A.; Madsen, J.; Boyd, H.; Kuijken, E.; Norriss, D.W.; Tombre, I.M.; Stroud, D.A. Effects of agricultural change on abundance, fitness components and distribution of two arctic-nesting goose populations. Glob. Chang. Biol. 2005, 11, 881–893. [Google Scholar] [CrossRef]
- Aurbach, A.; Schmid, B.; Liechti, F.; Chokani, N.; Abhari, R. Simulation of broad front bird migration across Western Europe. Ecol. Model. 2020, 415, 108879. [Google Scholar] [CrossRef]
- Yin, S.; Xu, Y.; de Jong, M.C.M.; Huisman, M.R.S.; Contina, A.; Prins, H.H.T.; Huang, Z.Y.X.; de Boer, W.F. Habitat loss exacerbates pathogen spread: An agent-based model of avian influenza infection in migratory waterfowl. bioRxiv 2021. [Google Scholar] [CrossRef]
- Taylor, C.M.; Norris, D.R. Population dynamics in migratory networks. Theor. Ecol. 2010, 3, 65–73. [Google Scholar] [CrossRef]
- Taylor, C.M.; Hall, R.J. Metapopulation models for seasonally migratory animals. Biol. Lett. 2011, 8, 477–480. [Google Scholar] [CrossRef]
- Iwamura, T.; Fuller, R.A.; Possingham, H.P. Optimal management of a multispecies shorebird flyway under sea-level rise. Conserv. Biol. 2014, 28, 1710–1720. [Google Scholar] [CrossRef]
- Nicol, S.; Fuller, R.A.; Iwamura, T.; Chadès, I. Adapting environmental management to uncertain but inevitable change. Proc. R. Soc. B 2015, 282, 20142984. [Google Scholar] [CrossRef]
- Duriez, O.; Bauer, S.; Destin, A.; Madsen, J.; Nolet, B.A.; Stillman, R.A.; Klaassen, M. What decision rules might pink-footed geese use to depart on migration? An individual-based model. Behav. Ecol. 2009, 20, 560–569. [Google Scholar] [CrossRef]
- Gilroy, J.J.; Gill, J.A.; Butchart, S.H.M.; Jones, V.R.; Franco, A.M.A. Migratory diversity predicts population declines in birds. Ecol. Lett. 2016, 19, 308–317. [Google Scholar] [CrossRef]
- Tian, H.; Zhou, S.; Dong, L.; Van Boeckel, T.P.; Cui, Y.; Newman, S.H.; Takekawa, J.Y.; Prosser, D.J.; Xiao, X.; Wu, Y.; et al. Avian influenza H5N1 viral and bird migration networks in Asia. Proc. Natl. Acad. Sci. USA 2015, 112, 172–177. [Google Scholar] [CrossRef]
- Tucker, M.A.; Alexandrou, O.; Bierregaard, R.O., Jr.; Bildstein, K.L.; Böhning-Gaese, K.; Bracis, C.; Brzorad, J.N.; Buechley, E.R.; Cabot, D.; Calabrese, J.M.; et al. Large birds travel farther in homogeneous environments. Glob. Ecol. Biogeogr. 2019, 28, 576–587. [Google Scholar] [CrossRef]
- Xu, Y.; Si, Y.; Yin, S.; Zhang, W.; Grishchenko, M.; Prins, H.H.T.; Gong, P.; de Boer, W.F. Species-dependent effects of habitat degradation in relation to seasonal distribution of migratory waterfowl in the East Asian–Australasian Flyway. Landsc. Ecol. 2019, 34, 243–257. [Google Scholar] [CrossRef]
- Food and Agriculture Organization of the United Nations. Radio Telemetry and Bird Movements. Available online: http://www.fao.org/3/a1521e/a1521e07.pdf (accessed on 11 March 2020).
- Fox, A.D.; Elmberg, J.; Tombre, I.M.; Hessel, R. Agriculture and herbivorous waterfowl: A review of the scientific basis for improved management. Biol. Rev. 2016, 92, 854–877. [Google Scholar] [CrossRef] [PubMed]
- Dhanjal-Adams, K.L.; Bauer, S.; Emmenegger, T.; Hahn, S.; Lisovski, S.; Liechti, F. Spatiotemporal group dynamics in a long-distance migratory bird. Curr. Biol. 2018, 28, 2824–2830. [Google Scholar] [CrossRef] [PubMed]
- Kurvers, R.H.; Van Oers, K.; Nolet, B.A.; Jonker, R.M.; Van Wieren, S.E.; Prins, H.H.; Ydenberg, R.C. Personality predicts the use of social information. Ecol. Lett. 2010, 13, 829–837. [Google Scholar] [CrossRef]
- Aplin, L.M.; Farine, D.R.; Morand-Ferron, J.; Cockburn, A.; Thornton, A.; Sheldon, B.C. Experimentally induced innovations lead to persistent culture via conformity in wild birds. Nature 2015, 518, 538. [Google Scholar] [CrossRef]
- Jacoby, D.M.; Freeman, R. Emerging network-based tools in movement ecology. Trends Ecol. Evol. 2016, 31, 301–314. [Google Scholar] [CrossRef]
- Lima, S.L.; Dill, L.M. Behavioral decisions made under the risk of predation: A review and prospectus. Can. J. Zool. 1990, 68, 619–640. [Google Scholar] [CrossRef]
- Lavers, J.L.; Wilcox, C.; Donlan, C.J. Bird demographic responses to predator removal programs. Biol. Invasions 2010, 12, 3839–3859. [Google Scholar] [CrossRef]
- Voelkl, B.; Firth, J.A.; Sheldon, B.C. Nonlethal predator effects on the turn-over of wild bird flocks. Sci. Rep. 2016, 6, 33476. [Google Scholar] [CrossRef]
- Kahlert, J. The constraint on habitat use in wing-moulting Greylag Geese Anser anser caused by anti-predator displacements. Ibis 2003, 145, 45–52. [Google Scholar] [CrossRef]
- Schneider, M.F. Habitat loss, fragmentation and predator impact: Spatial implications for prey conservation. J. Appl. Ecol. 2001, 38, 720–735. [Google Scholar] [CrossRef]
- Byholm, P.; Nikila, A.; Kentta, J.; TIaivalmak, J.P. Interactions between habitat heterogeneity and food affect reproductive output in a top predator. J. Anim. Ecol. 2007, 76, 392–401. [Google Scholar] [CrossRef] [PubMed]
- Layman, C.A.; Quattrochi, J.P.; Peyer, C.M.; Allgeier, J.E. Niche width collapse in a resilient top predator following ecosystem fragmentation. Ecol. Lett. 2007, 10, 937–944. [Google Scholar] [CrossRef] [PubMed]
- Ryall, K.L.; Fahrig, L. Response of predators to loss and fragmentation of prey habitat: A review of theory. Ecology 2006, 87, 1086–1093. [Google Scholar] [CrossRef]
- Buckley, A.; Dawson, A.; Moss, S.R.; Hinsley, S.A.; Bellamy, P.E.; Gould, E.A. Serological evidence of West Nile virus, Usutu virus and Sindbis virus infection of birds in the UK. J. Gen. Virol. 2003, 84, 2807–2817. [Google Scholar] [CrossRef]
- Olsen, B.; Munster, V.J.; Wallensten, A.; Waldenström, J.; Osterhaus, A.D.; Fouchier, R.A. Global patterns of influenza A virus in wild birds. Science 2006, 312, 384–388. [Google Scholar] [CrossRef]
- Gorsich, E.E.; Webb, C.T.; Merton, A.A.; Hoeting, J.A.; Miller, R.S.; Farnsworth, M.L.; Swafford, S.R.; DeLiberto, T.J.; Pedersen, K.; Franklin, A.B.; et al. Continental-scale dynamics of avian influenza in U.S. waterfowl are driven by demography, migration, and temperature. Ecol. Appl. 2021, 31, e2245. [Google Scholar] [CrossRef]
- Tuyttens, F.A.M.; Delahay, R.J.; Macdonald, D.W.; Cheeseman, C.L.; Long, B.; Donnelly, C.A. Spatial perturbation caused by a badger (Meles meles) culling operation: Implications for the function of territoriality and the control of bovine tuberculosis (Mycobacterium bovis). J. Anim. Ecol. 2000, 69, 815–828. [Google Scholar] [CrossRef]
- Singer, A.; Smith, G.C. Emergency rabies control in a community of two high-density hosts. BMC Vet. Res. 2012, 8, 79. [Google Scholar] [CrossRef]
- Xu, Y. Unravelling Networks: Causes and consequences of Decreasing Connectivity in Bird Migration Pathway; Wageningen University: Wageningen, The Netherlands, 2020. [Google Scholar]
- Yin, S. Consequences of Seasonal Migration: How Goose Relocation Strategies Influence Infection Prevalence and Pathogen Dispersal; Wageningen University: Wageningen, The Netherlands, 2018. [Google Scholar]
- Charalambidou, I.; Santamaría, L. Field evidence for the potential of waterbirds as dispersers of aquatic organisms. Wetlands 2005, 25, 252. [Google Scholar] [CrossRef]
- van Leeuwen, C.H.; Van der Velde, G.; van Groenendael, J.M.; Klaassen, M. Gut travellers: Internal dispersal of aquatic organisms by waterfowl. J. Biogeogr. 2012, 39, 2031–2040. [Google Scholar] [CrossRef]
- Green, A.J.; Soons, M.; Brochet, A.L.; Kleyheeg, E. Dispersal of plants by waterbirds. In Why Birds Matter: Avian Ecological Function Ecosystem Services; University of Chicago Press: Chicago, IL, USA, 2016; p. 147. [Google Scholar]
- Lovas-Kiss, A.; Sánchez, M.I.; Wilkinson, D.M.; Coughlan, N.E.; Alves, J.A.; Green, A.J. Shorebirds as important vectors for plant dispersal in Europe. Ecography 2019, 42, 956–967. [Google Scholar] [CrossRef]
- Green, A.J.; Figuerola, J.; Sánchez, M.I. Implications of waterbird ecology for the dispersal of aquatic organisms. Acta Oecol 2002, 23, 177–189. [Google Scholar] [CrossRef]
- Hattermann, D.; Bernhardt-Römermann, M.; Otte, A.; Eckstein, R.L. Geese are overlooked dispersal vectors for vascular plants in archipelago environments. J. Veg. Sci. 2019, 30, 533–541. [Google Scholar] [CrossRef]
- Ramo, C.; Amat, J.A.; Nilsson, L.; Schricke, V.; Rodríguez-Alonso, M.; Gómez-Crespo, E.; Jubete, F.; Navedo, J.G.; Masero, J.A.; Palacios, J.; et al. Latitudinal-related variation in wintering population trends of greylag geese (Anser Anser) along the atlantic flyway: A response to climate change? PLoS ONE 2015, 10, e0140181. [Google Scholar] [CrossRef]
- Valls, L.; Castillo-Escrivà, A.; Barrera, L.; Gómez, E.; Gil-Delgado, J.A.; Mesquita-Joanes, F.; Armengol, X. Differential endozoochory of aquatic invertebrates by two duck species in shallow lakes. Acta Oecol. 2017, 80, 39–46. [Google Scholar] [CrossRef]
- Lovas-Kiss, Á.; Vincze, O.; Kleyheeg, E.; Sramkó, G.; Laczkó, L.; Fekete, R.; Molnár, V.A.; Green, A.J. Seed mass, hardness, and phylogeny explain the potential for endozoochory by granivorous waterbirds. Ecol. Evol. 2020, 10, 1413–1424. [Google Scholar] [CrossRef]
- Blais, J.M.; Kimpe, L.E.; McMahon, D.; Keatley, B.E.; Mallory, M.L.; Douglas, M.S.V.; Smol, J.P. Arctic seabirds transport marine-derived contaminants. Science 2005, 309, 445. [Google Scholar] [CrossRef]
- Blais, J.M.; Macdonald, R.W.; Mackay, D.; Webster, E.; Harvey, C.; Smol, J.P. Biologically mediated transport of contaminants to aquatic systems. Environ. Sci. Technol. 2007, 41, 1075–1084. [Google Scholar] [CrossRef]
- Klekowski, E.; Temple, S.; Siung-Chang, A.; Kumarsingh, K.J. An association of mangrove mutation, scarlet ibis, and mercury contamination in Trinidad, West Indies. Environ. Pollut. 1999, 105, 185–189. [Google Scholar] [CrossRef]
- Anderson, W.B.; Polis, G.A. Nutrient fluxes from water to land: Seabirds affect plant nutrient status on Gulf of California islands. Oecologia 1999, 118, 324–332. [Google Scholar] [CrossRef] [PubMed]
- Kraus, R.H.; Zeddeman, A.; Van Hooft, P.; Sartakov, D.; A Soloviev, S.; Ydenberg, R.C.; Prins, H.H. Evolution and connectivity in the world-wide migration system of the mallard: Inferences from mitochondrial DNA. BMC Genet. 2011, 12, 99. [Google Scholar] [CrossRef] [PubMed]
- Jonker, R.M.; Kraus, R.H.S.; Zhang, Q.; van Hooft, P.; Larsson, K.; van der Jeugd, H.P.; Kurvers, R.H.J.M.; van Wieren, S.E.; Loonen, M.J.J.E.; Crooijmans, R.P.M.A.; et al. Genetic consequences of breaking migratory traditions in barnacle geese Branta leucopsis. Mol. Ecol. 2013, 22, 5835–5847. [Google Scholar] [CrossRef] [PubMed]
- Ottenburghs, J.; van Hooft, P.; van Wieren, S.E.; Ydenberg, R.C.; Prins, H.H.T. Hybridization in geese: A review. Front. Zool. 2016, 13, 20. [Google Scholar] [CrossRef] [PubMed]
- Wallis, G. Genetic Status of New Zealand Black Stilt (Himantopus novaezelandiae) and Impact of Hybridisation; Department of Conservation: Wellington, New Zealand, 1999. [Google Scholar]
- Graham, A.M.; Peters, J.L.; Wilson, R.E.; Muñoz-Fuentes, V.; Green, A.J.; Dorfsman, A.D.; Valqui, H.T.; Winker, K.; McCracken, K.G. Adaptive introgression of the beta-globin cluster in two Andean waterfowl. Heredity 2021, 127, 107–123. [Google Scholar] [CrossRef] [PubMed]
- Ottenburghs, J.; van Hooft, P.; van Wieren, S.E.; Ydenberg, R.C.; Prins, H.H.T. Birds in a bush: Toward an avian phylogenetic network. Auk 2016, 133, 577–582. [Google Scholar] [CrossRef]
- Gretton, A.; Baccetti, N. The Ecology and Conservation of the Slender-Billed Curlew (Numenius tenuirostris); International Council for Bird Preservation: Cambridge, UK, 1991. [Google Scholar]
- Eames, J. Latest Survey Fails to Find Pink-Headed Duck. The Babbler: BirdLife in Indochina. 2008, pp. 31–32. Available online: http://datazone.birdlife.org/species/factsheet/pink-headed-duck-rhodonessa-caryophyllacea (accessed on 19 May 2020).
- McNamara, J.M.; Houston, A.I.; Lima, S.L. Foraging routines of small birds in winter: A theoretical investigation. J. Avian Biol. 1994, 25, 287–302. [Google Scholar] [CrossRef]
- Godet, L.; Devictor, V. What conservation does. Trends Ecol. Evol. 2018, 33, 720–730. [Google Scholar] [CrossRef]
- Zöckler, C.; Hla, T.H.; Clark, N.; Syroechkovskiy, E.; Yakushev, N.; Daengphayon, S.; Robinson, R.O.B. Hunting in Myanmar is probably the main cause of the decline of the Spoon-billed Sandpiper Calidris pygmeus. Wader Study Group Bull. 2010, 117, 1–8. [Google Scholar]
- Amano, T.; Székely, T.; Sandel, B.; Nagy, S.; Mundkur, T.; Langendoen, T.; Blanco, D.; Soykan, C.U.; Sutherland, W.J. Successful conservation of global waterbird populations depends on effective governance. Nature 2018, 553, 199. [Google Scholar] [CrossRef]
- Gaget, E.; Le Viol, I.; Pavón-Jordán, D.; Cazalis, V.; Kerbiriou, C.; Jiguet, F.; Popoff, N.; Dami, L.; Mondain-Monval, J.Y.; du Rau, P.D.; et al. Assessing the effectiveness of the Ramsar Convention in preserving wintering waterbirds in the Mediterranean. Biol. Conserv. 2020, 243, 108485. [Google Scholar] [CrossRef]
- Kleijn, D.; Cherkaoui, I.; Goedhart, P.W.; van der Hout, J.; Lammertsma, D. Waterbirds increase more rapidly in Ramsar-designated wetlands than in unprotected wetlands. J. Appl. Ecol. 2014, 51, 289–298. [Google Scholar] [CrossRef]
- Ministry of the Environment. Kabukuri-Numa and Surrounding Rice Paddies. An Introduction of Good Practices in Japan. 2010. Available online: https://www.biodic.go.jp/biodiversity/shiraberu/policy/pes/en/satotisatoyama/satotisatoyama01.html (accessed on 19 May 2020).
- Pernollet, C.A.; Guelmami, A.; Green, A.J.; Masip, A.C.; Dies, B.; Bogliani, G.; Tesio, F.; Brogi, A.; Gauthier-Clerc, M.; Guillemain, M. A comparison of wintering duck numbers among European rice production areas with contrasting flooding regimes. Biol. Conserv. 2015, 186, 214–224. [Google Scholar] [CrossRef]
- Côté, I.M.; Sutherland, W.J. The Effectiveness of Removing Predators to Protect Bird Populations. Biol. Conserv. 1997, 11, 395–405. [Google Scholar] [CrossRef]
- Lilleyman, A.; Rogers, D.I.; Jackson, M.V.; Fuller, R.A.; O’Brien, G.; Garnett, S.T. An artificial site provides valuable additional habitat to migratory shorebirds in a tropical harbour. Pac. Conserv. Biol. 2020, 26, 249–257. [Google Scholar] [CrossRef]
- Sebastián-González, E.; Green, A.J. Reduction of avian diversity in created versus natural and restored wetlands. Ecography 2016, 39, 1176–1184. [Google Scholar] [CrossRef]


| Name of Site Inventory (Abbreviation) | Year | Responsible Agencies/Institutions | Governance Framework | Criteria (C)/Articles (A)/Sub-Qualifier for Selection (or Identification) of Sites 1 | |||
|---|---|---|---|---|---|---|---|
| Diversity | Abundance | Habitat Property | Movement Network | ||||
| Ramsar Sites (Ramsar) | 1971 | Ramsar Convention | Global inter-government | C2 | C5, C6 | C1, C3 | C4 |
| Emerald Network of Areas of Special Conservation Interest (ASCI) | 1979 | Bern Convention, Council of Europe | Regional inter-government | Aa, Ab | - | Ac, Ad | Ae |
| Natura 2000: Special Protection Areas (SPA) | 1979, 1992 | European Commission Birds Directive, Europe; Habitats Directive | Regional inter-government | B (Stage1) | - | A (Stage1) | - |
| Critical Site Network (CSN) | 2010 | Wetlands International and BirdLife International | Partnership of organisations: African Eurasian Waterbird Agreement, Ramsar, Wetlands International, BirdLife International | C1 | C2 | - | - |
| Western/Central Asian Site Network for Siberian Cranes and Other Waterbirds (WCASN) | 2007 | Convention on Migratory Species (CMS) | Flyway agreement under CMS | C1 | Sub-qualifier 2.1 | - | Sub-qualifier 2.4 |
| Western Hemisphere Shorebird Reserve Network (WHSRN) | 1985 | WHSRN Committee | Flyway Partnership of governments, international NGOs, and others | - | C2 | - | - |
| East Asian—Australasian Flyway Site Network (EAAFSN) | 2006 | East Asian—Australasian Flyway Partnership (EAAFP) | Flyway Partnership of governments, conventions, international NGOs, and others | Ca2 | Ca5, Ca6 | - | Cbi, Cbii, Cc |
| Global Important Bird Areas (IBA) | 1995 | BirdLife International | NGO based | A1, A2, A3 | A4 | - | - |
Publisher’s Note: MDPI stays neutral with regard to jurisdictional claims in published maps and institutional affiliations. |
© 2022 by the authors. Licensee MDPI, Basel, Switzerland. This article is an open access article distributed under the terms and conditions of the Creative Commons Attribution (CC BY) license (https://creativecommons.org/licenses/by/4.0/).
Share and Cite
Xu, Y.; Green, A.J.; Mundkur, T.; Hagemeijer, W.; Mossad, H.; Prins, H.H.T.; de Boer, W.F. Beyond Site-Specific Criteria: Conservation of Migratory Birds and Their Habitats from a Network Perspective. Diversity 2022, 14, 353. https://doi.org/10.3390/d14050353
Xu Y, Green AJ, Mundkur T, Hagemeijer W, Mossad H, Prins HHT, de Boer WF. Beyond Site-Specific Criteria: Conservation of Migratory Birds and Their Habitats from a Network Perspective. Diversity. 2022; 14(5):353. https://doi.org/10.3390/d14050353
Chicago/Turabian StyleXu, Yanjie, Andy J. Green, Taej Mundkur, Ward Hagemeijer, Haitham Mossad, Herbert H. T. Prins, and Willem F. de Boer. 2022. "Beyond Site-Specific Criteria: Conservation of Migratory Birds and Their Habitats from a Network Perspective" Diversity 14, no. 5: 353. https://doi.org/10.3390/d14050353
APA StyleXu, Y., Green, A. J., Mundkur, T., Hagemeijer, W., Mossad, H., Prins, H. H. T., & de Boer, W. F. (2022). Beyond Site-Specific Criteria: Conservation of Migratory Birds and Their Habitats from a Network Perspective. Diversity, 14(5), 353. https://doi.org/10.3390/d14050353