Article

Gradients in the Diversity of Plants and Large Herbivores Revealed with DNA Barcoding in a Semi-Arid African Savanna

1
Department of Ecology, Evolution, and Organismal Biology, Brown University, Providence, RI 02912, USA
2
Institute at Brown for Environment and Society, Brown University, Providence, RI 02912, USA
3
Department of Natural Resources, Karatina University, Karatina 10101, Kenya
4
Mpala Research Centre, Nanyuki 555-10400, Kenya
5
Botany Department, National Museums of Kenya, Nairobi 451660-0100, Kenya
6
Smithsonian Tropical Research Institute, CTFS-ForestGEO, Washington, DC 20560, USA
*
Author to whom correspondence should be addressed.
Diversity 2022, 14(3), 219; https://doi.org/10.3390/d14030219
Submission received: 31 January 2022 / Revised: 7 March 2022 / Accepted: 11 March 2022 / Published: 17 March 2022
(This article belongs to the Special Issue Plant DNA Barcodes, Community Ecology, and Species Interactions)

Abstract

:
Do hotspots of plant biodiversity translate into hotspots in the abundance and diversity of large mammalian herbivores? A common expectation in community ecology is that the diversity of plants and animals should be positively correlated in space, as with the latitudinal diversity gradient and the geographic mosaic of biodiversity. Whether this pattern ‘scales down’ to landscape-level linkages between the diversity of plants or the activities of highly mobile megafauna has received less attention. We investigated spatial associations between plants and large herbivores by integrating data from a plant-DNA-barcode phylogeny, camera traps, and a comprehensive map of woody plants across the 1.2-km2 Mpala Forest Global Earth Observatory (ForestGEO) plot, Kenya. Plant and large herbivore communities were strongly associated with an underlying soil gradient, but the richness of large herbivore species was negatively correlated with the richness of woody plants. Results suggest thickets and steep terrain create associational refuges for plants by deterring megaherbivores from browsing on otherwise palatable species. Recent work using dietary DNA metabarcoding has demonstrated that large herbivores often directly control populations of the plant species they prefer to eat, and our results reinforce the important role of megaherbivores in shaping vegetation across landscapes.

1. Introduction

African savannas are home to the greatest extant concentration of wild large herbivores, many of which are facing extinctions that have far-reaching consequences for whole ecosystems, and plant communities in particular [1,2,3]. Although large herbivores can range widely, many exhibit habitat preferences that reflect different needs to access water, avoid predators, or forage on palatable plants [4,5,6,7]. Elucidating spatial relationships between plants and large herbivores is paramount to understanding and managing change in savanna ecosystems.
A common expectation in biodiversity science is that the diversity of plants and animals is positively correlated [8,9]. The latitudinal diversity gradient and the geographic mosaic of ‘interaction biodiversity’ are thought to be potential outcomes of this positive association [10]. Positive associations in plant and consumer diversity can emerge from similar responses to abiotic gradients [9], disturbance [11], and biotic interactions [12]. For example, resource gradients can generate overlapping gradients in plant and animal diversity across biomes (e.g., tundra vs. tropical rainforest) as well as within landscapes (e.g., mesic vs. xeric microhabitats) [13,14]. Whether positive biodiversity associations across trophic levels enable predictions about landscape-level linkages between the local diversity of plants and the activities of highly mobile herbivores that eat them is an open question, although recent dietary DNA-metabarcoding studies suggest the diversity of plants and large herbivores is more tightly linked than currently appreciated [15].
Analyses of local plant and animal communities can be used to test key hypotheses about how shared habitat associations may develop. The Resource Specialization Hypothesis posits that locally diverse plants support locally diverse consumers by providing a broader array of resources that can accommodate the dietary niches of more consumer species [16,17]. In contrast, the More Individuals Hypothesis posits that more diverse plant communities are often more productive, thereby increasing both the abundance of individual consumers and hence the number of consumer species [16,18]. If a positive correlation between the diversity of plants and large mammalian herbivores exists, it may arise from their generalist feeding strategies and requirements—consistent with the More Individuals Hypothesis. However, comparing these hypotheses to gain understanding about whether plant and animal diversities are locally linked requires consideration of what it means to be a ‘specialist’ and whether the evolutionary relationships of species reflect traits that determine where they occur [10,12,19]. Strong inferences can be made about how spatial distributions are structured by incorporating information on species’ ecological and evolutionary similarities [20]. A relatively small number of species can represent a broad diversity of evolutionary lineages, and vice versa [21]. Within communities of large herbivores, for example, some species may consume relatively few plant taxa (taxonomic specialists) from many plant lineages (phylogenetic generalists) whereas others may consume many taxa from few lineages [19]. Thus, even ‘generalized’ large herbivores may exhibit feeding or habitat preferences that establish colocalized ‘hotspots’ of plant and animal diversity—consistent with the Resource Specialization Hypothesis and contrary to the More Individuals Hypothesis.
We combined a plant-DNA-barcode phylogeny, a comprehensive map of woody plants, and camera-trap data to evaluate whether the abundance and diversity of plants and large herbivores are correlated across the ForestGEO plot at Mpala Research Centre, Kenya. The Mpala ForestGEO plot spans soil and topographic gradients, making it possible to evaluate local covariation in the taxonomic and phylogenetic diversity of woody plants and large herbivores at scales of tens to hundreds of meters while controlling for the influence of large-scale biogeographic differences in species pools [22]. We used these data to test three hypotheses: (i) the diversity of woody plants and large herbivores is significantly different between habitats, such that habitats with high woody-plant density also have high taxonomic and phylogenetic diversity of both plants and animals; (ii) local herbivore diversity is strongly and positively correlated with local plant diversity, both within and between habitats that support different baseline resource availabilities (i.e., tree density) and diversities (i.e., taxonomic and phylogenetic); and (iii) the taxonomic and phylogenetic compositions of plant and herbivore communities are spatially congruent, consistent with a linkage between the diversity of plants and large mammals.

2. Materials and Methods
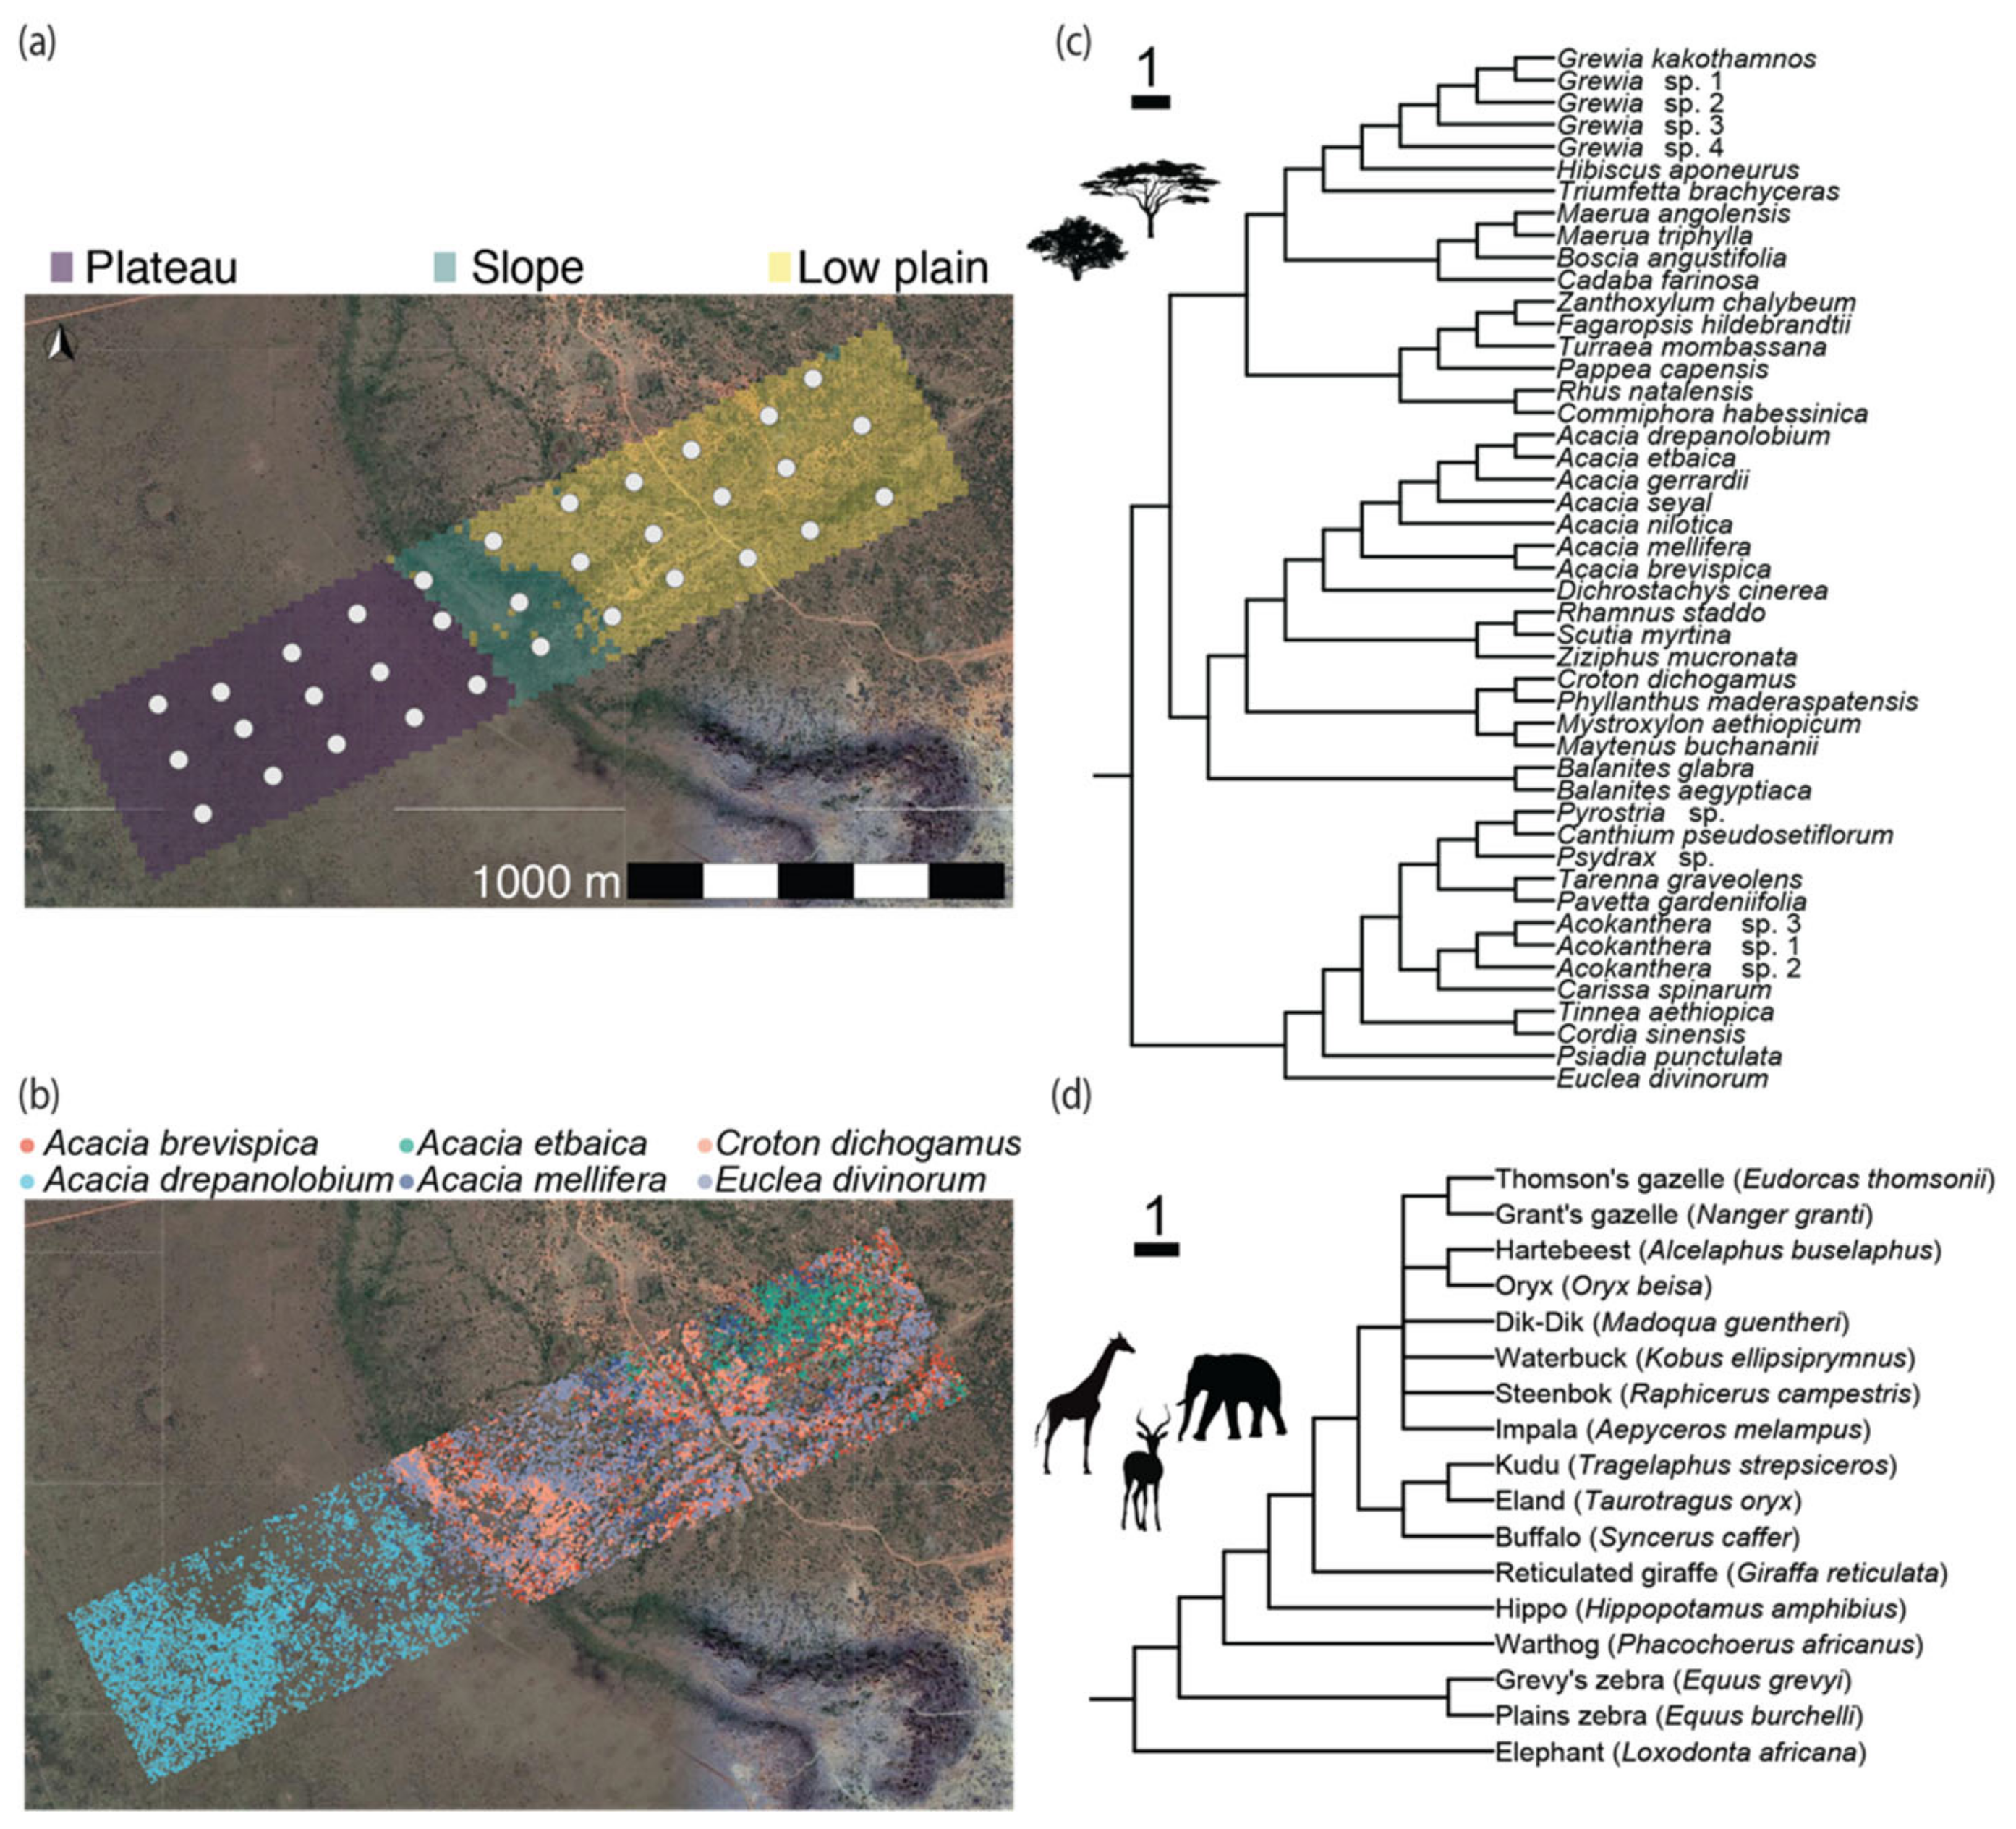
2.1. Study Location

Our analysis is based on the 1.2-km2 Mpala ForestGEO plot (0°17′ N, 36°53′ E) [22]. The plot is in a semi-arid savanna (~600 mm annual rainfall) that supports at least 17 wild large herbivore species (>5 kg). The ForestGEO plot includes at least 62 woody plant species out of >460 plant species that occur in the region [22,23]. It spans three habitats characteristic of the Laikipia Highlands: (i) ‘plateau’ habitat on poorly drained and nutrient-rich clay vertisols (black-cotton soil; 1775–1792 m asl); (ii) ‘low plain’ habitat on well-drained, nutrient-poor, red sandy loams (red sands soil; 1669–1779 m asl); and (iii) a rocky ‘slope’ between the plateau and low plain (1679–1779 m asl).
We analyzed communities of woody plants and large herbivores at 33 sites within the ForestGEO plot (Figure 1). The sites were positioned at regular 100-m intervals across the plot, with 14 occurring in the plateau, 3 on the slope, and 16 in the low plain. Across the plot, we also measured fine-scale topographic habitat variables, including elevation, slope, and convexity, based on elevation data recorded in a 5 m × 5 m grid [22]. We associated our topographic values with a set of 20 m × 20-m vegetation quadrats using the fgeo.analyze package [24] in R [25]. After standardizing measures of elevation, slope, and convexity to a mean of 0 and standard deviation of 1, the three variables were used to classify the 3000 20 × 20-m quadrats into the three major habitats (plateau, slope, and low plain) using Ward hierarchical clustering (Figure 1). Finally, we calculated the topographic wetness index (TWI), which reflects the ability of a landscape to retain water and is a strong predictor of savanna wildlife distributions [26], by integrating the total water catchment area and slope of each grid cell using build.layers in the dynatopmodel package [27]. Cells with high TWI tend to be flat or concave.

2.2. Woody Plant Distribution and DNA Barcoding

The first comprehensive ForestGEO survey of woody plants began in 2010. It established a regular grid of 400-m2 quadrats in which the main and auxiliary stems of woody trees and shrubs > 0.5 m tall were geolocated, tagged, and measured for diameter at knee height (dkh) [22]. Species were identified by researchers from the East African Herbarium at the National Museums of Kenya. We obtained the complete dataset from the ForestGEO portal (12 March 2019) [22]. It included 363,798 total stems and 139,078 main stems (henceforth ‘individual trees’) representing 67 species and 22 families. The branching architecture of shrubs such as Croton and Euclea can make it difficult to identify discrete individuals, but we assumed the data were internally consistent. The dataset was filtered to include only living stems > 2 cm dkh, species with >2 main stems in the plot, and sufficient identification for phylogenetic analysis. The filtered data retained 355,461 stems, 136,297 individual trees, and 55 morphospecies (Table S1). We extracted a dataset for analysis that focused on trees within 25 m2 of our 33 grid sites.
Our plant phylogeny was based on an extensive plant DNA barcode library and phylogeny for Mpala, which was constructed using a supermatrix approach [15,23,28]. The full DNA barcode library includes high-quality data from 1760 specimens representing at least 438 species sequenced at up to 5 markers (matK, rbcL, psbA-trnH, trnL-F, and ITS). A subset of species missing from the phylogeny were grafted in three complementary ways. First, we obtained new trnL and rbcL DNA barcodes from 5 species [23], and we used these data to determine how to graft them into the phylogeny (Table S1). Second, we represented taxa with substitutes that were already in the phylogeny (e.g., congeners, such as Hibiscus aponeurus used to represent Hibiscus spp.; Figure 1, Table S1). Third, we grafted remaining species based on the literature (see Table S1 for details).

2.3. Large Mammalian Herbivore Community Data

To assess herbivore distributions, we deployed camera traps from March 2018 to April 2019 (Bushnell, #11-9874C). We recorded date, time, and species using Wild-ID software [29]. Photos of large herbivores were extracted and filtered to independent detections (defined as >30 min apart) to reduce the impacts of temporal autocorrelation. For each species, we calculated a relative abundance index (RAI) as the total number of independent photographs divided by the total number of working camera days over the course of the survey. Simple RAI-based approaches yielded relative abundance estimates that correlated strongly with independent estimates of animal abundance for large mammals [30].

2.4. Community Diversity Indices

We compared species richness and two phylogenetic diversity metrics for the plants and herbivores across sites. Phylogenetic diversity metrics included the standard effect sizes of mean pairwise distance (sesMPD) and mean nearest-taxon distance (sesMNTD) in the package picante in R [31]. The sesMPD metric is sensitive to the phylogenetic diversity of deep-branching lineages, whereas sesMNTD is sensitive to diversity patterns close to the tips of the phylogeny [32]. These metrics use null models to determine whether observed communities contain taxa that are phylogenetically clustered or overdispersed [33]. For each site, we randomly generated 999 communities that shuffled the names of taxa across the phylogeny while holding the richness of the community constant.
To characterize turnover in plant and animal communities, we quantified dissimilarity across sites. We considered both the taxonomic and phylogenetic composition of communities using phylogenetic community dissimilarity (PCD) in picante [34]. The PCD metric accounts for taxonomic dissimilarity (i.e., PCDc; ‘community’ species differences) and evolutionary dissimilarity (PCDp; ‘phylogenetic’ differences between non-shared species), where PCD = PCDc × PCDp. If PCD = 1, two sites are no more or less similar than communities assembled at random from the species pool. If PCDp = 1, then PCD = PCDc, and communities reflect only taxonomic differences. However, if PCDc = 1, then differences are due entirely to the phylogenetic distances between nonshared species (i.e., PCDp). If all nonshared species are closely related, PCDp is low; if two sites have nonshared species from very divergent clades, then PCDp is high. Because the PCD metric is based on species presence/absence patterns, and because PCDp is undefined in comparisons of sites with identical species composition, we focused our analyses on PCD and PCDc and infer the relative importance of phylogeny by comparison.

2.5. Hypothesis Testing

To test hypothesis i, that the abundances and diversities of woody plants and large herbivores differs across habitats, we compared data from 33 sites. To estimate diversity, we used species richness, sesMPD, and sesMNTD at sites. To estimate abundance, we used the total number of plant stems and the summed RAI of all herbivore species. We focused on total stems as an indicator of thicket density and sightline obstruction, which inform large-herbivore habitat use [35]. However, different trees have different branching architectures—even within species, shorter trees can have more short stems—and heavy damage can promote stem proliferation where megaherbivores are abundant [36]. Thus, interpretations of total stem counts as a measure of thicket density and basal area as a measure of plant biomass may differ. Habitat comparisons were made using ANOVAs and Tukey’s HSD. We also compared total plant-species richness across sites within each habitat using sample-based rarefaction based on the Bernoulli product model [37].
To test hypothesis ii, that local plant and herbivore diversities were positively correlated, we compared abundance and diversity both within and between habitats using ANCOVA. We constructed linear models in R using the herbivore-community characteristic as the dependent variable and the corresponding vegetation characteristic as the independent variable, with habitat types as the covariate (plateau vs. low plain). Because we had a small sample size of slope sites (N = 3), we only included the major plateau (N = 14) and low plain (N = 16) habitats in these linear models.
Finally, we evaluated hypothesis iii, that plant and animal communities are spatially linked. First, we tested for significant differences in PCD between habitats using permutational multivariate analyses of variance (perMANOVA) [38]. Second, we tested for significant correspondence between plant and animal PCD using Mantel tests. To account for the possibility that community similarities arise from spatial proximity, we used partial Mantel tests to evaluate correlations while accounting for distance between sites. Finally, to identify species-specific habitat associations, we performed indicator species analyses using the point biserial correlation coefficient based on Pearson’s ϕ statistic with 999 bootstraps in indicspecies [39]. Pearson’s ϕ ranges from −1 to 1, indicating strong avoidance or preference, respectively. The analysis was based on species’ relative abundances using Hellinger transformation, corrected for unequal sampling across habitats, reported with P-values calculated independently across species.

3. Results

3.1. Ecological Characteristics of the Plot

The plateau was flat and topographically homogeneous compared to the slope and low plain (Figure 1 and Figure S1, Table 1). Both slope and convexity were lowest in the plateau, intermediate in the low plain, and greatest on the slope (Figure S1). The plateau’s flat, clay soils that provide little opportunity for rain infiltration or runoff produced the highest TWI (Figure S1). Plant communities at grid sites included 47 out of 55 woody plant species from the plot-wide data—species that together represented 98% of identified stems in the plot (Table S1). This included 7621 individual plants (median = 193 stems/site; range = 20–925; Table S2). Numerically dominant species were Acacia drepanolobium, Croton dichogamus, A. brevispica, Euclea divinorum, A. mellifera, and A. etbaica (Figure 1, Table S1). Herbivore communities were characterized by 8879 independent photographs of 17 species over 10,075 trap days (median = 329 days/site; Tables S3 and S4). The most common species were dik-dik, giraffe, plains zebra, impala, and elephant (Tables S3 and S4).

3.2. Hypothesis Testing

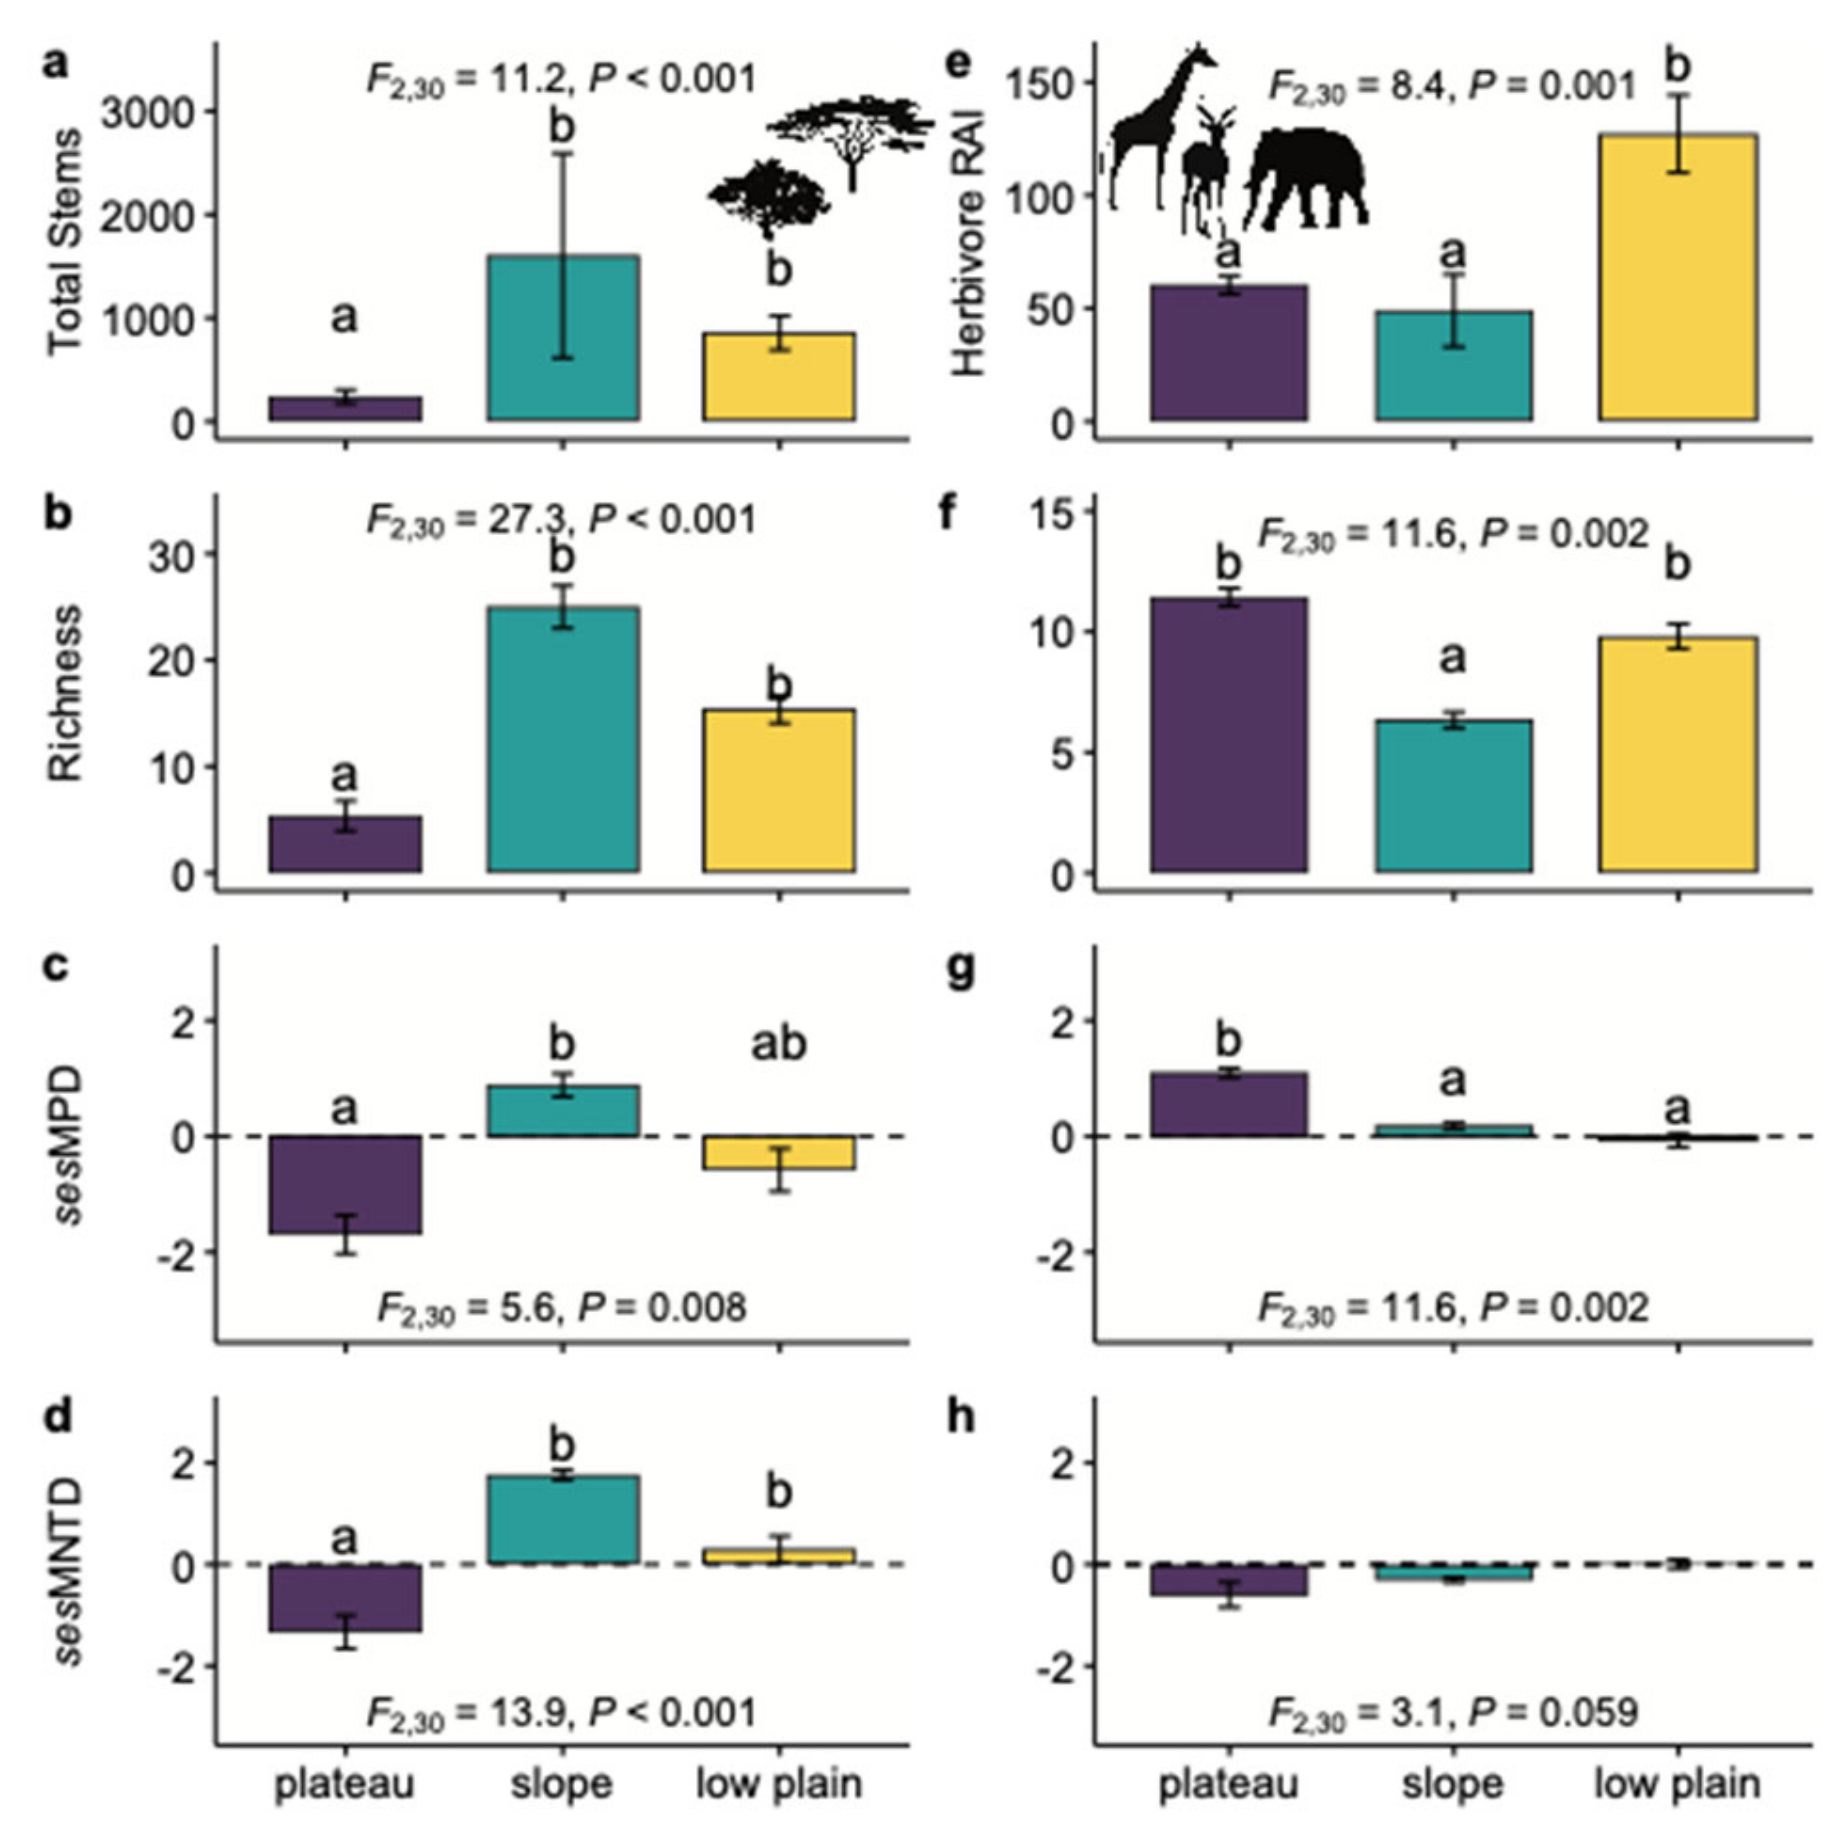
3.2.1. Hypothesis 1: Dense Habitats Should Have High Plant and Animal Diversity

Results were not consistent with our first hypothesis. Although high woody-plant abundances in the low plain and slope were generally associated with high plant taxonomic and phylogenetic diversities, the greatest herbivore abundances and diversities were not necessarily in these same habitats. Woody-plant density and richness was ~2–3-fold lower on the plateau compared to the slope and low plain (Table 1; Figure 2a,b). Similar patterns were found for phylogenetic diversity: the plateau had the lowest diversity and the low plain was intermediate (Figure 2c,d). In contrast, while herbivore abundance was also ~2-fold lower on the plateau than low plain, abundance on the slope was similar (Figure 2e) and richness on the slope was much lower (Figure 2f). Rarefaction revealed the greatest plant-species richness and lowest herbivore richness on the slope (Figure S2). Patterns of phylogenetic diversity also differed, with herbivore sesMPD being greatest on the plateau (Figure 2g) and sesMNTD not differing significantly across habitats (Figure 2h).

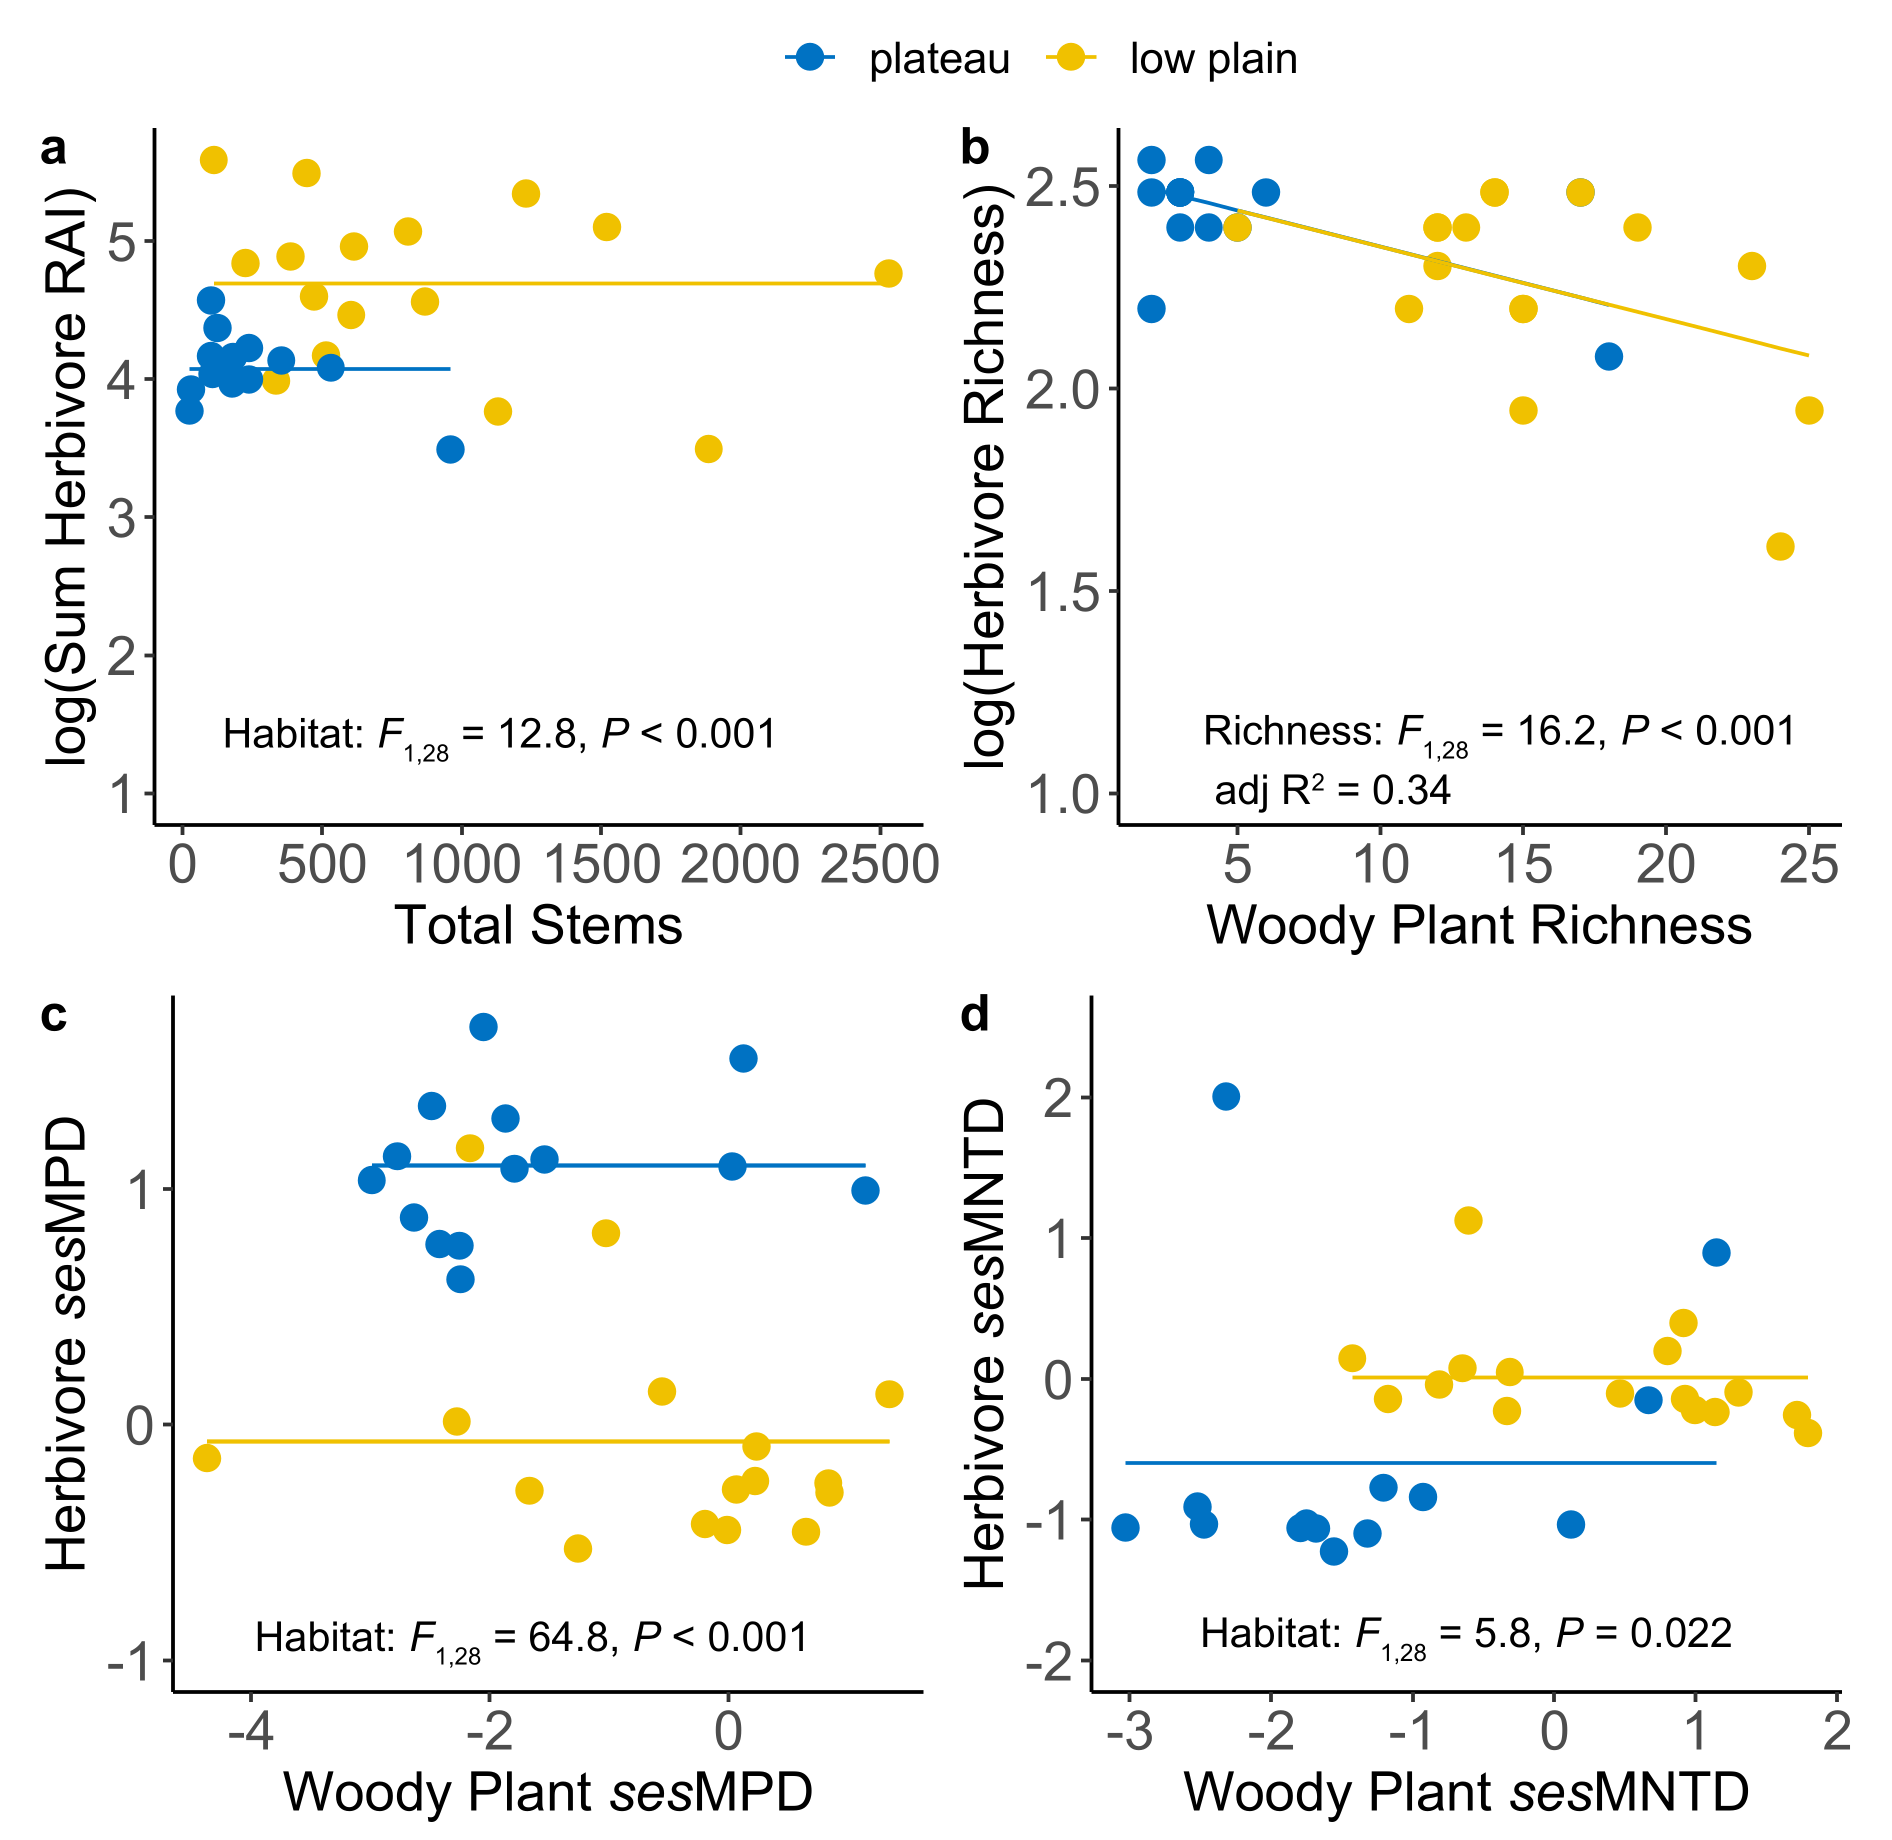
3.2.2. Hypothesis 2: Herbivore and Plant Diversity Should Be Positively Correlated

Contrary to our second hypothesis, there was not a significant positive correlation between the abundance and diversity of flora and fauna within and across habitats (Figure 3). In contrast, there was a significant negative correlation between the richness of flora and fauna within and between habitats (Figure 3b) and we found evidence only for overall habitat-level differences in the abundance and phylogenetic diversities of plants and animals (Figure 3a,c,d). There was an interesting contrast between herbivore phylogenetic diversity in the plateau and low plain: sesMPD, which is sensitive to deep patterns in the phylogeny, was greater in the plateau; sesMNTD, which is sensitive to variation near the tips, was greater in the low plain (Figure 3c,d). Thus, plateau sites hosted large herbivores that both represented species from disparate mammalian lineages and that were likely to include closely related pairs of species from those lineages.

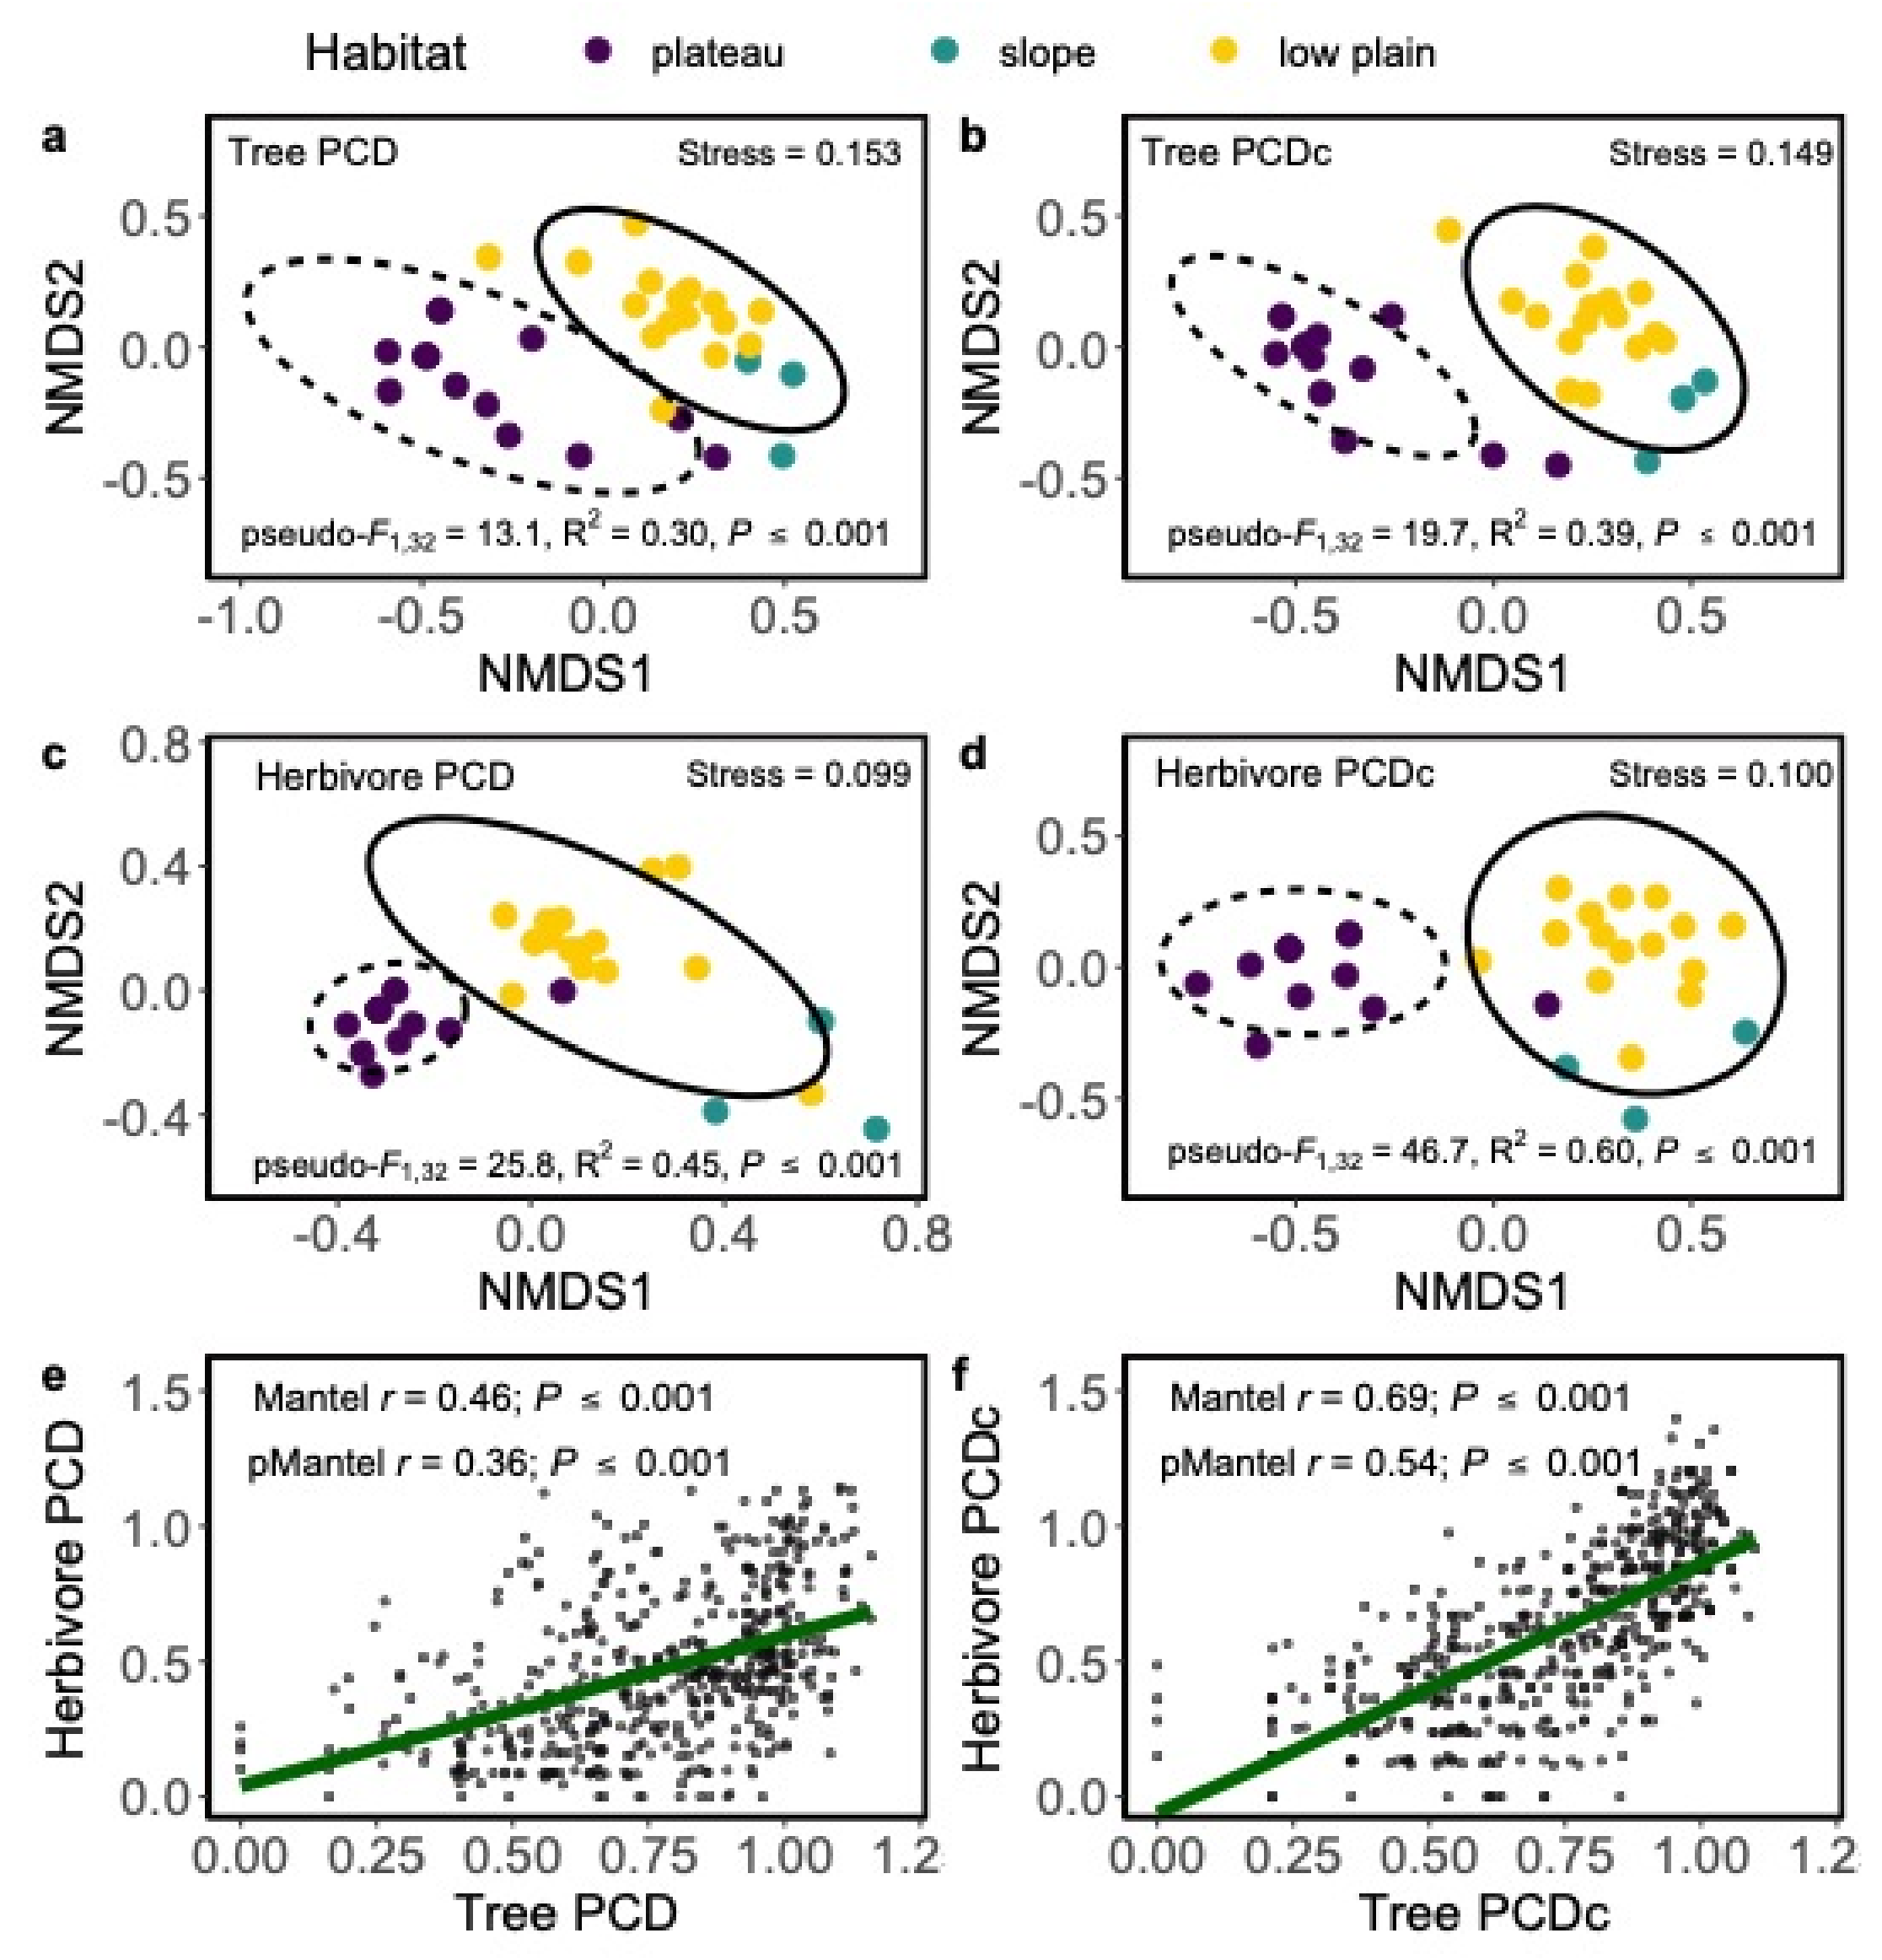
3.2.3. Hypothesis 3: Spatial Links in the Composition of Plant and Animal Communities

Consistent with our third hypothesis, spatial turnover in woody-plant and large-herbivore communities was congruent. There was significant taxonomic dissimilarity between communities of plants and herbivores across habitats (Figure 4a,b). Taxonomic differentiation was strong across habitats, but incorporating information on phylogenetic variance eroded the signal of habitat associations (Figure 4b,d). There were significant positive correlations between local plant and herbivore community compositions, even after accounting for spatial proximity and phylogenetic variance, but these correlations were also strongest when accounting only for species composition (Figure 4e,f). About half of the tree species were significantly associated with or avoided a habitat (25/47, 53%; Figure S3a). Of these, most were negatively associated with the plateau (20/47 species, 43%) and only one had affinity for it (Acacia drepanolobium; Figure S3a). Eight tree species were significantly associated with the low plain, including several that were also negatively associated with the plateau (Balanites glabra, Acacia gerrardii, A. etbaica, A. brevispica, Acokanthera sp. 1, Pyrostria sp. and two Grewia spp.; Figure S3a). Many tree species had strong and positive affinities for the slope, especially those that also had positive affinities for the low plain, although slope sample sizes were small and results were not statistically significant (Figure S3a). In contrast to plants, nearly all large herbivore species exhibited significant habitat association or avoidance 94% (16/17; Figure S3b). Most species exhibited preferred either the plateau (9/17, 53%) or low plain (7/17, 41%), while none were associated with the slope and most avoided it (11/17, 65%; Figure S3b).

4. Discussion

We used fine-scale data on woody-plant and large-herbivore communities to evaluate local biodiversity linkages across trophic levels. The flora with the most abundant woody stems also supported the greatest taxonomic and phylogenetic diversity of woody plants. However, this abundance and diversity of plants did not necessarily translate into a greater abundance or diversity of herbivores. Across habitats, the low plain had a high abundance of both plants and large herbivores, but the slope had a comparably high abundance of plants with a markedly lower abundance of herbivores (Figure 2). Both within and across habitats, there was also a negative relationship between local plant and herbivore-species richness (Figure 3). While plant and animal communities differed across habitats, this pattern was not reinforced by phylogeny (Figure 4). In contrast with prior studies reporting phylogenetic associations between plants and insect herbivores [40,41], our results reveal how compositional turnover in some plant and animal assemblages may be random with respect to phylogeny, even when habitat filtering is highly nonrandom with respect to plant and animal functional traits across disparate evolutionary lineages [20].
Results were not generally consistent with the More Individuals or Resource Specialization hypotheses. The More Individuals Hypothesis posits that greater resource availability enables more individuals to establish, and hence more species of consumers to co-occur [16]. In contrast to positive correlations between the abundance and diversity of some plant and herbivore assemblages that have been studied at local-to-global scales [14,42,43], our results revealed landscape-level contrasts between the abundance and diversity of plants and large herbivores, as well as surprising negative correlations in their species richness across 33 sites. Under the Resource Specialization Hypothesis, plant diversity should enable more specialized consumer species to establish in the community. For example, insect-species richness may increase with the richness and phylogenetic diversity of grassland and forest plants [42,43]. However, ungulate herbivores that require relatively large quantities of food are unlikely to be attracted to or excluded from a local community based on similar mechanisms involving narrow feeding specializations. The low plain had relatively high plant abundance and species richness compared to the plateau, but it only revealed higher average herbivore abundance and not higher herbivore richness. Further contradicting both hypotheses, the slope and low plain had comparable levels of plant abundance and species richness, yet the slope supported lower animal abundance and richness. We thus consider other non-mutually exclusive mechanisms to explain two striking patterns in our data: (i) the distinct flora and fauna across the gradient from heavy-clay vertisol (“black-cotton”) soils of the plateau through the sloping transition to the sandy (“red”) soils of the low plain and (ii) the negative correlation between plant and animal-species richness.
First, the flora of the plateau and low plain differed strikingly, but both were dominated by Acacia spp. (Figure 4). Acacias are a diverse suite of savanna trees that browsing ungulates eat extensively [19]. The clay soils of the plateau are dominated by Acacia drepanolobium whereas sandy soils of the low plain are dominated by A. mellifera, A. etbaica, and A. brevispica (Figure 1). Some herbivores were common in multiple habitats during the study period (e.g., giraffe, elephant, zebras, eland, and buffalo), whereas others were recorded almost exclusively in one habitat (hartebeest, oryx, and Grant’s gazelle in plateau; dik-dik and waterbuck in low plain; Table S3, Figure S3) [44]. The subset of herbivores common across habitats spanned disparate lineages, whereas many of those with strong associations were close relatives from the Bovidae family (Figure 1). Thus, although the flora and fauna of each habitat is taxonomically different, taxa from diverse lineages share the functional abilities to occupy their shared habitats.
Second, there was a strong negative correlation between the richness of plants and animals together with contrasting patterns of plant and animal abundance and phylogenetic diversity across habitat types. Relatively high local plant abundance and diversity could be either a cause or consequence of relatively low herbivore abundance and diversity [45,46]. High plant abundance could cause of low animal abundance and diversity if thickets of woody plants are avoided by herbivores due to risk of predation. Many wild large herbivores perceive risk associated with the presence of predators and prefer good sight lines in habitats with low tree density [35,44]. Topographic features, particularly slope and convexity, further interrupt sightlines such that steep habitats with high tree and predator densities, coupled with challenging terrain, could deter herbivores from steep slopes, thereby alleviating top-down pressure on plants [4,36,47]. Rapid changes in topography can impose particularly strong mechanical and energetic constraints on megaherbivores such as elephants and giraffes, which avoided the steep slopes and have been shown to inflict markedly less damage on trees in this habitat [36].
Long-term herbivore-exclusion experiments at Mpala highlight the ability of megaherbivores to exert strong top-down effects on plant abundance and diversity. For example, elephants can reduce the availability of forbs that comprise a substantial portion of browsing mesoherbivore diets [19,48,49] while also increasing visibility and the availability of grasses for grazers [19,50]. The defensive strategies employed by abundant tree species on the slope suggest plant-herbivore sensitivity to top-down regulation that could contribute to their differential abundance across habitats. For example, some tree species that were relatively abundant on the steep slope invest heavily in antiherbivore defenses, including Croton dichogamus (Euphorbiaceae; produces noxious latex) and Euclea divinorum (Ebenaceae; produces tough, fibrous, and tannin-rich leaves) [19,51]. These defenses could deter consumption by the smaller-bodied ruminants that are abundant on the slope (e.g., dik-dik), but could be less effective against megaherbivores such as elephants and giraffes that otherwise frequently consume them elsewhere [52]. Whereas many recent studies focus on behaviorally mediated fear responses and trophic cascades [4,47], our results reinforce the important and spatially heterogeneous indirect effects that megaherbivores can have on vegetation [12,44,48,49,50,53].
The same physical habitat features that obstruct herbivore sightlines and could lead to avoidance of thickets can have methodological implications for camera-trap studies. We assumed approximately equivalent 25-m2 radii detection ranges for camera traps at each grid site. However, reduced sightlines could lead to underestimates of the abundance and diversity of large herbivores in dense vegetation or on slopes [54]. This possibility suggests that the contrast between animal abundance and diversity observed in the plateau and low plain habitats could be conservative, since the low plain had both higher stem density and higher herbivore RIA (Table 1). However, the slope habitat had especially high stem density and complex topography, coupled with comparatively low herbivore RIA (Table 1), suggesting that further camera-trapping efforts may reveal additional animal use of plots in this habitat. It would be interesting to model seasonal variation in both detection rates and ungulate habitat associations across the plot: habitat associations might become stronger in the dry season when ungulates have the greatest need to monopolize the specific resources for which each is best able to compete, or alternatively these associations may be dampened if food depletion forces them to access the same reserves of riskier or less-preferred resources that accumulate on slopes and in thickets [4,5,55].
Our analyses combined a comprehensive woody-plant survey with DNA barcoding, which was methodologically useful both for refining plant identifications and modeling their phylogenetic relationships [23]. Data that support detailed investigations into ecological linkages between plants and herbivores—whether these linkages amount to spatial cooccurrence, trophic interactions, or both—are needed because these integrations have strong influences on the structure and function of both terrestrial and aquatic ecosystems worldwide [56,57]. Yet while the ecological and evolutionary processes that generate patterns of phylogenetic signal in relatively specialized species interactions have received substantial recent attention (e.g., host–microbiome [58], host–parasite [59]), less attention has been paid to phylogenetic structure in broader types of species interactions (e.g., plant–mycorrhiza [60], seed disperser networks [61], vertebrate trophic networks [19]) or habitat associations [62]. Because all species interactions and co-occurrence networks are subject to environmental and biological filters that act on species’ functional traits, patterns of habitat use may generate phylogenetic signal in cooccurrence networks across trophic levels more frequently than currently realized. Our analysis focused on a uniquely fine-scale example of habitat associations across trophic levels, including phylogenetically diverse communities of woody plants and large herbivores. Results suggest no strong phylogenetic structure to the filtering of plant and animal traits that determine their habitat associations, since closely related species had divergent habitat associations and members of divergent clades often co-occurred.

Supplementary Materials

The following supporting information can be downloaded at: https://www.mdpi.com/article/10.3390/d14030219/s1, Figure S1: Maps of the study plot showing fine-scale major topographic characteristics, including (a) elevation, (b) convexity, (c) slope, and (d) topographic wetness index (TWI); Figure S2: Sample-based rarefaction of (a) woody-plant and (b) large-herbivore communities to compare total species richness within habitats based on our 33 grid sites (the actual numbers of sampling units in each habitat are shown as large points); Figure S3: Indicator species analysis for (a) woody plant and (b) large herbivore species across habitats. Points are colored by habitat and closed circles correspond to habitat associations (positive) or avoidance (negative) that differ significantly from 0; Table S1: Summary of plant species and DNA barcodes. The table matches names of species in our phylogeny with names used in the ForestGEO dataset, includes information on new DNA barcodes presented in this paper, descriptions of how species were added to the existing phylogeny [23], and the abundance of species across the plot as well as within our 33 grid sites; Table S2: Summary of plant abundances across 33 grid sites in this analysis. The table includes grid information (corresponding camera ID number, habitat, location in UTM) with site-specific plant abundance (total stems, individual trees) and diversity values (richness, sesMPD, sesMNTD); the p-values for site-specific phylogenetic diversity metrics are provided (significant positive values indicate phylogenetic overdispersion and negative values represent clustering). The site × species matrix based on the count of individual trees is then provided; Table S3: Summary of large-herbivore RAI values across 33 camera sites. The table includes grid information (camera ID number, habitat, location in UTM) with site-specific animal abundance (summed RAI) and diversity values (richness, sesMPD, sesMNTD), and the P-values for site-specific phylogenetic diversity are provided (significant positive values indicate phylogenetic overdispersion and negative values represent clustering). The site × species matrix based on RAI values is then provided; Table S4: Raw large-herbivore camera-trap records for the study period. For each photo, the table includes grid location, herbivore species, camera deployment date, photo-capture date and time, season (binned “wet” and “dry”), and the total camera-trap deployment days (in both wet and dry seasons). File S1: Nexus-formatted phylogeny for the 47 woody plant species present at the grid sites and used in analyses. References: [23,63,64,65] are cited in Supplementary Materials.

Author Contributions

Conceptualization, P.T.F. and T.R.K.; methodology, P.T.F., P.M.M. and D.K. (David Kenfack); P.T.F. and T.R.K.; investigation, P.T.F., R.O.A., D.K. (Duncan Kimuyu), P.L.E., M.M. and T.R.K.; data curation, P.T.F., B.A.G. and T.R.K.; writing—original draft preparation, P.T.F. and T.R.K.; writing—review and editing, all authors; funding acquisition, D.K. and T.R.K. All authors have read and agreed to the published version of the manuscript.

Funding

This research was funded by NSF DEB-1930820.

Institutional Review Board Statement

Not applicable.

Data Availability Statement

New plant DNA barcodes are available on Genbank (Accessions: trnL-F, OM238064-OM238067; rbcLa, OM238062-OM238063), the full plant DNA barcode library is available on BOLD (‘DS-UHURUR3′, https://doi.org/10.5883/DS-UHURUR3), and the plant phylogeny is available in File S1.

Acknowledgments

We thank the Government of Kenya for granting permission to conduct this research, Mpala Research Centre for its staff and logistical support, and the Institute at Brown for Environment and Society for supporting student participation in the work. The Mpala ForestGEO plot is a collaborative project of the National Museums of Kenya and the Mpala Research Centre in partnership with the Forest Global Earth Observatory (ForestGEO) of the Smithsonian Tropical Research Institute (STRI). Funding for the first census was provided by ForestGEO. Smithsonian Tropical Research Institute, ForestGEO, and International Foundation for Science (D/5455-2) provided additional funding support for this work.

Conflicts of Interest

The authors declare no conflict of interest.

References

  1. Galetti, M.; Moleón, M.; Jordano, P.; Pires, M.M.; Guimarães, P.R.; Pape, T.; Nichols, E.; Hansen, D.; Olesen, J.M.; Munk, M.; et al. Ecological and evolutionary legacy of megafauna extinctions. Biol. Rev. Camb. Philos. Soc. 2018, 93, 845–862. [Google Scholar] [CrossRef] [PubMed]
  2. Ripple, W.J.; Newsome, T.M.; Wolf, C.; Dirzo, R.; Everatt, K.T.; Galetti, M.; Hayward, M.W.; Kerley, G.I.H.; Levi, T.; Lindsey, P.A.; et al. Collapse of the world’s largest herbivores. Sci. Adv. 2015, 1, e1400103. [Google Scholar] [CrossRef] [Green Version]
  3. Estes, J.A.; Terborgh, J.; Brashares, J.S.; Power, M.E.; Berger, J.; Bond, W.J.; Carpenter, S.R.; Essington, T.E.; Holt, R.D.; Jackson, J.B.C.; et al. Trophic downgrading of planet earth. Science 2011, 333, 301–306. [Google Scholar] [CrossRef] [PubMed] [Green Version]
  4. Ford, A.T.; Goheen, J.R.; Otieno, T.O.; Bidner, L.; Isbell, L.A.; Palmer, T.M.; Ward, D.; Woodroffe, R.; Pringle, R.M. Large carnivores make savanna tree communities less thorny. Science 2014, 346, 346–349. [Google Scholar] [CrossRef] [PubMed]
  5. Owen-Smith, N.; Roux, E.L.; Macandza, V. Are relatively rare antelope narrowly selective feeders? A sable antelope and zebra comparison. J. Zool. 2013, 291, 163–170. [Google Scholar] [CrossRef]
  6. Riginos, C. Climate and the landscape of fear in an African savanna. J. Anim. Ecol. 2015, 84, 124–133. [Google Scholar] [CrossRef] [PubMed]
  7. Thouless, C.R. Long distance movements of elephants in northern Kenya. Afr. J. Ecol. 1995, 33, 321–334. [Google Scholar] [CrossRef]
  8. Loreau, M.; Naeem, S.; Inchausti, P.; Bengtsson, J.; Grime, J.P.; Hector, A.; Hooper, D.U.; Huston, M.A.; Raffaelli, D.; Schmid, B.; et al. Biodiversity and ecosystem functioning: Current knowledge and future challenges. Science 2001, 294, 804–808. [Google Scholar] [CrossRef] [Green Version]
  9. Mittelbach, G.G.; Schemske, D.W.; Cornell, H.V.; Allen, A.P.; Brown, J.M.; Bush, M.B.; Harrison, S.P.; Hurlbert, A.H.; Knowlton, N.; Lessios, H.A.; et al. Evolution and the latitudinal diversity gradient: Speciation, extinction and biogeography. Ecol. Lett. 2007, 10, 315–331. [Google Scholar] [CrossRef]
  10. Thompson, J.N. Evolutionary ecology and the conservation of biodiversity. Trends Ecol. Evol. 1996, 11, 300–303. [Google Scholar] [CrossRef]
  11. Wootton, J.T. Effects of disturbance on species diversity: A multitrophic perspective. Am. Nat. 1998, 152, 803–825. [Google Scholar] [CrossRef] [PubMed]
  12. Zhang, J.; Qian, H.; Girardello, M.; Pellissier, V.; Nielsen, S.E.; Svenning, J.-C. Trophic interactions among vertebrate guilds and plants shape global patterns in species diversity. Proc. R. Soc. B 2018, 285, 20180949. [Google Scholar] [CrossRef] [PubMed] [Green Version]
  13. Cromsigt, J.P.G.M.; Prins, H.H.T.; Olff, H. Habitat heterogeneity as a driver of ungulate diversity and distribution patterns: Interaction of body mass and digestive strategy. Divers. Distrib. 2009, 15, 513–522. [Google Scholar] [CrossRef] [Green Version]
  14. Jetz, W.; Kreft, H.; Ceballos, G.; Mutke, J. Global associations between terrestrial producer and vertebrate consumer diversity. Proc. R. Soc. B 2009, 276, 269–278. [Google Scholar] [CrossRef] [PubMed] [Green Version]
  15. Kartzinel, T.R.; Chen, P.A.; Coverdale, T.C.; Erickson, D.L.; Kress, W.J.; Kuzmina, M.L.; Rubenstein, D.I.; Wang, W.; Pringle, R.M. DNA metabarcoding illuminates dietary niche partitioning by African large herbivores. Proc. Nat. Acad. Sci. USA 2015, 112, 8019–8024. [Google Scholar] [CrossRef] [Green Version]
  16. Haddad, N.M.; Crutsinger, G.M.; Gross, K.; Haarstad, J.; Knops, J.M.H.; Tilman, D. Plant species loss decreases arthropod diversity and shifts trophic structure. Ecol. Lett. 2009, 12, 1029–1039. [Google Scholar] [CrossRef]
  17. Hutchinson, G.E. Homage to Santa Rosalia or why are there so many kinds of animals? Am. Nat. 1959, 93, 145–159. [Google Scholar] [CrossRef] [Green Version]
  18. Srivastava, D.; Lawton, J. Why more productive sites have more species: An experimental test of theory using tree-hold communities. Am. Nat. 1998, 152, 510–529. [Google Scholar] [CrossRef]
  19. Kartzinel, T.R.; Pringle, R.M. Multiple dimensions of dietary diversity in large mammalian herbivores. J. Anim. Ecol. 2020, 89, 1482–1496. [Google Scholar] [CrossRef]
  20. Swenson, N.G.; Stegen, J.C.; Davies, S.J.; Erickson, D.L.; Forero-Montaña, J.; Hurlbert, A.H.; Kress, W.J.; Thompson, J.; Uriarte, M.; Wright, S.J.; et al. Temporal turnover in the composition of tropical tree communities: Functional determinism and phylogenetic stochasticity. Ecology 2012, 93, 490–499. [Google Scholar] [CrossRef]
  21. Cavender-Bares, J.; Kozak, K.H.; Fine, P.V.; Kembel, S.W. The merging of community ecology and phylogenetic biology. Ecology Lett. 2009, 12, 693–715. [Google Scholar] [CrossRef] [PubMed]
  22. Mutuku, P.M.; Kenfack, D. Effect of local topographic heterogeneity on tree species assembly in an Acacia-dominated African savanna. J. Trop. Ecol. 2019, 35, 46–56. [Google Scholar] [CrossRef]
  23. Gill, B.A.; Musili, P.M.; Kurukura, S.; Hassan, A.A.; Goheen, J.R.; Kress, W.J.; Kuzmina, M.; Pringle, R.M.; Kartzinel, T.R. Plant DNA-barcode library and community phylogeny for a semi-arid East African savanna. Mol. Ecol. Resour. 2019, 19, 838–846. [Google Scholar] [CrossRef] [PubMed]
  24. Lepore, M.; Arellano, G.; Condit, R.; Detto, M.; Harms, K.; Lao, S.; Russo, S.; Zuleta, D. fgeo.analyze: Analyze ForestGEO Data, R Package Version 1.1.14. 2020. Available online: https://CRAN.R-project.org/package=fgeo.analyze (accessed on 12 December 2021).
  25. R Core Team. A Language and Environment for Statistical Computing; R Foundation for Statistical Computing: Vienna, Austria, 2021. [Google Scholar]
  26. Hopcraft, J.G.C.; Anderson, T.M.; Pérez-Vila, S.; Mayeba, E.; Olff, H. Body size and the division of niche space: Food and predation differentially shape the distribution of Serengeti grazers. J. Anim. Ecol. 2012, 81, 201–213. [Google Scholar] [CrossRef] [PubMed] [Green Version]
  27. Metcalfe, P.; Beven, K.; Freer, J. Dynamic TOPMODEL: A new implementation in R and its sensitivity to time and space steps. Environ. Model. Softw. 2015, 72, 155–172. [Google Scholar] [CrossRef] [Green Version]
  28. Kress, W.J.; Erickson, D.L.; Swenson, N.G.; Thompson, J.; Uriarte, M.; Zimmerman, J.K. Advances in the use of DNA barcodes to build a community phylogeny for tropical trees in a Puerto Rican forest dynamics plot. PLoS ONE 2010, 5, e15409. [Google Scholar] [CrossRef] [Green Version]
  29. Bolger, D.T.; Morrison, T.A.; Vance, B.; Lee, D.; Farid, H. Development and application of a computer-assisted system for photographic mark-recapture analysis. Methods Ecol. Evolut. 2012, 3, 813–822. [Google Scholar] [CrossRef]
  30. Palmer, M.S.; Swanson, A.; Kosmala, M.; Arnold, T.; Packer, C. Evaluating relative abundance indices for terrestrial herbivores from large-scale camera trap surveys. Afr. J. Ecol. 2018, 56, 791–803. [Google Scholar] [CrossRef] [Green Version]
  31. Kembel, S.W.; Cowan, P.D.; Helmus, M.R.; Cornwell, W.K.; Morlon, H.; Ackerly, D.D.; Blomberg, S.P.; Webb, C.O. Picante: R tools for integrating phylogenies and ecology. Bioinformatics 2010, 26, 1463–1464. [Google Scholar] [CrossRef] [Green Version]
  32. Mazel, F.; Davies, T.J.; Gallien, L.; Renaud, J.; Groussin, M.; Münkemüller, T.; Thuiller, W. Influence of tree shape and evolutionary time-scale on phylogenetic diversity metrics. Ecography 2016, 39, 913–920. [Google Scholar] [CrossRef] [Green Version]
  33. Webb, C.O.; Ackerly, D.D.; McPeek, M.A.; Donoghue, M.J. Phylogenies and community ecology. Annu. Rev. Ecol. Syst. 2002, 31, 475–505. [Google Scholar] [CrossRef] [Green Version]
  34. Ives, A.R.; Helmus, M.R. Phylogenetic metrics of community similarity. Am. Nat. 2010, 176, E128–E142. [Google Scholar] [CrossRef] [PubMed] [Green Version]
  35. Riginos, C.; Grace, J.B. Savanna tree density, herbivores, and the herbaceous community: Bottom-up vs. top-down effects. Ecology 2008, 89, 2228–2238. [Google Scholar] [CrossRef] [PubMed] [Green Version]
  36. Kimuyu, D.M.; Kenfack, D.; Musili, P.M.; Ang’ila, R.O. Fine-scale habitat heterogeneity influences browsing damage by elephant and giraffe. Biotropica 2021, 53, 86–96. [Google Scholar] [CrossRef]
  37. Colwell, R.K.; Chao, A.; Gotelli, N.J.; Lin, S.-Y.; Mao, C.X.; Chazdon, R.L.; Longino, J.T. Models and estimators linking individual-based and sample-based rarefaction, extrapolation and comparison of assemblages. J. Plant Ecol. 2012, 5, 3–21. [Google Scholar] [CrossRef] [Green Version]
  38. Oksanen, J.; Blanchet, F.G.; Friendly, M.; Kindt, R.; Legendre, P.; McGlinn, D.; Minchin, P.R.; O’Hara, R.B.; Simpson, G.L.; Solymos, P.; et al. Vegan: Community Ecology Package; R Package Version 2.5-7:2020; R Core Team: Vienna, Austria, 2020. [Google Scholar]
  39. De Caceres, M.; Legendre, P. Associations between species and groups of sites: Indices and statistical inference. Ecology 2009, 90, 3566–3574. [Google Scholar] [CrossRef]
  40. Pellissier, L.; Ndiribe, C.; Dubuis, A.; Pradervand, J.-N.; Salamin, N.; Guisan, A.; Rasmann, S. Turnover of plant lineages shapes herbivore phylogenetic beta diversity along ecological gradients. Ecol. Lett. 2013, 16, 600–608. [Google Scholar] [CrossRef]
  41. Kemp, J.E.; Linder, H.P.; Ellis, A.G. Beta diversity of herbivorous insects is coupled to high species and phylogenetic turnover of plant communities across short spatial scales in the Cape Floristic Region. J. Biogeogr. 2017, 44, 1813–1823. [Google Scholar] [CrossRef]
  42. Dinnage, R.; Cadotte, M.W.; Haddad, N.M.; Crutsinger, G.M.; Tilman, D. Diversity of plant evolutionary lineages promotes arthropod diversity. Ecol. Lett. 2012, 15, 1308–1317. [Google Scholar] [CrossRef]
  43. Schuldt, A.; Ebeling, A.; Kunz, M.; Staab, M.; Guimarães-Steinicke, C.; Bachmann, D.; Buchmann, N.; Durka, W.; Fichtner, A.; Fornoff, F.; et al. Multiple plant diversity components drive consumer communities across ecosystems. Nat. Commun. 2019, 10, 1460. [Google Scholar] [CrossRef] [Green Version]
  44. Wells, H.B.M.; Crego, R.D.; Odepal, Ø.H.; Khasoha, L.M.; Alston, J.M.; Reed, C.G.; Weiner, S.; Kurukura, S.; Hassan, A.A.; Namoni, M.; et al. Experimental evidence that effects of megaherbivores on mesoherbivore space use are influenced by species’ traits. J. Anim. Ecol. 2021, 90, 2510–2522. [Google Scholar] [CrossRef] [PubMed]
  45. Hairston, N.G.; Smith, F.E.; Slobodkin, L. Community structure, population control, and competition. Am. Nat. 1960, 879, 421–425. [Google Scholar] [CrossRef]
  46. Polis, G.A. Why are parts of the world green? Multiple factors control productivity and the distribution of biomes. Oikos 1999, 86, 3–15. [Google Scholar] [CrossRef]
  47. Beschta, R.L.; Ripple, W.J. Large predators and trophic cascades in ecosystems of the western United States. Biol. Conserv. 2009, 142, 2401–2414. [Google Scholar] [CrossRef]
  48. Coverdale, T.C.; Kartzinel, T.R.; Grabowski, K.L.; Shriver, R.K.; Hassan, A.A.; Goheen, J.R.; Palmer, T.M.; Pringle, R.M. Elephants in the understory: Opposing direct and indirect effects of consumption and ecosystem engineering by megaherbivores. Ecology 2016, 97, 3219–3230. [Google Scholar] [CrossRef] [PubMed]
  49. Coverdale, T.C.; O’Connell, R.D.; Hutchinson, M.C.; Savagian, A.; Kartzinel, T.R.; Palmer, T.M.; Goheen, J.R.; Augustine, D.J.; Sankaran, M.; Tarnita, C.E.; et al. Large herbivores suppress liana infestation in an African savanna. Proc. Nat. Acad. Sci. USA 2021, 118, e2101676118. [Google Scholar] [CrossRef]
  50. Goheen, J.R.; Augustine, D.J.; Veblen, K.E.; Kimuyu, D.M.; Palmer, T.M.; Porensky, L.M.; Pringle, R.M.; Ratnam, J.; Riginos, C.; Sankaran, M.; et al. Conservation lessons from large-mammal manipulations in East African savannas: The KLEE, UHURU, and GLADE experiments. Ann. N. Y. Acad. Sci. 2018, 1429, 31–49. [Google Scholar] [CrossRef]
  51. Hattas, D.; Hjältén, J.; Julkunen-Tiitto, R.; Scogings, P.F.; Rooke, T. Differential phenolic profiles in six African savanna woody species in relation to antiherbivore defense. Phytochemistry 2011, 72, 1796–1803. [Google Scholar] [CrossRef]
  52. Kartzinel, T.R.; Hsing, J.C.; Musili, P.M.; Brown, B.R.P.; Pringle, R.M. Covariation of diet and gut microbiome in African megafauna. Proc. Nat. Acad. Sci. USA 2019, 116, 23588–23593. [Google Scholar] [CrossRef] [Green Version]
  53. Kimuyu, D.M.; Veblen, K.E.; Riginos, C.; Chira, R.M.; Githaiga, J.M.; Young, T.P. Influence of cattle on browsing and grazing wildlife varies with rainfall and presence of megaherbivores. Ecol. Appl. 2017, 27, 786–798. [Google Scholar] [CrossRef]
  54. MacKenzie, D.I.; Nichols, J.D.; Hines, J.E.; Knutson, M.G.; Franklin, A.B. Estimating site occupancy, colonization, and local extinction when a species is detected imperfectly. Ecology 2003, 84, 2200–2207. [Google Scholar] [CrossRef] [Green Version]
  55. Becker, J.A.; Hutchinson, M.C.; Potter, A.B.; Park, S.; Guyton, J.A.; Abernathy, K.; Americo, V.F.; da Conceiçāo, A.; Kartzinel, T.R.; Kuziel, L.; et al. Ecological and behavioral mechanisms of density-dependent habitat expansion in a recovering African ungulate population. Ecol. Monogr. 2021, 91, e01476. [Google Scholar] [CrossRef]
  56. Milchunas, D.G.; Lauenroth, W.K. Quantitative effects of grazing on vegetation and soils over a global range of environments. Ecol. Monogr. 1993, 63, 327–366. [Google Scholar] [CrossRef]
  57. Wood, K.A.; O’Hare, M.T.; McDonald, C.; Searle, K.R.; Daunt, F.; Stillman, R.A. Herbivore regulation of plant abundance in aquatic ecosystems. Biol. Rev. 2017, 92, 1128–1141. [Google Scholar] [CrossRef] [PubMed] [Green Version]
  58. Brooks, A.W.; Kohl, K.D.; Brucker, R.M.; van Opstal, E.J.; Bordenstein, S.R. Phylosymbiosis: Relationships and functional effects of microbial communities across host evolutionary history. PLoS Biol. 2017, 15, e1002587. [Google Scholar] [CrossRef] [Green Version]
  59. Park, A.W.; Farrell, M.J.; Schmidt, J.P.; Huang, S.; Dallas, T.A.; Pappalardo, P.; Drake, J.M.; Stephens, P.R.; Poulin, R.; Nunn, C.L.; et al. Characterizing the phylogenetic specialism–generalism spectrum of mammal parasites. Proc. R. Soc. B 2018, 285, 20172613. [Google Scholar] [CrossRef] [Green Version]
  60. Shefferson, R.P.; Bunch, W.; Cowden, C.C.; Lee, Y.I.; Kartzinel, T.R.; Yukawa, T.; Downing, J.; Jiang, H. Does evolutionary history determine specificity in broad ecological interactions? J. Ecol. 2019, 107, 1582–1593. [Google Scholar] [CrossRef]
  61. Corro, E.J.; Villalobos, F.; Lira-Noriega, A.; Guevara, R.; Guimarães, P.R.; Dáttilo, W. Annual precipitation predicts the phylogenetic signal in bat-fruit interaction networks across the Neotropics. Biol. Lett. 2021, 17, 20210478. [Google Scholar] [CrossRef]
  62. Staab, M.; Liu, X.; Assmann, T.; Bruelheide, H.; Buscot, F.; Durka, W.; Erfmeier, A.; Klein, A.-M.; Ma, K.; Michalski, S.; et al. Tree phylogenetic diversity structures multitrophic communities. Funct. Ecol. 2020, 35, 521–534. [Google Scholar] [CrossRef]
  63. Simth, G.F.; Figueiredo, E. Conserving Acacia Mill. with a conserved type: What happenedin Melbourne? Taxonomy 2018, 60, 1504–1506. [Google Scholar] [CrossRef] [Green Version]
  64. Antonellia, A.; Nylanderb, J.A.A.; Perssona, C.; Sanmartin, I. Tracing the impact of the Andean uplift on Neotropical plant evolution. Proc. Nat. Acad. Sci. USA 2009, 106, 9749–9754. [Google Scholar] [CrossRef] [PubMed] [Green Version]
  65. Janssens, S.; Couvreur, T.L.; Mertens, A.; Dauby, G.; Dagallier, L.-P.; Abeele, S.V.; Vandelook, F.; Mascarello, M.; Beeckman, H.; Sosef, M.; et al. A large-scale species level dated angiosperm phylogeny for evolutionary and ecological analyses. Biodivers. Data J. 2020, 8, e39677. [Google Scholar] [CrossRef] [PubMed] [Green Version]
Figure 1. The Mpala ForestGEO ecosystem. (a) The map shows the extent of the study plot, with white circles representing 33 sampling sites. The three habitats are distinguished by color (purple = “plateau”, teal = “slope”, yellow = “low plain”). (b) The locations of six woody plant species comprising 80% of stems in the plot are shown with different color points. Phylogenies show relationships between (c) woody plants and (d) large mammalian herbivores; scale bars represent 1 MY. Note Hibiscus aponeurus in the phylogeny represents Hibiscus spp. in the ForestGEO data; see Table S1 in Supplementary Materials for description of grafted or substituted taxa.
Diversity 14 00219 g001
Figure 2. Abundance and diversity of (ad) woody plants and (eh) large herbivores across habitats (mean ± s.e.). Letters above each bar indicate significant differences based on Tukey’s HSD following ANOVAs. Abundance is the (a) total plant stems/site and (e) total herbivore RIA/site. Richness is the mean count of (b) woody plant and (f) large herbivore species. Phylogenetic diversity was measured as (c,g) sesMPD and (d,h) sesMNTD, with positive values indicating overdispersion and negative values clustering.
Diversity 14 00219 g002
Figure 3. Relationships between herbivore (a) abundance, (b) taxonomic richness, (c) sesMPD, and (d) sesMNTD with corresponding measures for woody plants. For each pair of metrics, we constructed initial linear models with predictors including the woody-plant variable, habitat, and the plant variable × habitat interaction. We simplified models based on the subset of statistically significant variables. We report adjusted R2 for the model that included a significant correlation (b). Horizontal lines show significant differences between habitats (a,c,d). Colors show habitat types.
Diversity 14 00219 g003
Figure 4. Taxonomic and phylogenetic differentiation in woody-plant and large-herbivore communities. Nonmetric multidimensional scaling (NMDS) revealed significant compositional dissimilarity in (a) tree PCD, (b) tree PDCc, (c) large-herbivore PCD, and (d) large-herbivore PCDc between habitats. Colors in (ad) indicate habitat at each grid site. Results of perMANOVAs and stress values for corresponding NMDS plots are shown on each panel. We grouped the three slope sites with low plain sites for calculating perMANOVAs and 95% confidence ellipses. The (e) PCD and (f) PCDc of plant and animal communities were positively correlated based on Mantel and (p)artial Mantel tests; green trendlines were fit using generalized linear models.
Diversity 14 00219 g004
Table 1. Summary of ecological characteristics at 33 grid sites across three habitats.
VariableMeasurePlateauSlopeLow Plain
Abiotic characteristicsNumber of sites14316
Mean elevation (m)178717541692
Mean convexity0.0190.556−0.022
Mean slope (rad)1.0412.304.10
Mean topographic water index (TWI)10.67.99.0
Woody plantsMean total stems2381602855
Mean richness5.425.015.4
Mean sesMPD−1.70.9−0.6
Mean sesMNTD−1.31.80.3
Large herbivoresMean cumulative RAI60.449.0127.0
Mean richness11.46.39.8
Mean sesMPD1.10.2−0.1
Mean sesMPD−0.6−0.30.0
Publisher’s Note: MDPI stays neutral with regard to jurisdictional claims in published maps and institutional affiliations.

