Article

How the Strength of Monsoon Winds Shape Forest Dynamics

1
Ph.D. Program of Agriculture Science, National Chiayi University, Chiayi 600, Taiwan
2
International Master Program of Agriculture, National Chung Hsing University, Taichung 402, Taiwan
3
Department of Soil and Water Conservation, National Chung Hsing University, Taichung 402, Taiwan
4
Botanical Garden Division, Taiwan Forestry Research Institute, Taipei 100, Taiwan
5
Department of Forestry and Natural Resources, National Chiayi University, Chiayi 600, Taiwan
*
Author to whom correspondence should be addressed.
Diversity 2022, 14(3), 169; https://doi.org/10.3390/d14030169
Submission received: 7 January 2022 / Revised: 23 February 2022 / Accepted: 24 February 2022 / Published: 26 February 2022

Abstract

:
Monitoring long-term forest dynamics can improve our understanding of how tree species change under varying environmental conditions over time. The Nanjenshan Nature Reserve, located in the southernmost part of Taiwan, is covered by natural tropical forest and affected by the northeast monsoon wind in the winter. To explore how monsoon wind shapes the structure of vegetation, we used the long-term data of the Lanjenchi plot (high wind exposure forest) and Nanjenshan plot I (low wind exposure forest) located in the Nanjenshan Nature Reserve. In these two plots, all free-standing trees with diameter at breast height (DBH) ≥ 1 cm were identified, measured, and mapped five times in thirty years (1989–2019). Temporal changes of tree abundance, dominance, recruitment, and mortality were calculated for all species. We recorded 9694 ± 3924 individual ha−1 belonging to 126 species in the high wind exposure forest and 4019 ± 1791 individual ha−1 belonging to 105 species in the low wind exposure forest in the latest census (census 5). From 1989 to 2019, stem density in the high wind exposure forests decreased (from 12,179 ± 6689 to 9694 ± 3924 individual ha−1), while stem density in the low wind exposure forests increased (from 3253 ± 1208 to 4019 ± 1791 individual ha−1). The stem density of the rare species, which survived only in the high wind exposure forest, decreased over time. However, the basal areas of these two forests barely changed during the study periods. Due to environmental conditions, the two forests have developed different forest structures in spaces and time. Species stem density in the high wind exposure forest and diversity could continually decrease and affect the maintenance of species diversity in the monsoon wind-shaped forest.

1. Introduction

Species are the basic units of a community that occurs together in space and time [1]. A species may change its relative abundance, immigrate, or go extinct locally [2,3,4,5]. Species community dynamics may be influenced by both exogenous forces such as climate and endogenous ecological forces [2,5]. How multiple species have survived under different environments through time can provide information about their potential for facing various environmental conditions in the future [5,6].
Long-term inventory data help to better understand forest structure dynamics and ecological processes [3]. Condit et al. [7] analyzed the long-term dynamic data from Pasoh and Barro Colorado Island (BCI) forest dynamic plots and found that the different environmental conditions and climate events cause BCI to have a higher mortality and recruitment rate than the Pasoh plot. Shen et al. [8] found that intraspecific competitive exclusion and density dependence caused the high mortality of species in the Dinghushan forest dynamic plot. In addition to the relationships among species, environmental conditions may alter dynamic patterns over time. Vincent et al. [9] showed that the frequency of natural disturbance might cause higher mortality in New Guinea’s forests than in other tropical forests. Condit et al. [3] showed that drought resulting from El Niño, caused a higher mortality rate for the species originally associated with relatively moist soils than for other species. Overall, long-term species survival is closely related to the environment [6,10,11].
The Lanjenchi plot and Nanjenshan plot I are located within the Nanjenshan Nature Reserve, which is part of the Kenting National Park and located on the east side of the mountain range near the coast of the Pacific Ocean [12]. In winter, the northeast monsoon wind is strong. It causes differing tree morphology (e.g., leaf thickness [13], leaf area [13]) and tree physiology (e.g., evapotranspiration rate [14]) between the trees in the high wind exposure and low wind exposure plots. Moreover, the species have different habitat associations, resulting in different vegetation compositions and structures under different wind exposure levels [15,16,17]. The Lanjenchi plot is a high wind exposed plot that was dominated by Illicium arborescens and composed of two Taiwanese vegetation associations, including Lithocarpus amygdalifoliusIllicium arborescens and Helicia formosanaSchefflera octophylla types [16]. The Nanjenshan plot I is a low wind-exposed plot composed by Dendrocnide meyenianaFicus benjamina forest dominated by Ficus benjamina [16]. These two plots represent the heterogeneity of environmental conditions under the northeast monsoon wind stress [15,16]. However, the patterns in which the species change through time are not well studied.
This study aims to understand how the woody vegetation composition differs in the plots having high wind exposure (Lanjenchi plot) versus low wind exposure (Nanjenshan plot I). We utilized the tree survey data from Lanjenchi plot and Nanjenshan plot I, which have been surveyed five times. The questions we addressed were as follows: (1) Do trees have different change in stem densities and basal areas between the Lanjenchi plot and Nanjenshan plot I? (2) How does species composition change over time between these two plots?

2. Materials and Methods
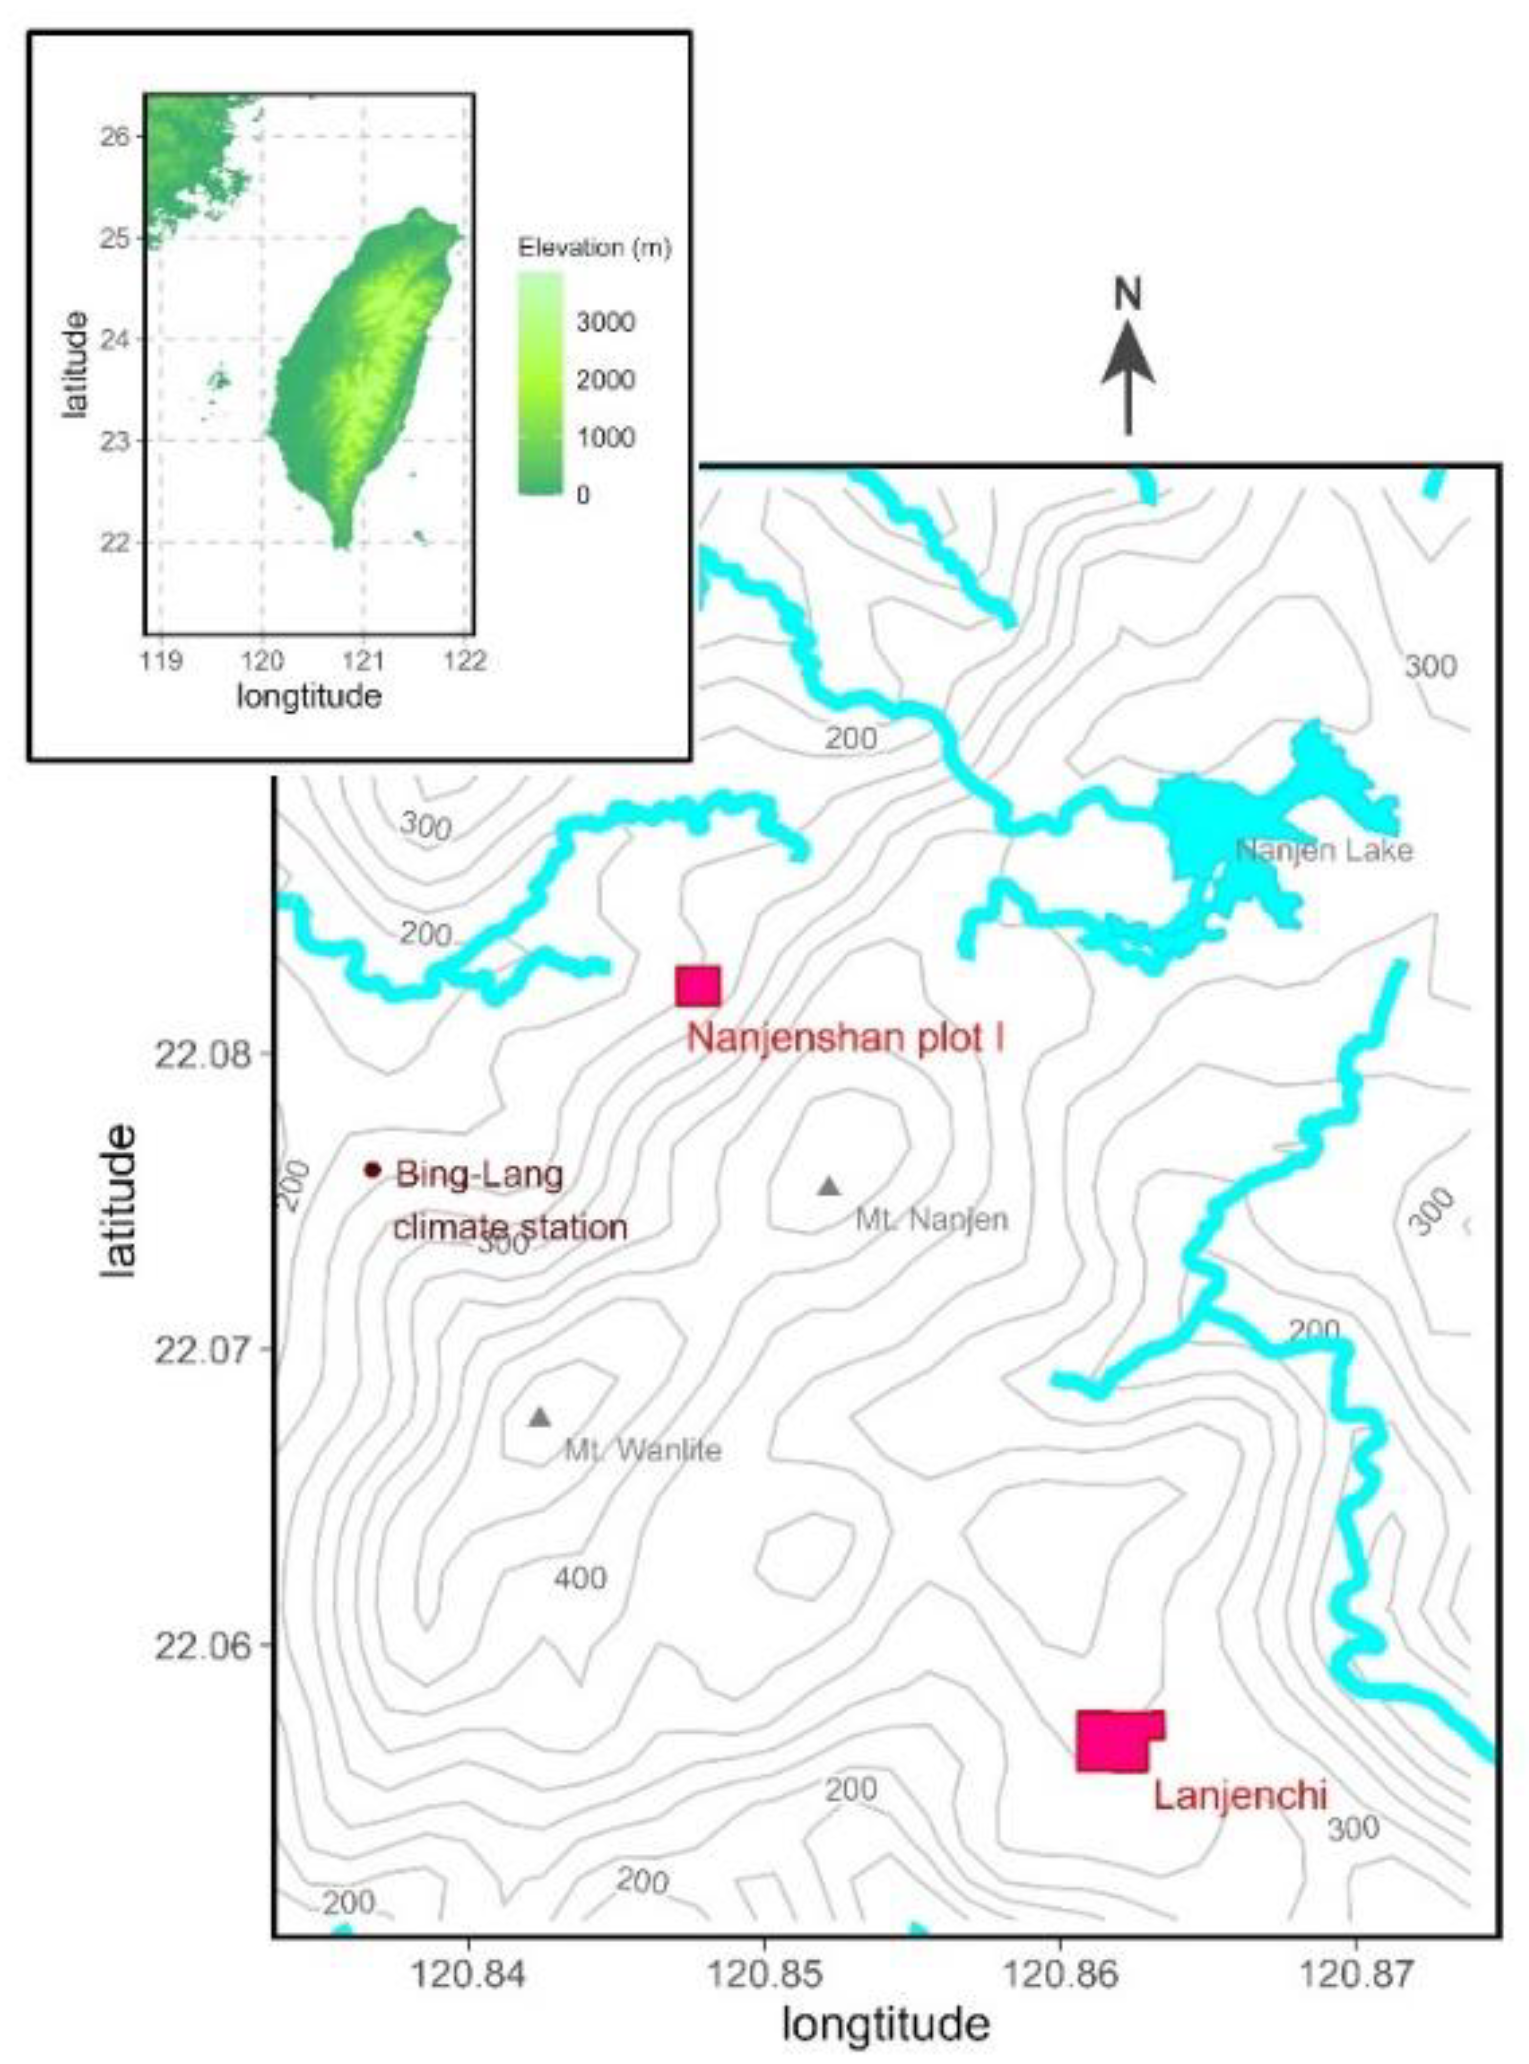
2.1. Study Site

The study site of this research is located at the Nanjenshan Nature Reserve, situated at the southernmost part of Taiwan (Figure 1). It is a lowland tropical primary forest, without significant human activities. Based on the nearest automatic weather station (Bing-Lang station, elevation: 250 m; 120°50′12″ E, 22°04′34″ N) (1.4 km from Nanjenshan plot I, and 3.4 km from Lanjenchi plot) the mean annual precipitation is 3793 mm and mean annual temperature is 22.3 °C in the study region [18]. Inside the Nanjenshan Nature Reserve, are five forest dynamics plots, including the Lanjenchi (5.88-ha), Nanjenshan plot I (2.1-ha), Nanjenshan plot II (0.64-ha), Transect (0.76-ha), and Nanjen Lake (1.86-ha) [16]. We selected the two largest plots with the same number of survey intervals to represent plots affected by monsoon wind in a high wind exposure forest (Lanjenchi plot) and low wind exposure forest (Nanjenshan plot I) [9] (Figure 1). The average wind gust speed is significantly higher in the Lanjenchi plot than in Nanjenshan plot I [19]. The maximum wind velocity could be up to 20 m s−1 during the northeast monsoon wind season in the Lanjenchi plot [19,20]. The location and topographical environment of these two plots are likely to be the main cause of the different winter wind speed patterns [21]. The Lanjenchi plot (220 m by 240 to 300 m; 120°51′38″ E, 22°03′23″ N) is located on the coastal eastern upper slope of Mt. Wanlite. Elevation ranges from 280 to 340 m [16,18] and the slope is 17°–27° [16,18]. Its vegetation is classified as an Illicium-Cyclobalanopsis tropical winter monsoon forest [17]. The Nanjenshan plot I (150 m by 140 m; 120°50′51″ E, 22°04′54″ N) is located in the valley at the northwest foot of Mt. Nanjen. Its elevation ranges from 224 to 275 m [16,22] and its slope is 15°–24° [16,22]. The vegetation type is classified as a Dysoxylum-Machilus tropical mountain zonal foothill evergreen broad-leaved forest [17].

2.2. Data from the Study Site

This study used the long-term survey data of woody species from the Lanjenchi plot and Nanjenshan plot I. The Lanjenchi plot was originally a 3-ha rectangular plot established in 1989 (the first survey was finished in 1991), but in 1997 was extended to a 5.88-ha, nearly rectangular plot. The plot was represented by surveying 588 10 by 10-m quadrats, and five surveys were completed in 1991 (census 1, only 3-ha), 1997 (census 2), 2005 (census 3), 2013 (census 4), and 2019 (census 5). The Nanjenshan plot I was a 2.1- ha rectangular plot composed of 210 10 by 10-m quadrats. The Nanjenshan plot I was established in 1993 and the five surveys were completed in 1993 (census 1), 2000 (census 2), 2008 (census 3), 2013 (census 4), and 2020 (census 5). All trees within a given quadrat having a diameter ≥ 1 cm were measured at a height of 130 cm, tagged, mapped, and identified to species level. We also investigated each 10 by 10-m quadrat’s environmental factors, including elevation, slope, convexity, aspect, and exposure value. Chao et al. [16] and Ku et al. [18] described the collecting methods of each environmental factor.

2.3. Data Analysis

2.3.1. Abundance and Dominance

Abundance (individual ha−1) was determined using the stem density of each tagged tree. Dominance (m2 ha−1) was determined using the basal area per hectare. IV (importance value, %) was calculated for relative dominance and abundance for each species in each census year, which indicated the relative importance of the species in the forest (IV (%) = (relative abundance (%) + relative dominance (%))/2).
Generalized estimating equations were used to test the significance between five census years for each species. Tuckey’HSD was use for post hoc comparisons in overall census year. Statistical analysis was performed with R statistical software R v4.0.3 (R Core Team, Vienna, Austria) [23], using the geeglm function in the geepack package [24]. Botanical nomenclature followed Flora of Taiwan, 2nd edition [25].

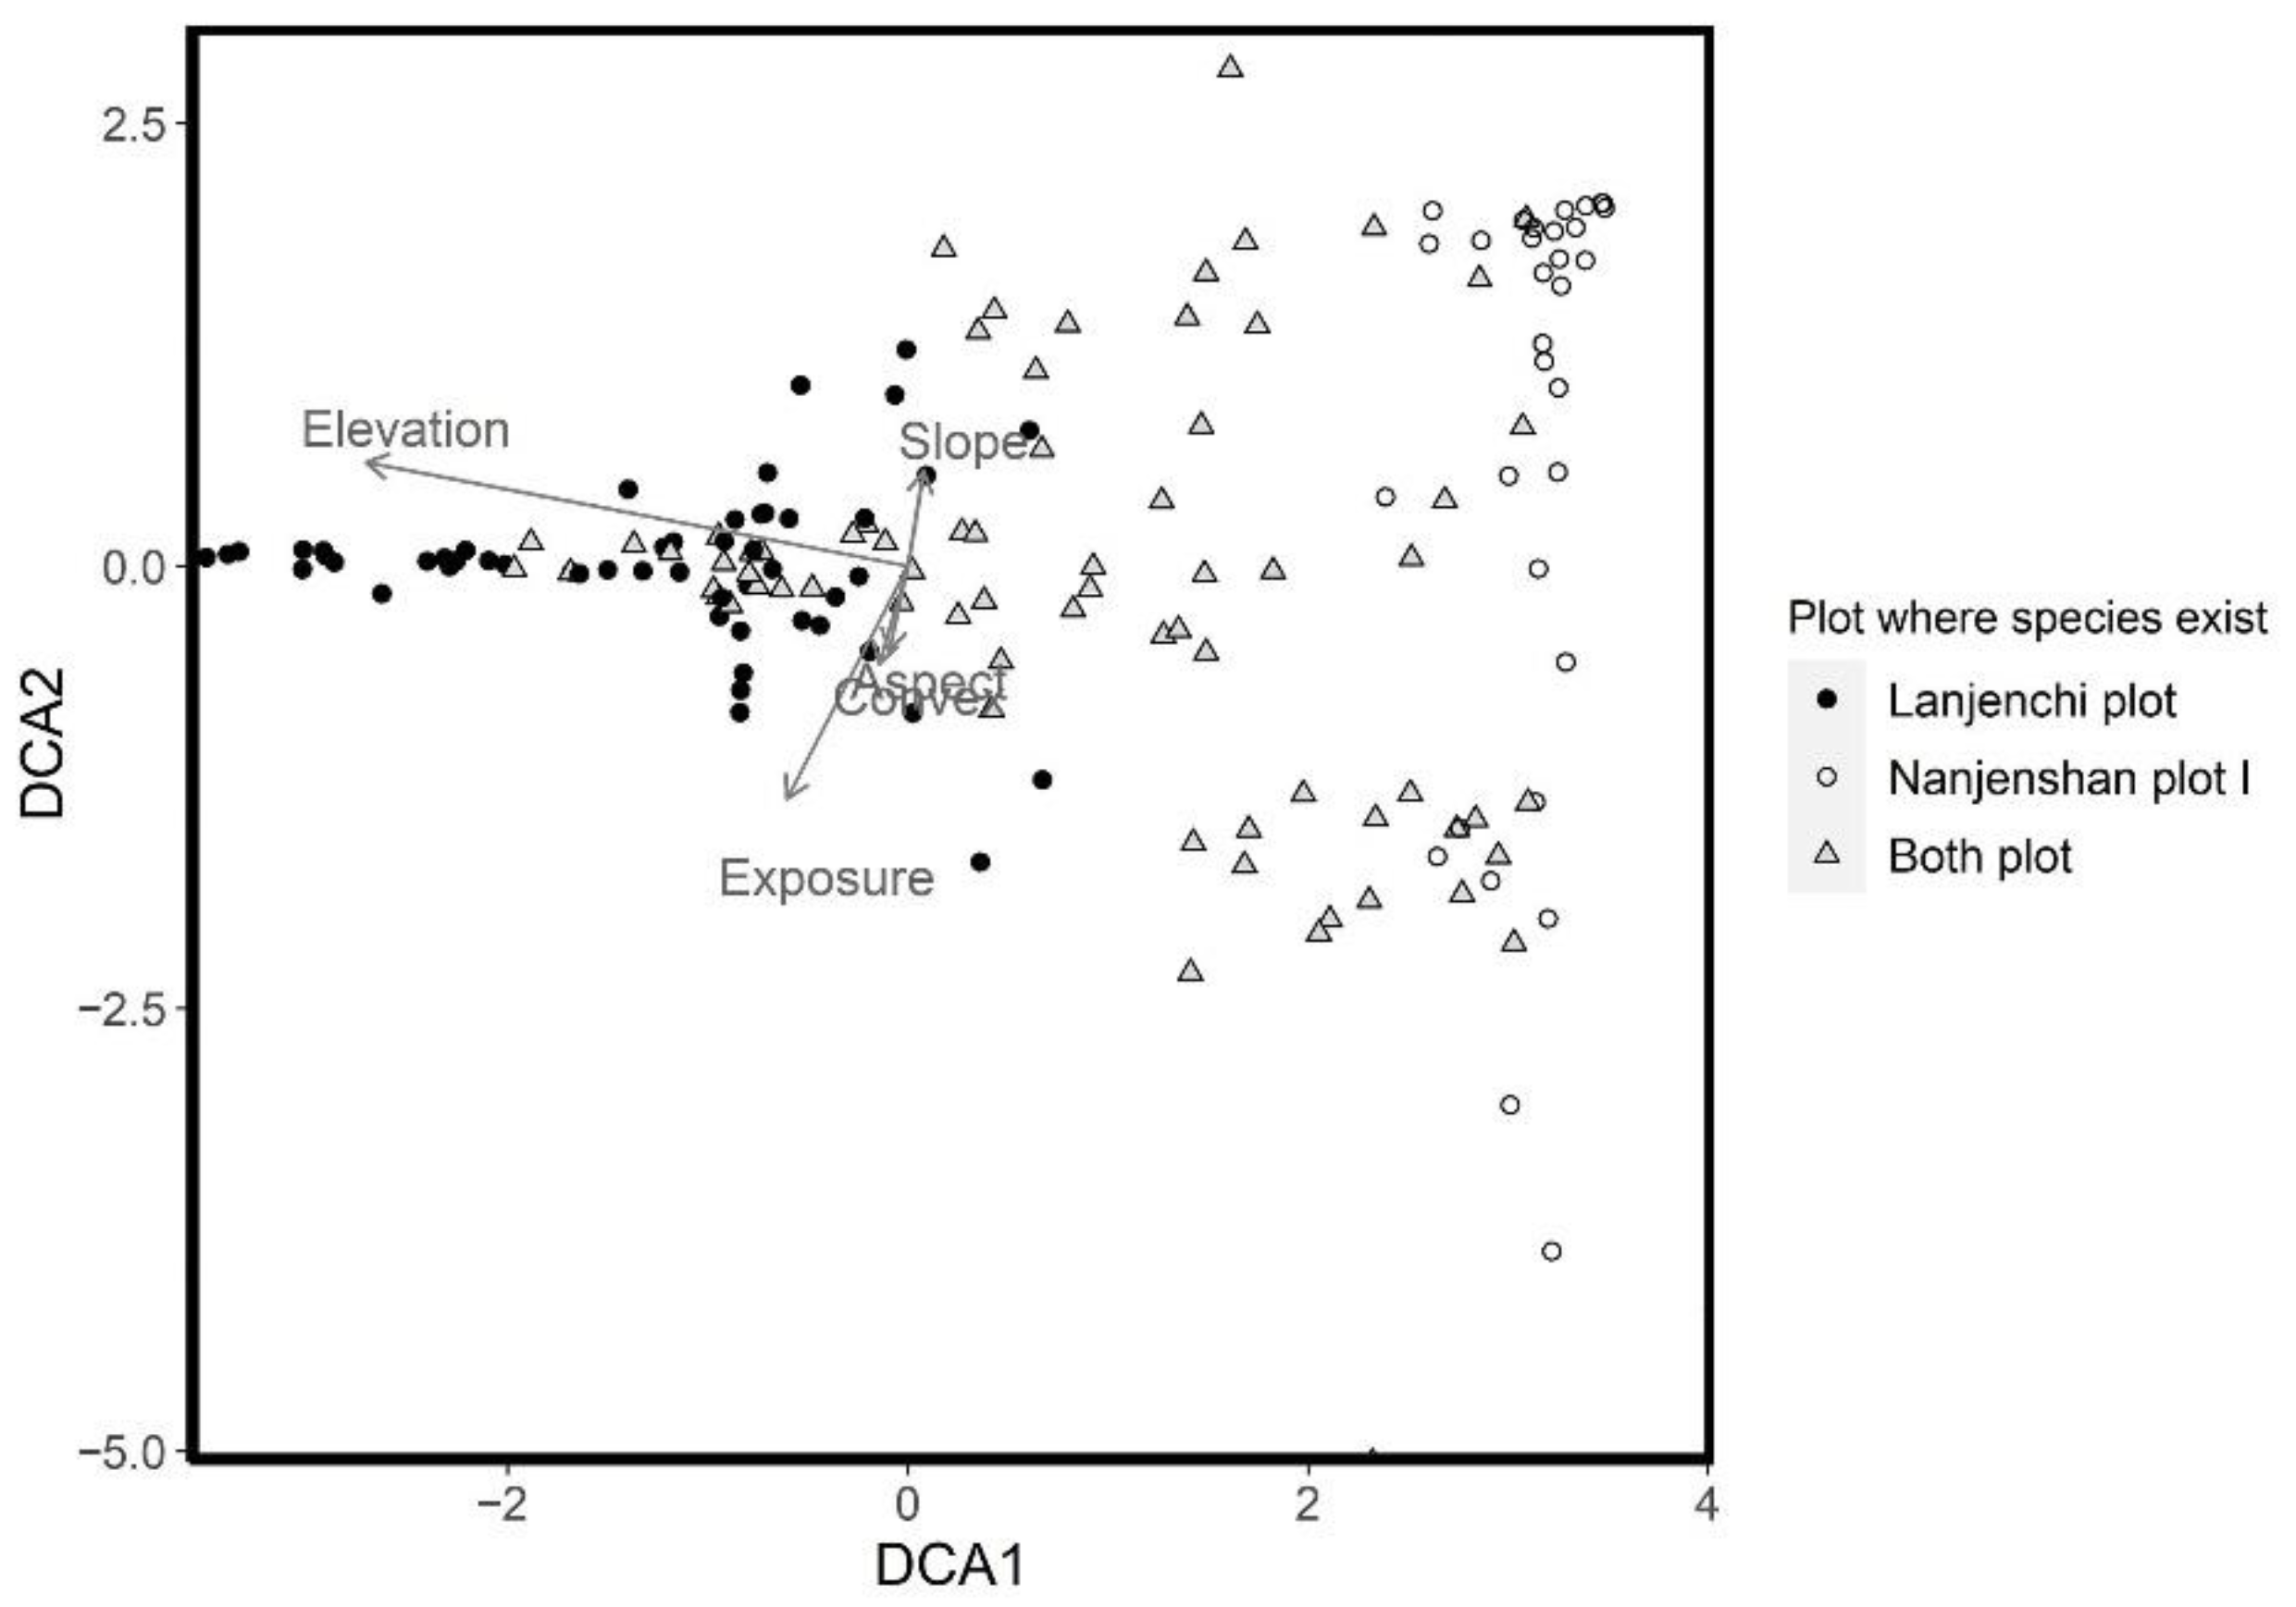
2.3.2. DCA Analysis and the Environmental Factors

We used Detrended Correspondence Analysis (DCA, Hill and Gauch [26]) to understand how species were distributed in the Lanjenchi plot and Nanjenshan plot I. Hellinger transformation was conducted on the abundance data for each species in each quadrat. To better interpret the effect of the species distribution between the two forests, each quadrat’s environmental factors were correlated with each DCA axis by using Pearson’s correlation.
The DCA analysis and the correlation with environmental factors were conducted with R statistical software R v4.0.3 [23] by using the decorana function (for DCA) and envfit function (correlated with environmental factors) in the vegan package [27].

2.3.3. Diversity Index

We calculated species richness (S), Simpson’s diversity index (D), and Shannon’s diversity index (H’) for each census year data in the Lanjenchi plot and Nanjenshan plot I. Species richness is simply the number of species in both plots. The Simpson’s diversity index was calculated using the following equation:
D = 1 i = 1 S P i 2
where S is the species richness, Si the ith species, and Pi the proportion of the ith species in each community. Shannon’s diversity index was calculated as the same parameter but with a different formula and weighting the abundance of rare species by natural logarithm:
H = i = 1 S P i ln P i  
All diversity indexes were conducted with R statistical software R v4.0.3 [23] using the diversity function in the vegan package [27].

2.3.4. Dynamic Index

Demographic rates are defined as the rate constants of population growth, calculated for mortality from annual mortality rate (m, % yr−1) [7]:
m = ln ( N 0 N st ) t × 100 %
The recruitment rate (r, % yr−1) was calculated as [7]:
r = ln ( N t N st ) t × 100 %
Population growth (λ, % yr−1) is the difference between the r and m, the equation [7] is from:
λ = ln ( N t N 0 ) t × 100 %
N0 is the number of individuals in the previous census, Nt the total number of individuals at the latest census of measurement interval t, and Nst the number of individuals surviving from the previous census (t−1) to the latest census (t). The individuals that survived but did not meet the diameter at 1.3 m height threshold during the latest census were treated as the surviving individuals.

3. Results

3.1. Forest Structure and Forest Composition in the Lanjenchi and Nanjenshan Plots

Forest structure and species composition differed between the two plots. The record in census 5 showed a stem density of 9694 ± 3924 individual ha−1 and basal area of 46.0 ± 26.3 m2 ha−1 (average DBH of each tree is 6.91 cm) in the Lanjenchi plot and a stem density of 4019 ± 1791 individual ha−1 and basal area of 46.6 ± 43.0 m2 ha−1 (average DBH of each tree is 10.76 cm) in the Nanjenshan plot I. A total of 160 species were recorded in the two plots in the census 5. There were 126 species in the Lanjenchi plot and 105 species in the Nanjenshan plot I, of which 71 species were shared in both plots. Species diversity in the Lanjenchi plot was higher than in the Nanjenshan plot I (Table 1). The most important species (31.24%) in the Lanjenchi plot were Illicium arborescens, Castanopsis cuspidata var. carlesii, Schefflera octophylla, Ilex cochinchinensis, and Psychotria rubra. In the Nanjenshan plot I, the most important species were Psychotria rubra, Bischofia javanica, Dysoxylum hongkongense, Ficus benjamina, and Lasianthus obliquinervisare.
DCA results showed that all 160 species have markedly different distributions within the Lanjenchi plot and the Nanjenshan plot I (Figure 2). The first DCA axis explained 12.5% of the total variance in the data and the second DCA axis explained 4.87% of the variance. The left side of the first DCA axis was occupied by the species that were only distributed in the Lanjenchi plot (first DCA axis < −0.78), and the right side of the first DCA axis was occupied by species that were only found the in Nanjenshan plot I (first DCA axis > 0.925). The middle of the first DCA axis was occupied by the shared species of the Lanjenchi plot and Nanjenshan plot I. The shared species to the left side of the first DCA axis represent species having greater abundance in the Lanjenchi plot, and vice versa to the right side of the axis (Figure 2).

3.2. Overall Dynamic Changes in the Plots

The overall stem density in the Lanjenchi plot decreased significantly from 12,179 ± 6689 individual ha−1 in census 1 to 9695 ± 3924 individual ha−1 in census 5 (Table 1). In the Nanjenshan plot I, stem density increased from 3253 ± 1208 individual ha−1 in census 1 to 4019 ± 1791 individual ha−1 in census 5. The overall basal area remained relatively stable in the Lanjenchi plot and the Nanjenshan plot I through time (Table 1).
The recruitment rate was higher in the Nanjenshan plot I than in the Lanjenchi plot, except in census 5 when the recruitment rate of the Nanjenshan plot I was 2.31% yr−1, while the Lanjenchi plot was 3.14% yr−1 (Table 2).
Mortality in the Lanjenchi plot was higher than in Nanjenshan plot I, except at census 4 (Table 2), when mortality in the Nanjenshan plot I reached its highest level of 2.83% yr−1. The highest mortality rate in the Lanjenchi plot was 2.86% yr−1 in census 5, followed by census 2, and census 4 had the lowest mortality rate (Table 2).
Population growth in the two plots showed different trends (Table 2). The Lanjenchi plot showed the highest population growth in census 5 and the lowest population growth in census 3. In the Nanjenshan plot I, the highest population growth occurred in census 3 and the lowest population growth occurred in census 4.

3.3. Changes in Abundant and Dominant Species in the Lanjenchi and Nanjenshan Plots I

The species that only occurred in the Lanjenchi plot decreased the most in species composition. The importance values of Illicium arborescens, Eurya nitida var. nanjenshanensis, Ilex lonicerifolia var. matsudae, Syzygium buxifolium, and Symplocos theophrastifolia decreased the most (Figure 3). Litsea acutivena, and Elaeocarpus sylvestris increased in importance values and stem density (Figure 3).
The species that were only distributed in the Nanjenshan plot I showed a minor change in their importance values. The importance values of Aglaia elliptifolia increased, and Dendrocnide meyeniana and Dysoxylum hongkongense decreased the most (Figure 3). Few species had great change in their importance values in the Nanjenshan plot I (Table S2).
The shared species that survived in both Lanjenchi plot and Nanjenshan plot I showed more dynamics than the other two species distribution groups. Ficus benjamina, Schefflera octophylla, Turpinia ternate, and Lasianthus obliquinervis var. obliquinervis increased their importance values (Figure 3). These species are also more dominant in Nanjenshan plot I than in the Lanjenchi plot. Daphniphyllum glaucescens subsp. oldhamii, and Osmanthus marginatus had decreased importance values, these species were more abundant in the Lanjenchi plot than in the Nanjenshan plot I (Figure 3).

4. Discussion

This study evaluated forest composition dynamic under different northeast monsoon wind stress levels in two nearby forest dynamic plots in the Nanjenshan Nature Reserve. Stem density decreased significantly in the high wind exposure value forest and increased in the low wind exposure forest. The results showed a more remarkable change in species composition in the high wind exposure value forest, wherein the importance of the most dominant species declined while species ranked in the mid-dominance range increased.

4.1. Different Wind Stressing Affects Forest Composition

Prevailing wind stress may cause the trees to grow into different shapes and sizes [28] (e.g., the windswept form [29]). Wind stress coupled with other environmental conditions creates a diverse habitat for different species to survive [15,16,18,19]. In the Nanjenshan Nature Reserve, forests at higher elevations and higher exposures to northeast monsoon winds have higher stem density than forests at lower elevations with lower exposure to northeast monsoon winds [16]. From Li et al. [17], the association of Lithocarpus amygdalifoliusIllicium arborescens is the result of the monsoon wind in Taiwan at the Lanjenchi plot. Stem density in the Lanjenchi plot is 2.5 times that of Nanjenshan plot I. Long-term high stem density forest may be the strategy that multiple trees can resist strong wind stress [30]. Trees have a different trade-off between morphology and physiology to resist the prevailing wind stress; trees become increasingly spindlier in the main stem with slender branches sparsely distributed to maximize light capture [30]. Moreover, crowded forests reduce the impacts of wind on single individual more than in a non-crowded forest [31]. Reducing tree height may also resist the effect of physical damage so that the height of the trees in a high wind exposure forest may be smaller than in a low wind exposure wind forest [28]. In the Lanjenchi plot, the exposure value of the northeast monsoon wind is the determinate factor that causes species to have different associations with different habitats. For the Nanjenshan plot I, the environment is wind-shaded and more homogeneous than the Lanjenchi plot, causing their vegetation composition to be relatively similar [15,16,22]. Overall, the northeast monsoon wind and topography cause the higher stem density and smaller trees diameter in the high wind exposure forest of the Lanjenchi plot than in the low wind exposure forest of the Nanjenshan plot I. Although the total basal area in the Lanjenchi plot was higher than in the Nanjenshan plot I, it means that numerous small trees in the Lanjenchi plot had comparable biomass with fewer larger trees in Nanjenshan plot I.

4.2. From Species to Overall Change in Dynamics

Any increase in some species must be accompanied by a matching decrease in the collective numbers of all other species in the community [32]. Species composition and structure have different distribution between the high wind exposure forest and low wind exposure forest and show the different dynamics. The following will discuss species changes over time within the three major groups: species only found in the high wind exposure forest, species only found in the low wind exposure forest, and species found in both forests.
The species that were only found in the high wind exposure forest decreased their stem density, basal area, and importance values over time, but tended to survive at higher elevations and under higher exposure values. Species including Illicium arborescens, Eurya nitida var. nanjenshanensis, Ilex lonicerifolia var. matsudae, Syzygium buxifolium, Osmanthus marginatus, Symplocos theophrastifolia, and Symplocos congesta were the most abundant species in census 1 (Supplementary Material Table S1); however, these exhibited large decrease in stem density, basal area, and importance value over time. These species, except for Symplocos congesta, and Symplocos theophrastifolia, had a strong species-habitat association with the windward habitat and were designated as windward distributed species in Ku et al. [18]. Windward distributed species specialize in small, thick, and waxy leaves to prevent rapid evapotranspiration under the strong wind stress conditions in winter [12,13]. Thus, those specialized functions are an adaptation to environmental stress, but in spite of these adaptations, their stem density, basal area, and importance values decreased over time. Moreover, eight out of 22 windward distributed species are contained in the red list of vascular plants of Taiwan [33], including critically endangered (Lithocarpus formosanus), endangered (Nageia nagi and Podocarpus macrophyllus), vulnerable (Camellia hengchunensis and Symplocos shilanensis), and near-threatened species (Eurya nitida var. nanjenshanensis, Myrsine seguinii, and Ilex lonicerifolia var. matsudae) [33]. Six of the eight endangered species showed a decrease in stem density, basal area, and importance values (Figure 3, Table S1). Among these species, the distribution of Lithocarpus formosanus was only recorded in the Nanjenshan Nature Reserve. Currently, there is no apparent cause for those endangered species to undergo the observed decreasing patterns, but in Ku et al. [21], large trees tend to have a high growth rate, and small trees tend to self-thin. Further examination of the dynamics of the size distribution of these species is needed to better understand how the red-listed species survive over time. Nonetheless, conservation plans for these endangered species in the wind-affected forest are needed to ensure their persistence in the future. Among the species known to exist only in high wind exposure forests, Melastoma candidum increased in stem density significantly over the study period. Melastoma candidum is a fast-growing tree whose photosynthetic capacity can range between 24.0–25.9 μmol CO2 m−2 s1 [34]. The increase of this species could be due to the Nanjenshan Nature Reserve being disturbed by a typhoon in 2016, causing defoliation in the forest and felling numerous large trees. The created gaps could have provided a suitable regenerative habitat for this species [35,36].
The species found in both high and low wind exposure plots show a positive change in stem density, basal area, and importance value. These species are not the most dominant species in the forest, but increased their basal area over time and became the dominant species. For examples, Schefflera octophylla, Schima superba var. kankaoensis, Ilex uraiensis, and Litsea acutivena were the larger diameter species in the forest, and they accumulated more aboveground biomass through time, showing that the importance of the large tree species is crucial to maintaining biomass in the forest [37,38].
The species that were only found in the low wind exposure forest tended to be bigger than those in the high wind exposure forest. Ficus benjamina dominated the most space with its large diameter and numerous prop roots. Other species in the Nanjenshan plot I showed an increasing trend in importance values, in contrast to the dynamic of trees in the wind-stressed forest. The originally dominant species were no longer dominant over time, and the species that were originally lower in the ranking became more prominent. Legendre and Condit [5] showed that the drought from El Niño caused the stem density to decrease and changed the beta diversity difference in different habitats at Barro Colorado Island forest dynamics plot. Species from other habitats invaded BCI swamp habitat due to drought [5].

4.3. How the Monsoon Wind Shaped the Forest of the Future

Fluctuations in environmental stress may influence species changes in density or biomass. Based on the stress gradient hypothesis, high environmental stress release may transfer species interaction from facilitation to competition [39]. Grassland research in southern Norway showed that global warming increases competition in dominant species [40]. Some alpine research also found that the intensity of stress may affect the relationship between biomass and density [41,42]. Crabtree and Ellis [43] revealed that decreasing wind speed induced by global warming caused the stress-tolerant lichens to compete for space and light in the Cairgorm Mountains. The stress gradient hypothesis has been tested in herb-, shrub-, and small tree-dominated ecosystems [40,44], but seldom in tropical forests. At our study site, the northeast monsoon wind is an important influential factor affecting two different forest compositions [15,18,22]. According to the research from Hung and Kao [45] and Wang and Lu [46], global warming changes the pattern of the Siberian high and causes the East Asian winter monsoon to decrease. Based on the stress gradient hypothesis, once the environmental stress decreases, species interaction in the forest may change. This hypothesis may explain why the stem density decreased in windward distributed species but increased in other species. More field survey work and experiments are needed to investigate this hypothesis.

5. Conclusions

This study describes species changes in two forests having different levels of wind exposure at the Nanjenshan Nature Reserve, Taiwan. High wind exposed forests had high stem density and small trees to defend against wind stress in winter. However, stem density decreased significantly over time in the most abundant and endangered species. In contrast, the low wind exposure forest had a low stem density, and its large trees increased their basal area to dominate the forest over time. The high wind exposure forest brought about more negative changes in the tree community than the low wind exposure forest. Species fluctuation in the Nanjenshan Nature Reserve caused the dominant species to no longer be dominant.

Supplementary Materials

The following are available online at https://www.mdpi.com/article/10.3390/d14030169/s1. Table S1: Change of the density, basal area, and importance value of each species under different census times for the species that only distributed in the Lanjenchi plot. Table S2. Change of the density, basal area, and importance value of each species under different census times for the species that only distributed in the Nanjenshan plot 1. Table S3. Change of the density, basal area, and importance value of each species under different census times for the species that distributed in both Lanjenchi plot and the Nanjenshan plot 1.

Author Contributions

Conceptualization, C.-C.K. and W.-C.C.; methodology, C.-C.K. and W.-C.C.; software, C.-C.K. and W.-C.C.; validation, C.-C.K., K.-J.C. and W.-C.C.; formal analysis, C.-C.K. and W.-C.C.; investigation, C.-C.K., K.-J.C., G.-Z.M.S., H.-Y.L., S.-W.F. and W.-C.C.; resources, H.-Y.L., S.-W.F. and W.-C.C.; data curation, W.-C.C.; writing—original draft preparation, C.-C.K.; writing—review and editing, K.-J.C., G.-Z.M.S., H.-Y.L., S.-W.F. and W.-C.C.; visualization, C.-C.K. and W.-C.C.; supervision, G.-Z.M.S., H.-Y.L. and S.-W.F.; project administration, H.-Y.L., S.-W.F. and W.-C.C.; funding acquisition, H.-Y.L., S.-W.F. and W.-C.C. All authors have read and agreed to the published version of the manuscript.

Funding

This research was funded by Forestry Bureau of Taiwan, grant number tfbc-1080205 (Nanjenshan plot I in 2020), tfbc-1070204 (Lanjenchi plot in 2019), tfbp-1010223 (Lanjenchi plot in 2013, Nanjenshan plot I in 2013), 97-00-2-02 (Nanjenshan plot I in 2008); and Kenting National Park of Taiwan, grant number RES085 (Lanjenchi plot in 1991).

Institutional Review Board Statement

Not applicable.

Data Availability Statement

All of the raw data in each census are belonging to the funding unit. The data can be derived from the site principal investigator. The information of the principal investigator in Nanjenshan site can be found on the ForestGEO website (https://forestgeo.si.edu/sites/asia/nanjenshan (accessed on 24 February 2022)).

Acknowledgments

Thanks to the financial support from the Forestry Bureau of Taiwan and Kenting National Park for us to maintain survey work in the Nanjenshan Forest Dynamic Plot for 30 years. We also thank all of the volunteers, workers and research assistants who devoted their energy and time in this plot from 1989 to 2020. Moreover, we thank Chieh-Yu Liao and Wen-Ling Shen for proofreading all of the details concluded in this study. Finally, we appreciate the reviewers for their valuable comments to improve the quality of this manuscript.

Conflicts of Interest

The authors declare no conflict of interest.

References

  1. Begon, M.; Townsend, C.R.; Harper, J.L. Ecology: From Individuals to Ecosystems; Blackwell: Oxford, UK, 2006. [Google Scholar]
  2. Condit, R.; Hubbell, S.P.; Foster, R.B. Short-term dynamics of a neotropical forest: Change within limits. Bioscience 1992, 42, 822–828. [Google Scholar] [CrossRef]
  3. Condit, R.; Hubbell, S.P.; Foster, R.B. Mortality rates of 205 neotropical tree and shrub species and the impact of a severe drought. Ecol. Monogr. 1995, 65, 419–439. [Google Scholar] [CrossRef]
  4. Condit, R. Research in large, long-term tropical forest plots. Trends Ecol. Evol. 1995, 10, 18–22. [Google Scholar] [CrossRef]
  5. Legendre, P.; Condit, R. Spatial and temporal analysis of beta diversity in the Barro Colorado Island forest dynamics plot, Panama. For. Ecosyst. 2019, 6, 7. [Google Scholar] [CrossRef] [Green Version]
  6. Chisholm, R.A.; Condit, R.; Rahman, K.A.; Baker, P.J.; Bunyavejchewin, S.; Chen, Y.Y.; Chuyong, G.; Dattaraja, H.; Davies, S.; Ewango, C.E. Temporal variability of forest communities: Empirical estimates of population change in 4000 tree species. Ecol. Lett. 2014, 17, 855–865. [Google Scholar] [CrossRef] [PubMed]
  7. Condit, R.; Ashton, P.S.; Manokaran, N.; LaFrankie, J.V.; Hubbell, S.P.; Foster, R.B. Dynamics of the forest communities at Pasoh and Barro Colorado: Comparing two 50–ha plots. Philos. Trans. R. Soc. Lond. B 1999, 354, 1739–1748. [Google Scholar] [CrossRef] [PubMed] [Green Version]
  8. Shen, Y.; Santiago, L.S.; Ma, L.; Lin, G.-J.; Lian, J.-Y.; Cao, H.-L.; Ye, W.-H. Forest dynamics of a subtropical monsoon forest in Dinghushan, China: Recruitment, mortality and the pace of community change. J. Trop. Ecol. 2013, 29, 131–145. [Google Scholar] [CrossRef] [Green Version]
  9. Vincent, J.B.; Turner, B.L.; Alok, C.; Novotny, V.; Weiblen, G.D.; Whitfeld, T.J. Tropical forest dynamics in unstable terrain: A case study from New Guinea. J. Trop. Ecol. 2018, 34, 157–175. [Google Scholar] [CrossRef]
  10. Lai, J.; Mi, X.; Ren, H.; Ma, K. Species-habitat associations change in a subtropical forest of China. J. Veg. Sci. 2009, 20, 415–423. [Google Scholar] [CrossRef]
  11. Guo, Y.; Wang, B.; Mallik, A.U.; Huang, F.; Xiang, W.; Ding, T.; Wen, S.; Lu, S.; Li, D.; He, Y. Topographic species–habitat associations of tree species in a heterogeneous tropical karst seasonal rain forest, China. J. Plant Ecol. 2017, 10, 450–460. [Google Scholar] [CrossRef]
  12. Hsieh, C.-F.; Chen, Z.-S.; Sun, I.; Hsieh, T.-H.; Zheng, Y.-B.; Wang, K.-H.; Su, M.-H.; Jiang, F.-Y. The Subtropical Rain Forest in Nanjenshan Area, Kenting National Park (Report No. RES085); Kenting National Park, Construction and Planning Agency, Ministry of the Interior: Pingtung County, Taiwan, 1992; p. 269. [Google Scholar]
  13. Su, M.H. The Leaf Structure of Canopy of Nanjenshan Subtropical Rain Forest. Master’s Thesis, National Taiwan University, Taipei, Taiwan, 1993. [Google Scholar]
  14. Chang, C.-Y. Effects of Wind Speed and Other Environmental Factors on Sap Flux of Three Species in a Subtropical Rainforest of Nanjenshan, South Taiwan. Master’s Thesis, National Taiwan University, Taipei, Taiwan, 2008. [Google Scholar]
  15. Hsieh, C.-F.; Sun, I.-F.; Yang, C.-C. Species composition and vegetation pattern of a lowland rain forest at the Nanjenshan LTER site, southern Taiwan. Taiwania 2000, 45, 107–119. [Google Scholar] [CrossRef]
  16. Chao, W.-C.; Song, G.-Z.M.; Chao, K.-J.; Liao, C.-C.; Fan, S.-W.; Wu, S.-H.; Hsieh, T.-H.; Sun, I.-F.; Kuo, Y.-L.; Hsieh, C.-F. Lowland rainforests in southern Taiwan and Lanyu, at the northern border of Paleotrophics and under the influence of monsoon wind. Plant Ecol. 2010, 210, 1–17. [Google Scholar] [CrossRef]
  17. Li, C.F.; Chytrý, M.; Zelený, D.; Chen, M.Y.; Chen, T.Y.; Chiou, C.R.; Hsia, Y.J.; Liu, H.Y.; Yang, S.Z.; Yeh, C.L. Classification of Taiwan forest vegetation. Appl. Veg. Sci. 2013, 16, 698–719. [Google Scholar] [CrossRef]
  18. Ku, C.-C.; Song, G.-Z.M.; Chao, K.-J.; Chao, W.-C. Species-habitat associations of tree species under the northeast monsoon wind-affected tropical forest at Lanjenchi Forest Dynamics Plot, Taiwan. Taiwania 2021, 66, 39–47. [Google Scholar] [CrossRef]
  19. Chao, K.-J.; Liao, P.-S.; Chen, Y.-S.; Song, G.-Z.M.; Phillips, O.L.; Lin, H.-J. Very Low Stocks and Inputs of Necromass in Wind-affected Tropical Forests. Ecosystems 2021. [Google Scholar] [CrossRef]
  20. Chao, W.-C.; Chao, K.-J.; Song, G.-Z.M.; Hsieh, C.-F. Species composition and structure of the lowland subtropical rainforest at Lanjenchi, Southern Taiwan. Taiwania 2007, 52, 253–269. [Google Scholar] [CrossRef]
  21. Ku, C.-C.; Tang, J.; Chao, W.-C.; Chao, K.-J.; Song, G.-Z.M. Changes in aboveground biomass during the past 22 years at Lanjenchi Forest Dynamics Plot tropical forest in southern Taiwan. Ecol. Evol. 2022. (under review). [Google Scholar]
  22. Chao, K.-J.; Chao, W.-C.; Chen, K.-M.; Hsieh, C.-F. Vegetation dynamics of a lowland rainforest at the Northern border of the Paleotropics at Nanjenshan, southern Taiwan. Taiwan J. For. Sci. 2010, 25, 29–40. [Google Scholar] [CrossRef]
  23. R Core Team. R: A Language and Environment for Statistical Computing. Available online: https://www.R-project.org/ (accessed on 24 February 2022).
  24. Højsgaard, S.; Halekoh, U.; Yan, J. The R package geepack for generalized estimating equations. J. Stat. Softw. 2005, 15, 1–11. [Google Scholar] [CrossRef] [Green Version]
  25. Huang, T.-C.; Hsuan, K.; Tsai, J.-L. Editorial Committee of the Flora of Taiwan, 2nd ed.; Department of Botany, National Taiwan University: Taipei, Taiwan, 2003. [Google Scholar]
  26. Hill, M.O.; Gauch, H.G. Detrended correspondence analysis: An improved ordination technique. Vegetatio 1980, 42, 47–58. [Google Scholar] [CrossRef]
  27. Oksanen, J.; Kindt, R.; Legendre, P.; O’Hara, B.; Stevens, M.H.H.; Oksanen, M.J.; Suggests, M. The vegan package. Community Ecol. Package 2007, 10, 719. [Google Scholar]
  28. Telewski, F.W. Is windswept tree growth negative thigmotropism? Plant Sci. 2012, 184, 20–28. [Google Scholar] [CrossRef]
  29. Schimper, A.F.W. Pflanzen-Geographie auf Physiologischer Grundlage; G. Fischer: Jena, Germany, 1898; Volume 2. [Google Scholar]
  30. MacFarlane, D.W.; Kane, B. Neighbour effects on tree architecture: Functional trade-offs balancing crown competitiveness with wind resistance. Funct. Ecol. 2017, 31, 1624–1636. [Google Scholar] [CrossRef] [Green Version]
  31. Archibald, S.; Bond, W.J. Growing tall vs growing wide: Tree architecture and allometry of Acacia karroo in forest, savanna, and arid environments. Oikos 2003, 102, 3–14. [Google Scholar] [CrossRef]
  32. Hubbell, S.P. The Unified Neutral Theory of Biodiversity and Biogeography (MPB-32); Princeton University Press: Princeton, NJ, USA, 2001; Volume 32. [Google Scholar]
  33. Editorial Committee of the Red List of Taiwan Plants. The Red List of Vascular Plants of Taiwan; Endemic Species Research Institute, Forestry Bureau, Council of Agriculture, Executive Yuan and Taiwan Society of Plant Systematics: Nantou, Taiwan, 2017; p. 186. [Google Scholar]
  34. Kuo, Y.-L.; Lin, T.-Y.; Yang, Y.-Y.; Chen, H.-L.; Yang, C.-K.; Yu, S.-Y. Photosynthetic characteristics and shade tolerance of 440 native woody species in Taiwan. Taiwan J. For. Sci. 2021, 36, 189–220. [Google Scholar]
  35. Velázquez, E.; Wiegand, T. Competition for light and persistence of rare light-demanding species within tree-fall gaps in a moist tropical forest. Ecology 2020, 101, e03034. [Google Scholar] [CrossRef] [Green Version]
  36. Hubbell, S.P.; Foster, R.B. Plant Ecology; Blackwell Scientific: Oxford, UK, 1986. [Google Scholar]
  37. Lutz, J.A.; Furniss, T.J.; Johnson, D.J.; Davies, S.J.; Allen, D.; Alonso, A.; Anderson-Teixeira, K.J.; Andrade, A.; Baltzer, J.; Becker, K.M. Global importance of large-diameter trees. Glob. Ecol. Biogeogr. 2018, 27, 849–864. [Google Scholar] [CrossRef] [Green Version]
  38. Lutz, J.A.; Larson, A.J.; Swanson, M.E.; Freund, J.A. Ecological importance of large-diameter trees in a temperate mixed-conifer forest. PLoS ONE 2012, 7, e36131. [Google Scholar] [CrossRef]
  39. Bertness, M.D.; Callaway, R. Positive interactions in communities. Trends Ecol. Evol. 1994, 9, 191–193. [Google Scholar] [CrossRef]
  40. Olsen, S.L.; Töpper, J.P.; Skarpaas, O.; Vandvik, V.; Klanderud, K. From facilitation to competition: Temperature-driven shift in dominant plant interactions affects population dynamics in seminatural grasslands. Glob. Change Biol. 2016, 22, 1915–1926. [Google Scholar] [CrossRef]
  41. Chu, C.J.; Maestre, F.T.; Xiao, S.; Weiner, J.; Wang, Y.S.; Duan, Z.H.; Wang, G. Balance between facilitation and resource competition determines biomass-density relationships in plant populations. Ecol. Lett. 2008, 11, 1189–1197. [Google Scholar] [CrossRef] [PubMed]
  42. Anthelme, F.; Cavieres, L.A.; Dangles, O. Facilitation among plants in alpine environments in the face of climate change. Front. Plant Sci. 2014, 5, 387. [Google Scholar] [CrossRef] [PubMed] [Green Version]
  43. Crabtree, D.; Ellis, C.J. Species interaction and response to wind speed alter the impact of projected temperature change in a montane ecosystem. J. Veg. Sci. 2010, 21, 744–760. [Google Scholar] [CrossRef]
  44. He, Q.; Bertness, M.D.; Altieri, A.H. Global shifts towards positive species interactions with increasing environmental stress. Ecol. Lett. 2013, 16, 695–706. [Google Scholar] [CrossRef] [PubMed]
  45. Hung, C.-w.; Kao, P.-k. Weakening of the winter monsoon and abrupt increase of winter rainfalls over northern Taiwan and southern China in the early 1980s. J. Clim. 2010, 23, 2357–2367. [Google Scholar] [CrossRef]
  46. Wang, L.; Lu, M.-M. The East Asian winter monsoon. In The Global Monsoon System: Research and Forecast, 2nd ed.; Chang, C.-P., Ding, Y., Lau, N.-C., Johnson, R.H., Wang, B., Yasunari, T., Eds.; World Scientific: Singapore, 2017; pp. 51–61. [Google Scholar]
Figure 1. Map of the study sites.
Diversity 14 00169 g001
Figure 2. Distribution of 160 species between the first and second DCA axes. Solid circles represent the species that were only distributed in the Lanjenchi plot; hollow circles represent the species only distributed in the Nanjenshan plot I; and grey triangles represent the species found both in the Lanjenchi plot and Nanjenshan plot I.
Diversity 14 00169 g002
Figure 3. Changes in stem density, basal area, and importance value of 30 species having the greatest increases and decreases by importance values from census 1 to census 5. Red bar indicates the species that only exist in the high wind exposure forest (Lanjenchi plot), the dark blue bar indicates the species that only exist in the low wind exposure forest (Nanjenshan plot I), and light purple bar indicates species that existing in both forests. *, **, and *** beside the bar representing the significant difference under the generalized estimating equations of α < 0.05, α < 0.01, α < 0.001, respectively from the preceding census.
Diversity 14 00169 g003
Table 1. Changes in forest structure of the 5.88-ha Lanjenchi plot and 2.1-ha Nanjenshan plot I.
CensusLanjenchi PlotNanjenshan Plot I
Stem Density
(Individual ha−1)
Basal Area (m2 ha−1)Species HϮ2DϮ3Stem Density
(Individual ha−1)
Basal Area (m2 ha−1)Species HϮ2DϮ3
1 Ϯ112,179 ± 6689 d46.3 ± 36.4 a1193.860.963253 ± 1208 a42.7 ± 32.9 a1053.310.93
210,406 ± 5603 d46.6 ± 32.1 a1323.900.973610 ± 1582 a45.1 ± 41.3 a1063.260.93
39681 ± 4760 b45.3 ± 29.0 a1313.890.964058 ± 1792 b44.3 ± 40.6 a1063.300.93
49532 ± 4306 a46.1 ± 26.1 a1303.860.963991 ± 1772 b44.6 ± 40.5 a1073.280.93
59694 ± 3924 b,c46.0 ± 26.3 a1263.800.964019 ± 1791 b46.6 ± 43.0 a1053.260.93
Ϯ1. The census 1 of Lanjenchi plot size was 3-ha, but was enlarged to 5.88-ha from census 2; Ϯ2. Shannon diversity index; Ϯ3. Simpson’s diversity index; The small letter (a–d) indicates a significant difference between census by using Tuckey’HSD post hoc comparison.
Table 2. Dynamic changes in the 5.88-ha Lanjenchi plot and 2.1-ha Nanjenshan plot I.
CensusLanjenchi PlotNanjenshan Plot I
r (% yr−1)m (% yr−1)λ (% yr−1)r (% yr−1)m (% yr−1)λ (% yr−1)
1 Ϯ1------
22.562.500.063.011.661.35
31.662.56−0.93.552.091.46
41.922.12−0.22.492.83−0.34
53.142.860.282.312.43−0.12
Ϯ1. The census 1 of Lanjenchi plot size was 3-ha, but was enlarged to 5.88-ha from census 2; r: recruitment rate; m: mortality rate; λ: population growth.
Publisher’s Note: MDPI stays neutral with regard to jurisdictional claims in published maps and institutional affiliations.

