Article

Spatiotemporal Variation in Coral Assemblages and Reef Habitat Complexity among Shallow Fore-Reef Sites in the Florida Keys National Marine Sanctuary

by
Kayelyn R. Simmons
1,*,
DelWayne R. Bohnenstiehl
1,2 and
David B. Eggleston
1,3
1
Department of Marine, Earth, and Atmospheric Science, North Carolina State University, Raleigh, NC 27695, USA
2
Center for Geospatial Analytics, North Carolina State University, Raleigh, NC 27695, USA
3
Center for Marine Sciences and Technology, North Carolina State University, Morehead City, NC 28557, USA
*
Author to whom correspondence should be addressed.
Diversity 2022, 14(3), 153; https://doi.org/10.3390/d14030153
Submission received: 27 December 2021 / Revised: 10 February 2022 / Accepted: 16 February 2022 / Published: 22 February 2022
(This article belongs to the Special Issue Technological Innovation to Support Reef Research and Conservation)

Abstract

:
With the unprecedented degradation and loss of coral reefs at multiple scales, the underlying changes in abiotic and biotic features relevant to the three-dimensional architecture of coral reefs are critical to conservation and restoration. This study characterized the spatiotemporal variation of habitat metrics at eight fore-reef sites representing three management zones in the Florida Keys, USA using visual habitat surveys (2017–2018) acquired before and after Hurricane Irma. Post-hurricane, five of those sites were surveyed using structure-from-motion photogrammetry to further investigate coral morphology on structural complexity. Multivariate results for visual surveys identified moderate separation among sites, with fished sites characterized by complex physical features such as depth and vertical hard relief while protected sites generally harbored high abundances of live coral cover. Three-dimensional models of mapped sites showed within site variation as another driver in site separation. Additionally, fine-scale orthoimage analyses identified significant differences in dominant coral morphologies at each mapped site. This study suggests protected reef sites generally harbor higher live coral cover despite some fished sites being structurally similar in seabed topography. Our work provides fine-scale spatial data on several managed sites within a marine sanctuary and highlights the contribution of diverse coral assemblages to the coral reef framework.

1. Introduction

Coral reefs are highly productive, biologically rich, and structurally complex ecosystems supporting 25% of marine life in the world’s oceans [1]. They also support a broad range of ecosystem services [2,3,4] with recreational and cultural benefits [5,6,7], as well as resources that support the economically important pharmaceutical, fisheries, aquarium trade, and construction industries [8,9,10]. Coral reefs are also increasingly threatened by a broad array of chronic and acute stressors. Chronic stressors range from destructive fishing practices to eutrophication and sedimentation from land-use practices and sewage-runoff [11,12,13,14]. Additive effects of acute but highly destructive impacts such as the spread of invasive species [15,16,17] and aggressive coral diseases [18,19], thermal stress [20,21] and vessel grounding incidents [22,23] are causing unprecedented mortality rates for reef-building corals. Although not as detrimental as large-sale anthropogenic stressors, the residual effects of long-term recreational SCUBA diving on coral reefs can decrease structural complexity from broken and abraded benthos [24].
Persistent declines in the three-dimensional structure of coral reefs will have cascading consequences for reef fish diversity, fisheries, and the ecosystem services that coastal human societies rely on [8,25,26,27]. Marine protected areas (MPAs) are increasingly used to support ecosystem-based management, mitigate damage from fishing interactions, conserve species at risk, and are often successful when designed as a network connected by larval dispersal and migration by mobile species [28,29,30,31]. However, coral reef restoration methods and long-term monitoring in protected areas can vary across local to regional scales, and can address multiple restoration goals [32,33].
Defining ecological units to assess impacts for local and regional management plans can be difficult when spatiotemporal differences occur at complex scales. For example, seascape-level metrics relevant to ecological resilience, such as coral cover and diversity or herbivorous fish biomass, are often important at local spatial scales [34,35,36,37]. Efforts to understand and monitor spatiotemporal variations across reef habitats recognize the need for spatially relevant metrics and biological data at multiple scales (e.g., organism level to community level) [38]. Modern coral reef monitoring and restoration efforts are implementing photomosaics as tools to study reef resilience indicators at the community level in the face of hurricanes, coral disease, and overall decline [37,39,40]. The use of fine-scale mapping tools such as Structure-from-Motion (SfM) photogrammetry is becoming widely used to monitor and quantify differences among sites that vary in three-dimensions [41,42,43]. Moreover, fine-scale reef mapping approaches at the colony scale (1 mm–1 cm pixel) highlight the local variability in biotic cover and relevant physical features appropriate for local management priorities [44,45].
Established in 1990, the Florida Keys National Marine Sanctuary (FKNMS) includes ~9500 km2 of the Florida Reef Tract (FRT), a large bank-barrier reef system comprised of fringing mangroves, seagrass beds, near-shore patch reefs, and the off-shore reef tract across a network of marine zones and regulated fishing habitats [46,47]. The FKNMS is one of the largest MPAs in the United States and provides a mosaic of critical habitats along the Florida Keys archipelago for over 6000 species of invertebrates, fishes, and coastal flora [47]. The main causes for coral decline within the FKNMS are related to disease, thermal mass bleaching, fragmentation, and predation [48,49]. Several prominent massive, reef-building corals in the Florida Keys are listed on The Endangered Species Act (50 CFR 402) as threatened, such as the pillar coral Dendrogyra cylindrus [48,50,51] and three star corals Orbicella sp., as well as the branching staghorn coral Acropora cervicornis and elkhorn coral A. palmata [49,52]. The average benthic cover of scleractinian (stony) corals in the FKNMS were estimated to have declined from ~13% in 1996 to 8 % in 2009 [53]. More recently, the aggressive stony coral tissue loss disease (SCTLD) epidemic in the Florida Keys, first reported in 2014, has impacted at least 23 coral species, leading to reductions in coral density by 30%, with differential susceptibility factors for specific coral families and morphologies [54,55,56].
Long-term regional coral surveys from 2007–2016 in the Southeast FRT, the three parallel liner reefs within the FRT extending from Biscayne Bay to St. Lucie Inlet, observed spatiotemporal variations in the negative response to thermal stress for key reef building coral taxa (e.g., Acroporidae, Montastraeidae, Siderastreidae), and also observed minimal or positive impacts for weedy or small coral taxa (e.g., Poritidae) [57]. As the threats to coral reefs progress, fine-scale baseline data on reef habitats and benthic cover is necessary to document how changes in coral communities and their contribution to reef structure complexity will impact future ecological productivity [19,58,59].
The goal of this study was to characterize spatiotemporal variation in coral reef habitat features using visual habitat surveys and high-resolution benthic maps produced by SfM photogrammetry of coral reefs located in different management zones within the FKNMS. A secondary goal was to compare changes in habitat characteristics before versus after the passage of Hurricane Irma (September 2017) in the Lower Keys section of the FKNMS. Large-scale benthic mapping in the Florida Keys region has occurred since 1996 [60,61]. However, the results from the present study may serve as a baseline for a more fine-scale approach to long-term monitoring and restoration efforts by characterizing the relationship between management zones, coral reef assemblages and habitat characteristics on a local scale.

2. Materials and Methods
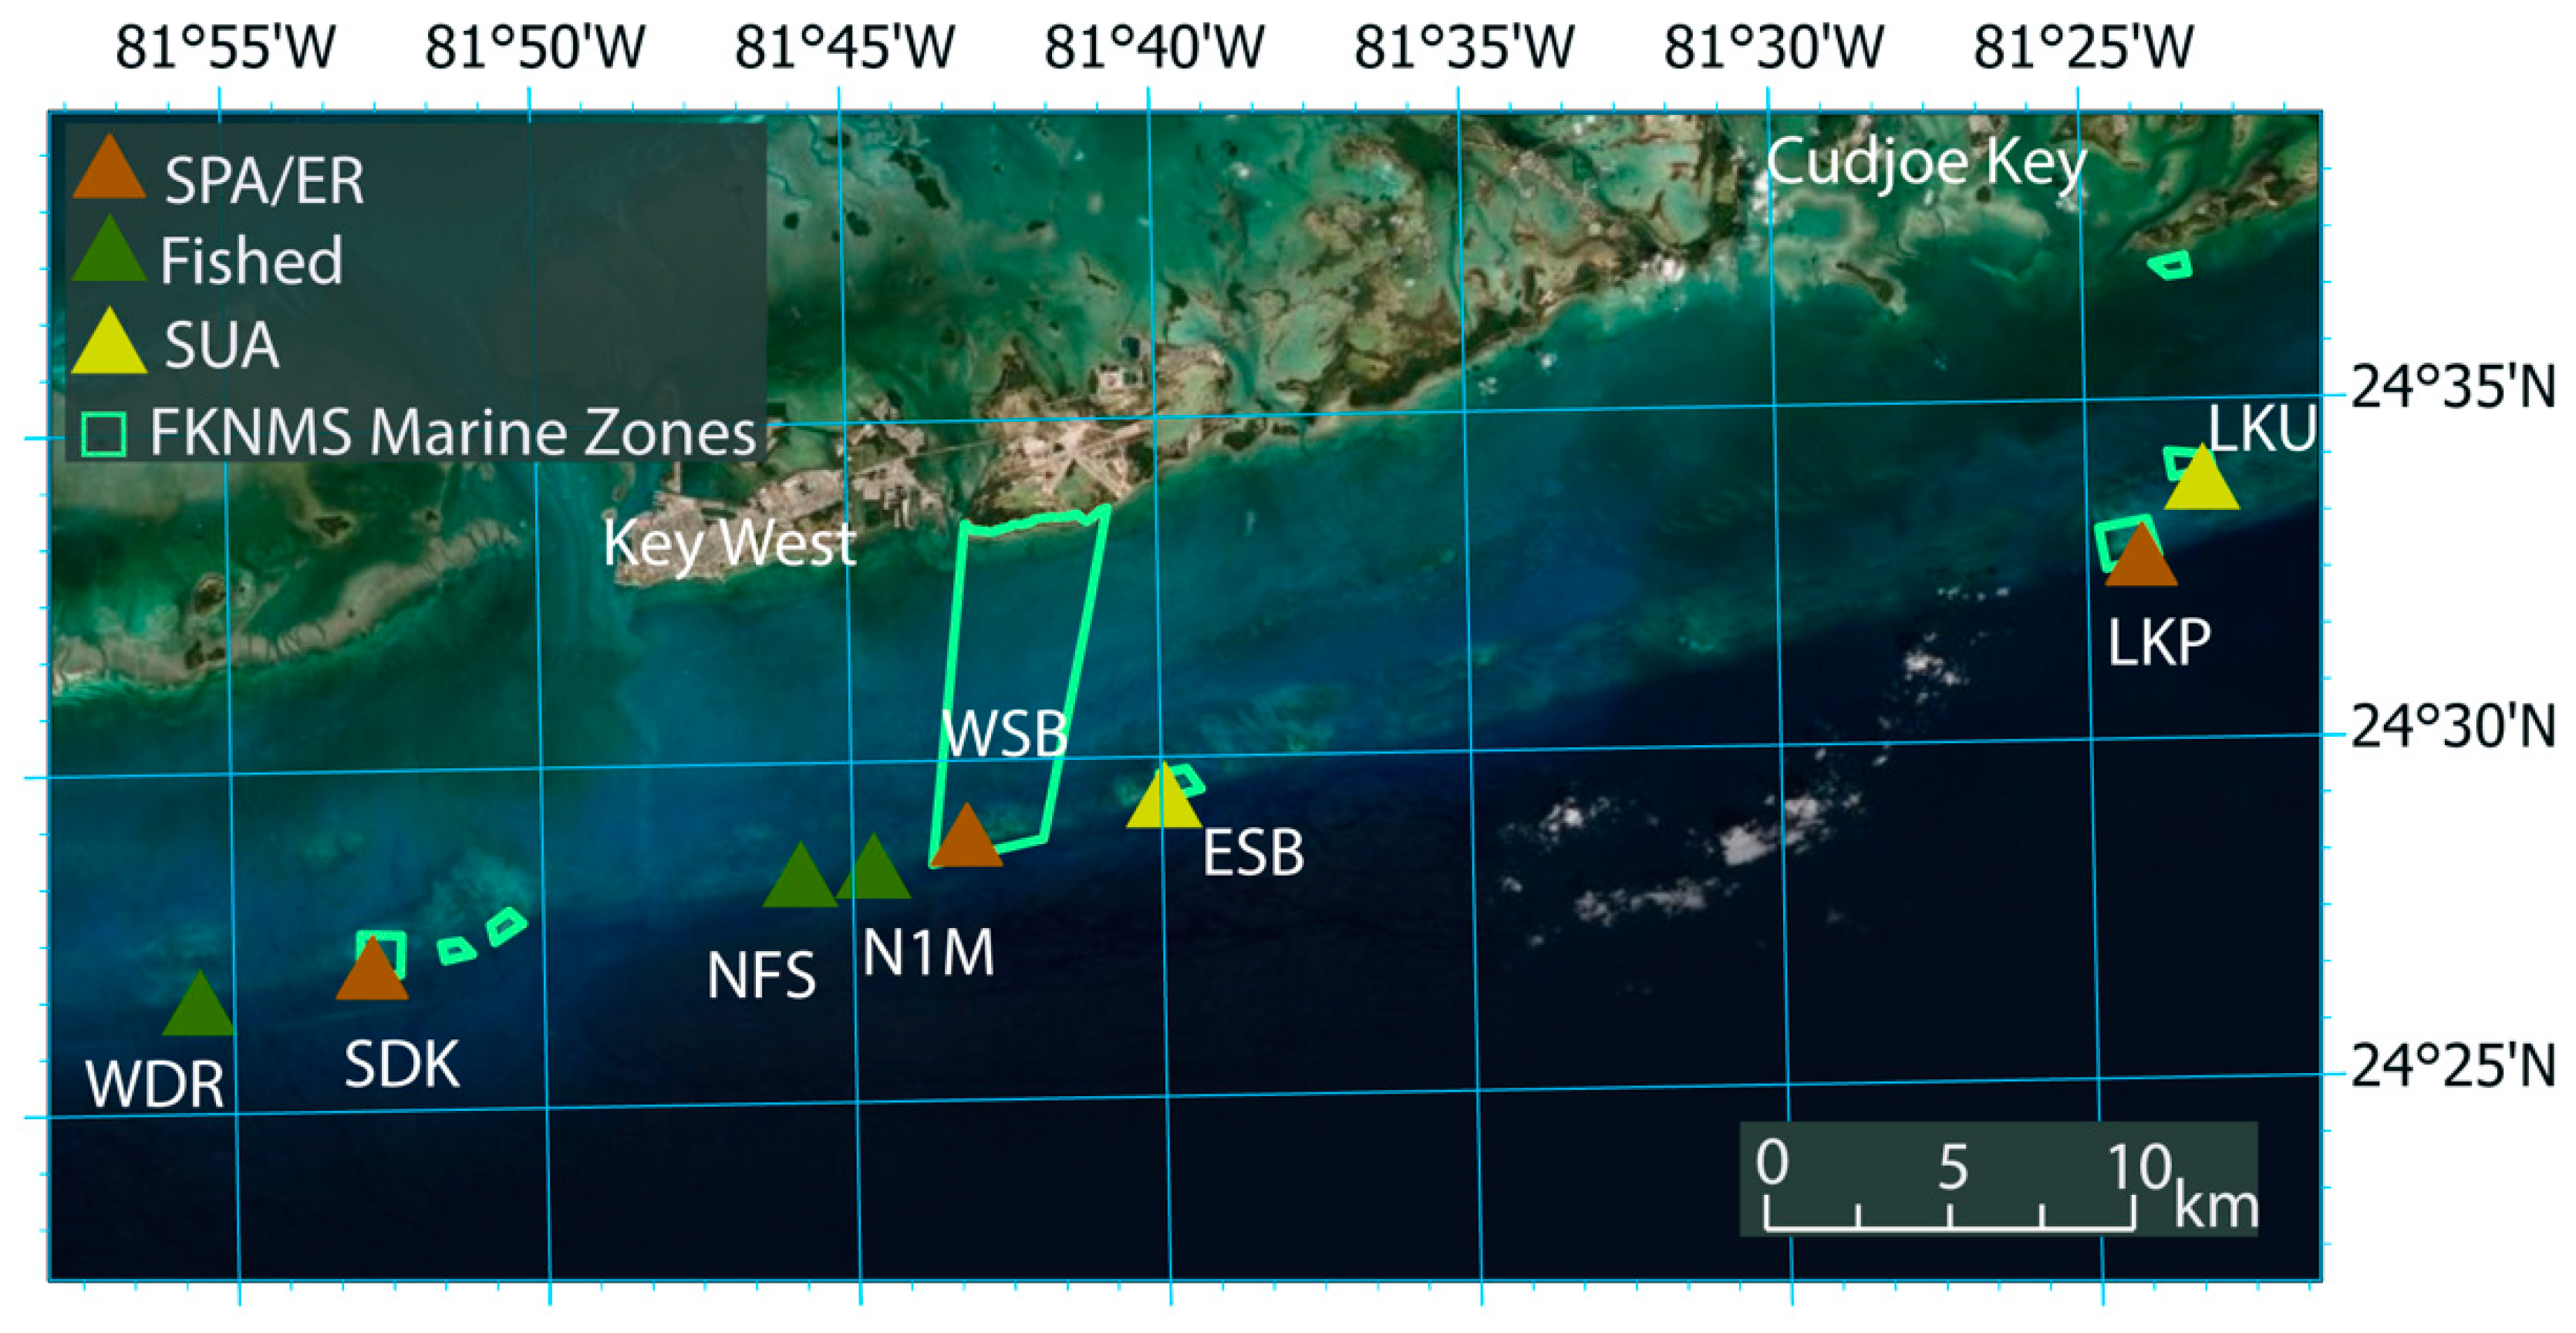
Reef Visual Census (RVC) surveys were conducted seasonally by scuba divers at eight fore-reef study sites in the lower Florida Keys between February 2017 and December 2018. In 2018, SfM habitat photogrammetry was conducted within a subset of 5 of the 8 sites. The general statistical approach included generating a suite of habitat metrics from each survey dataset to test for differences in habitat characteristics among sites and over time. These datasets were also used to observe differences in metrics derived from each data source.

2.1. Study System

There are five marine zone types in the FKNMS to protect reef habitats while allowing adequate access for fishing and recreation—these include: (i) sanctuary preservation areas (SPAs), (ii) ecological reserves (ERs), (iii) wildlife management areas (WMAs), (iv) special use, research only areas (SUAs), and (v) existing management areas (EMAs). The five focal reef sites mapped within this study included four marine zones [Figure 1. Site Map]: (i) one regulated fished site subject to hook-and-line, trolling, and the harvest of state/federally regulated species; (ii) two SPAs with open access to recreational divers/snorkelers and boats yet prohibits the harvest of species (no-take) and anchoring; (iii) one ER, and (iv) one SUA that is permit accessible only for scientific research and restoration efforts.
Nine Foot Stake (NFS) is a regulated, fished site comprised of shallow hardbottom spur and sand grooves and is frequently visited by recreational charter boats for fishing and scuba diving. This site contains mooring buoys for vessels to minimize anchor damage. Sand Key SPA (SDK) is roughly 11 km southeast of Key West, Florida. It has a spur-and-groove formation but contains several channels of reef rubble due to wind and wave action. Located offshore of Cudjoe Key, Looe Key SPA (LKP) is one the most iconic reefs in the lower Florida Keys due to the abundance and diversity of coral species, large barrel sponges, schooling reef fishes, large predatory fishes (e.g., Carcharhinus spp., Epinephelus itajara) and deep spur-and-groove formations greater than 7 m in depth. LKP is also a sentinel site for coral restoration and coral outplant studies for endangered coral species impacted by coral disease and long-term decline [62,63]. Western Sambo ER (WSB) is one of the largest marine zones protecting 30 km2 of a broad range of habitats from nearshore patch reefs to the offshore shallow bank reef and is relatively shallow (~4 m) [64]. Additionally, WSB has historically harbored a large abundance of branching and boulder corals. Eastern Sambo SUA (ESB) lies adjacent to WSB and is widely recognized as a pristine site home to healthy massive star (e.g., Montastraea cavernosa, Siderastrea siderea) and brain corals (e.g., Colpophyllia natans, Diploria spp.), as well as serving as a control site for resource managers evaluating the efficacy of marine zone types [64].
On September 10th 2017, before making landfall at Cudjoe Key, Florida, category 4 Hurricane Irma traveled directly over the lower Florida Keys with maximum wind speeds reaching 115 kts and sustained hurricane force winds extending across all reef sites [65]. One month later, science divers with the National Oceanographic and Atmospheric Administration (NOAA), as well as other stakeholders surveyed over 50 coral reef sites for damage by identifying evidence of heavy sedimentation, long-lasting turbidity, reef erosion, and fast-moving marine debris [66]. Reefs closer to the where the hurricane made landfall, such as LKP, suffered >26% prevalence of hurricane-impacted corals while sites farther south along the archipelago, such as WSB and SDK, showed <20% of coral impacts [67]. To document impacted reef sites and observe variation in habitat characteristics after hurricane Irma, habitat characteristics at all eight sites were assessed via the visual surveys by divers (RVC protocol), and five of eight sites were digitally mapped by NC State science divers using SfM photogrammetry methods in September 2018 (Table 1).

2.2. RVC Habitat Surveys

Reef Visual Census (RVC) surveys followed modified Bohnsack-Bannerot visual survey methods and standardized protocols developed by a cooperative multi-agency network of the Florida Fish and Wildlife Conservation Commission (FWCC), NOAA, National Park Service, and the University of Miami [68,69,70]. Primary sampling units (100 m × 100 m cells) within in each reef site were generated and as a part of a larger study by our research group bottom-mounted soundscape moorings were deployed on the sandy bottom in sand channels at a randomly selected GPS coordinate near the seaward side of each fore-reef site. The primary sampling units were further subdivided into a two-stage stratified random design in which two divers each conducted a stationary point-count RVC survey inside individual 15 m diameter cylinders extending from the seafloor vertically to the surface (depending on visibility) at randomly selected points along the spur-and-groove habitat [69]. RVC surveys allowed for the simultaneous collection of reef fish density and distribution as well as information on biotic and abiotic habitat features; however, for the purpose of this study, data results will only reflect habitat data acquired from the two divers (see below and Table 2). Depending on the habitat type and visibility, the time required for each survey ranged from 15–20 min to record both fish and habitat data. PVC-pipes constructed as a “T” (1 m length with 0.1 m increments × 0.3 m width) were used as reference measurements for estimating substrate slope and maximum vertical hard and soft relief. The surveys from the two divers were non-overlapping (~10–30 m apart), and the data from the divers combined to produce mean values for many of the habitat characteristics within a given monthly survey at a given site. There were three Pre-Irma (Feb., May, July 2017) and five post-Irma surveys (Dec. 2017, Feb., Jan., Sept., Dec. 2018), however not all sites were surveyed during each sampling period due to unfavorable weather conditions limiting site visitation (Table 1).
In the Florida Keys, spur-and-groove reefs are comprised of coalesced coral fragments cemented into hardbottom substrate that has undergone generations of coral growth in the direction of dominant wave energy and sediment accretion [71,72,73]. Therefore, habitat type was classified according to four types: (i) contiguous spur-and-groove, (ii) rubble dominated, (iii) isolated reef structure, or (iv) a matrix of habitat types. Visual surveys by divers generated information on (i) depth, (ii) hard relief of stony corals), (iii) soft relief of soft corals, (iv) abiotic footprint (percent cover sand, hardbottom, rubble), and (v) the dominant biological cover of the hardbottom (percent cover algae, live stony corals, octocorals, sponges) (Table 2). Additionally, divers recorded the presence of submerged debris such as derelict lobster traps, fishing gear, and rope.

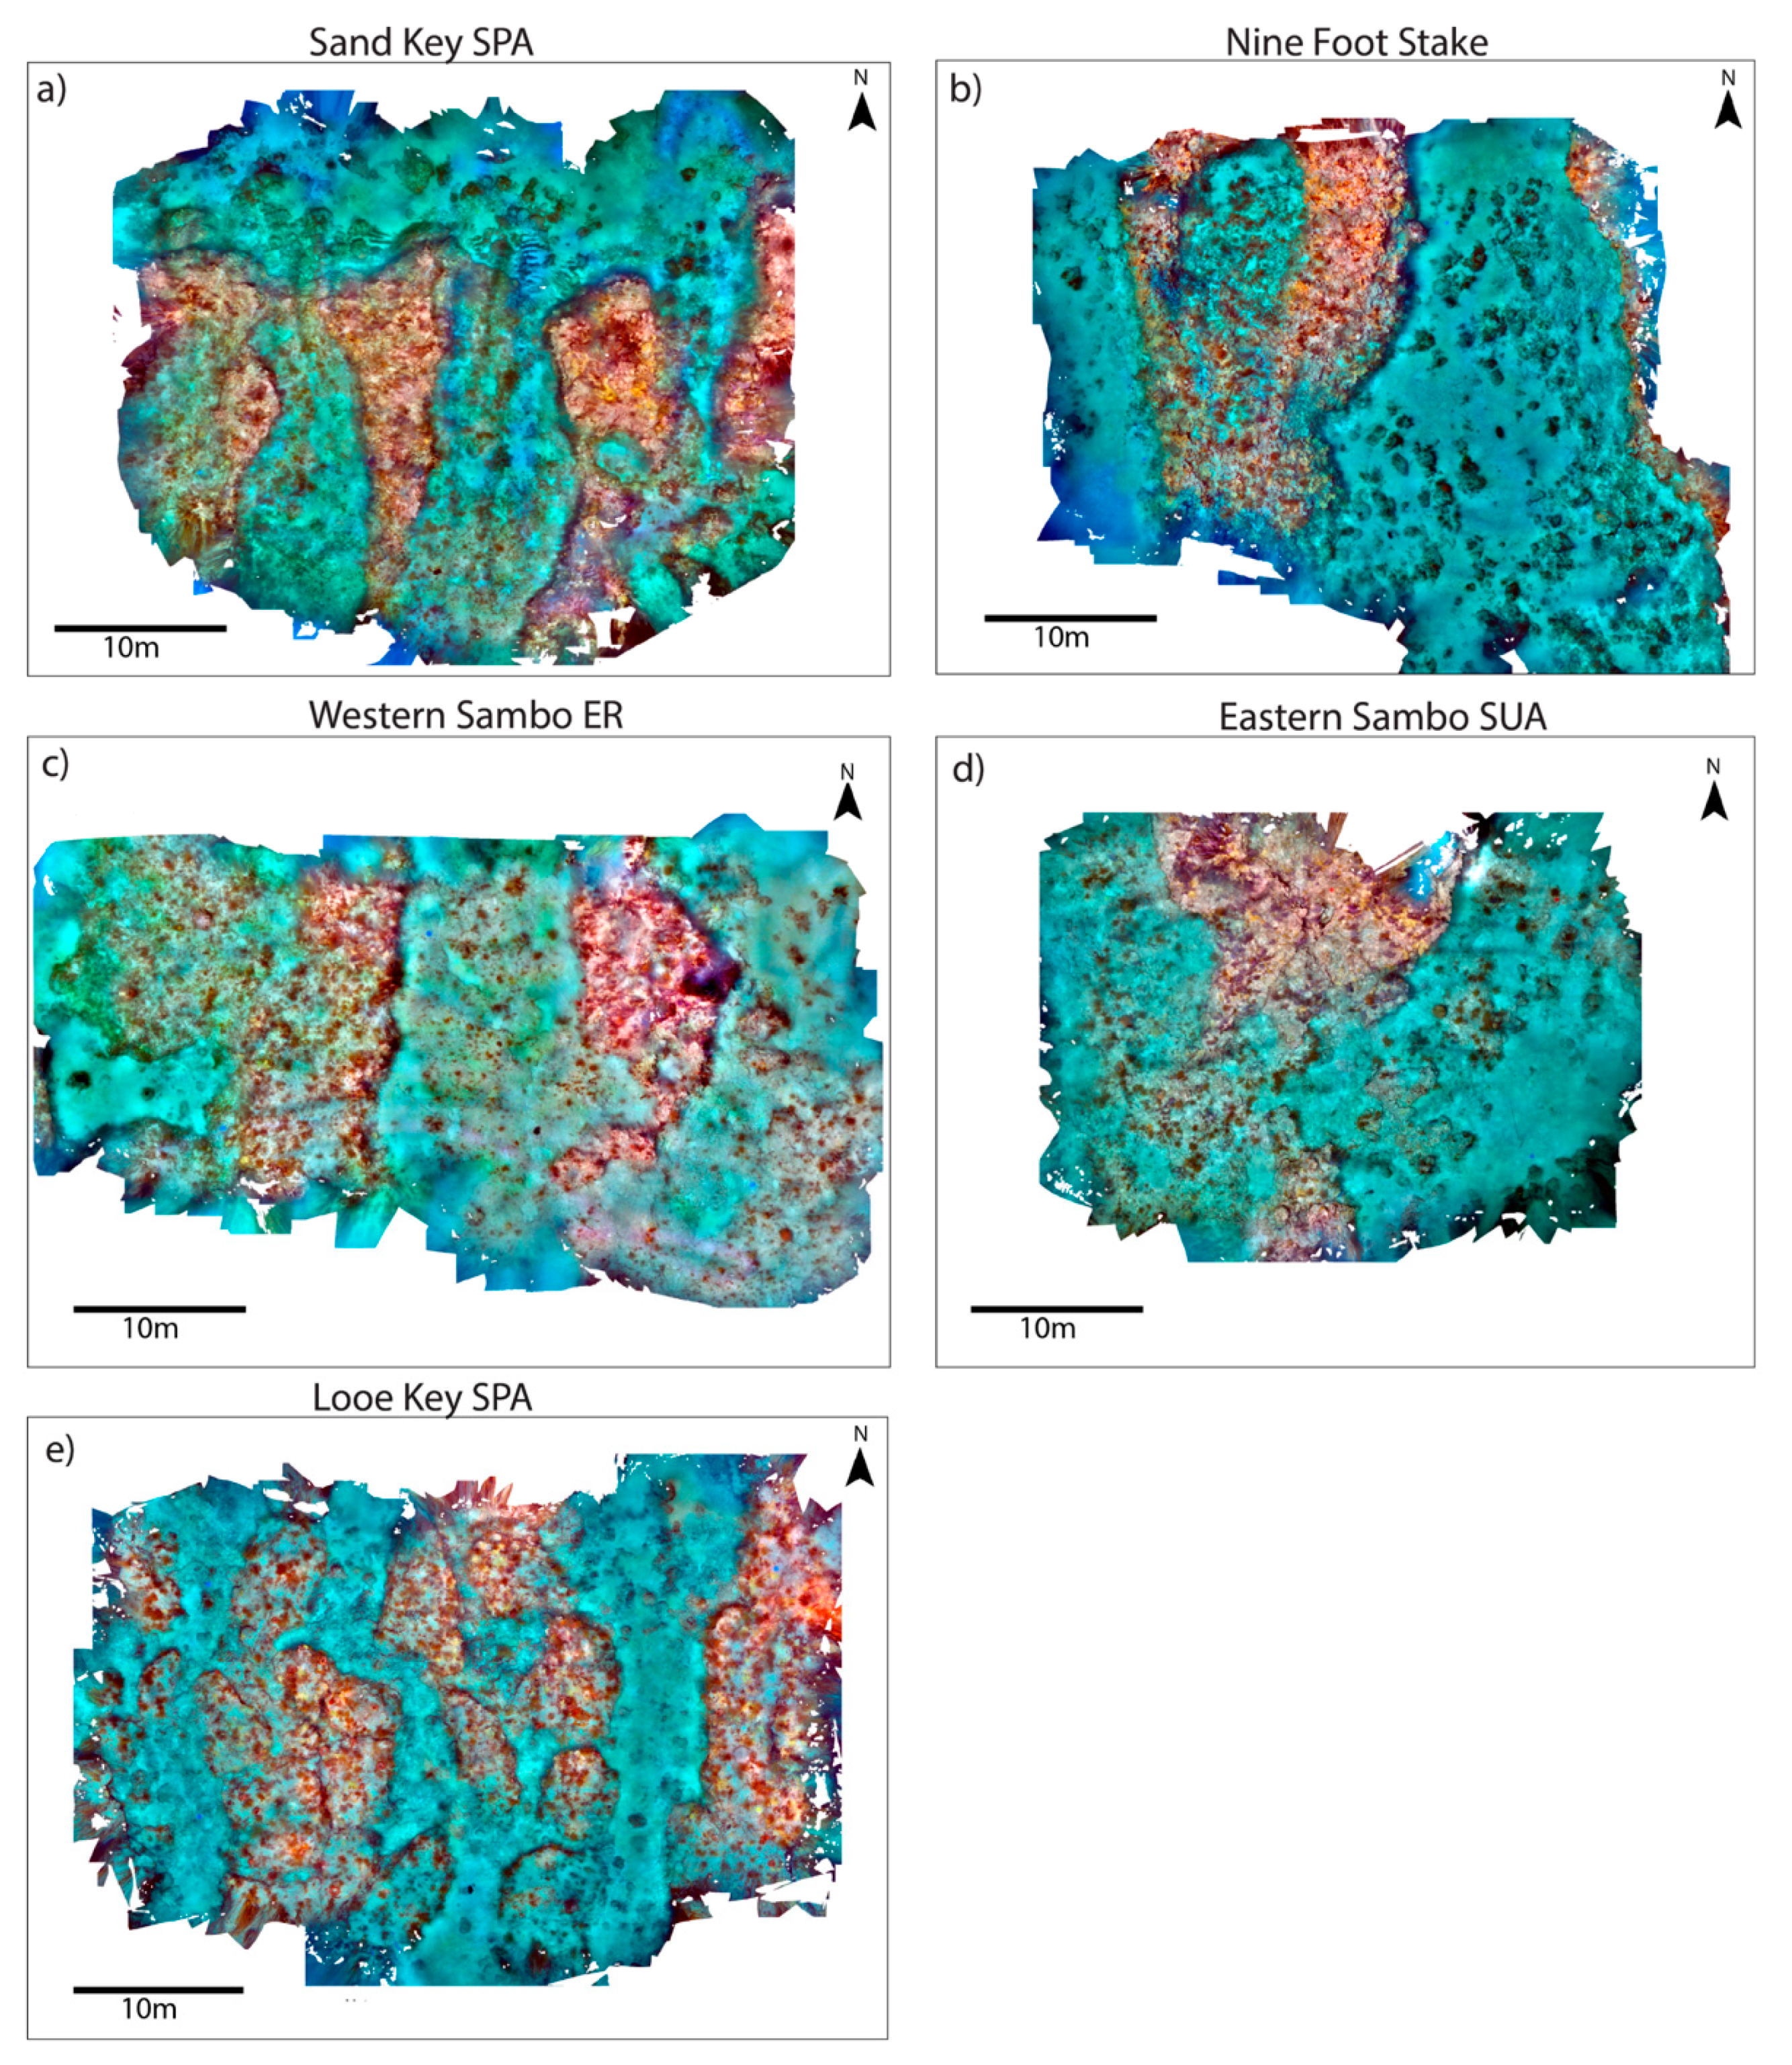
2.3. SfM Image Acquistion

Two divers used transect tape to create a rectangular 30 m × 15 m area covering the spur-and-groove reef formation. This grid was positioned to span the area where the RVC surveys (15 m diameter cylinders) were randomly sited by the divers. Ground control points were set along the transect tape at 15 m increments and six weighted, polyvinyl disks (Frisbees) were deployed as ground control points (GCPs) for each corner and long-axis mid-points. Four to five PVC-pipes shaped as a “T” (1 m length) were placed randomly on the seabed as a known reference distance to further constrain the scale of the model. Next, a diver swam back and forth in a grid pattern, with transects oriented perpendicular to the spur-and-groove structure and separated by ~2–3 m. A PVC-pipe frame housed three GoPro Hero3/Hero4 cameras operating at an aperture of f2.8, shutter speed 1/120 s, ISO 120-157-, and 12-megapixels capturing images on Time Lapse Intervals of two seconds to ensure adequate image overlapping for post-processing. The number of images per site ranged from ~6000–12,000, and each mapping survey was completed over a period of a few hours to minimize variability in visibility and lighting.

2.4. D Habitat Reconstruction Workflow

Agisoft Metashape (v 1.5.2.7838) software was used to reconstruct three-dimensional models from the digital photographs (Figure 2; Table 3). We adopted data workflows from related studies such as Burns et al. [74] and Fukunaga et al. [43,75] (Table S1) to create coral reef photogrammetry models. Initial image alignment settings used a key point limit and tie point limit of 40,000 and 10,000, respectively with the level of accuracy set as ‘high’ and generic preselection enabled. If the initial alignment was unsuccessful, then alignment settings were modified to a key point limit and tie point limit of 70,000 and 8000, respectively, in addition to re-aligning free floating points [75]. The model scale was constrained based on the GPC and pvc-T-stick markers. Dense (100′s millions of points) elevation point clouds were gridded using MB-System (Caress et al., 1995) to generate 0.5 cm × 0.5 cm-resolution digital elevation models (DEMs). These data were saved as GeoTIFF files with both local and UTM coordinates. The area and dimensions of the 3D models vary between sites based on image quality and spatial coverage obtained by the divers. Imagery from Western Dry Rocks and Looe Key SUAs were not successful in the image alignment process due to poor water quality, poor camera adjustments, and/or lack of sufficient overlapping images.

2.5. Quantifying Habitat Complexity Metrics

The DEMs were imported into ArcGIS Pro (Figure 3) to quantify habitat complexity metrics using the 3D Analyst and Spatial Analyst and Benthic Terrain Modeler (BTM) v3.0, which generated habitat metrics such as neighborhood depth, slope, vector ruggedness measure (VRM), and surface area-to-planar area ratio [76] (See Table 4). To calculate the VRM, a unit vector normal to each grid cell is resolved into its x-y-z components. The normalized resultant vector (R) is then calculated within a 3 m × 3 m neighborhood using a moving window centered on each grid cell. The VRM is defined as 1-R, where the value of 0 indicates a planar surface and 1 indicates a surface maximum roughness [77,78]. The surface area to planar area (SAPA) ratio, or rugosity, was also calculated using 3 × 3 neighborhood windows. Eight triangular surfaces were created by linking the center point of the central grid cell with the adjoining cells. The summed area of these surfaces was normalized by the planar surface area [79].
To quantify variability in digital terrain metrics within each site, these raster layers were sampled along a series of transects, and average metric values were reported for each profile. These transects extended 30 m orthogonal to the spur-and-groove structures (oriented approximately west-to-east) with 3 m spacing in between lines, resulting between 6 and 7 profiles per site (Figure S1). The maximum relief and rms roughness were also calculated from these same depth profiles [80,81]. Coral reef rugosity was digitally calculated measuring the ratio of the digital contour line along the three-dimensional surface and the straight horizontal distance.

2.6. Characterizing Coral Assemblages

To further characterize benthic cover and coral assemblages, orthomosaics from the SfM data were exported at 1 mm2 resolution and then tiled into 3 m × 3 m images for labeling (Table 4). Classification of coral morphologies were based on colony size and growth trait from related studies [82,83,84,85] as follows: (A) submassive boulder (e.g., Siderastrea spp., M. cavernosa, Orbicella spp.); (B) encrusting dome (e.g., Porites astreoides, C. natans, D. labrinthiformis, Pseudodiploria clivosa); (C) branching (e.g., Acropora spp., Porites spp.); (D) encrusting zoanthid (Palythoa caribaeorum); and (E) sponges (e.g., Callyspongia plicifera, Xestospongia muta). Reef rubble generally occurred within sandy grooves of the spur-and-groove systems and were mapped using ROI polygons. Soft corals such as sea fans, sea plumes and other octocorals were often moving in response to underwater currents, and therefore were too distorted to accurately assign pixel labels. Thus, soft corals were labeled as Rectangle ROIs.

2.7. Statistical Analyses RVC Data

Potential differences in mean habitat characteristics among sites for each grouped sampling period (e.g., before vs after Irma) were tested using multivariate analyses of variance (MANOVA) models. When necessary, arcsine-square root transformation was applied to the RVC data percent cover estimates to meet assumptions of normality and homogeneity of variances prior to analysis. Canonical discriminate analysis (CDA) was used to observe variation in the benthic community composition among sites using the linear combination of each habitat variable. The coefficients of the linear combinations were plotted as eigenvectors in a two-dimensional space corresponding to the ratio of the between-group variance and within-group variance for each variable combination to show the largest separation between site group means. The direction and length of each eigenvector identifies which combination of habitat variables contribute significantly to the separation of site group means. Post-hoc tests included one-way analysis of variance (ANOVA) models and pairwise multiple comparisons tests (95% confidence level).

2.8. Statistical Analyses of Orthoimage Analysis and Mapping

The summed area of each habitat class (trait-based coral groups, sponge, rubble, etc.) within each tile was normalized by the tile area (9 m2) to calculate percent cover. Potential differences in mean habitat characteristics among sites that were mapped post-Irma were tested with MANOVA models. Post-hoc tests included one-way analysis of variance (ANOVA) models and pairwise multiple comparisons tests (95% confidence level).

3. Results

In general, protected reefs sites had higher mean live coral cover than fished sites yet differed in dominant corals contributing to their overall structural complexity. In contrast, fished sites were more characterized by physical structures related to hardbottom habitat (e.g., vertical relief, percent rubble, rugosity). Despite the hurricane impacts, RVC surveys did not show a drastic change in site characteristics and consistently described sample sites as contiguous spur-and-groove or a matrix of patchy hardbottom structures with reef rubble. Depth and surface hard relief were the most robust habitat metrics across pre- versus post-Hurricane sample periods. The subset of sites surveyed using SfM photogrammetry provided evidence for more site-specific variation in habitat characteristics related to coral composition, local abiotic footprint, and small-scale variations in benthic features.

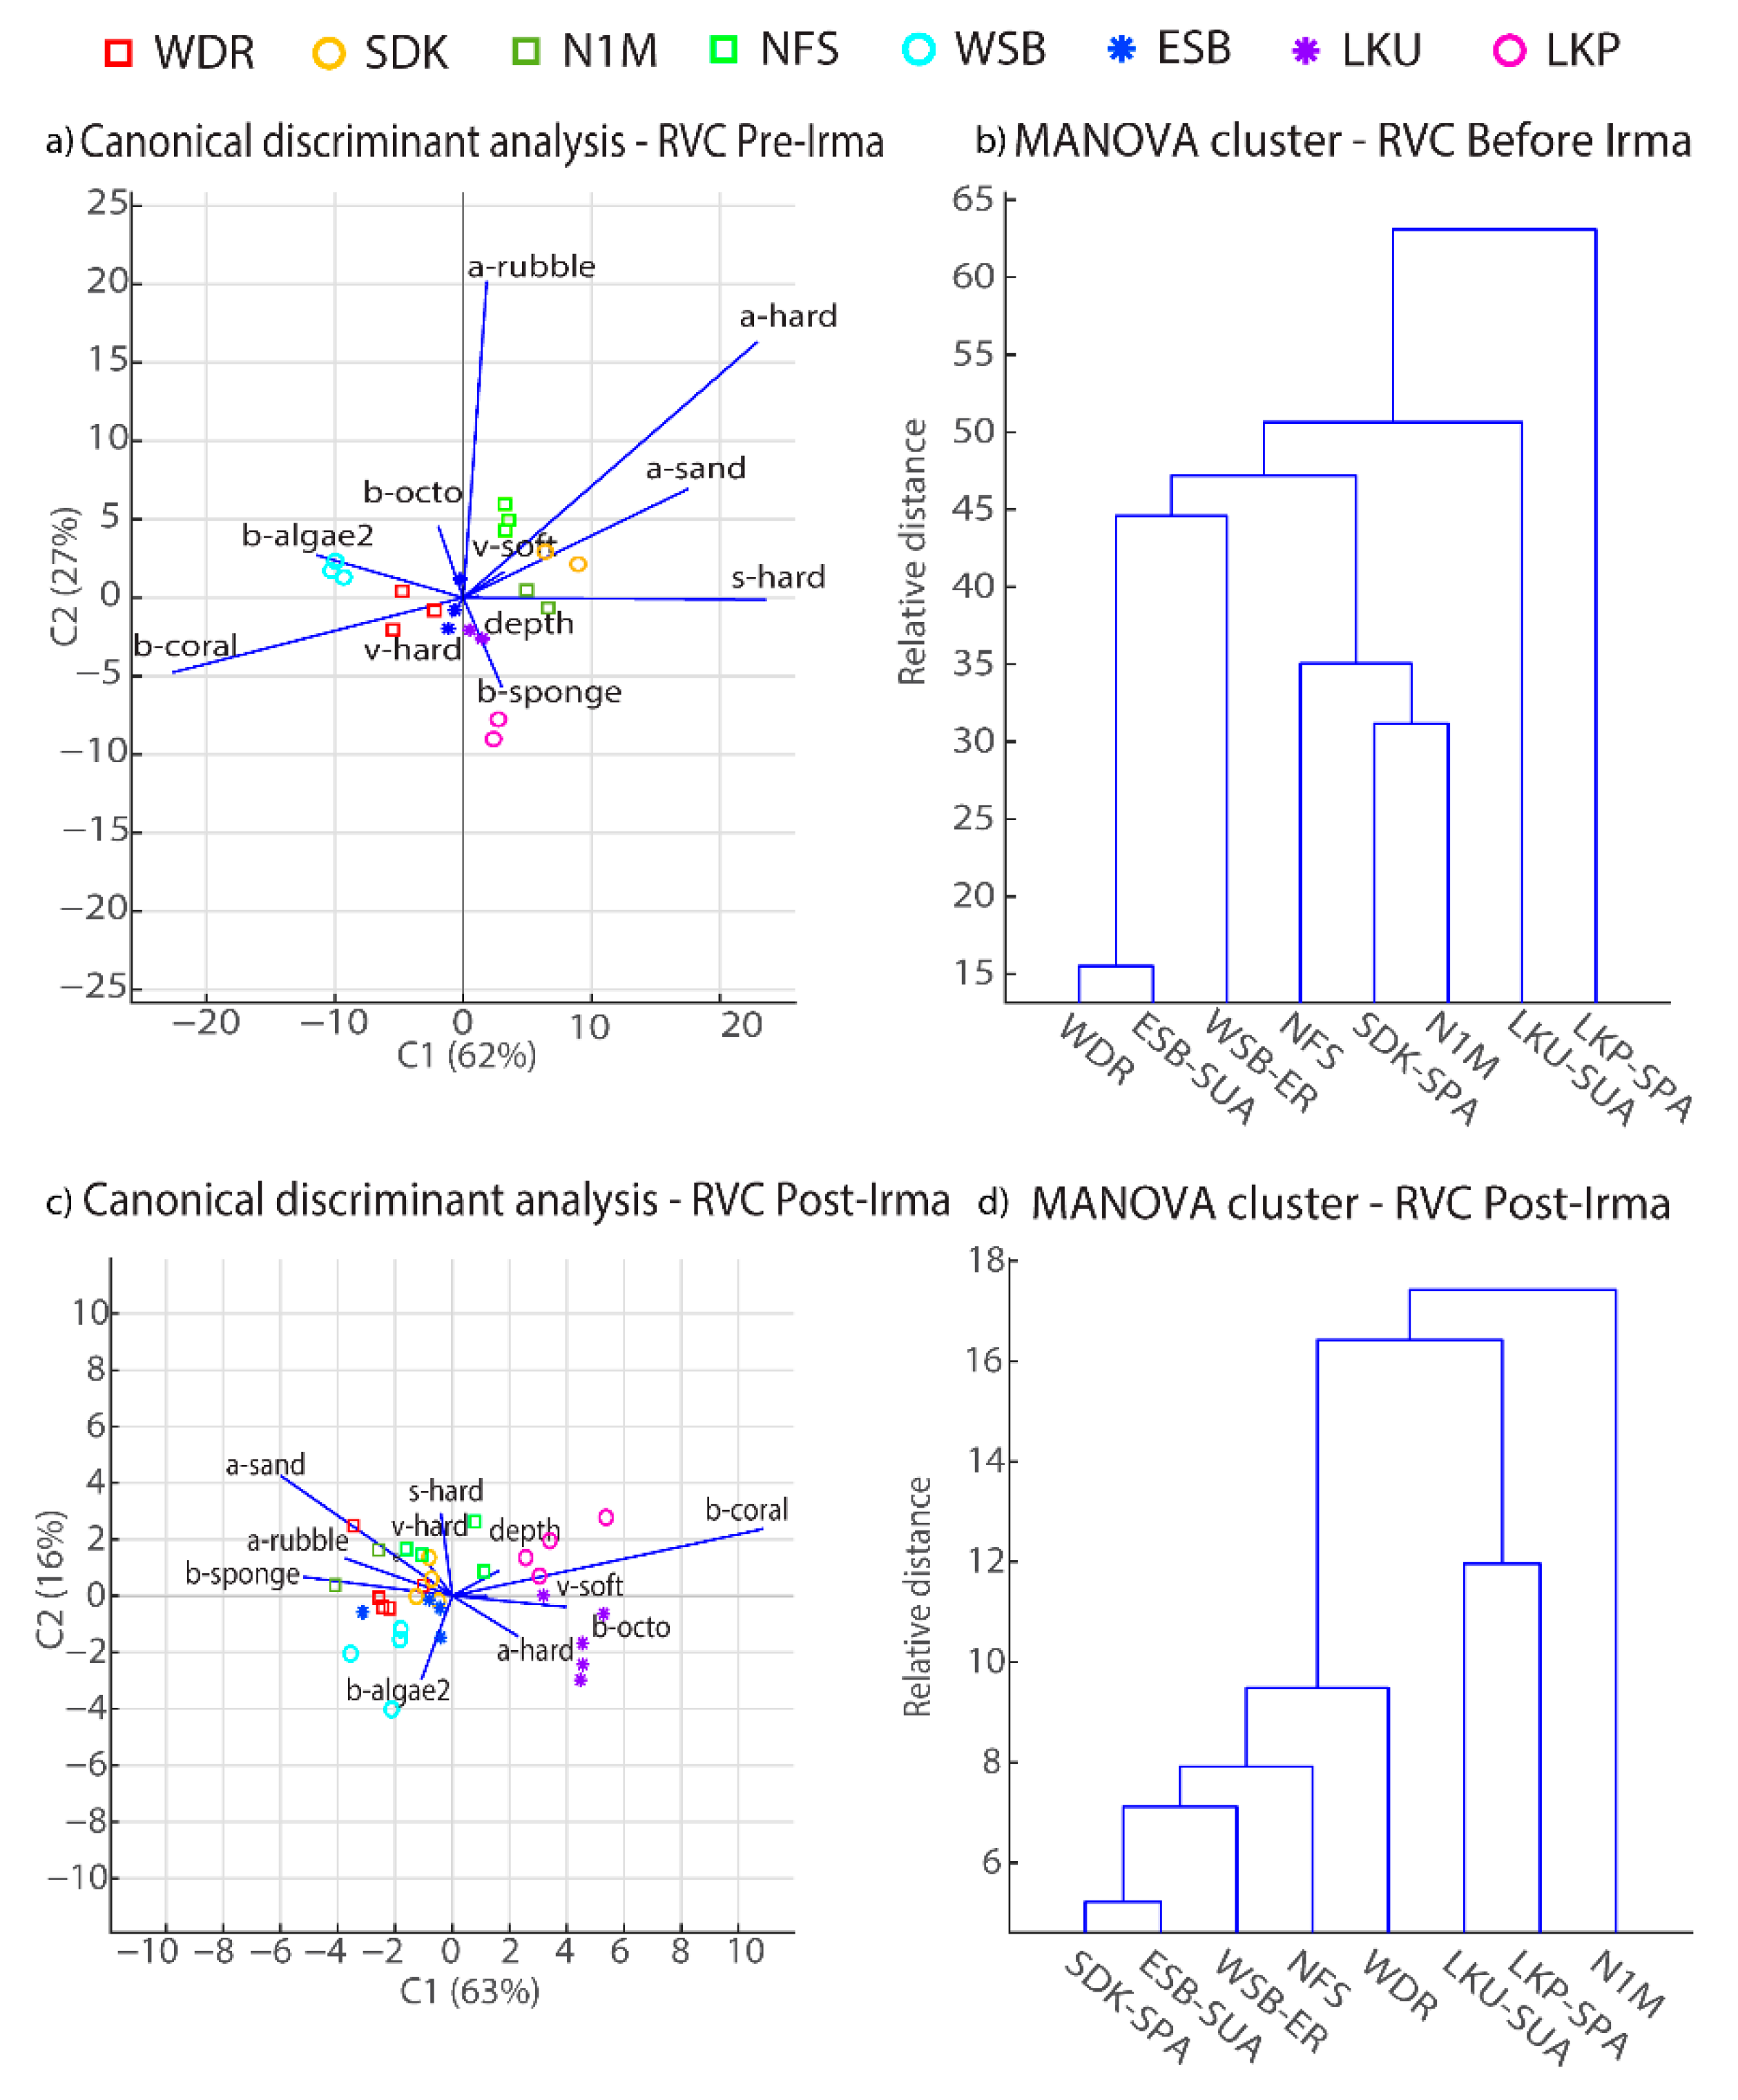
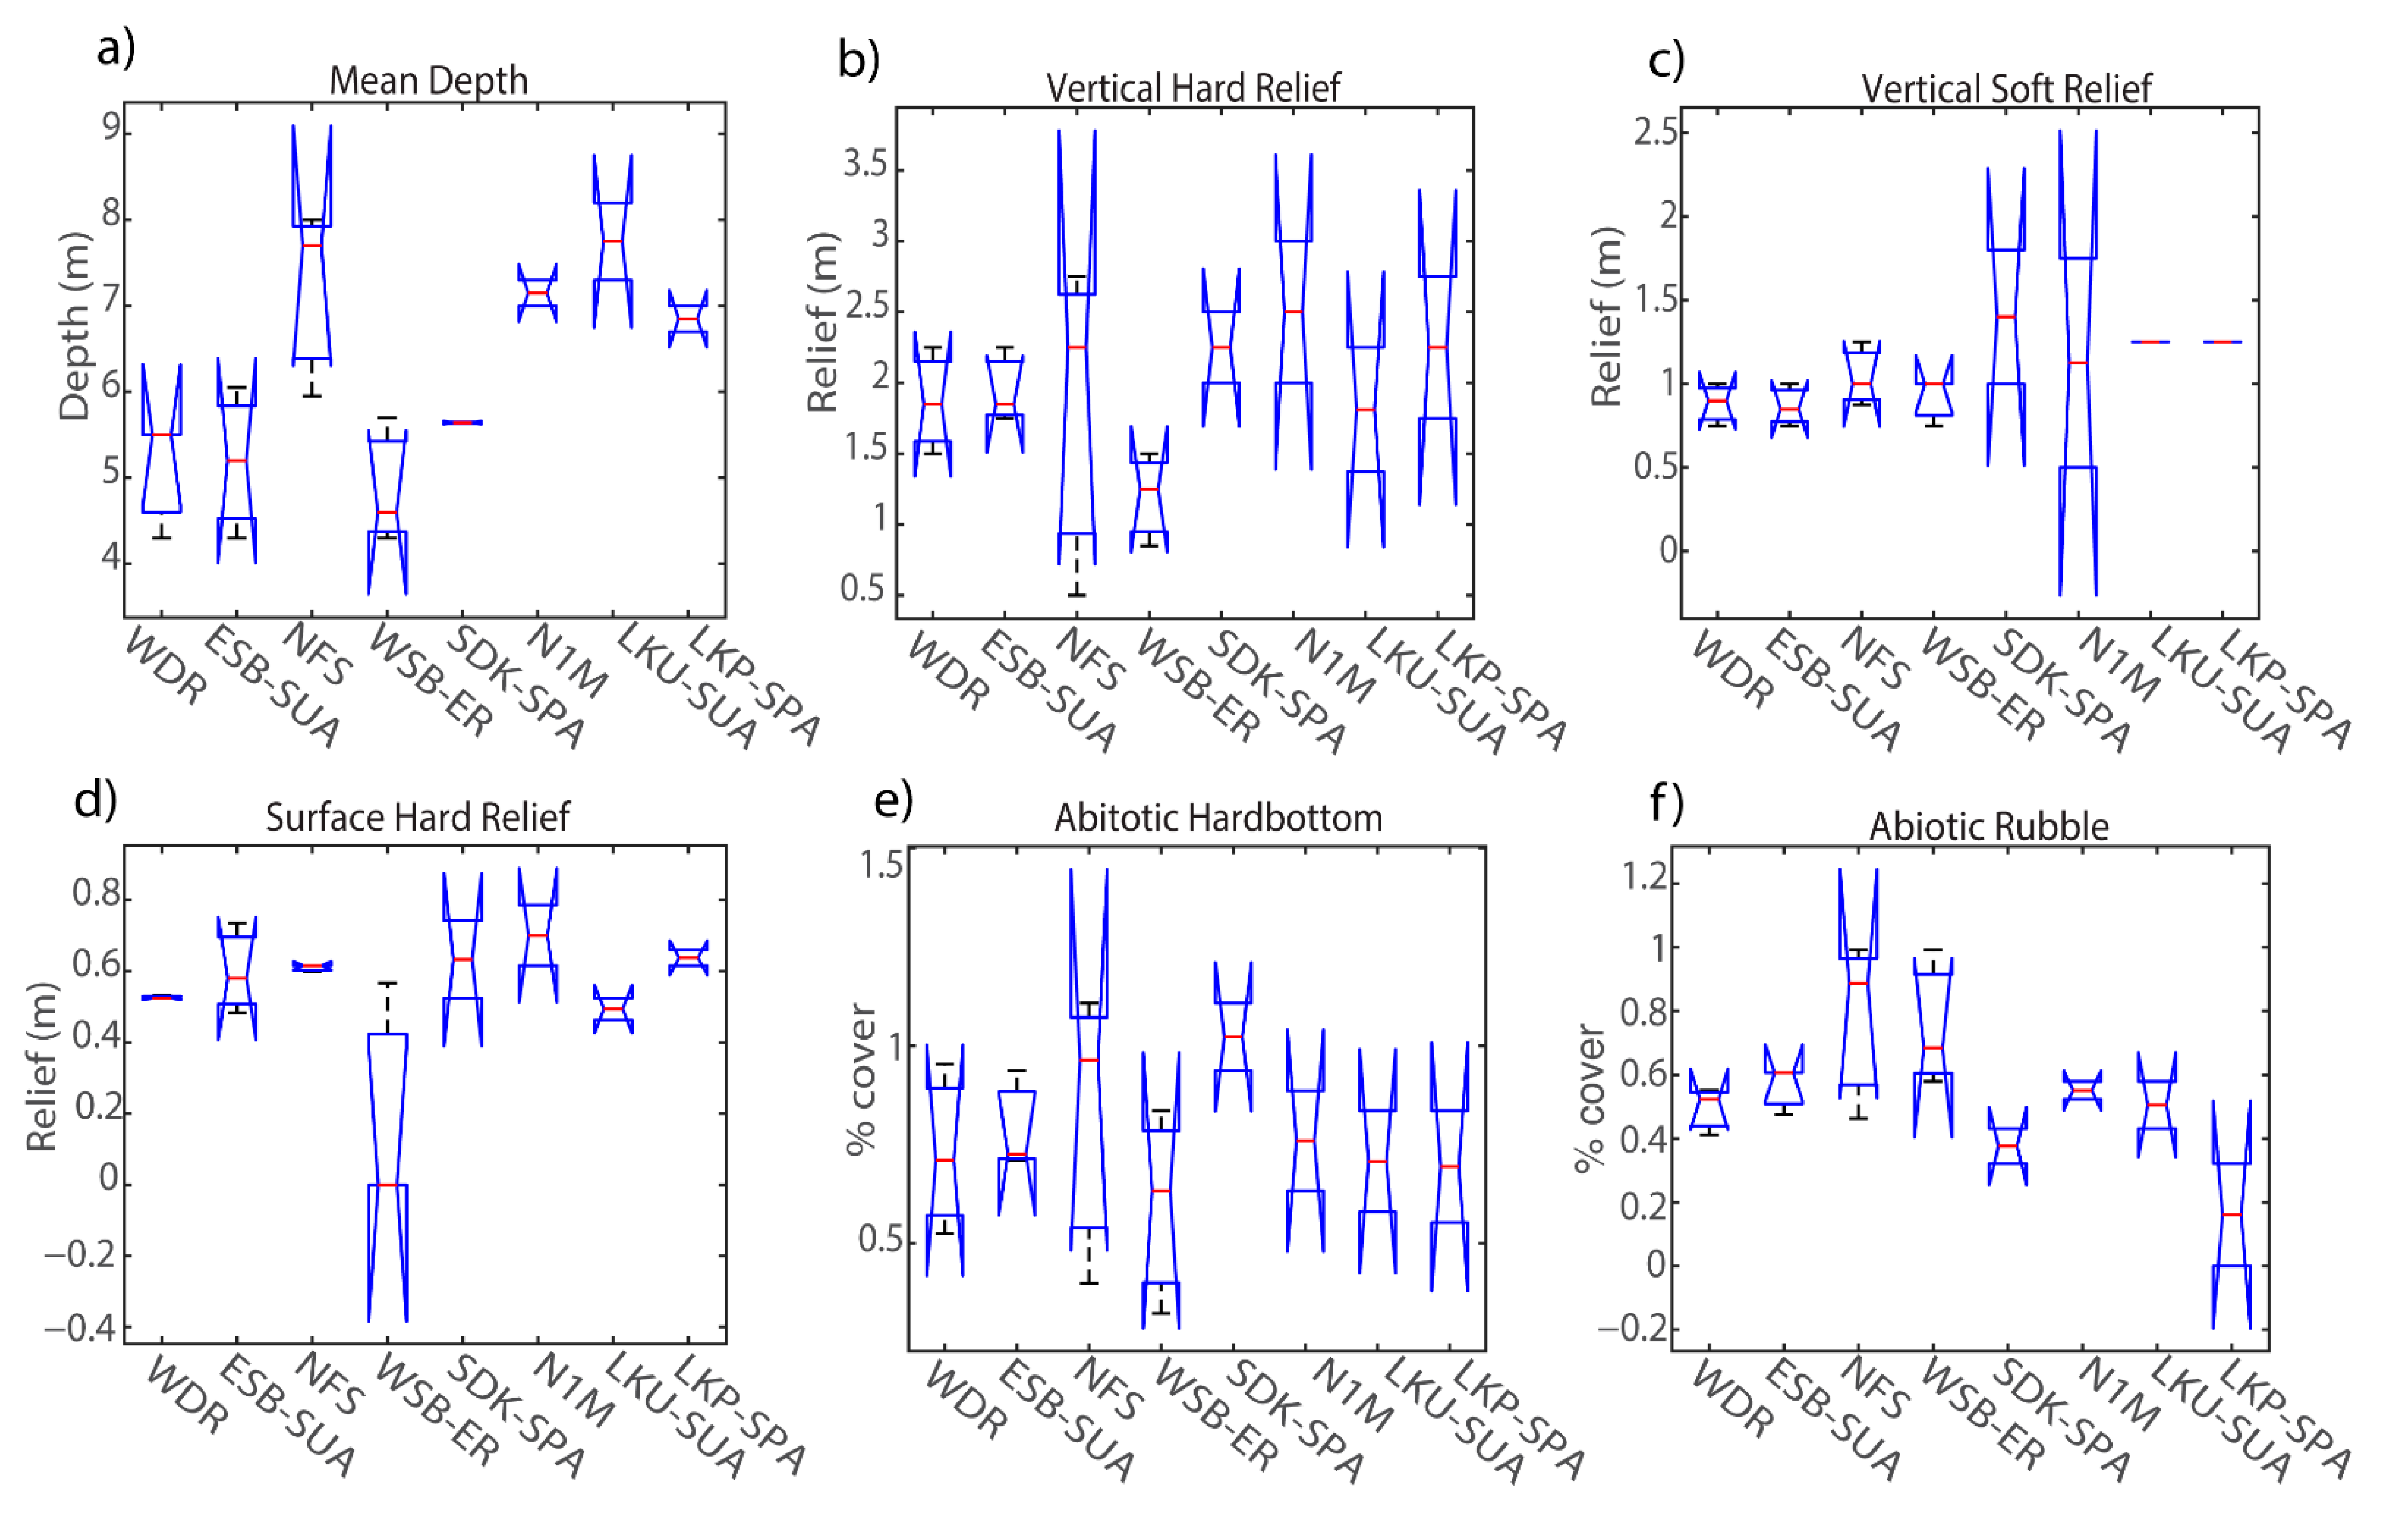
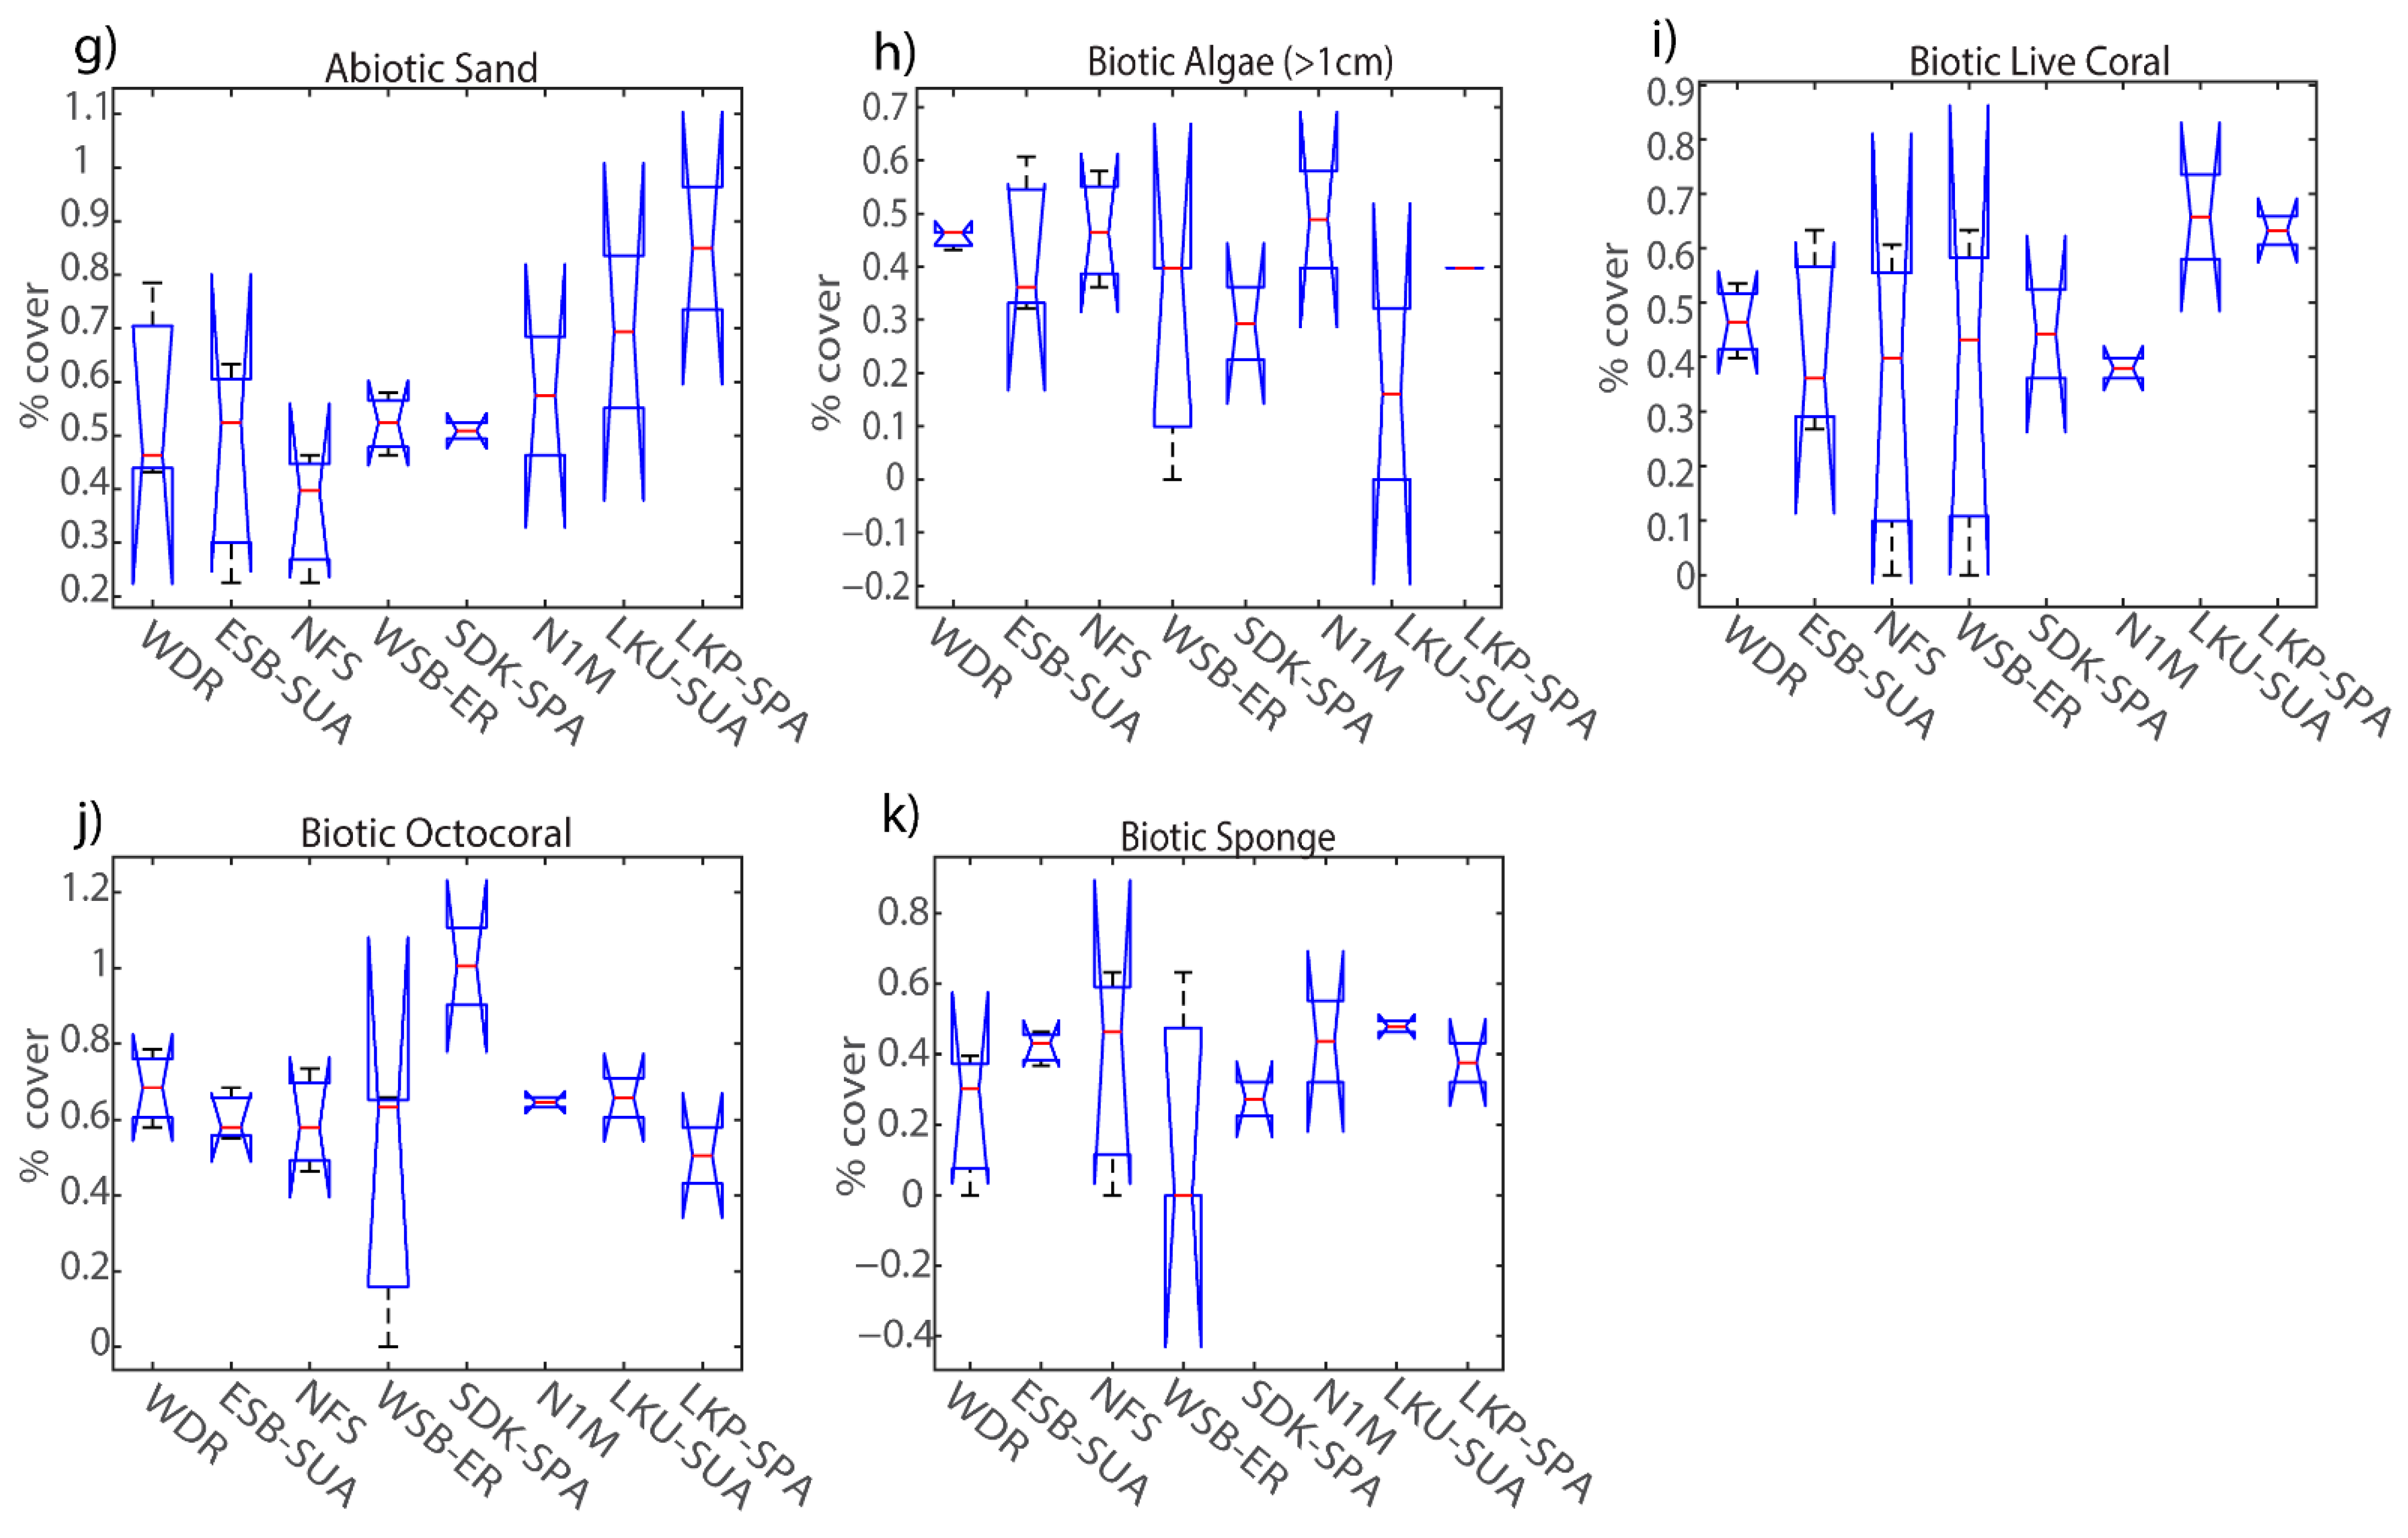
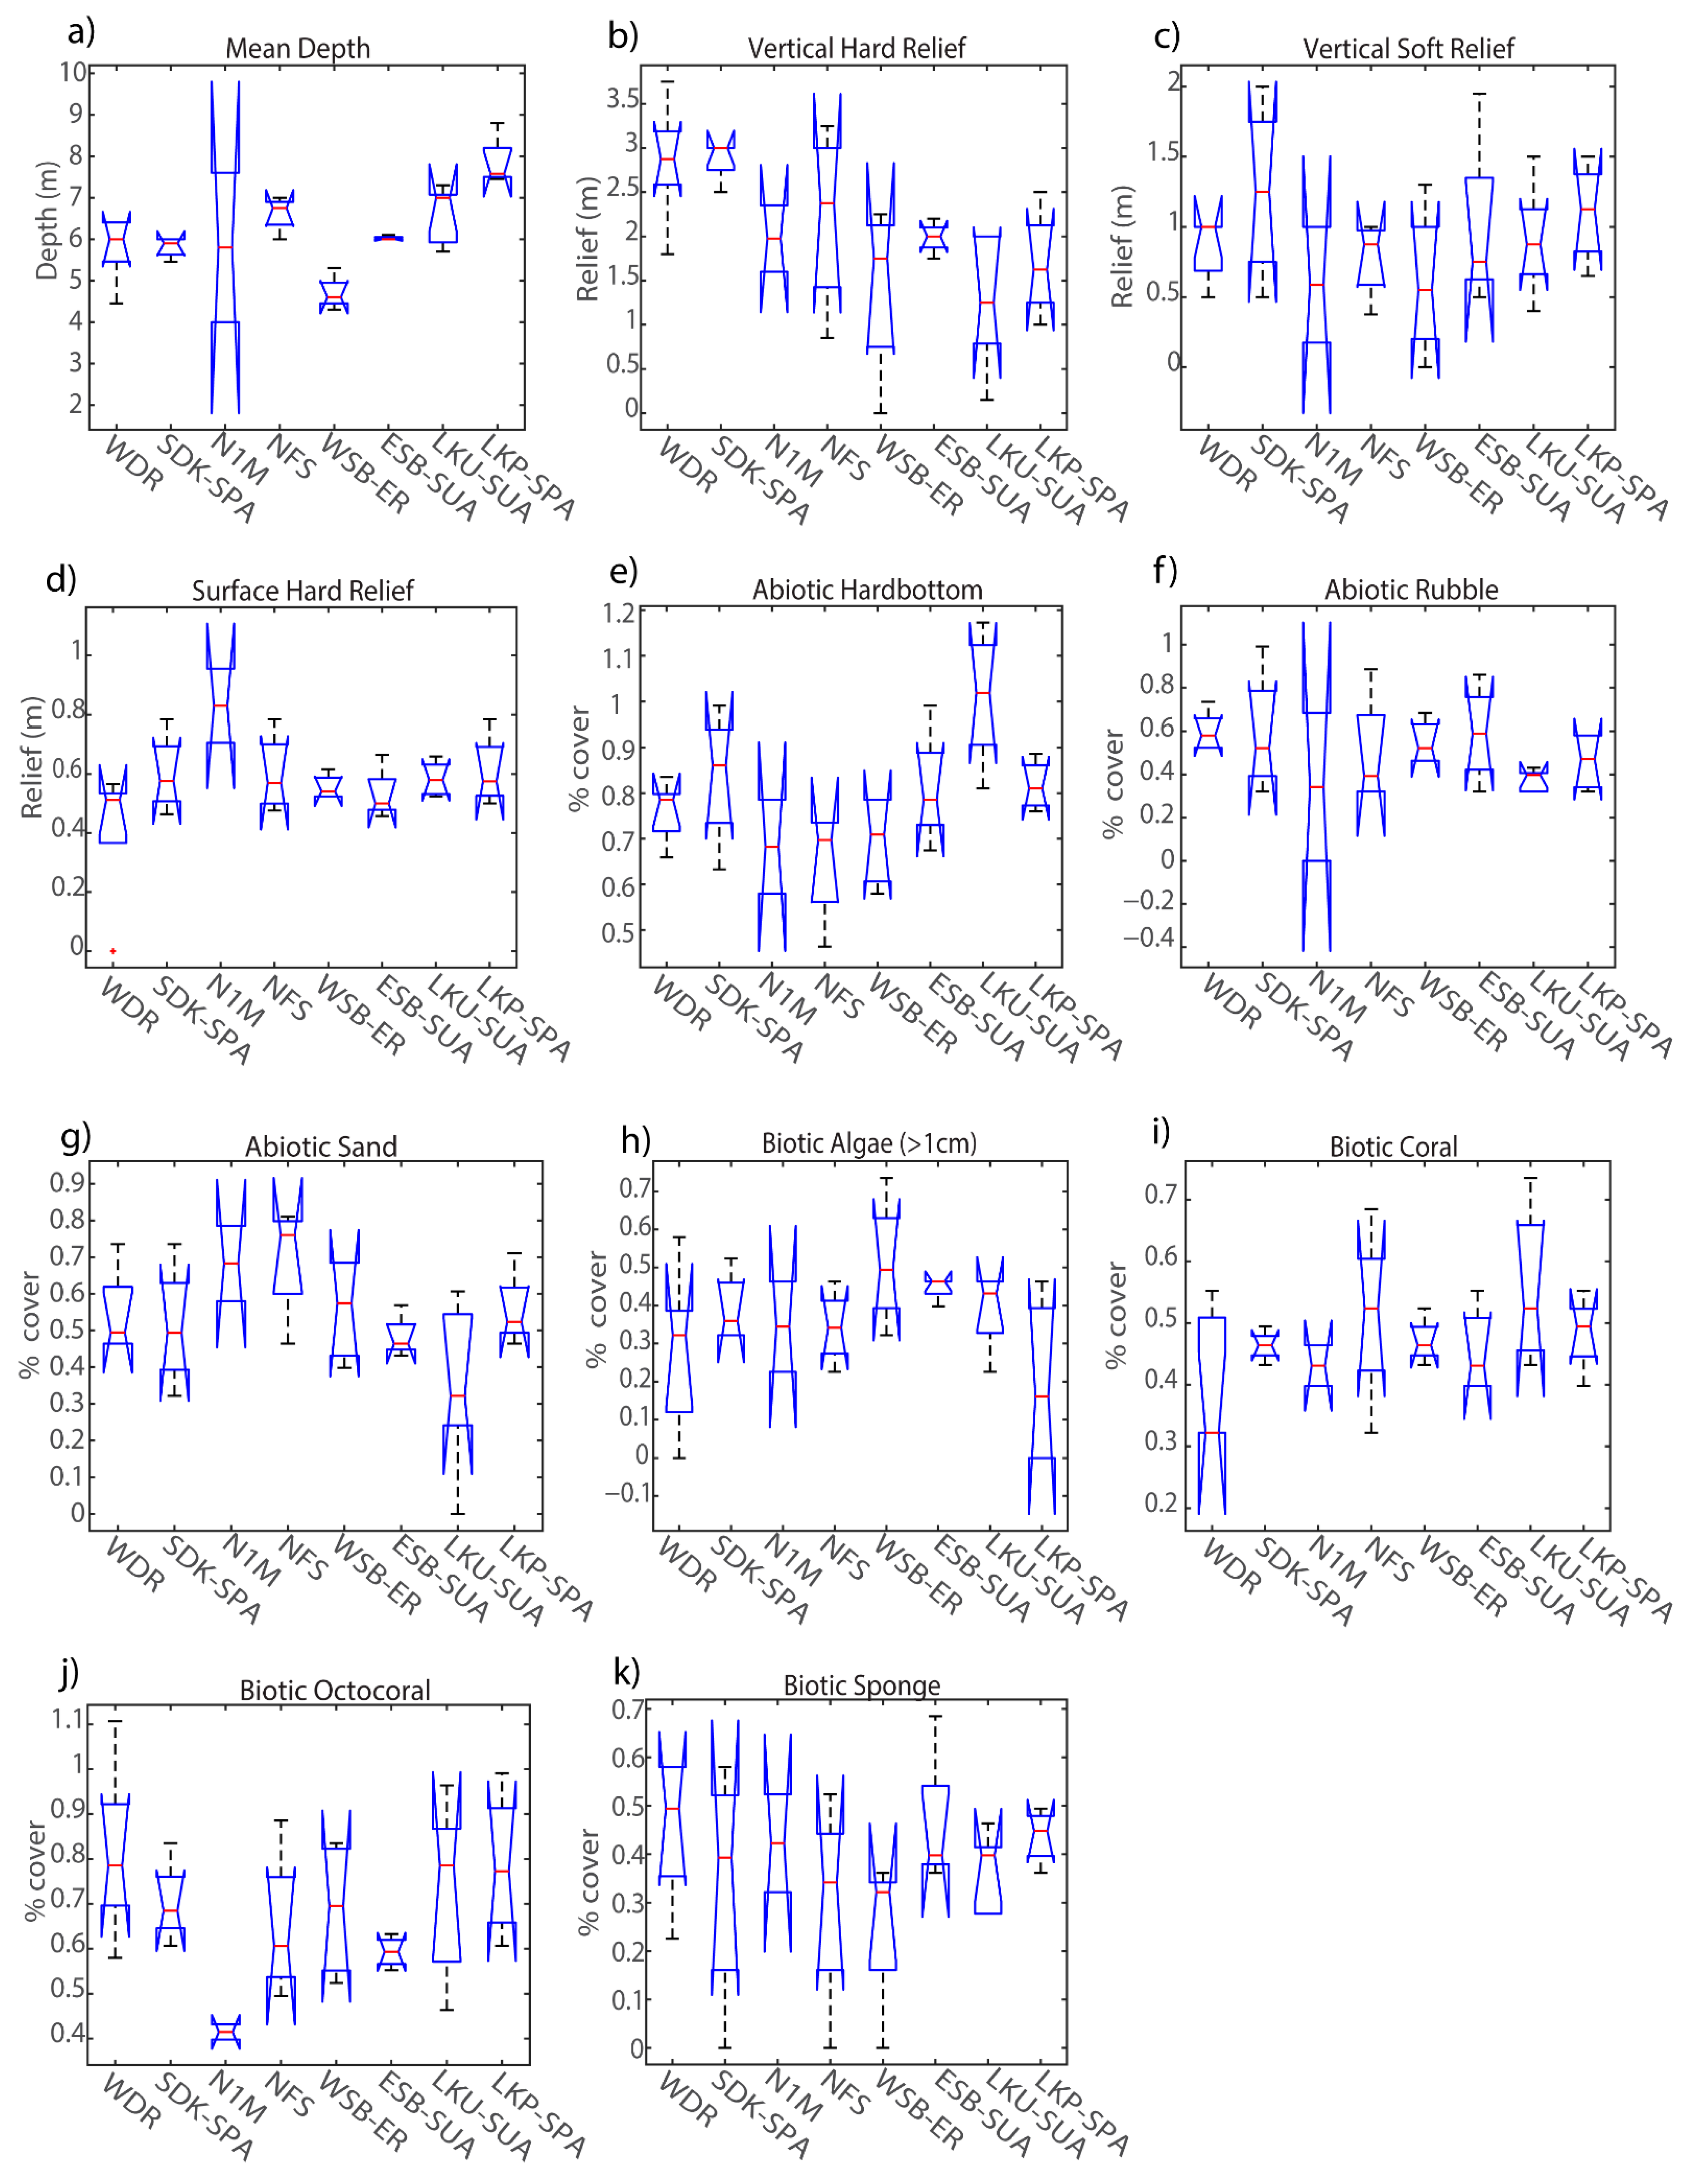
3.1. RVC Survey Results

Visual surveys identified small variations in the balance between live coral and other biotic habitat characteristics among sites, as well as abiotic physical features such as depth and surface hard relief across both pre- versus post-Irma. Before hurricane Irma, site separation was driven by structural features such as a-rubble, a-hard, and s-hard and the presence of live coral cover, b-coral. Sites characterized by physical seabed features with low presence in coral cover were grouped together along the first canonical axis such as sample sites SDK, N1M, and NFS (Figure 4a), whereas sites with high percentages in biotic cover (b-coral, b-sponge) such as WSB, LKP, and LKU generally resulted in more distinct separations among sites (Figure 4b). ANOVA post-hoc analysis identified significant differences in depth (p < 0.01), surface hard relief (p = 0.05) and rubble (p = 0.03) (Table 5). Spur-and-groove sites NFS and LKP were similar in depth (>7 m); however, there was a significant difference in percent rubble (p = 0.02) as LKP had the lowest percentage of rubble cover at 16% (Figure 5a). Live coral cover was not a significant driver in site characterization due to high variations in percent cover across the seabed for all sites. However, live coral cover did have a moderate influence in site characterization by scoring sites with higher percentages in coral cover lower in the second canonical axis. For example, LKP and LKU did not cluster with other sites (Figure 4b) and had the highest median percent coral cover at 63% and 66% respectively (Figure 5i). Given the recent sharp declines in percent coral cover within the FKNMS noted above [56,57,58], it is important to note that the percentage results in this case are specific to the area (15 m2) surveyed and the RVC method in which each percentage in a given habitat category has to add to 100%. WSB also did not closely cluster with other sites due to the combination of a relatively low median depth of 4.6 m and an overall low percent cover in surface hard relief (Figure 5d).
Habitat separations among sites were diminished after the hurricane; however, there was more separation in site characterization between protected and fished sites post-Irma than pre-Irma. Discriminant analysis identified b-coral and a-sand as strong variables in distinguishing among sites (Figure 4c) and displayed a small inverse response between sites strongly characterized by biotic cover of corals, macroalgae, or sponges such as protected sites in contrast to fished sites with generally higher percentages of bare sand channels and rubble (Figure 6). Deeper sites with physical traits that contribute to spur-and-groove structures (e.g., a-sand, v-hard, b-coral) were scored more positively on the second canonical axis than the first axis, while shallow sites characterized by other non-coral biotic variables, such as the presence of octocorals or macroalgae, generally separated in the opposite direction (Figure 4c). MANOVA clustering grouped protected sites SDK, ESB and WSB together and did not closely group any fished sites together (Figure 4d). Post-hoc ANOVA results identified significant differences in depth (p < 0.01), vertical hard relief (p = 0.02), and abiotic hardbottom (p < 0.01) (Table 5). Multiple comparison tests resulted in three groups where LKP’s (median depth = 7.6 m) group means were significantly different from all sites whose median depths were below 6.5 m, except N1M (p = 0.07). The next group distinguished WSB as the shallowest site (median depth = 4.6 m) and was significantly different than sites where the shallowest depth did not exceed 5 m (Figure 6a). Variation in percent cover for each biotic variable increased post-Irma at all sites and resulted in no significant differences among sites. Macroalgae percent cover revealed major changes at both Looe Key sites via a ~30% decrease in macroalgae at LKP and ~30% increase at LKU, while all other survey sites relatively remained the same or showed minor decreases in percent macroalgae cover. Although live coral cover was not a significant habitat variable in site characterization, there were changes in live coral cover post-Irma at sites with higher percent cover than pre-Irma. For example, SDK, N1M, NFS, and ESB showed similar ranges in percent live coral cover post-Irma with NFS resulting in the highest percent cover at 52%. In contrast, WDR, WSB, LKP, and LKU recorded minor decreases of up to 10% in live coral cover post-Irma, and overall, there were no strong distinctions between level of protection and live coral cover. Octocoral percent cover showed either no change or small decreases at all sites post-Irma except for LKP and LKU, which both showed an ~20% increase. Minor changes in sponge percent cover post-Irma were present at all sites except for WSB, where percent cover increased from 0 to 35% post-Irma.

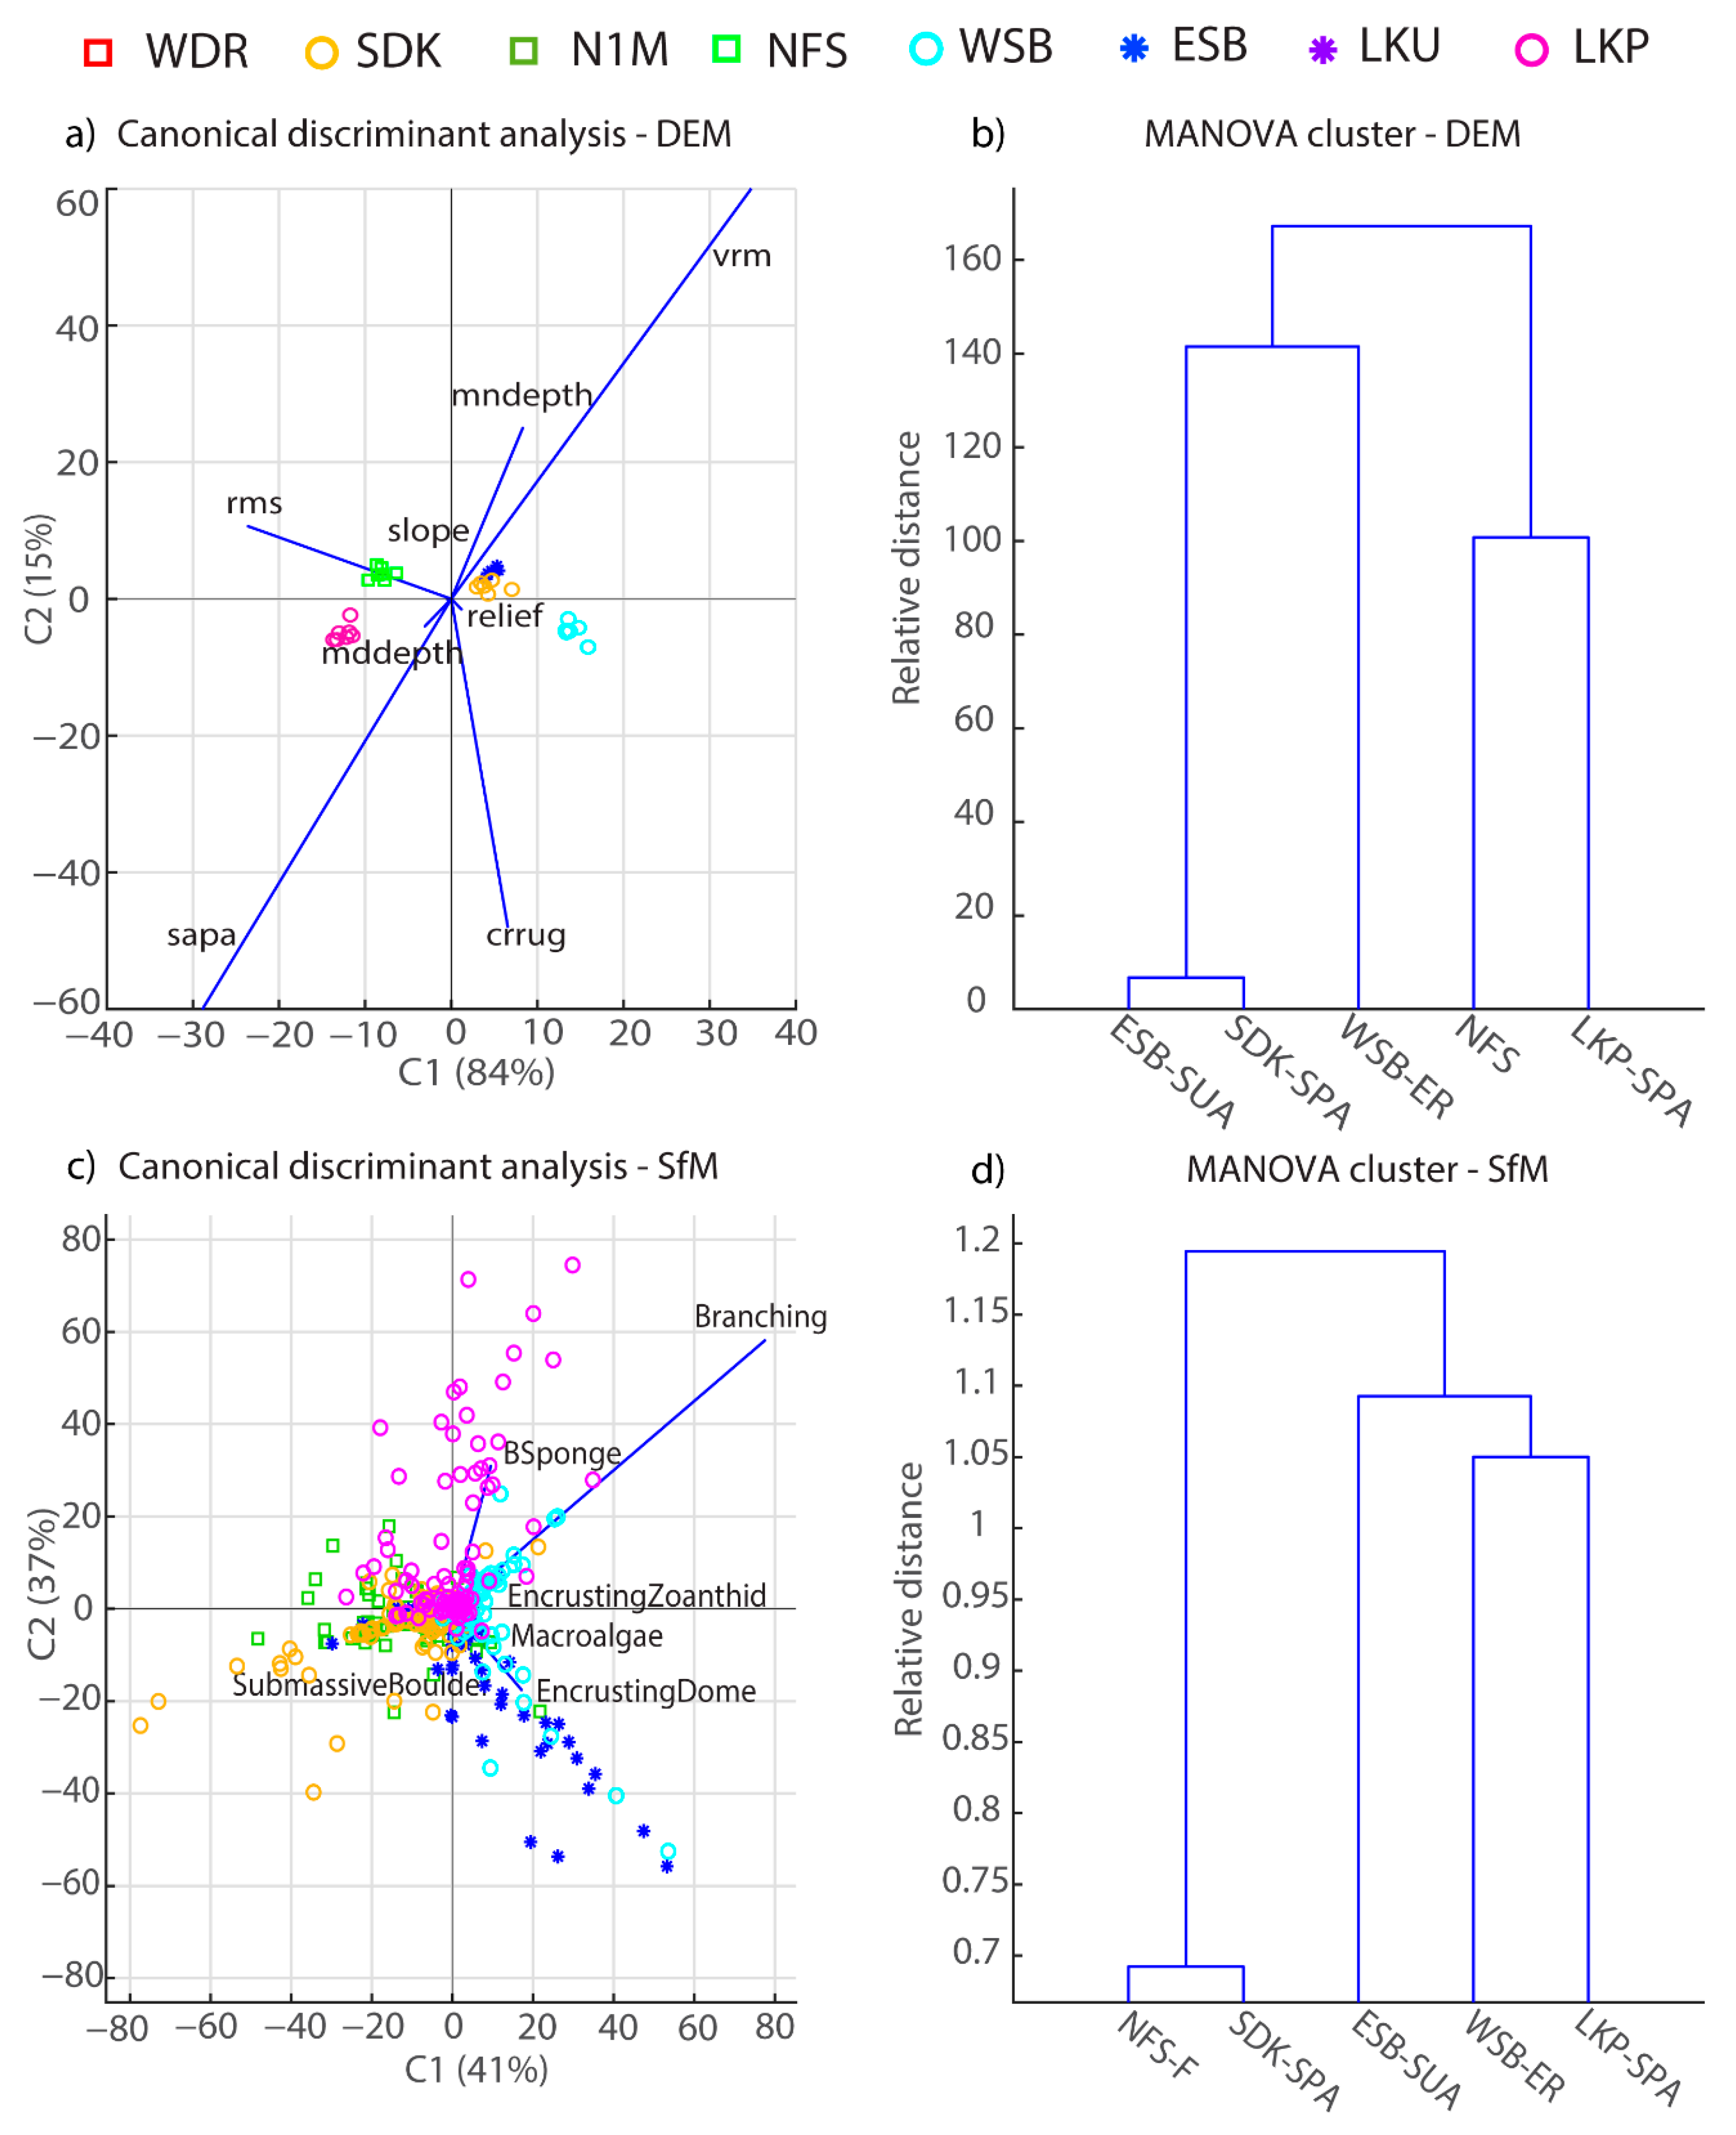
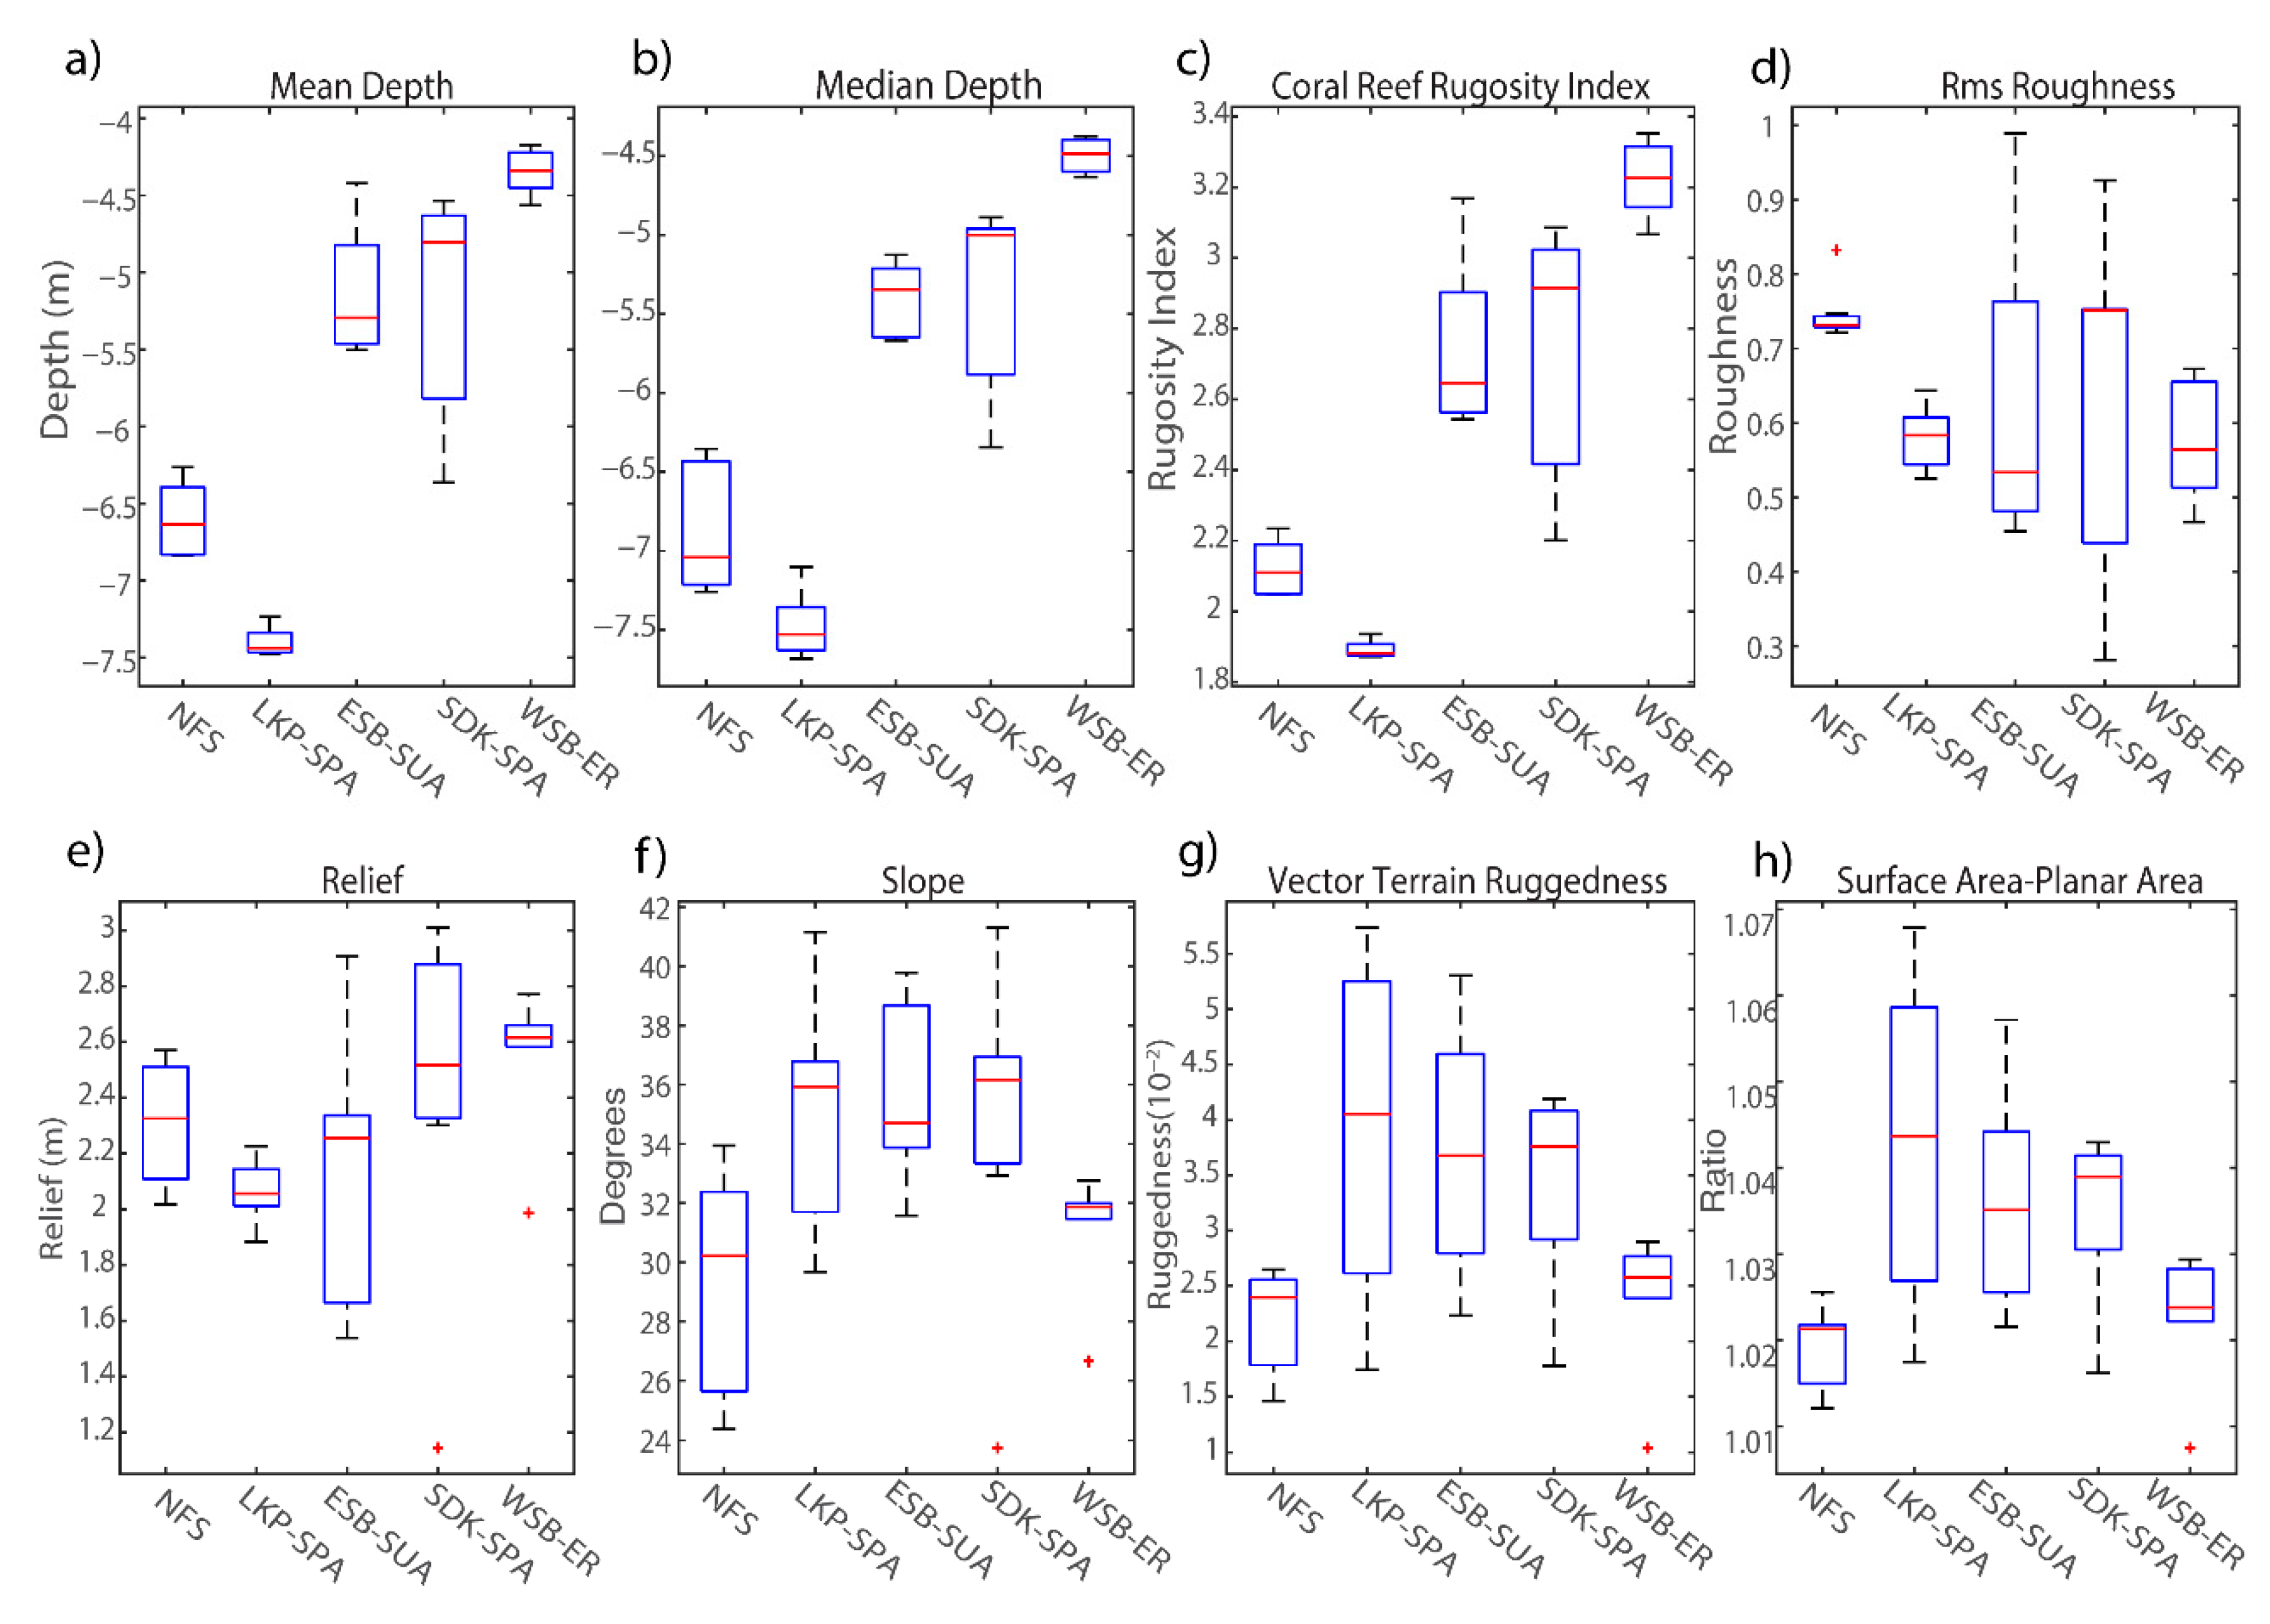
3.2. Digital Elevation Model (DEM) Topographic Results

The DEM metrics captured more fine-scale changes in habitat metrics than the RVC surveys and highlight the influence of within site variation in benthic topography driving the separations among sites. For example, the surface area to planar area ratio (sapa), which evaluates rugosity across neighboring cells within a site, was the most influential metric separating sites, followed by vector terrain ruggedness (vrm) (Figure 7a). RVC metrics related to physical structures (a-hard, depth, s-hard) generally clustered LKP and NFS as sites with relatively high structural complexity, and the DEM MANOVA results also clustered these two sites (Figure 7b) based on sapa and rms. The second canonical axis separated sites based on metrics related to coral cover such as crrug, in which coral-dominated sites were positioned on the lower axis (Figure 7b). WSB was the only site not grouped with other sites because of its low structural complexity and relatively high coral cover.
Post-hoc ANOVA results indicated all DEM habitat metrics being significantly different among sites except for rms roughness (p = 0.21) and relief (p = 0.22) (Table 6). WSB yielded the highest median coral reef rugosity index of 3.23 and was a relatively shallow site (~4.3 m in depth) with small variations in surface relief (2.5 m ± 0.18) (Figure 8e). In contrast, NFS and LKP were grouped together (Figure 7b) due to being relatively deep sites, 6.7 m and 7.3 m respectively, and showed more variation in relief than other sites due to their distinct spur-and-groove formations. MANOVA cluster analysis closely grouped ESB and SDK and showed a large separation from the other mapped sites. Additionally, ANOVA results found no significant difference in all tested DEM metrics between ESB and SDK. However, it is important to recognize the specific reef-area analyzed using depth-transect profiles for both sites were structurally different, such that SDK had several spur-and-groove formations included in the analysis (Figure 2a), whereas the area mapped at ESB mainly consisted of one large spur (Figure 2d).

3.3. Orthoimage Analysis Benthic Composition Results

Results from the orthomosaic image analysis provide insight into the biological reef surface characteristics contributing to the reef framework, including trade-offs between coral assemblages and other benthic organisms typically found colonizing hardbottom substrates. The density of octocorals was ~2/m2 for all sites and therefore was not included in the following site characterization analysis due to its low encounter rate in the mapping process. Canonical discriminant analysis and MANOVA clusters showed relatively small separations among sites, with the presence of branching corals being a strong driver in site characterization. The first canonical axis generally separated less biologically diverse sites (SDK, NFS) from sites presumably with high coral or sponge cover (LKP, ESB, WSB) (Figure 7c). Variation in presence or absence of habitat characteristics across each sampled tile within a site highlights relatively fine-scale differences in coral assemblages and associated benthos, such as encrusting zoanthids and sponges, leading to minimal relative distances in site separation (Figure 7d).
Further distinction between coral-dominated sites was dependent on the relative presence of encrusting zoanthids and abundance of both the trait-based corals shown by post hoc ANOVA results, where all fine-scale habitat metrics were significantly different (p < 0.01) for each mapped site (Table 7). For example, WSB had small patches of branching staghorn (A. cervicornis) and finger corals (Porites spp.) on the seabed surface, while LKP had several staghorn and elkhorn (A. palmata) coral outplants at various growth stages within the mapped area. Additionally, several brain corals (C. natans, P. clivosa, D. labyrinthiformis) were observed at LKP, yet had been impacted by coral disease diminishing the area characterized as live coral cover. Although all sites were dominated by encrusting zoanthids (P. caribaeorum), the relative percent cover was lowest at WSB (<3.7%) and was highest at NFS (<24%) followed by LKP (<20%) (Figure 9g). Percent cover of encrusting zoanthids at NFS was significantly higher at all sites except LKP (p = 0.54).
The relative percent cover of encrusting dome corals (C. natans, Pseudodiploria sp.) was highest at ESB (<6%) and significantly different from all sites (p < 0.01) (Table 7). Percent cover of sub-massive corals at ESB was significantly different than all sites except SDK (p = 0.99), as both sites showed outliers greater than 5% (Table 7 and Figure 9a respectively). ESB’s coral composition was dominated by mustard hill (P. astreoides) corals characterized as encrusting dome corals, and their spatial distribution varied from patches on reef rubble to relatively dense colonies on shallow ridges. ESB also had several large boulder star coral colonies characterized as sub-massive corals, such as the mountainous star coral (O. faveolata) and the massive starlet coral (S. siderea). The percent cover of large barrel sponges (X. muta) (4.7%) was significantly higher at LKP than other sites (Table 6; Figure 9d). Percent cover of rubble was generally higher at sites previously characterized as having distinct sand channels and ridges (e.g., SDK) at 70%, compared to WSB with 3.5% rubble cover.

3.4. Comparison of RVC and SfM Methods

The combination of visual surveys and mapping using photogrammetry demonstrates how observational scale and methods influence site-specific habitat characterization. Both methods suggest that depth and features that contribute to bottom topography (e.g., surface hard relief, rubble, coral assemblages) are important components in describing habitat complexity among these shallow coral reef sites. Also, the difference in habitat variables that describe hard-bottom seabed surfaces (e.g., a-rubble, a-hard, sapa) that provide structure for biotic variables (e.g., b-coral, b-sponge, branching corals) colonizing the three-dimensional surface for both sampling methods provided critical thresholds for site separation within each cluster analysis. RVC survey site characterization was limited to larger spatial scale differences among sites and did not provide fine-scale descriptions of within-site variation. Conversely, SfM photogrammetry was more robust in not only separating among sites beyond the variables of depth and vertical relief, but also further distinguished sites using more fine-scale variables such as vector terrain ruggedness and specific coral morphologies as key drivers in site characterization. For example, live coral cover was not a significant variable in site characterization for the RVC surveys, yet the SfM mapping approach showed significant differences in the dominance of coral morphologies, as well as the related topographical metrics such as the coral reef rugosity index among sites. RVC surveys were able to capture site variation over space and time relevant to important broad-scale habitat impacts, such as impacts from recreational use (i.e., vessel anchoring, scuba divers) and environmental disturbances (i.e., hurricanes). The one sampling period for SfM mapping was robust in observing within site variations across the three-dimensional surface of the seabed, and captured localized topographical features not generally captured by visual surveys, such as local depressions, patchy coral heads, and the matrix of benthos on sand (e.g., rubble, boulder corals, macroalgal turfs).

4. Discussion

This study provides baseline fine-scale spatial data for several spur-and-groove reef sites in the FKNMS and highlights the combined use of reef visual census surveys and SfM photogrammetry to assess the physical and biological contributions to reef structural complexity relevant to coral reef management and conservation. Characterizing reef habitat complexity using a combination of visual surveys, photogrammetry, and orthoimage analysis provided new insights into understanding both the physical and biological benthic characteristics contributing to the coral reef framework at several fore-reef sites in the FKNMS. Our results from RVC surveys and photogrammetry suggest that shallow reef sites existing within research-only areas and public access sites with mooring buoys generally harbor more reef-building corals than fished sites, but each site may be unique in their combined framework of physical features (i.e., abiotic cover, relief) and dominant coral assemblages. RVC surveys were robust in differentiating among shallow sites and deeper fore-reef sites based on habitat characteristics, as well as describing hard structures that contribute to hardbottom complexity. Depth and seabed surface hard relief cover were key habitat characteristics separating all sites over time, however this separation among sites was diminished after hurricane Irma. In characterizing each site’s site-specific habitat traits, including the presence of varying coral assemblages using orthoimage analysis, our study suggests that colony-scale seabed features, as well as the spatial placement of marine reserves and coral taxa post hurricanes may also play a role in driving habitat complexity.
In characterizing habitat complexity at the site level, our results on the type of coral dominating an area and the amount of seabed surface attributed to hard features (e.g., rubble, dead corals, sponges) may be more important factors in site characterization than percent live coral cover. As hard seabed surfaces essentially include hardbottom substrate, living and non-living corals, and reef rubble, our SfM habitat mapping approach at a high resolution supports previously identified variations in coral assemblages and shows that within site variation in benthic cover may drive structural complexity [26,86,87].
The combination of abiotic and biotic habitat metrics was also useful in characterizing the potential impact of reef management zones on habitat characteristics, as well as providing baseline information on the coral taxa historically present within the reef system, and new taxa [88,89]. For example, WSB is one of the oldest marine reserve sites in the FKNMS, designated as the first ecological reserve in 1997, and lies adjacent to Middle Sambo (not sampled) and ESB. WSB and ESB were not significantly different based on RVC surveys; however, orthoimage analysis found that WSB and ESB differed in dominant coral assemblages present and digital elevation models also found key structural differences in metrics utilized in both survey methods such as median depth, relief, and slope. WSB yielded high coral reef rugosity values comparable to other studies in which high rugosity values (i.e., >2.5) indicate coral richness [90,91,92]. Both sites yielded the lowest coverage in the encrusting zoanthid (P. caribaeorum), yet differed in dominant coral taxa and protection level, suggesting that these sites may possess strong fine-scale habitat traits or biological legacies from previous disturbance impacts for certain coral taxa [93,94,95,96]. For example, following Hurricane Irma’s direct impact on the study sites, the coral reef soundscape at ESB during the same sampling periods (2017–2018) showed signs of recovery within weeks to months following the disturbance through the return of periodic fish chorusing and snapping shrimp activity [97]. NOAA’s National Weather Service has recorded ten tropical storms and nine hurricanes either passing over or making landfall in the Florida Keys and the Dry Tortugas between 2000 and 2020 [98]. The next prior storm to Hurricane Irma was Hurricane Isaac (category 1) in 2012; however, the storm track from Cuba to the southern tip of the Florida Keys was positioned ~40 km away from this study’s southern most site WDR, and there was no major damage reported for reef habitats [99]. The frequent physical destruction in the Lower Florida Keys reef habitats may retain physical complexity; however, the biotic characteristics such as corals, sponges, and gorgonians may shift to reflect a less complex surface cover on hardbottom substrates over time [81,100,101]. Long-term reduced coral diversity can cause a decline in the ecological function of coral reefs and hinder ecosystem recovery as the combined effects of habitat loss and dampening of complex food web dynamics become exacerbated over time [102,103]. For example, many three-dimensional branching, corymbose, plating, and other complex coral morphologies serve as microhabitats for habitat specialists, refugia for ontogenetic niche shifts between size classes or life history stages [102,104,105]. The legacy of the biotic and abiotic features that remain will determine the successive traits and survivorship of future generations at coral reef habitats [106,107].
The relationship between specific habitat metrics, live coral cover or colony size, reef slope, and overall ecosystem health metrics for coral reefs remains unclear. For example, slope serves as a robust indicator of the proportion of hardbottom substrates at a site and provides information on gradual two-dimensional changes in abiotic reef structures (i.e., reef ledge, crest) [43]. In contrast, ruggedness strongly correlates with traditional reef rugosity and trait-based coral cover, and considers the full spatial area for model reconstruction [75,108]. The spatial resolution in estimating VRM or ruggedness varies with coral morphology, yet can also aid in identifying coral assemblages. At high-resolution scales where the raster cell size is less than 4 cm, complex three-dimensional corals such as branching corals, positively correlate with ruggedness while other growth forms, including encrusting and mound-building corals, generally correlate at larger spatial scales between 8–16 cm resolution [43]. Additionally, shallow-water coral reefs often reflect scale-dependent rugosity [109,110], which depends on the abundance and diversity of coral growth forms [74,108] and the presence of intra-species growth plasticity [111]. For example, high relief fished sites such as WDR, NFS, and N1M were essentially physically complex, yet lacked the biological cover present at similarly structured protected sites such as LKP and LKU. Although ESB was a moderately shallow and less complex site than both Looe Key sites, ESB’s variation in surface relief and slope shown in the depth profile was comparable to LKP and reflects the high abundance of P. astreoides that forms dome-shaped colonies. Recent three-dimensional reconstruction of a hurricane impacting a Hawaiian reef atoll showed that mean rugosity and slope decreased as the benthic cover of tabular corals decreased after reef destruction, yet ruggedness varied depending on raster resolution due to the presence of reef rubble, fallen ledges, and depressions [112].

5. Conclusions

As coral reef habitat assessments and restoration efforts evolve to include 3D mapping at scales relevant to management priorities, more research will be needed to understand the relationship between changes in living coral taxa and morphologies, reef structural complexity, and the processes underlying these changes. Additionally, adaptive management frameworks aiming to monitor and promote coral reef resilience in the face of multiple complex stressors calls for knowledge of the magnitude of disturbances and ecosystem vulnerability at finer spatial scales [113]. The use of orthoimage analysis and SfM habitat mapping can provide critical information on changes in the three-dimensional reef structure and biotic surface cover over time to track reef degradation or recovery [112,114]. Furthermore, our coral-trait based approach enhances the understanding of severe disturbances (i.e., hurricanes, SCTLD, ocean warming) on the composition of coral assemblages and the subsequent shifts in benthic communities [85,115,116]. Monitoring fine-scale habitat variables through high-resolution mapping is beneficial in assessing the outcomes of MPAs [117,118,119,120] and coral restoration efforts [121,122] as well as understanding the biological benthic structure of reefs [123] that can help guide place-based coral restoration efforts [124,125]. The combined approach of SfM photogrammetry with traditional monitoring methods, such as visual surveys at multiple spatial and temporal scales, can enhance the ability to find niche habitats or coral taxa that promote resilience against regional stressors prominent in ecologically and economically important coral reef ecosystem such as the Florida Keys.

Supplementary Materials

The following supporting information can be downloaded at: https://www.mdpi.com/article/10.3390/d14030153/s1, Table S1: Example settings used to generate 3D models of Sand Key in Agisoft Metashape Professional. (*) Low settings were used if image alignment was not immediately successful; however, all models were aligned on high before generating the dense cloud or mesh building. Figure S1: Depth-transect profiles based on the DEM raster are shown for (a) Sand Key SPA (SDK), (b) Nine Foot Stake (NFS), (c) Western Sambo ER (WSB), (d) Eastern Sambo SUA (ESB), and (e) Looe Key SPA (LKP). Transect profiles are 30 m in length (west-east) with 3 m spacing between transects heading in a northerly direction.

Author Contributions

Conceptualization, K.R.S., D.R.B. and D.B.E.; methodology, K.R.S. and D.R.B.; software, K.R.S. and D.R.B.; validation, K.R.S. and D.R.B.; formal analysis, K.R.S. and D.R.B.; investigation, K.R.S. and D.R.B.; resources, K.R.S. and D.R.B.; data curation, K.R.S.; writing—original draft preparation, K.R.S.; writing—review and editing, K.R.S., D.R.B. and D.B.E.; visualization, K.R.S. and D.R.B.; supervision, K.R.S., D.R.B. and D.B.E.; project administration, K.R.S. Simmons, D.R.B. and D.B.E.; funding acquisition, K.R.S., D.R.B. and D.B.E. All authors have read and agreed to the published version of the manuscript.

Funding

This research was supported by the Coral Reef Conservation Program (Contract NA18NOS4820113, the NOAA Office of National Marine Sanctuaries (Requisition NFFM7320-19-01243), NC State University, Center for Marine Sciences and Technology, and the John A. Knauss Marine Policy Fellowship and North Carolina Sea Grant. The funders had no role in study design, data collection and analysis, decision to publish, or preparation of the manuscript.

Institutional Review Board Statement

Not applicable.

Informed Consent Statement

Not applicable.

Data Availability Statement

Data will be made available via UC San Diego/Scripps Institution of Oceanography and NOAA NCCOS Mission Iconic Reefs restoration project and Viscore platform.

Acknowledgments

We are grateful to Riley Gallagher, Pat Lyon, Erin Voigt, Olivia Caretti, and Enie Hensel as well as the Marine Ecology and Conservation Lab at NC State University for providing logistical and diver support during mapping and visual surveys. Special thanks to Mike Buchman and the Florida Keys National Marine Sanctuary for providing technical and operational support in site sampling. We also thank Alejandro Acosta and Ariel Wile with the Florida Fish and Wildlife Conservation Commission for guidance on the RVC survey protocols, and the NOAA National Centers for Coastal Ocean Service (NCCOS), and the Mission Iconic Reefs habitat mapping team for their expertise in data analysis and visualization.

Conflicts of Interest

The authors declare no conflict of interest. The funders had no role in the design of the study; in the collection, analyses, or interpretation of data; in the writing of the manuscript, or in the decision to publish the results.

References

  1. Spalding, M.; Spalding, M.D.; Ravilious, C.; Green, E.P. World Atlas of Coral Reefs; University of California Press: Oakland, CA, USA, 2001. [Google Scholar]
  2. Brander, L.M.; Van Beukering, P.; Cesar, H.S.J. The Recreational Value of Coral Reefs: A Meta-Analysis. Ecol. Econ. 2007, 63, 209–218. [Google Scholar] [CrossRef] [Green Version]
  3. Spalding, M.; Burke, L.; Wood, S.A.; Ashpole, J.; Hutchison, J.; zu Ermgassen, P. Mapping the Global Value and Distribution of Coral Reef Tourism. Mar. Policy 2017, 82, 104–113. [Google Scholar] [CrossRef]
  4. Ferrario, F.; Beck, M.W.; Storlazzi, C.D.; Micheli, F.; Shepard, C.C.; Airoldi, L. The Effectiveness of Coral Reefs for Coastal Hazard Risk Reduction and Adaptation. Nat. Commun. 2014, 5, 3794. [Google Scholar] [CrossRef] [PubMed]
  5. Cinner, J. Coral Reef Livelihoods. Curr. Opin. Environ. Sustain. 2014, 7, 65–71. [Google Scholar] [CrossRef]
  6. Hicks, C.C.; Cinner, J.E. Social, Institutional, and Knowledge Mechanisms Mediate Diverse Ecosystem Service Benefits from Coral Reefs. Proc. Natl. Acad. Sci. USA 2014, 111, 17791–17796. [Google Scholar] [CrossRef] [PubMed] [Green Version]
  7. Woodhead, A.J.; Hicks, C.C.; Norström, A.V.; Williams, G.J.; Graham, N.A.J. Coral Reef Ecosystem Services in the Anthropocene. Funct. Ecol. 2019, 33, 1023–1034. [Google Scholar] [CrossRef] [Green Version]
  8. Hoegh-Guldberg, O.; Mumby, P.J.; Hooten, A.J.; Steneck, R.S.; Greenfield, P.; Gomez, E.; Harvell, C.D.; Sale, P.F.; Edwards, A.J.; Caldeira, K.; et al. Coral Reefs under Rapid Climate Change and Ocean Acidification. Science 2007, 318, 1737–1742. [Google Scholar] [CrossRef] [Green Version]
  9. Albert, J.A.; Olds, A.D.; Albert, S.; Cruz-Trinidad, A.; Schwarz, A.M. Reaping the Reef: Provisioning Services from Coral Reefs in Solomon Islands. Mar. Policy 2015, 62, 244–251. [Google Scholar] [CrossRef]
  10. Grafeld, S.; Oleson, K.L.L.; Teneva, L.; Kittinger, J.N. Follow That Fish: Uncovering the Hidden Blue Economy in Coral Reef Fisheries. PLoS ONE 2017, 12, e0182194. [Google Scholar] [CrossRef] [Green Version]
  11. Haapkylä, J.; Unsworth, R.K.F.; Flavell, M.; Bourne, D.G.; Schaffelke, B.; Willis, B.L. Seasonal Rainfall and Runoff Promote Coral Disease on an Inshore Reef. PLoS ONE 2011, 6, e16893. [Google Scholar] [CrossRef]
  12. Staley, C.; Kaiser, T.; Gidley, M.L.; Enochs, I.C.; Jones, P.R.; Goodwin, K.D.; Sinigalliano, C.D.; Sadowsky, M.J.; Chun, C.L. Differential Impacts of Land-Based Sources of Pollution on the Microbiota of Southeast Florida Coral Reefs. Appl. Environ. Microbiol. 2017, 83, e03378-16. [Google Scholar] [CrossRef] [PubMed] [Green Version]
  13. Cunning, R.; Silverstein, R.N.; Barnes, B.B.; Baker, A.C. Extensive Coral Mortality and Critical Habitat Loss Following Dredging and Their Association with Remotely-Sensed Sediment Plumes. Mar. Pollut. Bull. 2019, 145, 185–199. [Google Scholar] [CrossRef] [PubMed]
  14. Gintert, B.E.; Precht, W.F.; Fura, R.; Rogers, K.; Rice, M.; Precht, L.L.; D’Alessandro, M.; Croop, J.; Vilmar, C.; Robbart, M.L. Regional Coral Disease Outbreak Overwhelms Impacts from a Local Dredge Project. Environ. Monit. Assess. 2019, 191, 630. [Google Scholar] [CrossRef] [PubMed]
  15. Carter, A.L.; Edwards, C.B.; Fox, M.D.; Amir, C.G.; Eynaud, Y.; Johnson, M.D.; Lewis, L.S.; Sandin, S.A.; Smith, J.E. Changes in Benthic Community Composition Associated with the Outbreak of the Corallimorph, Rhodactis Howesii, at Palmyra Atoll. Coral Reefs 2019, 38, 1267–1279. [Google Scholar] [CrossRef]
  16. Figueroa, D.F.; McClure, A.; Figueroa, N.J.; Hicks, D.W. Hiding in Plain Sight: Invasive Coral Tubastraea Tagusensis (Scleractinia:Hexacorallia) in the Gulf of Mexico. Coral Reefs 2019, 38, 395–403. [Google Scholar] [CrossRef]
  17. Crivellaro, M.S.; Silveira, T.C.L.; Custódio, F.Y.; Battaglin, L.C.; de Sá Dechoum, M.; Fonseca, A.C.; Segal, B. Fighting on the Edge: Reproductive Effort and Population Structure of the Invasive Coral Tubastraea Coccinea in its Southern Atlantic Limit of Distribution Following Control Activities. Biol. Invasions 2021, 23, 811–823. [Google Scholar] [CrossRef]
  18. Alvarez-Filip, L.; Estrada-Saldívar, N.; Pérez-Cervantes, E.; Molina-Hernández, A.; González-Barrios, F.J. A Rapid Spread of the Stony Coral Tissue Loss Disease Outbreak in the Mexican Caribbean. PeerJ 2019, 7, e8069. [Google Scholar] [CrossRef] [Green Version]
  19. Estrada-Saldívar, N.; Molina-Hernández, A.; Pérez-Cervantes, E.; Medellín-Maldonado, F.; González-Barrios, F.J.; Alvarez-Filip, L. Reef-Scale Impacts of the Stony Coral Tissue Loss Disease Outbreak. Coral Reefs 2020, 39, 861–866. [Google Scholar] [CrossRef]
  20. Kaufman, M.L.; Watkins, E.; van Hooidonk, R.; Baker, A.C.; Lirman, D. Thermal History Influences Lesion Recovery of the Threatened Caribbean Staghorn Coral Acropora Cervicornis under Heat Stress. Coral Reefs 2021, 40, 289–293. [Google Scholar] [CrossRef]
  21. Studivan, M.S.; Shatters, A.; Dodge, D.L.; Beal, J.L.; Voss, J.D. Synergistic Effects of Thermal Stress and Estuarine Discharge on Transcriptomic Variation of Montastraea Cavernosa Corals in Southeast Florida. Front. Mar. Sci. 2021, 8, 662220. [Google Scholar] [CrossRef]
  22. Riegl, B. Degradation of Reef Structure, Coral and Fish Communities in the Red Sea by Ship Groundings and Dynamite Fisheries. Bull. Mar. Sci. 2001, 69, 595–611. Available online: https://www-ingentaconnect-com.prox.lib.ncsu.edu/content/umrsmas/bullmar/2001/00000069/00000002/art00031# (accessed on 26 December 2021).
  23. Raymundo, L.J.; Licuanan, W.L.; Kerr, A.M. Adding Insult to Injury: Ship Groundings Are Associated with Coral Disease in a Pristine Reef. PLoS ONE 2018, 13, e0207078. [Google Scholar] [CrossRef] [PubMed] [Green Version]
  24. Lyons, P.J.; Arboleda, E.; Benkwitt, C.E.; Davis, B.; Gleason, M.; Howe, C.; Mathe, J.; Middleton, J.; Sikowitz, N.; Untersteggaber, L.; et al. The Effect of Recreational SCUBA Divers on the Structural Complexity and Benthic Assemblage of a Caribbean Coral Reef. Biodivers. Conserv. 2015, 24, 3491–3504. [Google Scholar] [CrossRef]
  25. Moberg, F.; Folke, C. Ecological Goods and Services of Coral Reef Ecosystems. Ecol. Econ. 1999, 29, 215–233. [Google Scholar] [CrossRef]
  26. Alvarez-Filip, L.; Carricart-Ganivet, J.P.; Horta-Puga, G.; Iglesias-Prieto, R. Shifts in Coral-Assemblage Composition Do Not Ensure Persistence of Reef Functionality. Sci. Rep. 2013, 3, 3486. [Google Scholar] [CrossRef]
  27. Rogers, A.; Blanchard, J.L.; Mumby, P.J. Vulnerability of Coral Reef Fisheries to a Loss of Structural Complexity. Curr. Biol. 2014, 24, 1000–1005. [Google Scholar] [CrossRef] [Green Version]
  28. Lester, S.E.; Halpern, B.S.; Grorud-Colvert, K.; Lubchenco, J.; Ruttenberg, B.I.; Gaines, S.D.; Airamé, S.; Warner, R.R. Biological Effects within No-Take Marine Reserves: A Global Synthesis. Mar. Ecol. Prog. Ser. 2009, 384, 33–46. [Google Scholar] [CrossRef]
  29. Edgar, G.J.; Stuart-Smith, R.D.; Willis, T.J.; Kininmonth, S.; Baker, S.C.; Banks, S.; Barrett, N.S.; Becerro, M.A.; Bernard, A.T.F.; Berkhout, J.; et al. Global Conservation Outcomes Depend on Marine Protected Areas with Five Key Features. Nature 2014, 6000, 216–220. [Google Scholar] [CrossRef] [Green Version]
  30. Manel, S.; Loiseau, N.; Andrello, M.; Fietz, K.; Goñi, R.; Forcada, A.; Lenfant, P.; Kininmonth, S.; Marcos, C.; Marques, V.; et al. Long-Distance Benefits of Marine Reserves: Myth or Reality? Trends Ecol. Evol. 2019, 34, 342–354. [Google Scholar] [CrossRef]
  31. Sponaugle, S.; Cowen, R.K. Coral Ecosystem Connectivity Between Pulley Ridge and the Florida Keys. In Mesophotic Coral Ecosystems. Coral Reefs of the World; Loya, Y., Puglise, K., Bridge, T., Eds.; Springer: Cham, Swiztland, 2019; Volume 3, pp. 897–907. [Google Scholar] [CrossRef]
  32. Boström-Einarsson, L.; Babcock, R.C.; Bayraktarov, E.; Ceccarelli, D.; Cook, N.; Ferse, S.C.A.; Hancock, B.; Harrison, P.; Hein, M.; Shaver, E.; et al. Coral Restoration—A Systematic Review of Current Methods, Successes, Failures and Future Directions. PLoS ONE 2020, 15, e0226631. [Google Scholar] [CrossRef]
  33. Gouezo, M.; Fabricius, K.; Harrison, P.; Golbuu, Y.; Doropoulos, C. Optimizing Coral Reef Recovery with Context-Specific Management Actions at Prioritized Reefs. J. Environ. Manage. 2021, 295, 113209. [Google Scholar] [CrossRef] [PubMed]
  34. Cheal, A.J.; Emslie, M.; MacNeil, M.A.; Miller, I.; Sweatman, H. Spatial Variation in the Functional Characteristics of Herbivorous Fish Communities and the Resilience of Coral Reefs. Ecol. Appl. 2013, 23, 174–188. [Google Scholar] [CrossRef] [PubMed] [Green Version]
  35. Zaneveld, J.R.; Burkepile, D.E.; Shantz, A.A.; Pritchard, C.E.; McMinds, R.; Payet, J.P.; Welsh, R.; Correa, A.M.S.; Lemoine, N.P.; Rosales, S.; et al. Overfishing and Nutrient Pollution Interact with Temperature to Disrupt Coral Reefs down to Microbial Scales. Nat. Commun. 2016, 7, 11833. [Google Scholar] [CrossRef] [PubMed]
  36. Ruttenberg, B.I.; Adam, T.C.; Duran, A.; Burkepile, D.E. Identity of Coral Reef Herbivores Drives Variation in Ecological Processes over Multiple Spatial Scales. Ecol. Appl. 2019, 29, e01893. [Google Scholar] [CrossRef]
  37. Goergen, E.A.; Schopmeyer, S.; Moulding, A.L.; Moura, A.; Kramer, P.; Viehman, T.S. Coral Reef Restoration Monitoring Guide: Methods to Evaluate Restoration Success from Local to Ecosystem Scales. In NOAA Technical Memorandum NOS NCCOS 279; NOAA: Silver Spring, MD, USA, 2020; p. 145. [Google Scholar] [CrossRef]
  38. Pittman, S.; Yates, K.; Bouchet, P.; Alvarez-Berastegui, D.; Andréfouët, S.; Bell, S.; Berkström, C.; Boström, C.; Brown, C.; Connolly, R.; et al. Seascape Ecology: Identifying Research Priorities for an Emerging Ocean Sustainability Science. Mar. Ecol. Prog. Ser. 2021, 663, 1–29. [Google Scholar] [CrossRef]
  39. Miller, M.W.; Bourque, A.S.; Bohnsack, J.A. An Analysis of the Loss of Acroporid Corals at Looe Key, Florida, USA: 1983–2000. Coral Reefs 2002, 21, 179–182. [Google Scholar] [CrossRef]
  40. Palandro, D.A.; Andréfouët, S.; Hu, C.; Hallock, P.; Müller-Karger, F.E.; Dustan, P.; Callahan, M.K.; Kranenburg, C.; Beaver, C.R. Quantification of Two Decades of Shallow-Water Coral Reef Habitat Decline in the Florida Keys National Marine Sanctuary Using Landsat Data (1984–2002). Remote Sens. Environ. 2008, 112, 3388–3399. [Google Scholar] [CrossRef]
  41. Figueira, W.; Ferrari, R.; Weatherby, E.; Porter, A.; Hawes, S.; Byrne, M. Accuracy and Precision of Habitat Structural Complexity Metrics Derived from Underwater Photogrammetry. Remote Sens. 2015, 7, 16883–16900. [Google Scholar] [CrossRef] [Green Version]
  42. Ferrari, R.; McKinnon, D.; He, H.; Smith, R.N.; Corke, P.; González-Rivero, M.; Mumby, P.J.; Upcroft, B. Quantifying Multiscale Habitat Structural Complexity: A Cost-Effective Framework for Underwater 3D Modelling. Remote Sens. 2016, 8, 113. [Google Scholar] [CrossRef] [Green Version]
  43. Fukunaga, A.; Burns, J.H.R.; Pascoe, K.H.; Kosaki, R.K. Associations between Benthic Cover and Habitat Complexity Metrics Obtained from 3D Reconstruction of Coral Reefs at Different Resolutions. Remote Sens. 2020, 12, 1011. [Google Scholar] [CrossRef] [Green Version]
  44. Phinn, S.R.; Roelfsema, C.M.; Mumby, P.J. Multi-Scale, Object-Based Image Analysis for Mapping Geomorphic and Ecological Zones on Coral Reefs. Int. J. Remote Sens. 2012, 33, 3768–3797. [Google Scholar] [CrossRef]
  45. Royer, J.P.; Nawaf, M.M.; Merad, D.; Saccone, M.; Bianchimani, O.; Garrabou, J.; Ledoux, J.B.; Lopez-Sanz, A.; Drap, P. Photogrammetric Surveys and Geometric Processes to Analyse and Monitor Red Coral Colonies. J. Mar. Sci. Eng. 2018, 6, 42. [Google Scholar] [CrossRef] [Green Version]
  46. Suman, D.; Shivlani, M.; Walter Milon, J. Perceptions and Attitudes Regarding Marine Reserves: A Comparison of Stakeholder Groups in the Florida Keys National Marine Sanctuary. Ocean Coast Manag. 1999, 42, 1019–1040. [Google Scholar] [CrossRef]
  47. Keller, B.; Donahue, S. Florida Keys National Marine Sanctuary U.S. Environmental Protection Agency State of Florida 2002—03 Sanctuary Science Report: An Ecosystem Report Card. In U.S. Department of Commerce, National Oceanic and Atmospheric Administration, National Ocean Service, Office of National Marine Sanctuaries, Florida Keys National Marine Sanctuary, Marathon, FL; 2006. Available online: http://sanctuaries.noaa.gov/science/conservation/pdfs/Keller1.pdf (accessed on 28 November 2021).
  48. Bruckner, A.W. Proceedings of the Caribbean Acropora Workshop: Potential Application of the U.S. Endangered Species Act as a Conservation Strategy. In NOAA Technical Memorandum NMFS-OPR-24; NOAA: Silver Springs, MD, USA, 2002; p. 199. Available online: https://repository.library.noaa.gov/view/noaa/435 (accessed on 28 November 2021).
  49. Hogarth, W.T. Endangered and Threatened Species: Final Listing Determinations for Elkhorn Coral and Staghorn Coral. Fed. Regist. 2006, 71, 26852–26861. Available online: https://www.federalregister.gov/documents/2006/05/09/06-4321/endangered-and-threatened-species-final-listing-determinations-for-elkhorn-coral-and-staghorn-coral (accessed on 28 January 2022).
  50. Miller, J.; Muller, E.; Rogers, C.; Waara, R.; Atkinson, A.; Whelan, K.R.T.; Patterson, M.; Witcher, B. Coral Disease Following Massive Bleaching in 2005 Causes 60% Decline in Coral Cover on Reefs in the US Virgin Islands. Coral Reefs 2009, 28, 925–937. [Google Scholar] [CrossRef] [Green Version]
  51. Lewis, C.L.; Neely, K.L.; Richardson, L.L.; Rodriguez-Lanetty, M. Temporal Dynamics of Black Band Disease Affecting Pillar Coral (Dendrogyra Cylindrus) Following Two Consecutive Hyperthermal Events on the Florida Reef Tract. Coral Reefs 2017, 36, 427–431. [Google Scholar] [CrossRef]
  52. Florida Fish and Wildlife Conservation Commission. A Species Action Plan for the Pillar Coral Dendrogyra Cylindrus Final Draft. 2013. Available online: https://myfwc.com/wildlifehabitats/wildlife/species-action-plans/ (accessed on 28 November 2021).
  53. Ruzicka, R.R.; Colella, M.A.; Porter, J.W.; Morrison, J.M.; Kidney, J.A.; Brinkhuis, V.; Lunz, K.S.; MacAulay, K.A.; Bartlett, L.A.; Meyers, M.K.; et al. Temporal Changes in Benthic Assemblages on Florida Keys Reefs 11 Years after the 1997/1998 El Niño. Mar. Ecol. Prog. Ser. 2013, 489, 125–141. [Google Scholar] [CrossRef] [Green Version]
  54. Precht, W.F.; Gintert, B.E.; Robbart, M.L.; Fura, R.; van Woesik, R. Unprecedented Disease-Related Coral Mortality in Southeastern Florida. Sci. Rep. 2016, 6, 31374. [Google Scholar] [CrossRef]
  55. Walton, C.J.; Hayes, N.K.; Gilliam, D.S. Impacts of a Regional, Multi-Year, Multi-Species Coral Disease Outbreak in Southeast Florida. Front. Mar. Sci. 2018, 5, 323. [Google Scholar] [CrossRef]
  56. Aeby, G.S.; Ushijima, B.; Campbell, J.E.; Jones, S.; Williams, G.J.; Meyer, J.L.; Häse, C.; Paul, V.J. Pathogenesis of a Tissue Loss Disease Affecting Multiple Species of Corals Along the Florida Reef Tract. Front. Mar. Sci. 2019, 6, 678. [Google Scholar] [CrossRef]
  57. Jones, N.P.; Figueiredo, J.; Gilliam, D.S. Thermal Stress-Related Spatiotemporal Variations in High-Latitude Coral Reef Benthic Communities. Coral Reefs 2020, 39, 1661–1673. [Google Scholar] [CrossRef]
  58. Rippe, J.P.; Kriefall, N.G.; Davies, S.W.; Castillo, K.D. Differential Disease Incidence and Mortality of Inner and Outer Reef Corals of the Upper Florida Keys in Association with a White Syndrome Outbreak. Bull. Mar. Sci. 2019, 95, 305–316. [Google Scholar] [CrossRef]
  59. Courtney, T.A.; Andersson, A.J. Evaluating Measurements of Coral Reef Net Ecosystem Calcification Rates. Coral Reefs 2019, 38, 997–1006. [Google Scholar] [CrossRef]
  60. Bohnsack, J.A.; Cantillo, A.Y.; Bello, M.J. Resource Survey of Looe Key National Marine Sanctuary 1983. United States Department of Commerce. In NOAA Technical Memorandum NMFS-SEFSC; 2002; Volume 478, p. 267. Available online: https://www.aoml.noaa.gov.general/lib/CEDAR_files/cedar106.pdf (accessed on 26 December 2021).
  61. Somerfield, P.J.; Jaap, W.C.; Clarke, K.R.; Callahan, M.; Hackett, K.; Porter, J.; Lybolt, M.; Tsokos, C.; Yanev, G. Changes in Coral Reef Communities among the Florida Keys, 1996–2003. Coral Reefs 2008, 27, 951–965. [Google Scholar] [CrossRef]
  62. Page, C.A.; Muller, E.M.; Vaughan, D.E. Microfragmenting for the Successful Restoration of Slow Growing Massive Corals. Ecol. Eng. 2018, 123, 86–94. [Google Scholar] [CrossRef]
  63. Lustic, C.; Maxwell, K.; Bartels, E.; Reckenbeil, B.; Utset, E.; Schopmeyer, S.; Zink, I.; Lirman, D. The Impacts of Competitive Interactions on Coral Colonies after Transplantation: A Multispecies Experiment from the Florida Keys, US. Bull. Mar. Sci. 2020, 96, 805–818. [Google Scholar] [CrossRef]
  64. Baker, B. First Aid for an Ailing Reef: Research in the Florida Keys National Marine Sanctuary. BioScience 1999, 49, 173–178. [Google Scholar] [CrossRef] [Green Version]
  65. Cangialosi, J.P.; Latto, A.S.; Berg, R. Tropical Cyclone Report: Hurricane Irma (AL112017): 30 August–12 September 2017. In National Center Tropical Cyclone Report; 2018; Volume 111. Available online: https://www.nhc.noaa.gov/data/tcr/AL112017_Irma.pdf (accessed on 28 January 2022).
  66. Viehman, S.; Gittings, S.; Groves, S.; Moore, J.; Moore, T.; Stein, J. NCCOS Assessment: Coral Disturbance Response Monitoring (DRM) along the Florida Reef Tract Following Hurricane Irma from 2017-10-09 to 2017-10-18 (NCEI Accession 0179071). [Hurricane Impacts]. NOAA National Centers for Environmental Information. Dataset. 2018. Available online: https://doi.org/10.25921/sscd-6h41 (accessed on 17 February 2022).
  67. Florida Reef Resilience Program. In Florida Reef Resilience Program Disturbance Response Monitoring and Hurricane Irma Rapid Reef Assessment Quick Look Report: Summer 2017; 2017. Available online: https://repository.library.noaa.gov/view/noaa/15575 (accessed on 28 November 2021).
  68. Bohnsack, J.A.; Bannerot, S.P. A Stationary Visual Census Technique for Quantitatively Assessing Community Structure of Coral Reef Fishes; 1986; Volume 33, pp. 291–303. Available online: https://www.st.nmfs.noaa.gov/spo/SPO/tr41opt.pdf (accessed on 28 November 2021).
  69. Ault, J.S.; Smith, S.G.; Meester, G.A.; Luo, J.; Bohnsack, J.A. Site Characterization for Biscayne National Park: Assessment of Fisheries Resources and Habitats; NOAA Technical Memorandum NMFS-SEFSC-468; 2001; p. 156. Available online: https://repository.library.noaa.gov/view/noaa/8519 (accessed on 28 November 2021).
  70. Brandt, M.; Zurcher, N.; Acosta, A.; Ault, J.S. A Cooperative Multi-Agency Reef Fish Monitoring Protocol for the Florida Keys Coral Reef Ecosystem; Natural Resources Report NPS/SFCN/NRR-2009/150; National Park Service: Fort Collins, CO, USA, 2009. Available online: https://www.researchgate.net/publication/265682772 (accessed on 28 January 2022).
  71. Shinn, E. Spur-and-groove Formation on the Florida Reef Tract. J. Sediment. Res. 1963, 33, 291–303. [Google Scholar] [CrossRef]
  72. Shinn, E.; Hudson, J.; Robbin, D.; Lidz, B. Spurs and Grooves Revisited: Construction versus Erosion, Looe Key Reef, Florida. 1982. Available online: https://pubs.er.usgs.gov/publication/70122248 (accessed on 7 June 2020).
  73. Duce, S.; Dechnik, B.; Webster, J.M.; Hua, Q.; Sadler, J.; Webb, G.E.; Nothdurft, L.; Salas-Saavedra, M.; Vila-Concejo, A. Mechanisms of Spur-and-groove Development and Implications for Reef Platform Evolution. Quat. Sci. Rev. 2019, 231, 106155. [Google Scholar] [CrossRef]
  74. Burns, J.; Delparte, D.; Gates, R.; Takabayashi, M. Integrating Structure-from-Motion Photogrammetry with Geospatial Software as a Novel Technique for Quantifying 3D Ecological Characteristics of Coral Reefs. PeerJ 2015, 3, e1077. [Google Scholar] [CrossRef] [PubMed]
  75. Fukunaga, A.; Burns, J.H.R.; Craig, B.K.; Kosaki, R.K. Integrating Three-Dimensional Benthic Habitat Characterization Techniques into Ecological Monitoring of Coral Reefs. J. Mar. Sci. Eng. 2019, 7, 27. [Google Scholar] [CrossRef] [Green Version]
  76. Walbridge, S.; Slocum, N.; Pobuda, M.; Wright, D.J. Unified Geomorphological Analysis Workflows with Benthic Terrain Modeler. Geosciences 2018, 8, 94. [Google Scholar] [CrossRef] [Green Version]
  77. Hobson, R.D. Surface Roughness in Topography: Quantitative Approach. In Spatial Analysis in Geomorphology; Chorley, R.J., Ed.; Harper and Row: New York, NY, USA, 1972; pp. 221–246. [Google Scholar]
  78. Sappington, J.M.; Longshore, K.M.; Thompson, D.B. Quantifying Landscape Ruggedness for Animal Habitat Analysis: A Case Study Using Bighorn Sheep in the Mojave Desert. J. Wildl. Manage. 2007, 71, 1419–1426. [Google Scholar] [CrossRef]
  79. Jenness, J.S. Calculating Landscape Surface Area from Digital Elevation Models. Wildl. Soc. 2004, 32, 829–839. [Google Scholar] [CrossRef]
  80. Nunes, V.; Pawlak, G. Observations of Bed Roughness of a Coral Reef. J. Coast. Res. 2008, 24, 39–50. [Google Scholar] [CrossRef]
  81. Bozec, Y.M.; Alvarez-Filip, L.; Mumby, P.J. The Dynamics of Architectural Complexity on Coral Reefs under Climate Change. Glob. Chang. Biol. 2015, 21, 223–235. [Google Scholar] [CrossRef]
  82. González-Rivero, M.; Beijbom, O.; Rodriguez-Ramirez, A.; Holtrop, T.; González-Marrero, Y.; Ganase, A.; Roelfsema, C.; Phinn, S.; Hoegh-Guldberg, O. Scaling up Ecological Measurements of Coral Reefs Using Semi-Automated Field Image Collection and Analysis. Remote Sens. 2016, 8, 30. [Google Scholar] [CrossRef] [Green Version]
  83. De Clippele, L.H.; Huvenne, V.A.I.; Orejas, C.; Lundälv, T.; Fox, A.; Hennige, S.J.; Roberts, J.M. The Effect of Local Hydrodynamics on the Spatial Extent and Morphology of Cold-Water Coral Habitats at Tisler Reef, Norway. Coral Reefs 2018, 37, 253–266. [Google Scholar] [CrossRef] [Green Version]
  84. Conti, L.A.; Lim, A.; Wheeler, A.J. High Resolution Mapping of a Cold Water Coral Mound. Sci. Rep. 2019, 9, 1016. [Google Scholar] [CrossRef]
  85. Zawada, K.J.A.; Madin, J.S.; Baird, A.H.; Bridge, T.C.L.; Dornelas, M. Morphological Traits Can Track Coral Reef Responses to the Anthropocene. Funct. Ecol. 2019, 33, 962–975. [Google Scholar] [CrossRef] [Green Version]
  86. Darling, E.S.; Alvarez-Filip, L.; Oliver, T.A.; Mcclanahan, T.R.; Côté, I.M. Evaluating Life-History Strategies of Reef Corals from Species Traits. Ecol. Lett. 2012, 15, 1378–1386. [Google Scholar] [CrossRef] [PubMed]
  87. Darling, E.S.; Graham, N.A.J.; Januchowski-Hartley, F.A.; Nash, K.L.; Pratchett, M.S.; Wilson, S.K. Relationships between Structural Complexity, Coral Traits, and Reef Fish Assemblages. Coral Reefs 2017, 36, 561–575. [Google Scholar] [CrossRef] [Green Version]
  88. Connell, J.H.; Hughes, T.P.; Wallace, C.C.; Tanner, J.E.; Harms, K.E.; Kerr, A.M. A Long-Term Study of Competition and Diversity of Corals. Ecol. Monogr. 2004, 74, 179–210. [Google Scholar] [CrossRef] [Green Version]
  89. McWilliam, M.; Hoogenboom, M.O.; Baird, A.H.; Kuo, C.-Y.; Madin, J.S.; Hughes, T.P. Biogeographical Disparity in the Functional Diversity and Redundancy of Corals. Proc. Natl. Acad. Sci. USA 2018, 115, 3084–3089. [Google Scholar] [CrossRef] [PubMed] [Green Version]
  90. Aronson, R.B.; Prechtb, W.F. Landscape Patterns of Reef Coral Diversity: A Test of the Intermediate Disturbance Hypothesis. J. Exp. Mar. Biol. Ecol. 1995, 192, 1–14. [Google Scholar] [CrossRef]
  91. Alvarez-Filip, L.; Dulvy, N.K.; Côté, I.M.; Watkinson, A.R.; Gill, J.A. Coral Identity Underpins Architectural Complexity on Caribbean Reefs. Ecol. Appl. 2011, 21, 2223–2231. [Google Scholar] [CrossRef]
  92. Young, G.C.; Dey, S.; Rogers, A.D.; Exton, D. Cost and Time-Effective Method for Multiscale Measures of Rugosity, Fractal Dimension, and Vector Dispersion from Coral Reef 3D Models. PLoS ONE 2017, 12, e0201847. [Google Scholar] [CrossRef]
  93. Peterson, G.D. Contagious Disturbance, Ecological Memory, and the Emergence of Landscape Pattern. Ecosystems 2002, 5, 329–338. [Google Scholar] [CrossRef]
  94. Hughes, T.P.; Kerry, J.T.; Connolly, S.R.; Baird, A.H.; Eakin, C.M.; Heron, S.F.; Hoey, A.S.; Hoogenboom, M.O.; Jacobson, M.; Liu, G.; et al. Ecological Memory Modifies the Cumulative Impact of Recurrent Climate Extremes. BioScience 2020, 70, 854–870. [Google Scholar] [CrossRef]
  95. Burton, P.J.; Jentsch, A.; Walker, L.R. The Ecology of Disturbance Interactions. BioScience 2020, 70, 854–870. [Google Scholar] [CrossRef]
  96. Wall, C.B.; Ricci, C.A.; Wen, A.D.; Ledbetter, B.E.; Klinger, D.E.; Mydlarz, L.D.; Gates, R.D.; Putnam, H.M. Shifting Baselines: Physiological Legacies Contribute to the Response of Reef Corals to Frequent Heatwaves. Funct. Ecol. 2021, 35, 1366–1378. [Google Scholar] [CrossRef]
  97. Simmons, K.R.; Eggleston, D.B.; Bohnenstiehl, D.R. Hurricane Impacts on a Coral Reef Soundscape. PLoS ONE 2021, 16, e0244599. [Google Scholar] [CrossRef] [PubMed]
  98. NOAA National Weather Service. Tropical Cyclones of the 2000s. Available online: https://www.weather.gov/key/2000sHurricanes (accessed on 26 January 2022).
  99. Berg, R. Tropical Cyclone Report: Hurricane Isaac (AL092012): 21 August—1 September 2012. In National Hurricane Center; 2013; pp. 1–78. Available online: https://nhc.noaa.gov/data/tcr/index.php?season=2012&basin=atl (accessed on 28 January 2019).
  100. Rogers, C.S. Hurricanes and Coral Reefs: The Intermediate Disturbance Hypothesis Revisited. Coral Reefs 1993, 12, 127–137. [Google Scholar] [CrossRef]
  101. Alvarez-Filip, L.; Dulvy, N.K.; Gill, J.A.; Côté, I.M.; Watkinson, A.R. Flattening of Caribbean Coral Reefs: Region-Wide Declines in Architectural Complexity. Proc. Royal Soc. B 2009, 276, 3019–3025. [Google Scholar] [CrossRef] [Green Version]
  102. Rogers, A.; Blanchard, J.L.; Mumby, P.J. Fisheries Productivity under Progressive Coral Reef Degradation. J. Appl. Ecol. 2018, 55, 1041–1049. [Google Scholar] [CrossRef]
  103. Dubois, M.; Gascuel, D.; Coll, M.; Claudet, J. Recovery Debts Can Be Revealed by Ecosystem Network-Based Approaches. Ecosystems 2019, 22, 658–676. [Google Scholar] [CrossRef]
  104. Wilson, S.K.; Burgess, S.C.; Cheal, A.J.; Emslie, M.; Fisher, R.; Miller, I.; Polunin, N.V.C.; Sweatman, H.P.A. Habitat Utilization by Coral Reef Fish: Implications for Specialists vs. Generalists in a Changing Environment. J. Anim. Ecol. 2008, 77, 220–228. [Google Scholar] [CrossRef]
  105. Pratchett, M.S.; Coker, D.J.; Jones, G.P.; Munday, P.L. Specialization in Habitat Use by Coral Reef Damselfishes and Their Susceptibility to Habitat Loss. Ecol. Evol. 2012, 2, 2168–2180. [Google Scholar] [CrossRef]
  106. Gardner, T.A.; Côté, I.M.; Gill, J.A.; Grant, A.; Watkinson, A.R. Hurricanes and Caribbean Coral Reefs: Impacts, Recovery Patterns, and Role in Long-Term Decline. Ecology 2005, 86, 174–184. [Google Scholar] [CrossRef] [Green Version]
  107. McWilliam, M.; Pratchett, M.S.; Hoogenboom, M.O.; Hughes, T.P. Deficits in Functional Trait Diversity Following Recovery on Coral Reefs. Proc. Royal Soc. B 2020, 287, 20192628. [Google Scholar] [CrossRef] [PubMed] [Green Version]
  108. Price, D.M.; Robert, K.; Callaway, A.; Lo Iacono, C.; Hall, R.A.; Huvenne, V.A.I. Using 3D Photogrammetry from ROV Video to Quantify Cold-Water Coral Reef Structural Complexity and Investigate Its Influence on Biodiversity and Community Assemblage. Coral Reefs 2019, 38, 1007–1021. [Google Scholar] [CrossRef] [Green Version]
  109. Knudby, A.; Ledrew, E.; Newman, C. Progress in the Use of Remote Sensing for Coral Reef Biodiversity Studies. Prog. Phys. Geogr. 2007, 31, 421–434. [Google Scholar] [CrossRef]
  110. Richardson, L.E.; Graham, N.A.; Hoey, A.S. Cross-Scale Habitat Structure Driven by Coral Species Composition on Tropical Reefs OPEN. Sci. Rep. 2017, 7, 7557. [Google Scholar] [CrossRef] [PubMed] [Green Version]
  111. Todd, P.A. Morphological Plasticity in Scleractinian Corals. Biol. Rev. 2008, 83, 315–337. [Google Scholar] [CrossRef] [PubMed]
  112. Pascoe, K.H.; Fukunaga, A.; Kosaki, R.K.; Burns, J.H.R. 3D Assessment of a Coral Reef at Lalo Atoll Reveals Varying Responses of Habitat Metrics Following a Catastrophic Hurricane. Sci. Rep. 2021, 11, 12050. [Google Scholar] [CrossRef]
  113. Anthony, K.R.N.; Marshall, P.A.; Abdulla, A.; Beeden, R.; Bergh, C.; Black, R.; Eakin, C.M.; Game, E.T.; Gooch, M.; Graham, N.A.J.; et al. Operationalizing Resilience for Adaptive Coral Reef Management under Global Environmental Change. Glob. Chang. Biol. 2015, 21, 48–61. [Google Scholar] [CrossRef]
  114. Gleason, A.C.R.; Lirman, D.; Williams, D.; Gracias, N.R.; Gintert, B.E.; Madjidi, H.; Pamela Reid, R.; Boynton, G.C.; Negahdaripour, S.; Miller, M.; et al. Documenting Hurricane Impacts on Coral Reefs Using Two-Dimensional Video-Mosaic Technology. Mar. Ecol. 2007, 28, 254–258. [Google Scholar] [CrossRef]
  115. Hughes, T.P.; Kerry, J.T.; Baird, A.H.; Connolly, S.R.; Dietzel, A.; Eakin, C.M.; Heron, S.F.; Hoey, A.S.; Hoogenboom, M.O.; Liu, G.; et al. Global Warming Transforms Coral Reef Assemblages. Nature 2018, 556, 492–496. [Google Scholar] [CrossRef]
  116. Fukunaga, A.; Pascoe, K.H.; Pugh, A.R.; Kosaki, R.K.; Burns, J.H. Underwater Photogrammetry Captures the Initial Recovery of a Coral Reef at Lalo Atoll. Divers 2022, 14, 39. [Google Scholar] [CrossRef]
  117. Roelfsema, C.; Thurstan, R.; Beger, M.; Dudgeon, C.; Loder, J.; Kovacs, E.; Gallo, M.; Flower, J.; Cabrera, K.L.G.; Ortiz, J.; et al. A Citizen Science Approach: A Detailed Ecological Assessment of Subtropical Reefs at Point Lookout, Australia. PLoS ONE 2016, 11, e0163407. [Google Scholar] [CrossRef] [PubMed]
  118. Bayley, D.T.I.; Mogg, A.O.M.; Purvis, A.; Koldewey, H.J. Evaluating the Efficacy of Small-Scale Marine Protected Areas for Preserving Reef Health: A Case Study Applying Emerging Monitoring Technology. Aquat. Conserv. 2019, 29, 2026–2044. [Google Scholar] [CrossRef]
  119. Chen, G.K.; Dai, C.F. Using 3D Photogrammetry to Quantify the Subtle Differences of Coral Reefs under the Impacts of Marine Activities. Mar. Pollut. Bull. 2021, 173, 113032. [Google Scholar] [CrossRef] [PubMed]
  120. Richaume, J.; Cheminée, A.; Drap, P.; Bonhomme, P.; Cadene, F.; Ferrari, B.; Hartmann, V.; Michez, N.; Bianchimani, O. 3D Photogrammetry Modeling Highlights Efficient Reserve Effect Apparition After 5 Years and Stillness After 40 for Red Coral (Corallium Rubrum) Conservation in French MPAs. Front. Mar. Sci. 2021, 8, 1174. [Google Scholar] [CrossRef]
  121. Torres-Pulliza, D.; Wilson, J.R.; Darmawan, A.; Campbell, S.J.; Andréfouët, S. Ecoregional Scale Seagrass Mapping: A Tool to Support Resilient MPA Network Design in the Coral Triangle. Ocean Coast Manag. 2013, 80, 55–64. [Google Scholar] [CrossRef]
  122. Lawrence, A.; Heenan, A.; Levine, A.; Haddaway, N.R.; Powell, F.; Wedding, L.; Roche, R.; Lawrence, P.; Szostek, C.; Ford, H.; et al. Spatial and Temporal Scales of Coral Reef Fish Ecological Research and Management: A Systematic Map Protocol. Environ. Evid. 2021, 10, 3. [Google Scholar] [CrossRef]
  123. Sierra-Escrigas, S.L.; Peluffo, D.R.P.; García-Urueña, R. Shallow Coral Reef Community Mapping and Update on Its Ecological Units Using Aerial Images at Isla Arena, Colombian Caribbean. Int. J. Remote Sens 2020, 41, 8198–8215. [Google Scholar] [CrossRef]
  124. Roelvink, F.E.; Storlazzi, C.D.; van Dongeren, A.R.; Pearson, S.G. Coral Reef Restorations Can Be Optimized to Reduce Coastal Flooding Hazards. Front.Mar.Sci. 2021, 8, 1–11. [Google Scholar] [CrossRef]
  125. Storlazzi, C.D.; Reguero, B.G.; Cumming, K.A.; Cole, A.D.; Shope, J.B.; Gaido, L.C.; Viehman, T.S.; Nickel, B.A.; Beck, M.W. Rigorously Valuing the Coastal Hazard Risks Reduction Provided by Potential Coral Reef Restoration in Florida and Puerto Rico. Geological Suveys (U.S.). 2021. Available online: https://doi.org/10.3133/ofr20211054 (accessed on 28 November 2021).
Figure 1. Study site map of zone D in the FKNMS and survey sites Western Dry Rocks (WDR), Sand Key SPA (SDK), Nine Foot Stake (NFS), Number 1 Marker (N1M), Western Sambo ER (WSB), Eastern Sambo SUA (ESB), Looe Key SPA (LKP), and Looe Key SUA (LKU).
Diversity 14 00153 g001
Figure 2. SfM orthomosaics for (a) Sand Key SPA, (b) Nine Foot Stake, (c) Western Sambo ER, (d) Eastern Sambo SUA, and (e) Looe Key SPA. Imagery collected post-Hurricane Irma in September 2018.
Diversity 14 00153 g002
Figure 3. SfM-derived bathymetry for sites (a) Sand Key SPA (SDK), (b) Nine Foot Stake (NFS), (c) Western Sambo ER (WSB), (d) Eastern Sambo SUA (ESB), and (e) Looe Key SPA (LKP).
Diversity 14 00153 g003
Figure 4. Canonical discriminant analyses (left) and MANOVA-based clusters (right) for RVC data pre-Irma (a,b) versus post-Irma (c,d). Site symbols indicate level of protection: fished (squares), ER (circles), SPA (open circles), and SUA (stars). See Table 2 for data source and habitat variable definitions.
Diversity 14 00153 g004
Figure 5. Percent cover of habitat variables collected among sites in the lower Florida Keys during RVC surveys (15 m diameter) before Hurricane Irma: (a) mean depth, (b) vertical hard relief, (c) vertical soft relief, (d) surface hard relief, (e) abiotic hardbottom, (f) abiotic rubble, (g) abiotic sand, (h) biotic algae > 1 cm, (i) biotic coral, (j) biotic octocoral, (k) biotic sponge. The central red line represents the median, and the 25th and 75th percentiles are shown as the upper and lower limits respectively.
Diversity 14 00153 g005aDiversity 14 00153 g005b
Figure 6. Percent cover of habitat variables collected among sites in the lower Florida Keys during RVC surveys (15 m diameter) after Hurricane Irma: (a) mean depth, (b) vertical hard relief, (c) vertical soft relief, (d) surface hard relief, (e) abiotic hardbottom, (f) abiotic rubble, (g) abiotic sand, (h) biotic algae > 1 cm, (i) biotic coral, (j) biotic octocoral, (k) biotic sponge. The central red line represents the median, and the 25th and 75th percentiles are shown as the upper and lower limits respectively.
Diversity 14 00153 g006
Figure 7. Canonical discriminant analyses (left) and MANOVA-based clusters (right) for digital elevation model (DEM) variables (a,b) and structure-from-motion (SfM) orthomosaic variables (c,d). Site symbols indicate level of protection: fished (squares), ER (circles), SPA (open circles), and SUA (stars). See Table 3 for data source and habitat variable definitions.
Diversity 14 00153 g007
Figure 8. Percent cover of habitat variables collected from the digital elevation models of mapped sites after Hurricane Irma and 30-m scan line analysis: (a) mean depth, (b) median depth, (c) coral reef rugosity index, (d) rms roughness, (e) relief, (f) slope, (g) vector terrain ruggedness, (h) surface area to planar area ratio. The central red line represents the median, and the 25th and 75th percentiles are shown as the upper and lower limits respectively. Outliers are denoted as red ‘+’ symbols.
Diversity 14 00153 g008
Figure 9. Percent cover of habitat variables collected from each mapped site’s orthomosaic tiles annotated in MATLAB ImageLabeler: (a) submassive boulder corals, (b) encrusting dome corals, (c) branching corals, (d) sponge, (e) macroalgae, (f) rubble, (g) encrusting zoanthid. The central red line represents the median and the 25th and 75th percentiles are shown as the upper and lower limits respectively. Outliers are denoted as red ‘+’ symbols.
Diversity 14 00153 g009
Table 1. Summary of the number of RVC and structure-from-motion (SfM) photogrammetry surveys conducted at each site between 2017 and 2018. Post-Irma surveys were conducted starting in December 2018. SfM models that were not successful in the AgiSoft Metashape reconstruction workflow are denoted (*). Not sampled = NS.
Method RVC SfM
SiteFeb-17May-17Jul-17Dec-17Feb-18Jun-18Sep-18Dec-18SumSep-18
Fished23331322192
N1M 111 1 4NS
NFS1111 11171
WDR111111118*
SPA13321333193
LKP 11 111161
SDK 111 11161
WSB1111 11171
SUA12221222141
ESB1111 11171
LKU 11111117*
Grand Total48873877525
Table 2. Summary and descriptions of RVC habitat variables collected Pre-Irma and Post-Irma 20172018. N = 3 Pre-Irma and N = 5 Post-Irma.
GroupHabitat MetricDescriptionVariable Name
Environmental DataDepth (m)Maximum depth depth
Visibility (m) Horizontal visibility at depthviz
Structural ComplexityMax. hard vertical relief (m)Maximum height of hard relief (coral, coralline spur, hardbottom ledge)v-hard
Max. soft vertical relief (m)Maximum height of soft relief (e.g., octocorals, sponges, macroalgae)v-soft
Surface Relief CoverHard relief surface cover (%)Percentage of hard relief <0.2, 0.2–0.5, 0.5–1.0, 1.0–1.5, and >1.5 m in height. s-hard
Soft relief surface cover (%)Percentage of soft relief <0.2, 0.2–0.5, 0.5–1.0, 1.0–1.5, and >1.5 in height. s-soft
Abiotic FootprintAbiotic sandPercentage cover of coarse or biogenic sand a-sand
Abiotic rubblePercentage cover of coarse gravel to unconsolidated rock or dislodged coral fragmentsa-rubble
Abiotic hardbottomPercentage of consolidated lithogenic/biogenic substratum including dead corala-hard
Biotic CoverBiotic algae <1 cmPercentage of hardbottom covered in algae <1 cm height (e.g., turf algae)b-algae1
Biotic algae >1 cmPercentage of hardbottom covered in algae >1 cm height (e.g., Halimeda, Dictyota)b-algae2
Biotic live coralPercentage of live coral coverb-coral
Biotic octocoralPercentage of octocoral coverb-octo
Biotic spongePercentage sponge coverb-sponge
Table 3. Summary of SfM model statistics by site. Average point density is the average number of dense cloud points per cell in the DEM. Each DEM cell is 0.005 m × 0.005 m.
SiteCamera ImagesMap area
(m2)
Avg. Point Density/CellDepth (m)
MeanSDMedianMin–Max
Sand Key (SPA)62581092385.30.905.41.9–7.1
Nine Foot Stake95691037506.70.777.03.8–7.7
Western Sambo (ER)70741005494.30.624.42.0–5.8
Eastern Sambo (SUA)4815765175.10.815.21.7–6.4
Looe Key (SPA)12,809107967.30.757.44.3–8.9
Table 4. Summary and descriptions of photogrammetry habitat variables collected for benthic composition analysis. Software utilized are also listed. Hard live coral cover was the sum of percent cover for the three trait-based coral groups (*).
GroupHabitat MetricDescriptionSoftware/LicenseVariable Name
Habitat complexity—Digital Elevation Model (0.5 cm res.)Depth (m)Depth of water relative to MLWArcMap/BTMdepth
Slope (o)Angle of seabed relative to a horizontal surface ArcMap/BTMslope
Vector terrain ruggedness Dispersion of surface normal vectors over a 3 × 3 cell neighborhood. ArcMap/BTMvrm
Surface area to planar area ratio (SAPA)Rugosity evaluated across each 3 × 3 cell neighborhoodArcMap/BTMsapa
Root mean square roughnessStandard deviation of depths along transect lineMATLABrms
Digital reliefRange of depths along transect line MATLABrelief
Coral reef rugosityRatio of contour line to straight horizontal distanceMATLABcrrug
Habitat Composition—Orthomosaic (1 mm res)Hard live coral * cover (%) Percentage of live hard/stony coral coverMATLAB Image Labelerlive coral
Sponge cover (%)Percentage of sponge coverMATLAB Image Labelersponge
Macroalgal cover (%)Percentage of macroalgal turfs on the sandy bottom/groovesMATLAB Image Labelermacroalgae
Rubble cover (%)Percentage of coarse gravel, unconsolidated rock, or dislodged coral fragments coverMATLAB Image Labelerrubble
Density of octocoralsNumber of octocorals per sq. m MATLAB Image Labelerden-octo
Encrusting Zoanthid cover (%)encrusting zoanthid Palythoa caribaeorumMATLAB Image Labelerzoan
Trait-Based Coral Groups *submassive boulder (%)Starlet Coral (Siderastera sidera, S. radians), Star Coral (Montastrea cavernosa, Orbicella annularis, O. faveolata, O. frankski)MATLAB Image Labelersubmassive
encrusting dome (%)Mustard Hill Coral (Porites astreoides), Brain Coral (Colpophyllia natans, Pseudodiploria. clivosa, Diploria labyrinthiformis)MATLAB Image Labelerencdome
branching (%)Staghorn Coral (Acropora cervicornis, A. palmata), Finger Coral (Porites porites), Yellow pencil coral (Madracis auretenra)MATLAB Image Labelerbranch
Table 5. ANOVA results for RVC surveys before and after Irma.
Before Irma
SourcedfSourceFProb > F
Sites7depth6.05<0.01
Error12v-hard relief0.940.51
‘Total’19v-soft relief0.870.55
s-hard relief2.910.05
a-hardbottom0.650.71
a-rubble3.310.03
a-sand2.090.13
b-algae1.490.26
b-coral0.790.61
b-octo2.000.14
b-sponge0.490.83
After Irma
SourcedfSourceFProb > F
Sites7depth5.86<0.01
Error24v-hard relief3.070.02
‘Total’31v-soft relief0.850.56
s-hard relief2.060.09
a-hardbottom4.09<0.01
a-rubble0.890.53
a-sand1.990.10
b-algae1.650.17
b-coral1.160.36
b-octo1.880.12
b-sponge0.920.51
Table 6. ANOVA results for DEM habitat variables.
DEM
SourcedfSourceFProb > F
Sites4mean depth60.97<0.01
Error28median depth73.28<0.01
‘Total’32crrug45.25<0.01
rms1.560.17
relief1.530.10
slope3.110.02
vrm3.85<0.01
sapa4.56<0.01
Table 7. ANOVA results for SfM habitat variables.
SfM
SourcedfSourceFProb > F
Sites4submassive boulder6.66<0.01
Error745encrusting dome24.15<0.01
Total749branching8.32<0.01
sponge23.86<0.01
macroalgae10.53<0.01
rubble14.57<0.01
encrusting zoanthid12.64<0.01
Publisher’s Note: MDPI stays neutral with regard to jurisdictional claims in published maps and institutional affiliations.

