Article

Genetic Diversity and Maternal Lineage of Indo-Pacific Bottlenose Dolphin (Tursiops aduncus) in the Andaman Sea of Thailand

by
Wareerat Prasitwiset
1,
Chutima Wongfu
1,
Anocha Poommouang
1,
Kittisak Buddhachat
2,3,
Janine L. Brown
4,
Siriwadee Chomdej
2,5,
Jatupol Kampuansai
5,
Patcharaporn Kaewmong
6,
Kongkiat Kittiwattanawong
6,
Korakot Nganvongpanit
1,2,7 and
Promporn Piboon
1,*
1
Department of Veterinary Biosciences and Public Health, Faculty of Veterinary Medicine, Chiang Mai University, Chiang Mai 50100, Thailand
2
Excellence Center in Veterinary Bioscience, Chiang Mai University, Chiang Mai 50200, Thailand
3
Department of Biology, Faculty of Science, Naresuan University, Phitsanulok 65000, Thailand
4
Center for Species Survival, Smithsonian Conservation Biology Institute, Front Royal, VA 22630, USA
5
Department of Biology, Faculty of Science, Chiang Mai University, Chiang Mai 50200, Thailand
6
Phuket Marine Biological Center, Phuket 83000, Thailand
7
Center of Elephant Health and Wildlife, Chiang Mai University, Chiang Mai 50200, Thailand
*
Author to whom correspondence should be addressed.
Diversity 2022, 14(12), 1093; https://doi.org/10.3390/d14121093
Submission received: 11 October 2022 / Revised: 8 December 2022 / Accepted: 8 December 2022 / Published: 9 December 2022
(This article belongs to the Collection Genetic Diversity)

Abstract

:
Indo-Pacific bottlenose dolphins (Tursiops aduncus) are a coastal species found in Thai waters off the coasts of the Andaman Sea and the Gulf of Thailand. This species was recently re-listed as near-threatened by the IUCN Red List, though the population status in Thai seas is not known. Here, we investigated genetic diversity, population structure, maternal lineage, and demographics by analyzing skin tissue samples (n = 30) of T. aduncus stranded along the Andaman coastline of Thailand between 1990 and 2019. This study was based on 11 microsatellite loci and 265 bp mtDNA control regions compared to data available through the National Center for Biotechnology Information (NCBI). From microsatellites, the observed heterozygosity (Ho) ranged from 0.46 to 0.85. The mean fixation index (F) value for all loci was 0.10 ± 0.04, which suggests some degree of inbreeding. Two genetic clusters (the most likely K at K = 2) were observed in T. aduncus through the population structure analysis using multiple criteria. For the mtDNA control region, a total of 17 haplotypes were found for dolphins in Thai seas (14 haplotypes from our samples; three haplotypes from the NCBI database) with high levels of haplotype diversity (h) at 0.926 ± 0.027 and nucleotide diversity (π) at 0.045 ± 0.002. A decline in the effective population size from 0.05 million years ago also was observed in Thai T. aduncus through Bayesian Skyline Plots analysis. A unique set of haplotypes was identified in our samples, which may have originated from the Australian and Indian Oceans rather than the Western Pacific Ocean. These results improve our understanding of the maternal lineage of the Indo-Pacific bottlenose dolphin, which can be used for monitoring population status and establishing better conservation plans for this species in the Thai Andaman Sea.

Graphical Abstract

1. Introduction

Indo-Pacific bottlenose dolphins (Tursiops aduncus) are found in shallow coastal and inshore waters of the Indian Ocean, Australia, and Southeast Asia, including the Gulf of Thailand and the Thai Andaman Sea [1,2,3], while another closely related species in genus Tursiops, the common bottlenose dolphin (Tursiops truncatus), has been found to occur in the same areas throughout their distribution range. However, T. truncatus are considered rare for Thai waters and are unlikely to be found in these areas [3,4]. T. aduncus is a coastal species that has been impacted by natural events such as morbillivirus [5,6], parasites [7], and human activities such as marine pollution [8,9], dolphin-watching tourism [10,11], and the most dominant threat, bycatch fisheries [1,12,13,14,15]. Until recently, T. aduncus were listed as data deficient by the International Union for Conservation of Nature’s Red List of Threatened Species (IUCN Red List); however, in 2019, their status was changed to near-threatened [1]. The species is also listed as a protected marine mammal by the Wild Animal Reservation and Protection Act 2019 of Thailand [16]. The occurrence of T. aduncus along the Thai Andaman Sea coastline, including Phangnga and Phuket province, has been reported [2]; however, knowledge pertaining to population status is not known, especially for species inhabiting Thai waters.
Top marine predators such as dolphins and other small cetaceans play an important role in shaping marine biological structures and communities [17], so the prevention of population declines is key to sustaining marine ecosystems. A number of genetic studies of T. aduncus have been conducted across their distribution range in the waters of South Africa [12], Australia [18], China [19], the northwest Indian Ocean [20], Taiwan, Japan, and the Philippines [21] to evaluate population health and understand evolutionary processes. For example, a study in southern Australia found that T. aduncus populations were impacted by dolphin-watching tourism based on seven microsatellite loci and the mtDNA control region [18]. The results identified separate populations with relatively low levels of mtDNA genetic diversity, and suggested that these discrete management units need specific, targeted management approaches. For effective species conservation, it is important to identify factors related to habitat usage, estimated population numbers, specific threats, population status, and connections to other regions, information that is generally lacking for T. aduncus inhabiting Thai waters. To date, genetic data are available only from one study of the Thai Andaman Sea population using an inter simple sequence repeat (ISSR) technique [22]. Lacking from that study, which used only nDNA, was information still needing to be discovered, such as maternal genetic diversity, the origin of the population, demographic changes over time, and connections between dolphin populations inhabiting the Thai Andaman Sea and other areas. Carcasses of this and other cetacean species are found stranded along both coasts of Thailand every year [23], which offers an opportunity to study population dynamics through DNA analysis of skin tissue samples.
To obtain more complete genetic information pertaining to the population of this species in the Thai Andaman Sea, this study aimed to reveal more information about their genetic diversity including maternal genetic diversity, population structure, maternal lineage compared to global populations, and demographic changes through both nDNA microsatellite markers and mtDNA control region analyses. The results are important for monitoring the population status of T. aduncus and understanding more about their maternal lineage and origin, information needed to fill knowledge gaps for this species left over from previous studies. Moreover, this information can be used for establishing conservation plans for dolphins living in Thai Andaman waters going forward.

2. Materials and Methods

2.1. Sample Collection and DNA Extraction

Skin samples of 30 deceased, stranded T. aduncus were provided by the Phuket Marine Biological Center, Phuket, Thailand, which has collected tissue samples from stranded dolphins along Thai Andaman Sea coast since 1990 (Figure 1). Initial species identification was based on morphological appearance at stranding sites by veterinarians from the Phuket Marine Biological Center. The samples were collected and preserved in 95% ethanol at −20 °C. DNA was extracted from skin tissue using DNA extraction kits according to the manufacturer’s instructions (DNeasy® Blood & Tissue Kit, QIAGEN, Germany) at the Faculty of Veterinary Medicine, Chiang Mai University. The DNA was measured qualitatively and quantitatively by agarose gel electrophoresis and spectrophotometry, respectively. These samples were diluted to a final concentration of 10 ng/µL for amplification.

2.2. Microsatellite Amplification and Genotyping

Twenty microsatellite loci were amplified and screened using a polymerase chain reaction (PCR) technique (see all microsatellite loci in Table S1). PCR reactions were performed in 25 μL volumes, containing 10 ng/µL DNA template, 0.2 mM dNTPs (Vivantis, Selangor Darul Ehsan, Malaysia), 0.2 µM of each primer (forward primer was 5′ M13 complementary tail to enable labeling with a fluorescent M13 primer), 1X PCR buffer, 1 U Taq DNA polymerase (Vivantis, Selangor Darul Ehsan, Malaysia), and 15.8 µL deionized water. PCR amplifications were performed in a PTC-200 DNA Engine Thermal Cycler (Bio-Rad Laboratories, Inc., Hercules, CA, USA). PCR conditions were as follows: pre-denaturation at 95 °C for 5 min, followed by 40 cycles of 95 °C for 30 s, at an optimal annealing temperature (Supplementary Material Table S1) for 45 s, 72 °C for 1 min, and the final extension step at 72 °C for 10 min. The PCR products were stained using RedSafeTM Nucleic acid staining solution (iNtRON Biotechnology, Gyeonggi-do, Republic of Korea) and separated by electrophoresis on 2% agarose gel (PanReac AppliChem ITW companies, Darmstadt, Germany) by PowerPac 200 (Bio-Rad, Hercules, CA, USA) containing 1X Tris-acetate-ethylenediamine 8 tetraacetate (TAE) buffer at 120 V for 30 min. The PCR products were visualized by UV light under a GelMax 125Imager (UVP, Cambridge, UK). Fragment analysis was performed using the Applied Biosystems® 3730XL-96 GENETIC ANALYZER (Thermo Fisher Scientific®, Waltham, MA, USA) Ward Medic Ltd. Bangkok, Thailand. The size of amplified microsatellite markers was determined manually through visual inspection of the sequencer traces using the program GENE MARKER version 2.6.2 [24]. Micro-Checker version 2.2.3 [25] was then used to test for genotyping errors such as null alleles, allele drop-out, and stuttering.

2.3. Control Region (D-Loop) Primer and Amplification

One pair of PCR primers designed for dugongs—forward (5′-CATATTACAACGGTCTTGTAAACC-3′) and reverse (5′-GTCATAAGTCCATCGAGATGTC-3′) [26]—was used to amplify the mitochondrial DNA control region of T. aduncus as the universal primers. This pair of primers has the ability to amplify the tRNA-Pro gene to the middle of the control region (D-loop), as shown for many other cetacean species [27,28,29]. PCR reactions were conducted in 25 µL reaction volumes consisting of 1X reaction buffer, 2 mM MgCl2, 0.4 mg/mL bovine serum albumin, 0.25 mM dNTPs, 0.4 µM of both forward and reverse primers, 5 U/µL platinum Taq DNA polymerase (Invitrogen), and 10 ng/µL of the DNA sample. PCR conditions were performed as follows: 95 °C for 5 min, 40 cycles of 95 °C for 30 s, 50 °C for 45 s, 72 °C for 1 min, and 72 °C for 10 min. The PCR products were stained using RedSafeTM nucleic acid staining solution (iNtRON Biotechnology, Gyeonggi-do, Republic of Korea) and separated by electrophoresis on 2% agarose gel (PanReac AppliChem ITW companies, Darmstadt, Germany) by PowerPac 200 (Bio-Rad, Hercules, CA, USA) containing 1X Tris-acetate-ethylenediamine tetraacetate (TAE) buffer at 120 V for 30 min and viewed under ultraviolet light. Sequencing analysis was performed by ATGC Co., Ltd. Pathumthani, Thailand, using the 3730XL-96 GENETIC ANALYZER (Thermo Fisher Scientific®, MA, USA). To ensure accurate species identification, all sequences were then confirmed against the reference sequence of T. aduncus using the Basic Local Alignment Search Tool (BLAST).

2.4. Data Analysis

2.4.1. Microsatellite Analysis

The polymorphism levels of each microsatellite loci, including deviation from Hardy–Weinberg Equilibrium (HWE), observed number of alleles (Na), effective number of alleles (Ne), observed heterozygosity (Ho), expected heterozygosity (He), Shannon’s information index (I), and Fixation Index (F), were analyzed by the GENALEX program version 6.5 [30]. The statistical forensic parameters used to identify the probability that the microsatellite loci used had enough power to distinguish individuals, including combined power of discrimination (PD), matching probability (MP), and power of exclusion (PE), were calculated by the GENALEX program version 6.5 [30].
The Bayesian clustering methods implemented in STRUCTURE version 2.3.4 [31] were used to group individuals into populations on the basis of microsatellite genotypes with different distributions of genetic variants amongst populations. The analysis was performed without the LOCPRIOR model. This method used a Markov Chain Monte Carlo (MCMC) repetition for values of K = 1 to K = 10 to test for the presence of population structure and to estimate the number of populations, using the admixture population model, 1,000,000 iterations, 100,000 burn-in replicates, and 10 independent replicates per K value. The most likely K value was defined using multiple criteria, including the Pritchard method (Pr[X|K]) [31], the Evanno method (ΔK) [32], and the Parsimony index (PI) [33], by KFinder version 1.0.0.0 [33] to identify the optimal number of clusters in the data. The outputs were then graphically modified by DISTRUCT [34].
Principal component analysis (PCA) was conducted to discriminate between population groups in the dataset and confirm the population structure using the function dudi.pca of adegenet package [35] complemented in Rstudio version 3.5.2 (RStudio Team (2020). Rstudio: Integrated Development for R. Rstudio, PBC, Boston, MA, USA, URL http://www.rstudio.com/ accessed on 31 October 2022).

2.4.2. Mitochondrial DNA Control Region Analysis

To investigate the maternal relationship of Thai T. aduncus compared to other populations worldwide, we analyzed a total of 232 mtDNA control region sequences obtained from this study and GenBank (see accession number in Table S2). All sequences were aligned manually to reduce the length for comparison at consensus length of 265 bp implemented with Crustal W by MEGA-X version 10.2.2 [36]. These sequences represented 14 regional populations: Thailand (THA); Bangladesh (BGD); Oman (OMN); Pakistan (PAK); China (CHN); China, Taiwan, and Japan (MIX); Indonesia (IDN); China and Taiwan (CHN/TWN); Taiwan (TWN); South Africa (ZAF); Japan (JPN); Australia (AUS); Melanesia (MLN); and Iran (IRN). The haplotype diversity and nucleotide diversity of the mtDNA control region were determined using the DnaSP program version 6.12.3 [37]. The median joining networks (MJNs) were used for illustrating the haplotypes’ relationship using PopART version 1.7 [38].

2.4.3. Phylogenetic Tree Construction

The phylogenetic tree of mtDNA control region sequences of worldwide T. aduncus was constructed using Bayesian analysis implemented by MrBayes version 3.2.7 [39]. The mtDNA control region sequence of Atlantic spotted dolphin (Stenella frontalis: accession number EF682840) was used as an outgroup for the phylogenetic tree. To select the best tree evolutionary models, jModelTest version 2.1.10 [40] was used, which defined it as HKY + G. Two independent analyses were run simultaneously with four chains by the default setting of the MrBayes program. The phylogenetic tree was constructed on the run length of Markov Chain Monte Carlo (MCMC) at 25,000,000 iterations, sampled every 5000 steps using the average standard deviation of split frequencies below 0.01 as the convergence diagnostics. The first 100,000 iterations were discarded as burn-in. The robustness of phylogenetic branching was assessed by posterior probabilities (PP). The phylogenetic tree was then illustrated using iTOL version 6.1.1 [41].

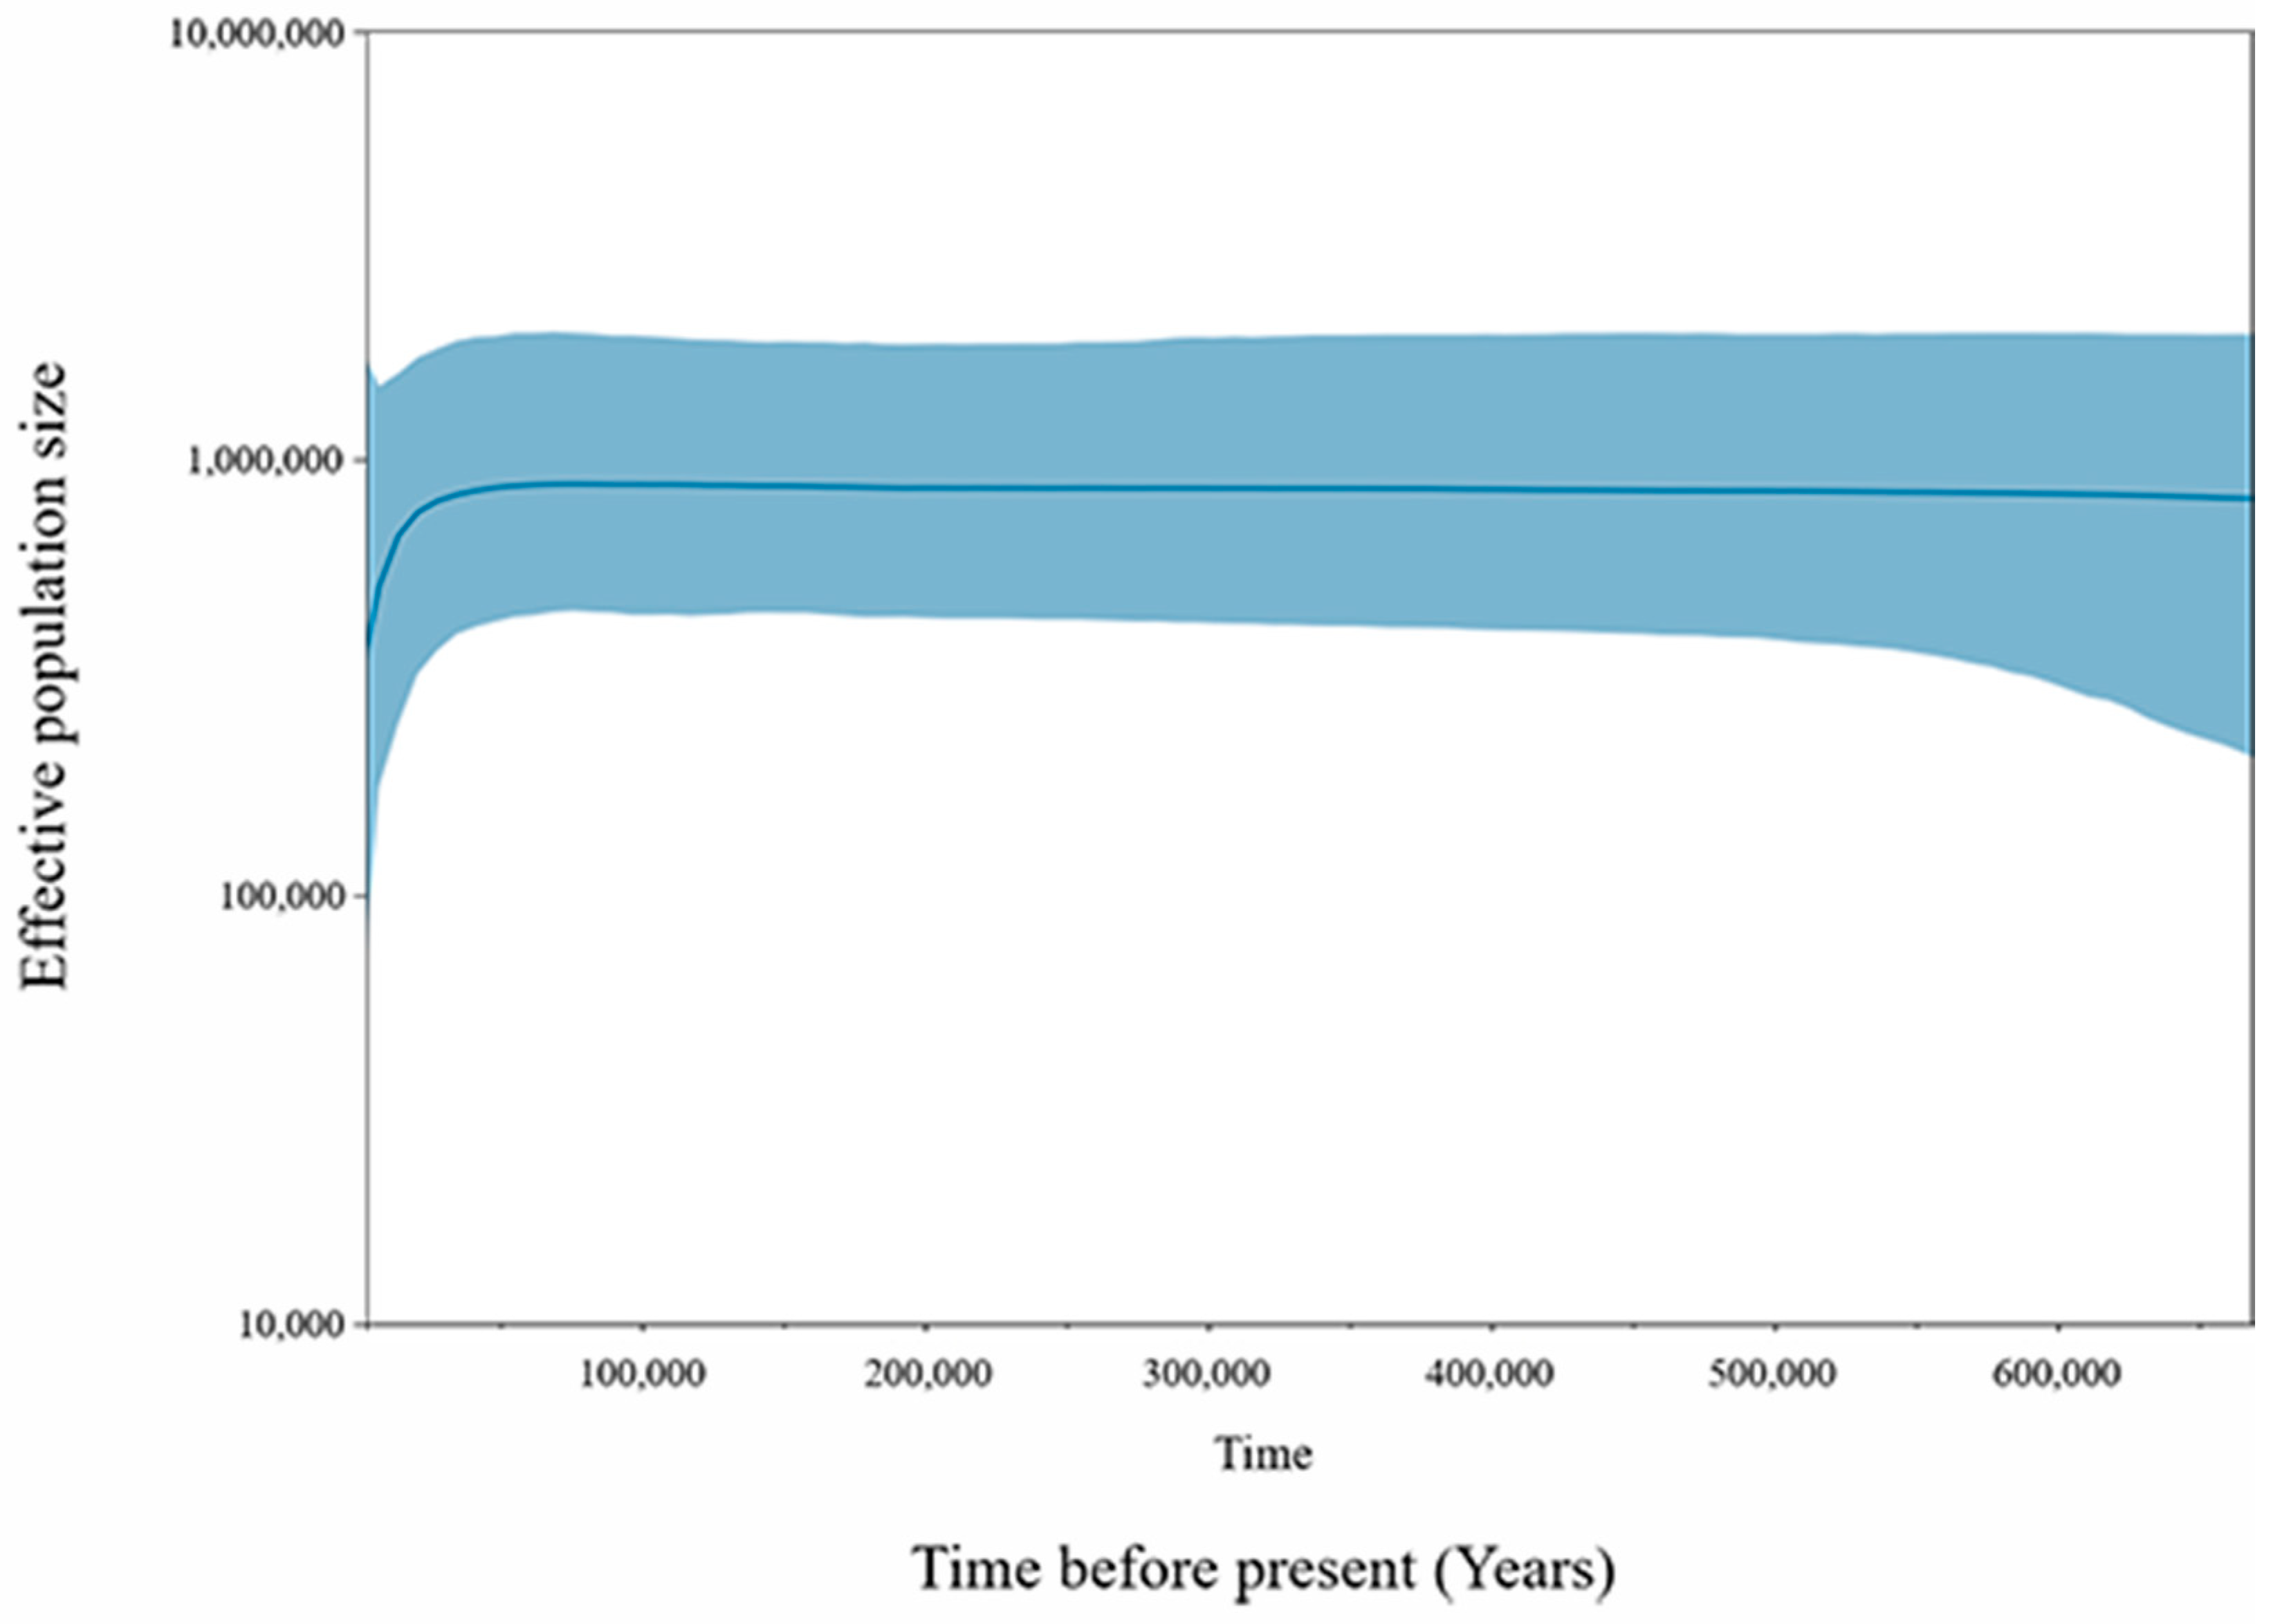
2.4.4. Bayesian Skyline Plots (BSPs)

For inferring demographic changes in Thai T. aduncus populations, Bayesian Skyline Plots (BSPs) were implemented in BEAUti and BEAST version 2.6.3 [42]. The substitution model and a strict clock model were used for the dataset of mtDNA control region sequences over 10,000,000 iterations, sampled every 1000 steps. The first 1,000,000 iterations were used as a burn-in step. The mutation rate of the mtDNA genome of T. aduncus at 0.0307 substitutions/site/million year that had been estimated by Moura et al. (2013) [43] was used for molecular clock calibration. The BSPs were then visualized using Bayesian skyline reconstruction executed in Tracer version 1.7.1 [44].

3. Results

3.1. Microsatellite Primers and Genetic Diversity

Genetic diversity results using microsatellite DNA markers found that 16 of 20 primers were successfully amplified from the 30 tissue samples of T. aduncus from the Thai Andaman Sea (Table 1). A further five loci were excluded from the analysis, showing signs of null alleles. A total of 11 microsatellite loci were then used for the subsequent analyses. Testing found that all 11 primers significantly deviated from the HWE, except for primer Sl9-69 (Table 1). For the observed heterozygosity, primer Sd8 had the highest variations (Ho = 0.85), while primer Slo4 had the lowest variation (Ho = 0.46). The mean Fixation Index value for all loci was 0.10 ± 0.04, which means there was a low level of inbreeding.

3.2. Microsatellite Forensic Parameter

For the estimation of forensic parameters of 16 primers used for Thai T. aduncus, the results found that both the combined power of discrimination (PD) and the power of exclusion (PE) were greater than 0.999, while matching probability (MP) was 1.53 × 10⁻¹¹. This means over 100 billion individuals had the same genetic makeup as one Thai T. aduncus.

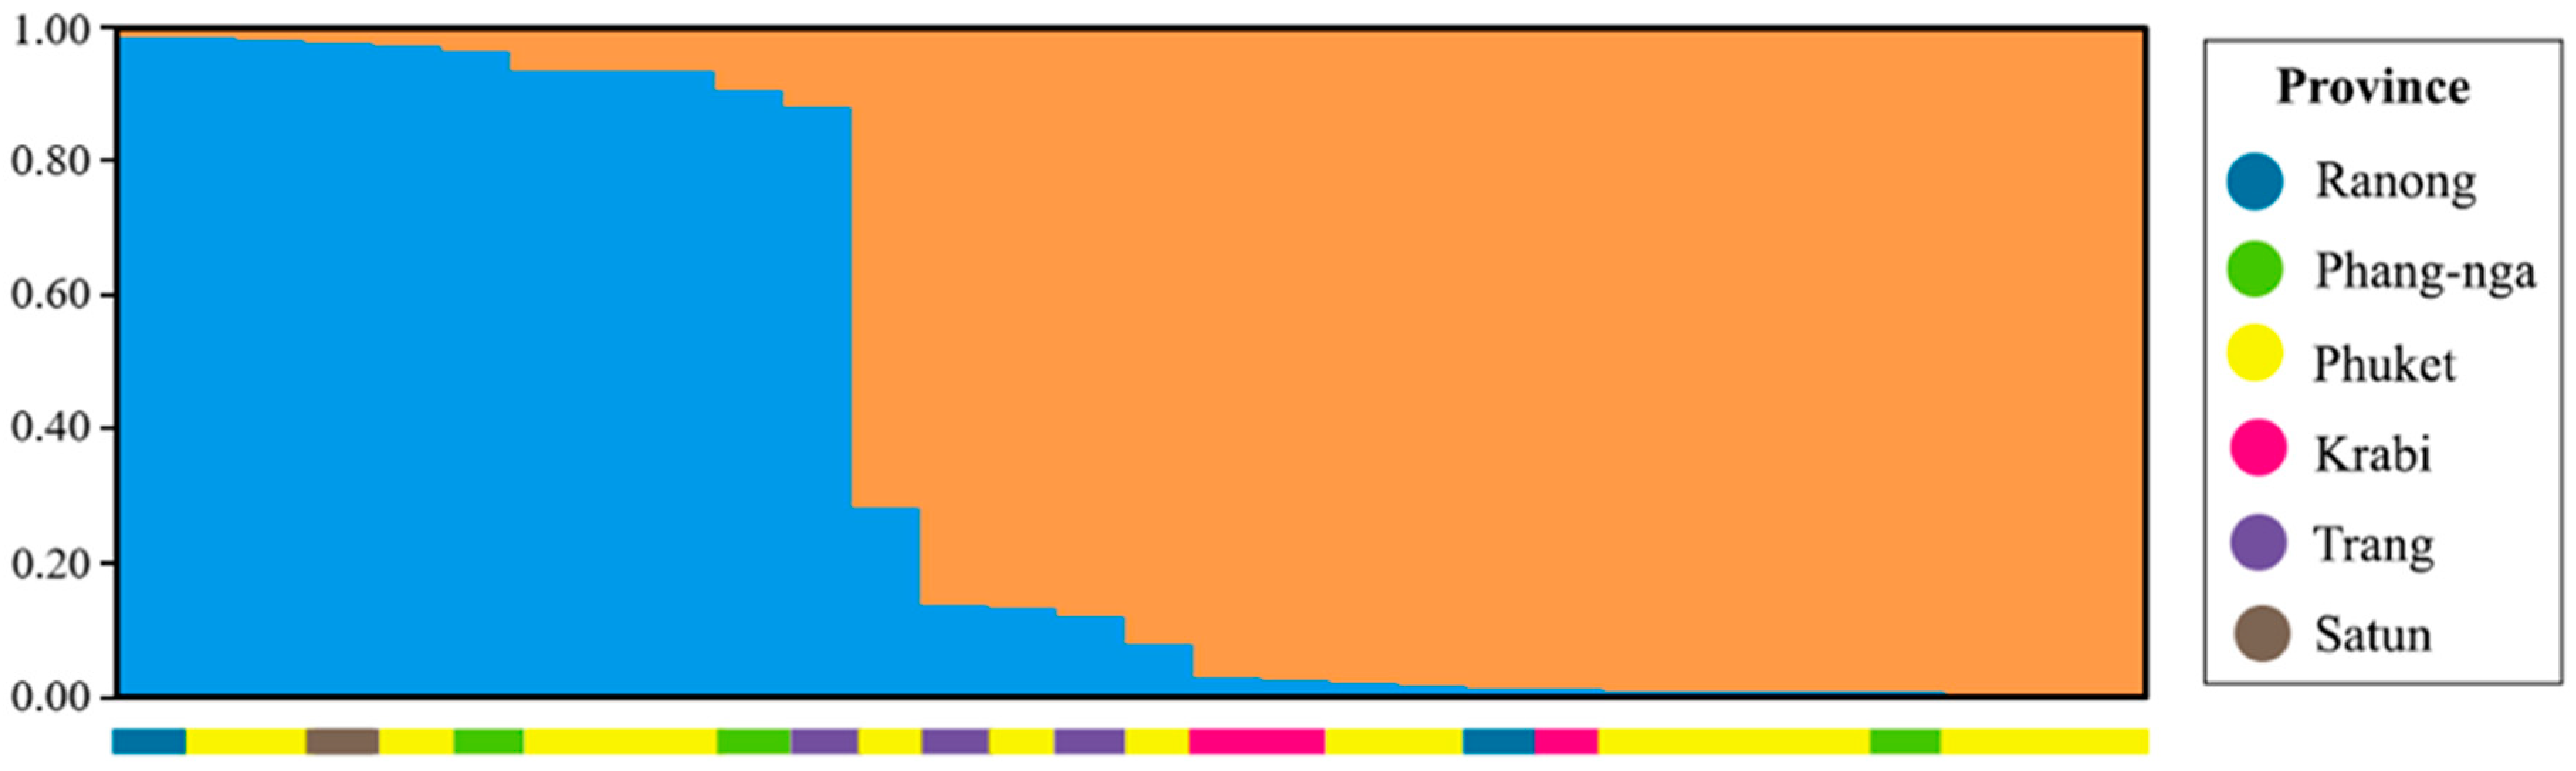
3.3. Population Structure

For the results from STRUCTURE and KFinder, the most likely K for both ΔK and PI were at K = 2, while K = 4 was observed for Pr[X|K]. Thus, the optimal number of genetic clusters at K = 2 was chosen, which depicted two genetic clusters for T. aduncus in the Thai Andaman Sea in orange and blue without the grouping by location of stranding (Figure 2). The individuals of the dominant orange color had a higher proportion than the blue clustering, accounting for 63.33% and 36.67%, respectively. The most likely K at K = 2 also agreed with the results of clustering from PCA (Figure 3). For PCA, only one cluster was observed with 10 individuals that were clearly distinct from the others (Figure 3).

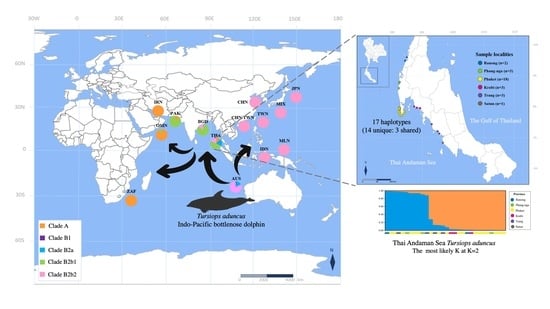
3.4. Mitochondrial DNA

According to the analysis of 232 mtDNA control region sequences worldwide, a total of 109 haplotypes were found, with high levels of haplotype diversity at 0.970 ± 0.006 and nucleotide diversity at 0.042 ± 0.001 (Table 2). For our samples from the Thai Andaman Sea, there were 14 haplotypes (accession number MZ401176—MZ401205) found with haplotype diversity (h) at 0.910 ± 0.032 and nucleotide diversity (π) at 0.043 ± 0.003. Haplotypes H1–H14 were from this study. Most of these haplotypes (H1–H10, H12, H13) were clustered with haplotypes from the Indian Ocean (BGD, PAK, OMN, IRN, and ZAF), as shown in Figure 4. An additional three haplotypes from Thai seas, namely H24, H74, and H85, were first revealed in the NCBI database by Gray et al. (2022) [45]. These three haplotypes and two others (H11 and H14) from Thailand were found in the Pacific Ocean haplogroup (Figure 4). Among these 17 haplotypes from Thailand, 14 (H1–H5, H7, H9–H14, H74, and H85) were unique for Thai seas, while only three were shared with other locations (H6 shared with BGD and OMN; H8 shared with BGD, OMN, and PAK; H24 shared with IDN and CHN) (Figure 4). Thus, the combined haplotype and nucleotide diversity levels for all 17 haplotypes from Thai seas were 0.926 ± 0.027 and 0.045 ± 0.002, respectively.
The results from the phylogenetic tree found there were five clades with individuals from different oceans (Figure 5a). Individuals from the Indian Ocean were found in nearly all clades (four of five clades), but predominated in clade A and B2b1, while individuals from the Western Pacific Ocean were only found in clade B2b2. Samples of Thai T. aduncus were found scattered throughout the phylogenetic tree, but were most common in clades B2a and B2b1. These two clades also contained animals from other locations, including Thailand (THA), Bangladesh (BGD), Oman (OMN), Pakistan (PAK), and Australia (AUS). The geographic distribution of T. aduncus by clades of the phylogenetic tree is shown in Figure 5b. The BSP analysis of Thai T. aduncus is shown in Figure 6. The effective population size had been continuously expanding from before 0.6 million years ago and then stabilized, until drastically decreasing around 50,000 years ago (Figure 6).

4. Discussion

The results of this study have led to a better understanding of population genetic relationships of T. aduncus in the Thai Andaman Sea. The 11 microsatellite markers used in this study were sufficient to estimate genetic diversity and the population structure. Based on the small MP value, there was a low level of probability of finding two random individuals sharing the same genetic makeup [61]. However, deviation from HWE and lower heterozygosity (mean Ho < He) were detected by using these microsatellite loci for the Thai Andaman Sea population. Additionally, the positive value of mean F was a low level, which means there could have been a small degree of inbreeding. However, a deficiency in heterozygosity could also occur with a mix of two sub-populations that breed mostly within the sub-populations but not between them, thus resulting in a decrease in fitness for the heterozygotes [62]. Thus, it is possible there is a large population in the Thai Andaman Sea, which may consist of several disconnected subpopulations where mating is restricted only within subgroups and with a lack of gene flow between subgroups. A fragmentation of populations for T. aduncus also has been observed in Western Australia, determined by site fidelity of resident and non-resident groups [63]. Niche partitioning for two populations of T. aduncus in shallow and offshore waters around Mayotte Island also has been reported [64]. The results of the population structure analysis from our study also support this contention as they show two genetic clusters confirmed by the clustering of PCA, suggesting that undiscovered populations could exist in this area. Thus, further studies with more samples throughout the living range of these dolphins are needed to more fully evaluate the management units.
Differences in maternal lineages between African, Pacific, and Indian Ocean T. aduncus populations have been investigated in previous studies [12,21,45,46,49,65,66]; however, knowledge pertaining to the lineage of the Thai T. aduncus population is lacking due to the limited number of samples from Thai seas and knowledge gaps left from the previous study on this population [22]. In a previous study Amaral et al. (2017) [46], a total of 52 haplotypes were found for worldwide T. aduncus using 380 bp of the mtDNA control region. These haplotypes clustered into three haplogroups, namely Pacific, African, and Bangladesh T. aduncus without a sharing of haplotypes and a lack of gene flow across these locations [46]. The results of MJN and phylogenetic tree analyses in our study using 265 bp of the mtDNA control region agree with the haplotype networks generated from the previous study [46], as three putative maternal lineages could be separated from each other (Pacific, African, and Bangladesh T. aduncus).
Moreover, we can observe more evolutionary historical details and fill in knowledge gaps for this species particularly for the Thai Andaman Sea population, which has not been studied in such detail before. The haplotypes from Australia and the Thai Andaman Sea appear to be in the intermediate group between the Pacific and Indian Oceans, including African and Bangladesh haplogroups. Although the haplotypes from Australia were mostly found in Pacific T. aduncus, several of the Australian haplotypes were discrete and more related to haplotypes from the Indian Ocean. Similarly, most of the Thai Andaman Sea haplotypes were located among Australian to Bangladeshi and Pakistani haplotypes, which were also found to be more closely related to Indian Ocean haplotypes. These results are also supported by a previous study using the mitogenome to determine the origin of the genus Tursiops [43], which was found to be derived from a coastal habitat in Australasia. A study of paleogeographic scenarios within the South China Sea also supports this contention, as the lowering of sea levels during the last glacial cycle led to a disconnection between the Indian and Pacific Oceans about 65,000 years ago [67]. Thus, we suggest that most of the Thai Andaman Sea T. aduncus may originate from Australia and were then distributed to the Indian Ocean, rather than coming from the Western Pacific Ocean.
However, there is other evidence that these populations from the Thai Andaman Sea also share a lineage with the West Pacific regions, as some of the Thai haplotypes, including our two haplotypes and the three others from the NCBI database [45], showed a closed relationship to the Pacific T. aduncus. Thus, this could infer a connection of diverse populations found along the Thai Andaman Sea and nearby regions such as Langkawi Island of Malaysia, the Malacca Strait, Singapore, and the Gulf of Thailand [1,2,68]. This may also be the reason for the high value of haplotype and nucleotide diversity for Thai Andaman Sea T. aduncus. The high value of mtDNA diversity in Thai populations may have been aided by the establishment of Marine Protected Areas [69], which potentially lessoned the impacts of negative human activities on animal populations and deserves further investigation.
Female philopatric behavior has been observed in Australian T. aduncus and likely occurs in other populations [70,71]. Food familiarity and rearing behavior were suggested as reasons for natal philopatry, while male T. aduncus often disperse across wider ranges. A lack of mtDNA gene flow between groups could be occurring in populations affected by high levels of human activities, as has been observed in South African waters, where hunting and dolphin-watching tourism are considered to be the major threats for this species [12]. Different levels of impact from human activities in the differing regions could explain varied mtDNA diversity in each population, including those of the Thai Andaman Sea. Thus, regular reassessment of these indices is needed for long-term population monitoring.
The results of the BSP analysis in our study agrees with the T. aduncus demographic changes reported by Vijay et al. (2018) [72]. Using whole-genome sequencing, a decreasing effective population size in the last glacial melting was observed around 0.02–0.05 million years ago [72], which is similar to our study, suggesting that global climate change could have affected these populations in the same time [73]. However, the stable phase in the BSPs should be interpreted cautiously because a small sequence size can reduce the levels of polymorphism or variable sites for BSP analysis and can cause an under-detection of population expansion [74,75]. Thus, in further studies, mitogenome of Thai T. aduncus could potentially be used for observing more details of population change over time.
The length of the consensus fragment mtDNA control region used in our study was adequate for detecting the unique set of haplotypes from T. aduncus in the Thai Andaman Sea; however, three shared haplotypes with other regions were also revealed. This can occur when a short length of consensus fragments is generated. However, shared haplotypes could be separated from each other using longer consensus fragments. For example, in studies of Risso’s dolphins, a total of 85 haplotypes worldwide were detected in 473 bp of a consensus fragment, while 81 haplotypes were found when using a shorter length at 390 bp [28,76]. Thus, for future studies, mitogenome, providing high-resolution phylogeny, should be used to gain more in-depth genetic information on Thai T. aduncus. Additionally, the comparative study of population genetics of this species between Thai Andaman Sea and the Gulf of Thailand populations would be of great interest.

5. Conclusions

This study was successful in revealing genetic variations and the maternal lineage of T. aduncus in the Thai Andaman Sea through analyses of 11 microsatellite loci and the mtDNA control region, which can fill in the knowledge gaps left from the previous study. Although a heterozygote deficit and a small degree of inbreeding were observed for microsatellite loci, it is also possible that several undiscovered populations may have existed in this area. This study also allows us to understand more about the origin of Thai Andaman Sea T. aduncus through the mtDNA analysis, which indicates a close relationship with Australian and India Ocean T. aduncus species, rather than those in the Western Pacific Ocean. While a unique set of haplotypes and a high level of mtDNA diversity were revealed for Thai Andaman Sea T. aduncus in this study, other information pertaining to the specific threats, the efficiency of the Marine Protected Areas, and nearby population genetic information, including in the Gulf of Thailand, are needed to fully understand the biology of this population and develop effective conservation management strategies for T. aduncus in the Thai Andaman Sea.

Supplementary Materials

The following supporting information can be downloaded at: https://www.mdpi.com/article/10.3390/d14121093/s1, Table S1: Primers and annealing temperature of 16 microsatellite loci for Indo-Pacific bottlenose dolphins (Tursiops aduncus) [77,78,79,80]; Table S2: The accession number of Indo-Pacific bottlenose dolphin (Tursiops aduncus) sequences used in this study.

Author Contributions

Data curation, W.P. and C.W.; Formal analysis, W.P. and C.W.; Funding acquisition, K.N.; Investigation, W.P. and C.W.; Methodology, W.P. and C.W.; Project administration, K.N.; Resources, P.K. and K.K.; Software, A.P., J.K., and P.P.; Supervision, K.B., S.C., J.K., K.N., and P.P.; Validation, A.P., K.B., S.C., J.K., K.N. and P.P.; Visualization, J.L.B., K.N. and P.P.; Writing—original draft, P.P.; Writing—review and editing, J.L.B., K.N. and P.P. All authors have read and agreed to the published version of the manuscript.

Funding

This research was funded by the Excellence Center in Veterinary Bioscience, Chiang Mai University, Chiang Mai 50200, Thailand (number; 009/2022), and the Center of Elephant Health and Wildlife, Chiang Mai University, Chiang Mai 50200, Thailand (2022).

Institutional Review Board Statement

This study was approved by the Animal Use Committee of the Faculty of Veterinary Medicine, Chiang Mai University, Thailand, in 2020 (S14/2563).

Informed Consent Statement

Not applicable.

Data Availability Statement

The accession numbers presented in this study are available in Table S2.

Acknowledgments

We dedicate the value of this research to the Phuket Marine Biological Center, Phuket, Thailand. To this center, we express our deepest gratitude for providing supported samples, data, and additional information that allowed us to fully analyze the results of this study.

Conflicts of Interest

The authors declare no conflict of interest. The funders had no role in the design of the study; in the collection, analyses, or interpretation of data; in the writing of the manuscript, or in the decision to publish the results.

References

  1. Braulik, G.; Natoli, A.; Kiszka, J.; Parra, G.; Plön, S.; Smith, B. Tursiops aduncus. The IUCN Red List of Threatened Species 2019: E. T41714A50381127. Available online: https://dx.doi.org/10.2305/IUCN.UK.2019-3.RLTS.T41714A50381127.en (accessed on 2 September 2022).
  2. Department of Marine and Coastal Resources. Indo-Pacific Bottlenose Dolphin, Tursiops aduncus. Central Database System and Data Standard for Marine and Coastal Resources. 2013. Available online: https://km.dmcr.go.th/c_1/s_96/d_4194 (accessed on 25 August 2022).
  3. Chantrapornsyl, S.; Adulyanukosol, K.; Kittiwathanawong, K. Records of cetaceans in Thailand. Phuket Mar. Biol. Cent. Res. Bull. 1996, 61, 39–63. [Google Scholar]
  4. Cherdsukjai, P.A.I.; Promjinda, S.; Munprasit, A.; Kittiwattanawong, K. Preliminary Survey of Marine Mammals in Gulf of Thailand. In Survey Results of Fisheries Resources and Marine Environment in the Central Gulf of Thailand by SEAF Survey Boat; South East Asian Fisheries Development Centre: Samut Prakan, Thailand, 2013; pp. 137–141. [Google Scholar]
  5. Van Bressem, M.-F.; Duignan, P.J.; Banyard, A.; Barbieri, M.; Colegrove, K.M.; De Guise, S.; Di Guardo, G.; Dobson, A.; Domingo, M.; Fauquier, D. Cetacean morbillivirus: Current knowledge and future directions. Viruses 2014, 6, 5145–5181. [Google Scholar] [CrossRef] [Green Version]
  6. Stephens, N.; Duignan, P.J.; Wang, J.; Bingham, J.; Finn, H.; Lars Bejder, I.; Patterson, A.P.; Holyoake, C. Cetacean morbillivirus in coastal Indo-Pacific bottlenose dolphins, Western Australia. Emerg. Infect. Dis. 2014, 20, 666. [Google Scholar] [CrossRef]
  7. Kleinertz, S.; Hermosilla, C.; Ziltener, A.; Kreicker, S.; Hirzmann, J.; Abdel-Ghaffar, F.; Taubert, A. Gastrointestinal parasites of free-living Indo-Pacific bottlenose dolphins (Tursiops aduncus) in the Northern Red Sea, Egypt. Parasitol. Res. 2014, 113, 1405–1415. [Google Scholar] [CrossRef]
  8. Mapunda, E.C.; Othman, O.C.; Akwilapo, L.D.; Bouwman, H.; Mwevura, H. Concentrations of metallic elements in kidney, liver, and lung tissue of Indo-Pacific bottlenose dolphin Tursiops aduncus from coastal waters of Zanzibar, Tanzania. Mar. Pollut. Bull. 2017, 122, 483–487. [Google Scholar] [CrossRef]
  9. Harino, H.; Ohji, M.; Wattayakorn, G.; Adulyanukosol, K.; Arai, T.; Miyazaki, N. Accumulation of organotin compounds in tissues and organs of dolphins from the coasts of Thailand. Arch. Environ. Contam. Toxicol. 2008, 54, 145–153. [Google Scholar] [CrossRef] [PubMed]
  10. Bejder, L.; Samuels, A.; Whitehead, H.; Gales, N.; Mann, J.; Connor, R.; Heithaus, M.; Watson-capps, J.; Flaherty, C.; Krützen, M. Decline in relative abundance of bottlenose dolphins exposed to long-term disturbance. Conserv. Biol. 2006, 20, 1791–1798. [Google Scholar] [CrossRef] [Green Version]
  11. Lusseau, D.; Higham, J. Managing the impacts of dolphin-based tourism through the definition of critical habitats: The case of bottlenose dolphins (Tursiops spp.) in Doubtful Sound, New Zealand. Tour. Manag. 2004, 25, 657–667. [Google Scholar] [CrossRef]
  12. Natoli, A.; Peddemors, V.M.; Hoelzel, A.R. Population structure of bottlenose dolphins (Tursiops aduncus) impacted by bycatch along the east coast of South Africa. Conserv. Genet. 2008, 9, 627–636. [Google Scholar] [CrossRef]
  13. Shahid, U.; Khan, M.M.; Nawaz, R.; Razzaq, S.A.; Ayub, S. Bycatch Analysis of Tuna Gillnet Fisheries of Pakistan: An Analysis of Bycatch Data from 2013–2015; IOTC-2016-WPEB12-INF11; World Wide Fund for Nature: Karachi, Pakistan, 2016. [Google Scholar]
  14. Temple, A.J.; Wambiji, N.; Poonian, C.N.; Jiddawi, N.; Stead, S.M.; Kiszka, J.J.; Berggren, P. Marine megafauna catch in southwestern Indian Ocean small-scale fisheries from landings data. Biol. Conserv. 2019, 230, 113–121. [Google Scholar] [CrossRef]
  15. Kasuga, M.P.; Varisanga, M.D.; Davenport, T.R.; Jiddawi, N.; Braulik, G.T. Abundance, spatial distribution and threats to Indo-Pacific bottlenose dolphins (Tursiops aduncus) in an Important Marine Mammal Area in Tanzania. West. Indian Ocean J. Mar. Sci. 2022, 21, 1–14. [Google Scholar] [CrossRef]
  16. Department of National Parks Wildlife and Plant Conservation. Wildlife Conservation and Protection Act, B.E. 2562. Thai Government Gazette. 2019. Available online: http://portal.dnp.go.th/Law (accessed on 20 August 2022).
  17. Heithaus, M.R.; Frid, A.; Wirsing, A.J.; Worm, B. Predicting ecological consequences of marine top predator declines. Trends Ecol. Evol. 2008, 23, 202–210. [Google Scholar] [CrossRef]
  18. Wiszniewski, J.; Beheregaray, L.B.; Allen, S.J.; Möller, L.M. Environmental and social influences on the genetic structure of bottlenose dolphins (Tursiops aduncus) in Southeastern Australia. Conserv. Genet. 2010, 11, 1405–1419. [Google Scholar] [CrossRef]
  19. Yang, G.; Ji, G.; Ren, W.; Zhou, K.; Wei, F. Pattern of genetic variation of bottlenose dolphins in Chinese waters. Raffles Bull Zool 2005, 53, 157–164. [Google Scholar]
  20. Gray, H.; Nishida, S.; Welch, A.; Moura, A.; Tanabe, S.; Kiani, M.; Culloch, R.; Möller, L.; Natoli, A.; Ponnampalam, L. Cryptic lineage differentiation among Indo-Pacific bottlenose dolphins (Tursiops aduncus) in the northwest Indian Ocean. Mol. Phylogenetics Evol. 2018, 122, 1–14. [Google Scholar] [CrossRef] [Green Version]
  21. Chen, I.; Nishida, S.; Yang, W.-C.; Isobe, T.; Tajima, Y.; Hoelzel, A.R. Genetic diversity of bottlenose dolphin (Tursiops sp.) populations in the western North Pacific and the conservation implications. Mar. Biol. 2017, 164, 1–17. [Google Scholar] [CrossRef] [Green Version]
  22. Piboon, P.; Poommouang, A.; Buddhachat, K.; Kaewmong, P.; Kittiwattanawong, K.; Nganvongpanit, K. The first study of genetic diversity and population structure of Indo-Pacific bottlenose dolphin (Tursiops aduncus) and pantropical spotted dolphin (Stenella attenuata) in the Thai Andaman Sea based on ISSR. Vet. World 2022, 15, 2004–2011. [Google Scholar] [CrossRef]
  23. Department of Marine and Coastal Resources. Status of Whales and Dolphins in Thai Waters. Central Database System and Data Standard for Marine and Coastal Resources. 2013. Available online: https://km.dmcr.go.th/c_7/d_1812 (accessed on 25 August 2022).
  24. Hulce, D.; Li, X.; Snyder-Leiby, T.; Liu, C.J. GeneMarker® genotyping software: Tools to increase the statistical power of DNA fragment analysis. J. Biomol. Tech. JBT 2011, 22, S35. [Google Scholar]
  25. Van Oosterhout, C.; Hutchinson, W.F.; Wills, D.P.; Shipley, P. MICRO-CHECKER: Software for identifying and correcting genotyping errors in microsatellite data. Mol. Ecol. Notes 2004, 4, 535–538. [Google Scholar] [CrossRef]
  26. Blair, D.; McMahon, A.; McDonald, B.; Tikel, D.; Waycott, M.; Marsh, H. Pleistocene sea level fluctuations and the phylogeography of the dugong in Australian waters. Mar. Mammal Sci. 2014, 30, 104–121. [Google Scholar] [CrossRef]
  27. Kriangwanich, W.; Buddhachat, K.; Poommouang, A.; Chomdej, S.; Thitaram, C.; Kaewmong, P.; Kittiwattanawong, K.; Nganvongpanit, K. Feasibility of melting fingerprint obtained from ISSR-HRM curves for marine mammal species identification. PeerJ 2021, 9, e11689. [Google Scholar] [CrossRef] [PubMed]
  28. Piboon, P.; Poommouang, A.; Buddhachat, K.; Kampuansai, J.; Chomdej, S.; Kaewmong, P.; Kittiwattanawong, K.; Nganvongpanit, K. The Potential Distribution and Maternal Lineage of Two Cetaceans Species (Grampus griseus and Pseudorca crassidens) in the Subfamily Globicephalinae from the Thai Andaman Sea and the Gulf of Thailand. Diversity 2022, 14, 257. [Google Scholar] [CrossRef]
  29. Piboon, P.; Kriengsakpichit, N.; Poommouang, A.; Buddhachat, K.; Brown, J.L.; Kampuansai, J.; Chomdej, S.; Kaewmong, P.; Kittiwattanawong, K.; Nganvongpanit, K. Relationship of stranded cetaceans in Thai territorial waters to global populations: Mitochondrial DNA diversity of Cuvier’s beaked whale, Indo Pacific finless porpoise, pygmy sperm whale, and dwarf sperm whale. Sci. Prog. 2022, 105, 00368504221103776. [Google Scholar] [CrossRef]
  30. Peakall, R.; Smouse, P.E. GENALEX 6: Genetic analysis in Excel. Population genetic software for teaching and research. Mol. Ecol. Notes 2006, 6, 288–295. [Google Scholar] [CrossRef]
  31. Pritchard, J.K.; Stephens, M.; Donnelly, P. Inference of population structure using multilocus genotype data. Genetics 2000, 155, 945–959. [Google Scholar] [CrossRef]
  32. Evanno, G.; Regnaut, S.; Goudet, J. Detecting the number of clusters of individuals using the software STRUCTURE: A simulation study. Mol. Ecol. 2005, 14, 2611–2620. [Google Scholar] [CrossRef] [Green Version]
  33. Wang, J. A parsimony estimator of the number of populations from a STRUCTURE-like analysis. Mol. Ecol. Resour. 2019, 19, 970–981. [Google Scholar] [CrossRef]
  34. Rosenberg, N.A. DISTRUCT: A program for the graphical display of population structure. Mol. Ecol. Notes 2004, 4, 137–138. [Google Scholar] [CrossRef]
  35. Jombart, T. adegenet: A R package for the multivariate analysis of genetic markers. Bioinformatics 2008, 24, 1403–1405. [Google Scholar] [CrossRef] [Green Version]
  36. Thompson, J.D.; Gibson, T.J.; Higgins, D.G. Multiple sequence alignment using ClustalW and ClustalX. Curr. Protoc. Bioinform. 2003, 2.3.1–2.3.22. [Google Scholar] [CrossRef]
  37. Rozas, J.; Ferrer-Mata, A.; Sánchez-DelBarrio, J.C.; Guirao-Rico, S.; Librado, P.; Ramos-Onsins, S.E.; Sánchez-Gracia, A. DnaSP 6: DNA sequence polymorphism analysis of large data sets. Mol. Biol. Evol. 2017, 34, 3299–3302. [Google Scholar] [CrossRef] [PubMed]
  38. Leigh, J.W.; Bryant, D. POPART: Full-feature software for haplotype network construction. Methods Ecol. Evol. 2015, 6, 1110–1116. [Google Scholar] [CrossRef]
  39. Ronquist, F.; Huelsenbeck, J.; Teslenko, M.; Nylander, J. MrBayes Version 3.2 Manual: Tutorials and Model Summaries. 2011. Available online: http://brahms.biology.rochester.edu/software.html (accessed on 5 August 2022).
  40. Posada, D. jModelTest: Phylogenetic model averaging. Mol. Biol. Evol. 2008, 25, 1253–1256. [Google Scholar] [CrossRef] [PubMed]
  41. Letunic, I.; Bork, P. Interactive Tree of Life (iTOL) v5: An online tool for phylogenetic tree display and annotation. Nucleic Acids Res. 2021, 49, W293–W296. [Google Scholar] [CrossRef] [PubMed]
  42. Drummond, A.; Rambaut, A.; Bouckaert, R.; Xie, W. Divergence Dating Tutorial with BEAST 2.0. 2012. Available online: http://beast2.cs.auckland.ac.nz/ (accessed on 5 August 2022).
  43. Moura, A.E.; Nielsen, S.C.; Vilstrup, J.T.; Moreno-Mayar, J.V.; Gilbert, M.T.P.; Gray, H.W.; Natoli, A.; Möller, L.; Hoelzel, A.R. Recent diversification of a marine genus (Tursiops spp.) tracks habitat preference and environmental change. Syst. Biol. 2013, 62, 865–877. [Google Scholar] [CrossRef] [Green Version]
  44. Rambaut, A.; Drummond, A.J.; Xie, D.; Baele, G.; Suchard, M.A. Posterior summarization in Bayesian phylogenetics using Tracer 1.7. Syst. Biol. 2018, 67, 901. [Google Scholar] [CrossRef] [Green Version]
  45. Gray, H.; van Waerebeek, K.; Owen, J.; Collins, T.; Minton, G.; Ponnampalam, L.; Willson, A.; Baldwin, R.; Hoelzel, A.R. Evolutionary drivers of morphological differentiation among three bottlenose dolphin lineages, Tursiops spp. (Delphinidae), in the northwest Indian Ocean utilizing linear and geometric morphometric techniques. Biol. J. Linn. Soc. 2022, 135, 610–629. [Google Scholar] [CrossRef]
  46. Amaral, A.R.; Smith, B.D.; Mansur, R.M.; Brownell, R.L.; Rosenbaum, H.C. Oceanographic drivers of population differentiation in Indo-Pacific bottlenose (Tursiops aduncus) and humpback (Sousa spp.) dolphins of the northern Bay of Bengal. Conserv. Genet. 2017, 18, 371–381. [Google Scholar] [CrossRef]
  47. Brown, A.M.; Kopps, A.M.; Allen, S.J.; Bejder, L.; Littleford-Colquhoun, B.; Parra, G.J.; Cagnazzi, D.; Thiele, D.; Palmer, C.; Frere, C.H. Population differentiation and hybridisation of Australian snubfin (Orcaella heinsohni) and Indo-Pacific humpback (Sousa chinensis) dolphins in north-western Australia. PLoS ONE 2014, 9, e101427. [Google Scholar] [CrossRef] [Green Version]
  48. Guoqing, J.; Guang, Y.; Shan, L.; Kaiya, Z. Variability of the mitochondrial DNA control region of bottlenose dolphins (genus: Tursiops) in Chinese waters. Dong Wu Xue Bao [Acta Zool. Sin.] 2002, 48, 487–493. [Google Scholar]
  49. Wang, J.; Chou, L.S.; White, B. Mitochondrial DNA analysis of sympatric morphotypes of bottlenose dolphins (genus: Tursiops) in Chinese waters. Mol. Ecol. 1999, 8, 1603–1612. [Google Scholar] [CrossRef] [PubMed]
  50. Gridley, T.; Elwen, S.H.; Harris, G.; Moore, D.; Hoelzel, A.; Lampen, F. Hybridization in bottlenose dolphins—A case study of Tursiops aduncus× T. truncatus hybrids and successful backcross hybridization events. PLoS ONE 2018, 13, e0201722. [Google Scholar] [CrossRef] [PubMed] [Green Version]
  51. Perrin, W.F.; Robertson, K.M.; Van Bree, P.J.; Mead, J.G. Cranial description and genetic identity of the holotype specimen of Tursiops aduncus (Ehrenberg, 1832). Mar. Mammal Sci. 2007, 23, 343–357. [Google Scholar] [CrossRef]
  52. Inamori, D.; Kita, Y.F.; Funasaka, N. External Morphological and Molecular Evidence of Natural Intrageneric Hybridization between Common and Indo-Pacific Bottlenose Dolphins (Tursiops truncatus× T. aduncus) from Japanese Waters. Mammal Study 2021, 47, 133–140. [Google Scholar] [CrossRef]
  53. Sakai, M.; Kita, Y.F.; Kogi, K.; Shinohara, M.; Morisaka, T.; Shiina, T.; Inoue-Murayama, M. A wild Indo-Pacific bottlenose dolphin adopts a socially and genetically distant neonate. Sci. Rep. 2016, 6, 1–8. [Google Scholar] [CrossRef] [Green Version]
  54. Yusmalinda, N.L.A.; Anggoro, A.W.; Suhendro, D.M.; Ratha, I.M.J.; Suprapti, D.; Kreb, D.; Cahyani, N.K.D. Species identification of stranded cetaceans in Indonesia revealed by molecular technique. J. Ilmu Dan Teknol. Kelaut. Trop. 2017, 9, 465–474. [Google Scholar] [CrossRef] [Green Version]
  55. Ansmann, I.C.; Parra, G.J.; Lanyon, J.M.; Seddon, J.M. Fine-scale genetic population structure in a mobile marine mammal: Inshore bottlenose dolphins in M oreton B ay, A ustralia. Mol. Ecol. 2012, 21, 4472–4485. [Google Scholar] [CrossRef]
  56. Chabanne, D.B.; Allen, S.J.; Sherwin, W.B.; Finn, H.; Krützen, M. Inconsistency between socio-spatial and genetic structure in a coastal dolphin population. Front. Mar. Sci. 2021, 7, 617540. [Google Scholar] [CrossRef]
  57. Manlik, O.; Chabanne, D.; Daniel, C.; Bejder, L.; Allen, S.J.; Sherwin, W.B. Demography and genetics suggest reversal of dolphin source-sink dynamics, with implications for conservation. Mar. Mammal Sci. 2019, 35, 732–759. [Google Scholar] [CrossRef]
  58. Möller, L.M.; Beheregaray, L.B. Coastal bottlenose dolphins from southeastern Australia are Tursiops aduncus according to sequences of the mitochondrial DNA control region. Mar. Mammal Sci. 2001, 17, 249–263. [Google Scholar] [CrossRef]
  59. Möller, L.M.; Wiszniewski, J.; Allen, S.J.; Beheregaray, L.B. Habitat type promotes rapid and extremely localised genetic differentiation in dolphins. Mar. Freshw. Res. 2007, 58, 640–648. [Google Scholar] [CrossRef] [Green Version]
  60. Oremus, M.; Garrigue, C.; Tezanos-Pinto, G.; Scott Baker, C. Phylogenetic identification and population differentiation of bottlenose dolphins (Tursiops spp.) in Melanesia, as revealed by mitochondrial DNA. Mar. Mammal Sci. 2015, 31, 1035–1056. [Google Scholar] [CrossRef]
  61. Council, N.R. The Evaluation of Forensic DNA Evidence. 1996. Available online: https://nap.nationalacademies.org/read/5141/chapter/1 (accessed on 11 August 2022).
  62. Chakraborty, R.; Jin, L. Heterozygote deficiency, population substructure and their implications in DNA fingerprinting. Hum. Genet. 1992, 88, 267–272. [Google Scholar] [CrossRef]
  63. Haughey, R.; Hunt, T.; Hanf, D.; Rankin, R.W.; Parra, G.J. Photographic capture-recapture analysis reveals a large population of Indo-Pacific bottlenose dolphins (Tursiops aduncus) with low site fidelity off the North West Cape, Western Australia. Front. Mar. Sci. 2020, 6, 781. [Google Scholar] [CrossRef]
  64. Kiszka, J.; Simon-Bouhet, B.; Gastebois, C.; Pusineri, C.; Ridoux, V. Habitat partitioning and fine scale population structure among insular bottlenose dolphins (Tursiops aduncus) in a tropical lagoon. J. Exp. Mar. Biol. Ecol. 2012, 416, 176–184. [Google Scholar] [CrossRef]
  65. Natoli, A.; Peddemors, V.M.; Rus Hoelzel, A. Population structure and speciation in the genus Tursiops based on microsatellite and mitochondrial DNA analyses. J. Evol. Biol. 2004, 17, 363–375. [Google Scholar] [CrossRef] [Green Version]
  66. Särnblad, A.; Danbolt, M.; Dalen, L.; Amir, O.A.; Berggren, P. Phylogenetic placement and population structure of Indo-Pacific bottlenose dolphins (Tursiops aduncus) off Zanzibar, Tanzania, based on mtDNA sequences. Mar. Mammal Sci. 2011, 27, 431–448. [Google Scholar] [CrossRef]
  67. Xiong, P.; Dudzińska-Nowak, J.; Harff, J.; Xie, X.; Zhang, W.; Chen, H.; Tao, J.; Chen, H.; Miluch, J.; Feldens, P. Modeling paleogeographic scenarios of the last glacial cycle as a base for source-to-sink studies: An example from the northwestern shelf of the South China Sea. J. Asian Earth Sci. 2020, 203, 104542. [Google Scholar] [CrossRef]
  68. Ponnampalam, L.S. Opportunistic observations on the distribution of cetaceans in the Malaysian South China, Sulu and Sulawesi Seas and an updated checklist of marine mammals in Malaysia. Raffles Bull. Zool. 2012, 60, 221–231. [Google Scholar]
  69. Lange, I.D.; Schoenig, E.; Khokiattiwong, S. Chapter 22-Thailand. In World Seas: An Environmental Evaluation, 2nd ed.; Sheppard, C., Ed.; Academic Press: Cambridge, MA, USA, 2019; pp. 491–513. [Google Scholar]
  70. Möller, L.M.; Beheregaray, L.B. Genetic evidence for sex-biased dispersal in resident bottlenose dolphins (Tursiops aduncus). Mol. Ecol. 2004, 13, 1607–1612. [Google Scholar] [CrossRef]
  71. Bilgmann, K.; Möller, L.M.; Harcourt, R.G.; Gibbs, S.E.; Beheregaray, L.B. Genetic differentiation in bottlenose dolphins from South Australia: Association with local oceanography and coastal geography. Mar. Ecol. Prog. Ser. 2007, 341, 265–276. [Google Scholar] [CrossRef]
  72. Vijay, N.; Park, C.; Oh, J.; Jin, S.; Kern, E.; Kim, H.W.; Zhang, J.; Park, J.-K. Population genomic analysis reveals contrasting demographic changes of two closely related dolphin species in the last glacial. Mol. Biol. Evol. 2018, 35, 2026–2033. [Google Scholar] [CrossRef] [PubMed] [Green Version]
  73. Hoegh-Guldberg, O.; Bruno, J.F. The impact of climate change on the world’s marine ecosystems. Science 2010, 328, 1523–1528. [Google Scholar] [CrossRef] [PubMed]
  74. Grant, W.S. Problems and cautions with sequence mismatch analysis and Bayesian skyline plots to infer historical demography. J. Hered. 2015, 106, 333–346. [Google Scholar] [CrossRef] [PubMed] [Green Version]
  75. Heller, R.; Chikhi, L.; Siegismund, H.R. The confounding effect of population structure on Bayesian skyline plot inferences of demographic history. PLoS ONE 2013, 8, e62992. [Google Scholar] [CrossRef] [PubMed]
  76. Chen, I.; Nishida, S.; Chou, L.S.; Tajima, Y.; Yang, W.C.; Isobe, T.; Yamada, T.K.; Hartman, K.; Hoelzel, A.R. Concordance between genetic diversity and marine biogeography in a highly mobile marine mammal, the Risso’s dolphin. J. Biogeogr. 2018, 45, 2092–2103. [Google Scholar] [CrossRef]
  77. Escorza-Trevino, S.; Archer, F.I.; Rosales, M.; Lang, A.; Dizon, A.E. Genetic differentiation and intraspecific structure of Eastern Tropical Pacific spotted dolphins, Stenella attenuata, revealed by DNA analyses. Conserv. Genet. 2005, 6, 587–600. [Google Scholar]
  78. Faria, D.M.; da Silva, J.M., Jr.; Pires Costa, L.; Rezende Paiva, S.; Marino, C.L.; Rollo, M.M., Jr.; Baker, C.S.; Cazerta Farro, A.P. Low mtDNA diversity in a highly differentiated population of spinner dolphins (Stenella longirostris) from the Fernando de Noronha Archipelago, Brazil. PLoS ONE 2020, 15, e0230660. [Google Scholar]
  79. Farro, A.; Rollo, M.; Silva, J.; Marino, C. Isolation and characterization of microsatellite DNA markers for spinner dolphin (Stenella longirostris). Conser. Genet. 2008, 9, 1319–1321. [Google Scholar]
  80. Mirimin, L.; Coughlan, J.; Rogan, E.; Cross, T. Tetranucleotide microsatellite loci from the striped dolphin (Stenella coeruleoalba Meyen, 1833). Mol. Ecol. Notes 2006, 6, 493–495. [Google Scholar]
Figure 1. Map showing the location of stranded T. aduncus samples used in this study.
Diversity 14 01093 g001
Figure 2. Population structure plot for 11 microsatellite loci of T. aduncus from the Thai Andaman Sea. The population structure consisted of two genetic clusters (K = 2) indicated by different colors (blue and orange). Each individual is represented by a single vertical stripe divided into K color segments, of which K is the assumed number of ancestral groups.
Diversity 14 01093 g002
Figure 3. Principal component analysis (PCA) showing the partition of individual T. aduncus from the Thai Andaman Sea.
Diversity 14 01093 g003
Figure 4. MJNs of mitochondrial DNA control region based on 256 bp from 232 sequences of T. aduncus. The MJNs are represented by 102 haplotypes found worldwide. Each haplotype is colored by geographic location.
Diversity 14 01093 g004
Figure 5. Phylogenetic tree and geographic distribution of T. aduncus through mtDNA control region analysis. (a) Phylogenetic tree based on 256 bp from 232 sequences of T. aduncus, illustrating five clades by color. The number label on the branches is the posterior probability (PP) of the supporting branch. All branches have a PP value greater than or equal to 0.50, and the branches without number labeling indicate a PP value greater than 0.99. The peripheral circle colors indicate location: Thailand (THA), Bangladesh (BGD), Oman (OMN), Pakistan (PAK), China (CHN), Taiwan and Japan (MIX), Indonesia (IDN), China and Taiwan (CHN/TWN), Taiwan (TWN), South Africa (ZAF), Japan (JPN), Australia (AUS), Melanesia (MLN), and Iran (IRN). (b) The geographic distribution of T. aduncus by clades based on the phylogenetic tree on the global scale.
Diversity 14 01093 g005
Figure 6. Bayesian Skyline Plots (BSPs) of effective population size over time of T. aduncus in the Andaman Sea of Thailand. The central line represents the mean divergence time value for the log of population size, Y-axis indicates effective population size, X-axis indicates mean time in millions of years to the present, and the blue area represents the standard error.
Diversity 14 01093 g006
Table 1. The observed number of alleles (Na), effective number of alleles (Ne), Shannon’s information index (I), observed heterozygosity (Ho), expected heterozygosity (He), Fixation Index (F), and Hardy–Weinberg Equilibrium (HWE) p-values across 16 microsatellite primers.
LocusGenetic VariabilitiesHWE
(p-Value)
NaNeIHoHeF
Sl9-696.002.251.140.550.550.02ns
Sd814.009.642.420.850.900.050.00 *
Sl10-2612.004.411.910.710.770.080.00 *
Slo157.004.431.590.800.77−0.030.00 *
Sco656.002.431.180.650.59−0.110.00 *
Sl8-499.005.081.830.680.800.150.00 *
Slo45.002.531.180.460.600.240.00 *
EV1046.003.011.310.620.670.070.00 *
Slo97.004.261.650.500.770.350.00 *
Sco667.004.521.660.520.780.330.00 *
Slo17.003.041.350.680.67−0.010.00 *
Mean (SE)7.82 (0.84)4.15 (0.63)1.57 (0.12)0.64 (0.04)0.72 (0.03)0.10 (0.04)
ns = not significantly deviated from HWE; * = significantly deviated from HWE at p < 0.05.
Table 2. The number of haplotypes, haplotype diversity, and nucleotide diversity of T. aduncus worldwide.
LocationNumber of HaplotypesHaplotype Diversity (h)Nucleotide Diversity (π)Reference
THA170.926 ± 0.0270.045 ± 0.002[45], this study
BGD71.000 ± 0.0760.021 ± 0.009[46,47]
OMN90.624 ± 0.0580.011 ± 0.003[45]
PAK60.889 ± 0.0910.018 ± 0.010[45]
CHN150.932 ± 0.0310.020 ± 0.001[46,48]
MIX181.000 ± 0.0190.020 ± 0.001[21]
IDN31.000 ± 0.2720.272 ± 0.010[49]
CHN/TWN51.000 ± 0.1260.019 ± 0.003[49]
TWN51.000 ± 0.1260.025 ± 0.004[49]
ZAF50.786 ± 0.1510.007 ± 0.002[12,50,51]
JPN31.000 ± 0.2720.025 ± 0.007[52,53,54]
AUS400.989 ± 0.0060.031 ± 0.002[47,55,56,57,58,59]
MLN91.000 ± 0.0520.013 ± 0.002[60]
IRN10.0000.000[45]
Overall1090.970 ± 0.0060.042 ± 0.001
THA, Thailand; BGD, Bangladesh; OMN Oman; PAK Pakistan; CHN China; MIX, Taiwan and Japan; IDN, Indonesia; CHN/TWN, China and Taiwan; TWN, Taiwan; ZAF, South Africa; JPN, Japan; AUS, Australia; MLN, Melanesia; IRN, Iran.
Publisher’s Note: MDPI stays neutral with regard to jurisdictional claims in published maps and institutional affiliations.

