Article

The Spatial Pattern of the Two Genetic Lineages of the Field Vole in Lithuania

by
Petras Prakas
*,
Dalius Butkauskas
,
Jevgenija Vaišvilienė
,
Laima Balčiauskienė
and
Linas Balčiauskas
Nature Research Centre, Akademijos Str. 2, LT-08412 Vilnius, Lithuania
*
Author to whom correspondence should be addressed.
Diversity 2022, 14(10), 820; https://doi.org/10.3390/d14100820
Submission received: 19 September 2022 / Revised: 26 September 2022 / Accepted: 27 September 2022 / Published: 29 September 2022
(This article belongs to the Special Issue Advances in Diversity and Conservation of Terrestrial Small Mammals)

Abstract

:
The phylogeography of the filed vole (Microtus agrestis) in Eurasia was thoroughly examined using mitochondrial DNA (mtDNA) of the cytochrome b (cytb) gene. However, the former conclusions about genetic variability and the contact zone of eastern and western genetic lineages in Lithuania were based on the analysis of a very limited number of individuals. In the present study, we examined 74 M. agrestis individuals trapped in four sites in the eastern, northern, and western parts of the country using sequence analysis of cytb and D-loop. Totals of 25 new cytb haplotypes and 19 new D-loop haplotypes were identified for this species. Higher nucleotide diversity was observed for D-loop (π = 0.01147 ± 0.00070) as compared to cytb (π = 0.00694 ± 0.00039). The phylogenetic analysis based on both loci revealed the presence of two genetic lineages, i.e., the eastern and western ones, which were mixed in Lithuanian samples, with the exception of the Rusnė site in the west of the country. Only the western lineage was observed in this island population of M. agrestis; the sample differed in low genetic variability and genetic differentiation from other investigated samples. We found D-loop to be an appropriate locus for the evaluation of the genetic variability of M. agrestis.

1. Introduction

The field vole (Microtus agrestis) is a common and widespread Palaearctic species distributed from southeast Siberia westwards to Portugal and Great Britain [1], but is absent in Iceland, Ireland, and the southern part of Europe, being locally rare in the western and central parts of the distribution range [2,3]. Subspecies M. agrestis is present in Lithuania [4]. The species is a habitat generalist and occurs in grasslands, wet meadows, forested areas with dense herbaceous cover, riversides, heath areas, and various wetlands. Wet areas are preferred in all habitats [5].
In Lithuania, M. agrestis is widely distributed but not numerous [6]. Inhabited areas include a mixture of various habitats, most frequently meadows, forests, and wetlands; however, the species is also present in anthropogenic habitats, such as orchards [7], farmsteads [8] and ecotones with arable land [9]. As no publications containing generalized data on the relative abundance of the species and its proportions in small mammal communities are available, we include a brief overview on this topic in the Discussion.
Microtus agrestis is considered to represent the first radiation of Microtus voles in Europe after the glaciation [3]; therefore, various phylogenetic and genetic studies of the species have been conducted. At first, two major mitochondrial DNA lineages, southern and northern, were defined for M. agrestis in Fennoscandia based on polymorphisms of mitochondrial DNA (mtDNA) [10] reflecting post-glacial colonization of the region and defining a secondary contact zone in northern Sweden. Subsequently, three large phylogeographic groups with allopatric distributions (western, eastern, and southern) were defined based on DNA sequence variation along the whole 1140 bp-long mtDNA cytochrome b (cytb) gene [11]. Out of the three M. agrestis individuals from the same locality in Lithuania, two were related to the eastern, and one to the western, group. On the basis of this finding, it was suggested that a new contact zone for the species exists in Eastern Europe, extending the Fennoscandian contact zone of the western and eastern groups of M. agrestis to Lithuania [11]. Further on, the analysis of seven individuals of M. agrestis, five from southern, western, and northern Lithuania and two from southern Belarus, using 460 bp-long cytb, was conducted [12]. Five individuals from Lithuania represented the western mtDNA lineage [11], while the eastern lineage was identified in Belarus. Based on these findings, it was proposed that the contact zone of western and eastern lineages extends to Belarus [12].
Thus, conclusions about the existing contact zone of different M. agrestis lineages in Lithuania have been based on a very limited number and distribution of the sampled individuals. Contrary to these findings, the study of a much bigger sample of 190 voles from 13 locations in Poland did not show reproductive isolation between mtDNA lineages, and the eastern–western subdivision of microsatellites did not coincide with the distribution of mtDNA lineages [13].
In addition to species spread after the glaciation, the present-day distribution and the genetic structure of the species are influenced by climatic [14] and landscape factors [13], both being relevant at global and local levels. Anthropogenic transformations affect the distribution and abundance of M. agrestis [1,15]. Even in such a small country as Lithuania, there are geographic differences between small mammal communities [16] that should be clarified in analyzing the genetic variability of the species.
We examined the distribution and abundance of M. agrestis, as well as genetic variability and phylogeographic pattern, of this species in Lithuania via the sequence analysis of two mtDNA loci, cytb and the newly used D-loop.

2. Materials and Methods

2.1. Sample Collection

Samples for genetic analysis were collected in four regions of Lithuania (Figure 1). In 2011, voles were snap-trapped in a natural meadow, young and older forests in Zarasai district (55°45′ N, 25°45′ E), and a mowed meadow under forest succession in Pakruojis district (55°59′ N, 23°48′ E). In 2014, samples were collected from individuals trapped in the Joniškis district, a forest, a meadow, and shrub habitats (56°17′ N, 23°13′ E). In 2107, voles were trapped in a flooded meadow near Rusnė settlement (55°19′ N, 21°20′ E). The numbers of M. agrestis were 8, 24, 29 and 13, respectively; in total, 74 individuals were analyzed.
Traps were checked early in the morning to ensure freshness of material. After identifying the trapped small mammal species according to [17], M. agrestis individuals were dissected, and samples of the heart muscle were placed into numbered vials and kept in ethanol until the analysis.
Snap-trapping was justified, as under dissection we collected samples for parasitological research, analyses of the stable isotopes and elemental composition, and the evaluation of reproduction parameters.

2.2. DNA Extraction, Polymerase Chain Reaction (PCR) and Sequencing

Genomic DNA was extracted from ethanol-preserved hearts of M. agrestis with the help of a universal and rapid salt-extraction method [18] and eluted in 400 µL of nuclease-free water. The DNA concentration was measured with the spectrophotometer “NanoPhotometer® P-300” (Implen, München, Germany) and the samples were diluted to reach the final DNA concentration of 50 ng/µL.
The partial 767 bp-long cytb fragment was amplified using the following Micr-2L (5′-CAACAACAGCATTCTCATCA-3′) and Micr-2R (5′-TGCTCGTTGTTTTGAAGTGT-3′) primer pair, whereas the amplification of the D-loop region was carried out with the Pro+ (5′-CACCATCAGCACCCAAAGCTG-3′) and MicrF (5′-ATTTAAGGGGAACGTATGGACG-3′) primer pair yielding a 463 bp-long fragment. Primers targeting the cytb and D-loop of several vole species were designed with the help of Primer3Plus program [19]. PCRs were performed in the final 25 µL volume consisting of 5 µL 50 ng/μL DNA, 2.5 µL of 1 × PCR buffer (with 50 mM KCl), 1.25 µL of 25 mM MgCl2, 2.5 μL of 2mM dNTP, 1 U Taq DNA polymerase (Thermo Fisher Scientific Baltics, Vilnius, Lithuania), 1 µL of 5pmol of each primer and the remaining volume of nuclease-free water. The PCR cycling conditions started with 5 min at 95 °C, followed by 35 cycles of 45 s at 94 °C and at 55 °C for cytb, and at 58 °C for D-loop, and 60 s or 45 s for cytb and D-loop, respectively, at 72 °C, and ending with 5 min at 72 °C. In every PCR set, positive (DNA of known origin and of sufficient quality) and negative (water instead of template DNA) controls were added. The evaluation of PCR products was carried out using 1.5% agarose gel electrophoresis. The obtained PCR products were purified using exonuclease ExoI and alkaline phosphatase FastAP (Thermo Fisher Scientific Baltics, Vilnius, Lithuania) to remove unincorporated nucleotides and primers.
Purified PCR products were sequenced in both directions using the same forward and reverse primers as for PCR. The Big-Dye® Terminator v3.1 Cycle Sequencing Kit (Thermo Fisher Scientific Baltics, Vilnius, Lithuania) and the 3500 Genetic Analyzer (Applied Biosystems, Foster City, CA, USA) were used to perform sequencing reactions according to the manufacturer’s instructions. The cytb and D-loop sequences generated in the present study were deposited in GenBank with accession numbers OP432322–OP432395 and OP432396–OP432469, respectively.

2.3. Data Analysis

Sequences derived in the present study were edited manually for ambiguously placed nucleotides and truncated by discarding the nucleotide sites where DNA binds to the primers. Afterwards the edited sequences were compared with those of M. agrestis and other closely related vole species by BLAST (megablast option) analysis (http://blast.ncbi.nlm.nih.gov/, accessed on 5 September 2022). For phylogeographic analysis, cytb sequences of M. agrestis from Lithuania obtained in the present study were compared with those obtained from GenBank, while only two complete mtDNA sequences of M. agrestis (MH152570 and MT410884) encompassing the D-loop region were available in GenBank. Different haplotypes of cytb and D-loop were identified using FaBox v. 1.5 [20].
DnaSP v. 6 software [21] was used for the estimation of intraspecific genetic variability in the examined samples of M. agrestis. The number of haplotypes (h), the number of polymorphic sites (S), the average number of nucleotide differences (K), the haplotype diversity (Hd), the nucleotide diversity (π) and the standard deviation (SD) for Hd and π were calculated.
Phylogenetic relationships between the haplotypes were inferred by coalescent simulations using a median-joining model [22] implemented in NETWORK v. 10.2.0.0. (https://www.fluxus-engineering.com/sharenet.htm, accessed on 8 September 2022). Multiple sequence alignments of cytb and D-loop sequences were generated with the help of the MUSCLE algorithm incorporated into the MEGA7 [23]. The MEGA7 package was used to select nucleotide substitution models (HKY + G for cytb and HKY for D-loop) with the best fit to the aligned sequences datasets and to construct phylogenetic trees inferred by a maximum likelihood method. The bootstrap method with 1000 replications was employed to test the robustness of the suggested phylogeny.
The genetic differentiation for samples of M. agrestis was assessed using ΦST between the population pairs with Arlequin v. 3.5.2.2 [24]. The statistical significance of each pairwise ΦST was tested by 10,000 permutations at the 95% confidence level. Principal coordinates analysis (PCoA) based on Nei’s [25] genetic distance was performed using GenAlEx v. 6.502 [26].

3. Results

3.1. Genetic Variation of M. agrestis

Based on 727 bp-long mtDNA cytb sequences of 74 M. agrestis, 25 haplotypes were identified. The ascertained haplotypes differed from each other by up to 1.5%, and by up to 11 single nucleotide polymorphisms (SNPs). The Cytb sequences of M. agrestis obtained in the present study showed up to 88.6% similarity when compared with those of other closely related voles of the genus Microtus (87.9–88.6% with M. dogramacii, 87.6–88.6% with M. kirgisorum, 87.4–88.3 with M. townsendii, 87.1–88.6 with M. arvalis, and 86.7–88.6% M. ilaeus). It should be noted that all 25 haplotypes defined in the current work differed in at least one SNP from other previously reported cytb haplotypes. The comparison of the obtained sequences with 574 sequences available in GenBank demonstrated 97.3–99.9% similarity with the sequences of the voles collected in Belarus, Finland, Romania, Lithuania, Denmark, Chechia, Germany, Sweeden, Russia, Scotland, Luxemburg, Netherlands, Poland, Norway, Wales, and England (Table 1).
A significantly lower sequence similarity was observed when comparing the cytb haplotypes identified in Lithuania with three sequences of 15 ones from the voles collected in France (JX284281-83, sequence similarity was 92.9–94.0%), three sequences of 5 ones from the voles collected in Switzerland (AY167160-61, MW478038, sequence similarity was 92.9–93.8%), and with sequences of the voles from Spain and Portugal (Table 1). The differences between the obtained sequences and those of the voles from Southern Europe and Western Europe were relatively high.
In total, 19 haplotypes were identified when examining 420 bp-long D-loop fragments. Based on D-loop, the sequence similarity was 97.6–100%, and at most 13 SNSs were observed when comparing the identified haplotypes. At D-loop, the obtained sequences shared 97.6–99.1% genetic similarity with two sequences of the same species available in GenBank (MH152570 and MT410884). Less than 92% sequence similarity was assessed when comparing D-loop sequences of M. agrestis with those of other vole species (89.5–91.2% with Neodon irene, 86.6–91.1% with Microtus thomasi, 84.3–90.5 with M. subterraneus, 88.3–90.5% with M. majori, 88.2–89.4% with M. ilaeus).
Based on cytb, the Lithuanian sample was distinguished by a moderate genetic variability in comparison with other samples (Table 2). The highest intrapopulation variabilities were determined for the voles from Switzerland and France, while the lowest ones were assessed for the voles from Portugal.
Similar values of two genetic variability estimates (K and Hd) were established for Lithuanian voles in both analyzed mtDNA loci; however, more than one and a half times higher π values were calculated for Lithuanian voles at the D-loop as compared to cytb (Table 2). Definitely the lowest values of genetic variability were calculated for the voles from the Rusnė sampling site in both loci.

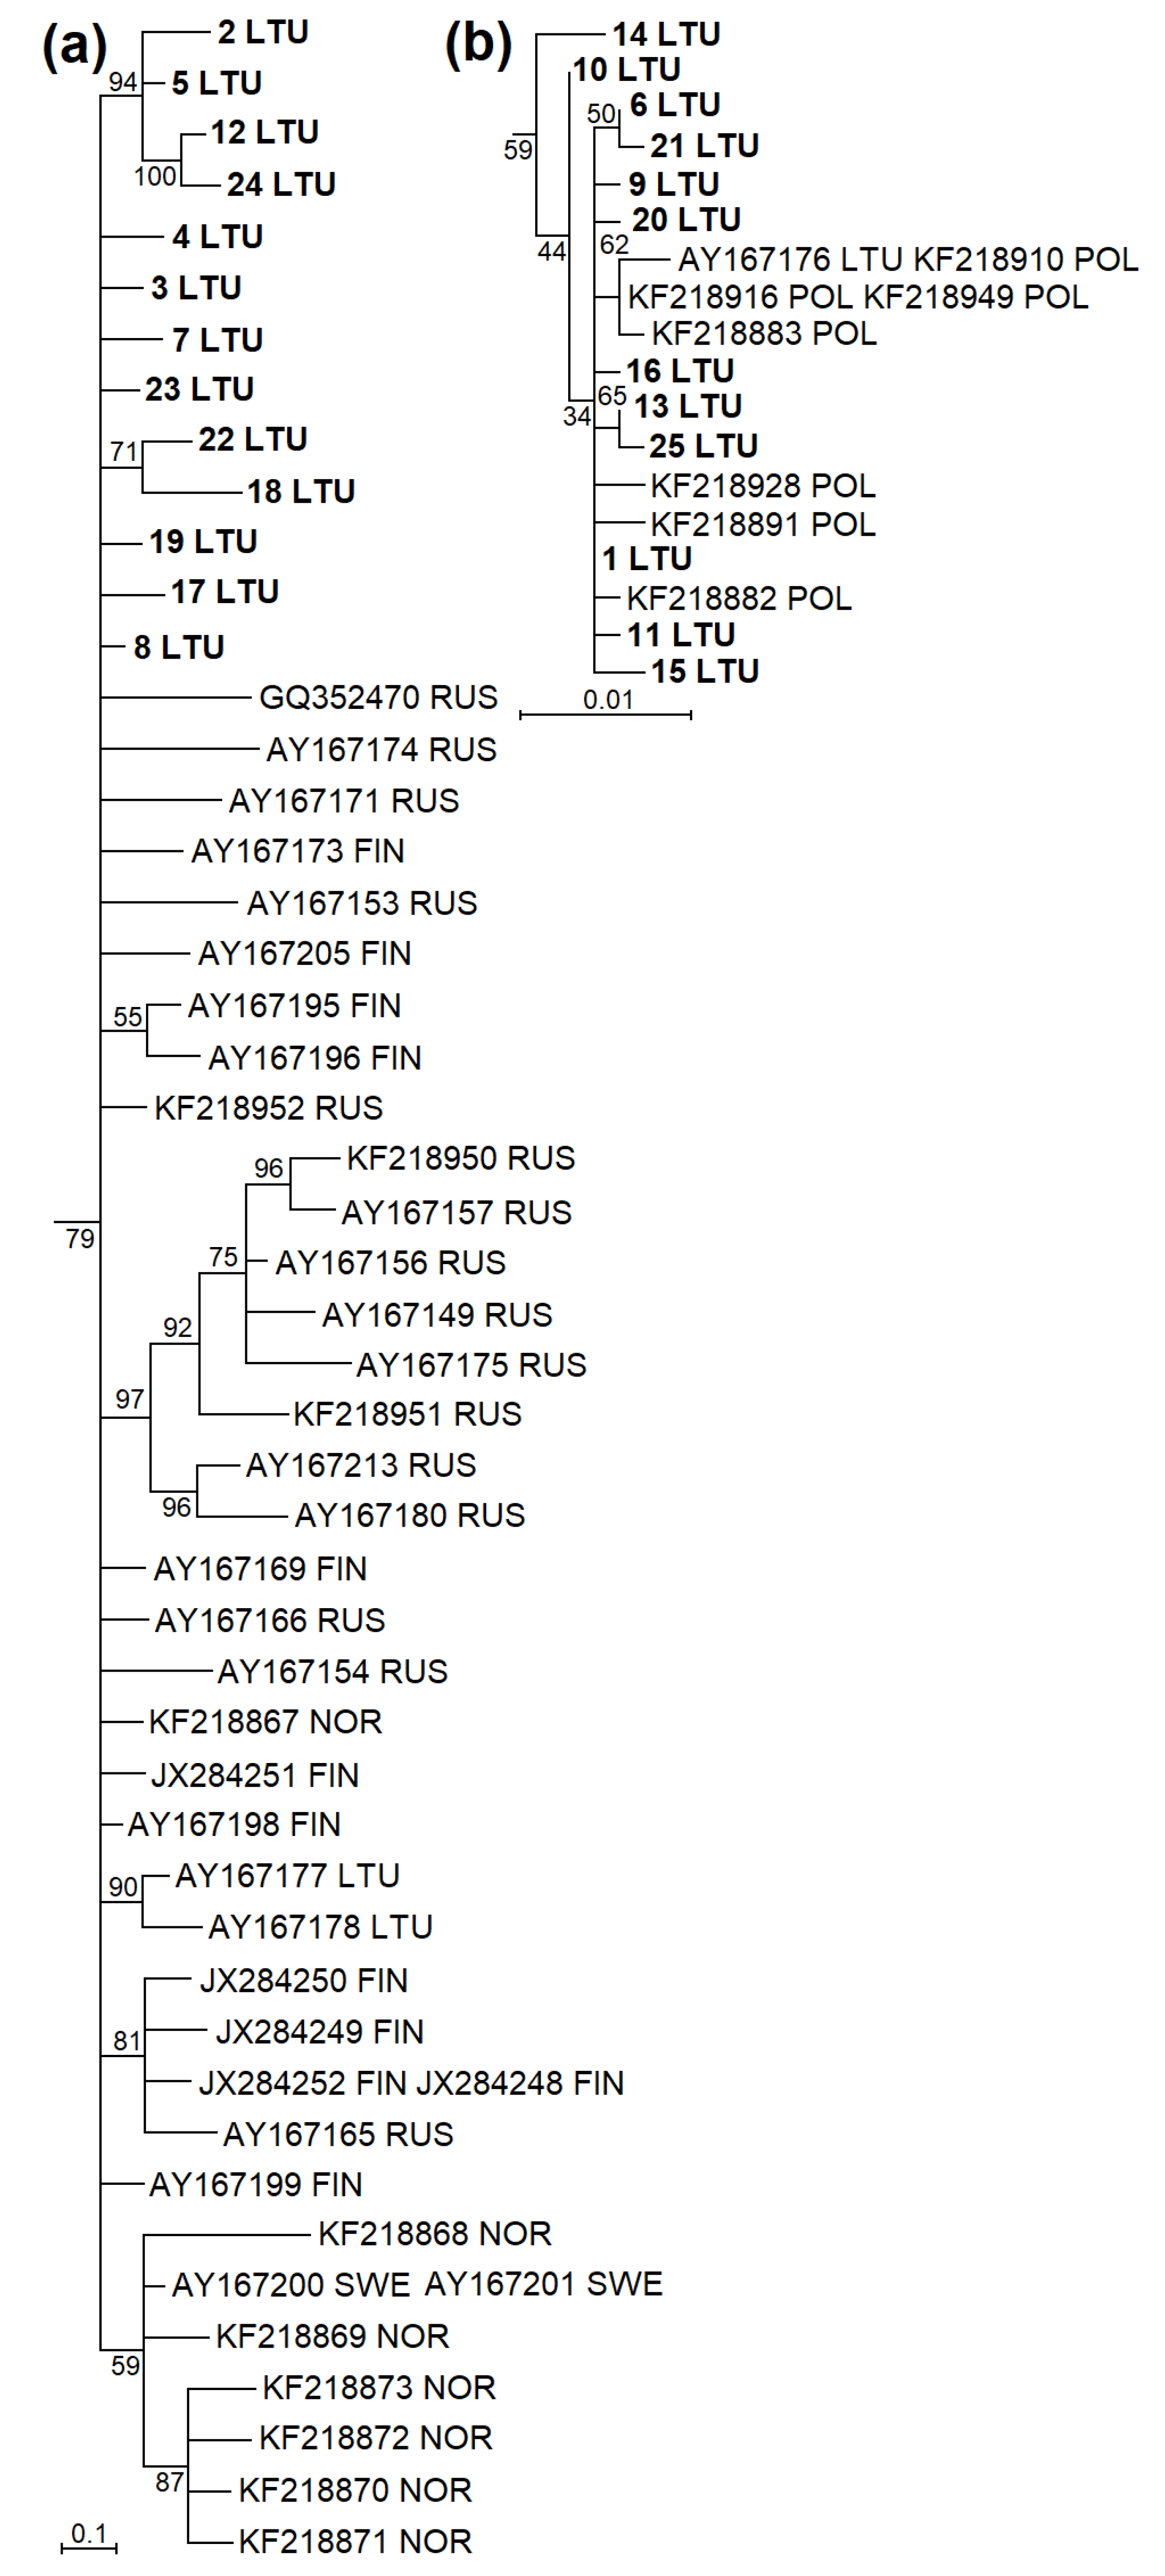
3.2. Phylogenetic Groups of M. agrestis

The phylogenetic analysis based on cytb showed that sequences of M. agrestis collected in Lithuania were divided into two phylogenetic groups (Figure 2 and Figure 3). Based on cytb, 28 haplotypes identified in Lithuania, 25 established during the current study and three ones ascertained in a previous study (AY167176-78) were placed in two phylogenetic lineages (Figure 2a). Fifteen haplotypes identified in Lithuania were grouped together into the Eastern European lineage with 16 haplotypes from Russia, 10 from Finland, 7 from Norway and 1 from Sweden (Figure 3a). Another 13 haplotypes confirmed in Lithuania were grouped together into the Western European lineage with 7 sequences of the voles from Poland (Figure 3b). The phylogenetic structure within the D-loop was less expressed (Figure 2b). In total, 9 D-loop haplotypes (1 LTU, 3 LTU, 4 LTU, 5 LTU, 10 LTU, 13 LTU, 14 LTU, 18 LTU and 19 LTU) and the remaining 10 haplotypes most likely represented Western and Eastern European lineages, respectively.
In general, the individuals were assigned to the same genetic lineage based on both mtDNA loci, except for three individuals sampled in Pakruojis (Figure 1). The ratios of the identified eastern and western genetic lineages differed in the studied samples of Lithuania. Only the western lineage was confirmed in the isolated Rusnė sample, situated in the western part of Lithuania near the Baltic Sea. On the contrary, the eastern lineage was dominant in the eastern part of Lithuania (Zarasai sample), whereas, based on cytb, the proportion of one lineage did not exceed 60% in the two northern samples (Joniškis and Pakruojis) of Lithuania. Thus, both genetic lineages were mixed in Lithuania and had different frequencies depending on the geographical position of the sampling site.

3.3. Genetic Comparison of Lithuanian M. agrestis Populations

The examination of four northern, western, and eastern samples of M. agrestis showed high genetic differentiation based on cytbST = 0.20190; p < 0.001) and D-loop (ΦST = 0.24478; p < 0.001) sequences. High and statistically significant pairwise ΦST values were determined when comparing voles from the Rusnė site with those from the other three sites (Table 3). Thus, the pairwise ΦST comparison showed that the Rusnė sample was highly genetically divergent from other Lithuanian samples. The principal coordinates analysis (PCoA) showed the greatest genetic distance between the eastern (Zarasai) and western (Rusnė) samples (Figure 4).

4. Discussion

Easy access to fast DNA sequencing techniques, statistical methods, and software has increased the usage of various molecular markers. Nuclear-encoded genes (18S rRNA, 5.8S rRNA, 28S rRNA) and genes encoded by mtDNA (such as cytochrome c oxidase subunit I (COI), mitochondrial 12S, cytb, D-loop) are examples of utility [27]. The mtDNA cytb has been used not only for the reconstruction of mammalian phylogenies [28], but also for the identification of small mammal species [29]. In Microtus voles, cytb sequences provided a basis for the analysis of speciation; however, the list does not include M. agrestis [30].
In M. agrestis, research into genetic variability started in Sweden, proposing the subdivision of the population based on allozyme variation [31]. Later, the genetic subdivision of the Fennoscandian M. agrestis population was confirmed by mtDNA [10], evaluating the contact zone between the western and eastern lineages [32] and offering an explanation of the colonization history in Fennoscandian rodents [33].
Later, three M. agrestis phylogeographic groups—western, eastern, and southern—were defined by mtDNA analysis [11]. Based on the entire cytb, the genus Microtus was shown to be one of the most speciose mammalian genera in the Holarctic [34] with an ongoing process of speciation. The presence of three clades, western (in Western and Central Europe), eastern (extending from Lithuania to Asia) and southern (from Portugal to Hungary), gives reason to suppose that they were isolated in different glacial refugia [35]. However, the latest data show that the most divergent southern lineages are independent species, the Mediterranean field vole (M. lavernedii) and the Portuguese field vole (M. rozianus) [36]. This division is supported by the ecological and morphological characteristics of the species [37]. The complete mitochondrial genome of M. agrestis is 16,538 bp in length, encodes 13 protein-coding genes, 22 transfer RNA (tRNA) genes, and two ribosomal RNA (rRNA) genes, and is genetically closest to that of the sibling vole (Microtus rossiaemeridionalis) [38].
Based on a very limited number of samples, the contact zone between the eastern and western lineages of M. agrestis was defined, starting in southern Sweden [11] and extending to eastern Lithuania and eastern Belarus [12]. Different post-glaciation routes of population re-establishment from south and northeast are confirmed by the studies of mammals, birds, snakes, and fish—see references in [11]. The presence of different genetic lineages was also confirmed for the root vole (M. oeconomus) [39] and the common vole (M. arvalis) [40] in Poland.
Our results show that D-loop can be used for research on genetic variability and the genetic structure of M. agrestis (Table 2 and Table 3; Figure 4). Based on both the mtDNA loci examined, cytb and D-loop, two genetic lineages, eastern and western according to [11], were identified in Lithuania (Figure 2 and Figure 3). The eastern genetic lineage prevailed in the eastern part of the country, whereas in the northern part both lineages co-circulated. Only the western lineage was present in the western part (Figure 1). We explain the low genetic variability of the western sample by isolation (the sampling site is an island), genetic drift and the founder effect. Every spring the sampling site is flooded and re-populated from the nearest habitat.
Based on the examples of other small mammal species, such as the yellow-necked mice (Apodemus flavicollis) and M. oeconomus, we interpret our findings with respect to species abundance, the founder effect and the importance of local barriers [41,42]. In mice, the genetic similarity is correlated with population abundance and negatively correlated with the distance on the local scale. At a large population size and with high genetic variation, fluctuations in abundance have no big impact on genetic parameters [41], so we checked the situation of M. agrestis in the sampling sites in general, and in the year of genetic sampling.
With 1760 individuals trapped in Lithuania between 1975 and 2022, M. agrestis was the seventh species of small mammals according to its general share in the communities, comprising 2.8% of all trapped individuals. In 54.7% of trappings, M. agrestis was not trapped. The relative abundance was low, averaging 0.4 ± 0.04 individuals per 100 snap-traps (Balčiauskas, Balčiauskienė, unpubl.). Unlike the dominant small mammal species [16], no significant differences in the relative abundance and proportion of this species were observed in various parts of Lithuania (F9,480 = 1.49, p = 0.15 and F9,482 = 1.56, p = 0.12, respectively). The ecological parameters of M. agrestis in the sites where individuals were sampled for genetic analyses are presented in Table 4. In all trapping sites, M. agrestis is sympatric, and in most years syntopic (trapped in the same year and habitat), with two other grey vole species, M. arvalis and M. oeconomus, which are more abundant than M. agrestis.
How can differences in proportions of the eastern and western genetic lineages in M. agrestis from different sampling locations be explained? The main explanation is the re-colonization of the territory from different glacial refugia [3] and the zone of contact between the western and eastern lineages, moving southward from Finland [11]. However, our data show no zone of contact either in Lithuania or in eastern Poland [13], where both lineages are present in M. agrestis in all investigated sites, though their proportions differ. An absence of the eastern lineage in voles from Rusnė, western Lithuania, can depend on the barrier effect, as this location is separated from the mainland by the delta of the largest river in the country. As shown in M. oeconomus, genetic differences can be dependent on much weaker barriers [42]. Our material, however, is too limited to analyze gene introgression at the contact zone [47] or postglacial processes and bottlenecks [48,49].
Climate is the second factor affecting species distribution and changes in small mammal communities [50,51,52]. The average minimum temperature in January was shown to change patterns of genetic groups in both M. arvalis and M. agrestis [14]. With M. agrestis preferring wet habitats within the species range [3,5] and in Lithuania [6], the average annual precipitation is an important aspect [14]. Coupled with recent land-use changes, this is an important factor affecting small mammals [45,53,54]. Though recent changes in temperature and precipitation in Lithuania [55,56] and changes in the land use [57,58,59] are significant, data from earlier research into the genetic diversity of M. agrestis [11,12] are too scant to make comparisons or recognize changes in the presence and proportion of genetic lineages in the past two decades.

Author Contributions

Conceptualization, D.B. and L.B. (Linas Balčiauskas); methodology, P.P. and D.B.; formal analysis, P.P., J.V. and D.B.; investigation, L.B. (Linas Balčiauskas) and L.B. (Laima Balčiauskienė); resources, D.B.; data curation, L.B. (Laima Balčiauskienė); writing—original draft preparation, P.P., D.B., L.B. (Laima Balčiauskienė) and L.B. (Linas Balčiauskas); writing—review and editing, all authors. All authors have read and agreed to the published version of the manuscript.

Funding

This research received no external funding; it was done under a long-term research program of the Nature Research Centre.

Institutional Review Board Statement

The study was conducted in accordance with the Republic of Lithuania Law on the Welfare and Protection of Animals No. XI-2271, “Requirements for the Housing, Care and Use of Animals for Scientific and Educational Purposes”, approved by Order No B1-866, 31/10/2012 of the Director of the State Food and Veterinary Service (Paragraph 4 of Article 16) and European legislation (Directive 2010/63/EU) on the protection of animals and post-hoc approved by the Animal Welfare Committee of the Nature Research Centre, protocol No GGT-7. Snap trapping was justifiable as we studied reproduction parameters and collected tissues and internal organs for the analysis of pathogens, elemental content and stable isotopes (not covered in this publication).

Informed Consent Statement

Not applicable.

Data Availability Statement

This is ongoing research; therefore, unpublished data on small mammal communities are not available publicly. The sequences obtained in the current study were submitted to the GenBank database under accession numbers OP432322–OP432469.

Acknowledgments

We thank Paulius Alejūnas, Marius Jasiulionis and Aušra Čepukienė for their help in sample collection. We are grateful to Ignasi Torre and Luis Javier Palomo for consultation on the taxonomy of M. agrestis in Spain and Portugal.

Conflicts of Interest

The authors declare no conflict of interest.

References

  1. Kryštufek, B.; Vohralík, V.; Zima, J.; Zagorodnyuk, I. Microtus agrestis (Errata Version Published in 2017). The IUCN Red List of Threatened Species 2016: E.T13426A115112050. 2016. Available online: https://doi.org/10.2305/IUCN.UK.2016-3.RLTS.T13426A22349665.en (accessed on 6 September 2022).
  2. Shenbrot, G.I.; Krasnov, B.R. An Atlas of the Geographic Distribution of the Arvicoline Rodents of the World (Rodentia, Muridae: Arvicolinae); Pensoft Publishers: Sofia, Bulgaria, 2005; 336p. [Google Scholar]
  3. Mathias, M.D.L.; Hart, E.B.; Ramalhinho, M.D.G.; Jaarola, M. Microtus agrestis (Rodentia: Cricetidae). Mamm. Species 2017, 49, 23–39. [Google Scholar] [CrossRef]
  4. Gromov, I.M.; Polyakov, I.Y. Fauna of the USSR, Vol. 3 Voles (Microtinae); Brill Publishing Co.: Leiden, The Netherlands, 1992; pp. 297–483. [Google Scholar]
  5. Zima, J. Microtus agrestis. In The Atlas of European Mammals; Mitchell-Jones, A.J., Amori, G., Bogdanowicz, W., Kryštufek, B., Reijnders, P.J.H., Spitzenberger, F., Stubbe, M., Thissen, J.B.M., Vohralík, V., Zima, J., Eds.; Academic Press: London, UK, 1999; pp. 225–227. [Google Scholar]
  6. Balčiauskas, L.; Trakimas, G.; Juškaitis, R.; Ulevičius, A.; Balčiauskienė, L. Atlas of Lithuanian Mammals, Amphibians and Reptiles, 2nd ed.; Akstis: Vilnius, Lithuania, 1999; p. 112. [Google Scholar]
  7. Stirkė, V.; Balčiauskas, L.; Balčiauskienė, L. Common Vole as a Focal Small Mammal Species in Orchards of the Northern Zone. Diversity 2021, 13, 134. [Google Scholar] [CrossRef]
  8. Balčiauskas, L.; Balčiauskienė, L.; Garbaras, A.; Stirkė, V. Diversity and Diet Differences of Small Mammals in Commensal Habitats. Diversity 2021, 13, 346. [Google Scholar] [CrossRef]
  9. Kitrytė, N. Diversity of Small Mammal Parasites and Factors Shaping Their Communities. Ph.D. Dissertation, Nature Research Centre, Vilnius University, Vilnius, Lithuania, 2022. [Google Scholar]
  10. Jaarola, M.; Tegelström, H. Colonization history of north European field voles (Microtus agrestis) revealed by mitochondrial DNA. Mol. Ecol. 1995, 4, 299–310. [Google Scholar] [CrossRef]
  11. Jaarola, M.; Searle, J.B. Phylogeography of field voles (Microtus agrestis) in Eurasia inferred from mitochondrial DNA sequences. Mol. Ecol. 2002, 11, 2613–2621. [Google Scholar] [CrossRef]
  12. Baltrūnaitė, L.; Mažeikytė, R.; Stunžėnas, V. New Data on the Distribution of Mitochondrial DNA Lineages of the Fiels Vole (Microtus agrestis) in Lithuania and Belarus. Acta Zool. Litu. 2006, 16, 115–118. [Google Scholar] [CrossRef]
  13. Stojak, J.; Wójcik, J.; Ruczyńska, I.; Searle, J.B.; McDevitt, A.D. Contrasting and congruent patterns of genetic structuring in two Microtus vole species using museum specimens. Mamm. Res. 2016, 61, 141–152. [Google Scholar] [CrossRef]
  14. Stojak, J.; Borowik, T.; Górny, M.; McDevitt, A.D.; Wójcik, J.M. Climatic influences on the genetic structure and distributiion of the common vole and field vole in Europe. Mamm. Res. 2019, 64, 19–29. [Google Scholar] [CrossRef]
  15. Ivanter, E.V.; Kurkhinen, Y.P.; Sokolov, A.V. Ecology of the field vole (Microtus agrestis L.) in indigenous and anthropogenic landscapes of eastern Fennoscandia. Russ. J. Ecol. 2013, 44, 213–220. [Google Scholar] [CrossRef]
  16. Stirkė, V.; Balčiauskas, L.; Balčiauskienė, L. Spatiotemporal Variation of Small Mammal Communities in Commercial Orchards across the Small Country. Agriculture 2022, 12, 632. [Google Scholar] [CrossRef]
  17. Prūsaitė, J. Lithuanian Fauna. Mammals; Mokslas: Vilnius, Lietuva, 1988; p. 295. [Google Scholar]
  18. Aljanabi, S.M.; Martinez, I. Universal and Rapid Salt-extraction of High Quality Genomic DNA for PCR-based Techniques. Nucleic Acids Res. 1997, 25, 4692–4693. [Google Scholar] [CrossRef] [PubMed]
  19. Untergasser, A.; Cutcutache, I.; Koressaar, T.; Ye, J.; Faircloth, B.C.; Remm, M.; Rozen, S.G. Primer3-new Capabilities and Interfaces. Nucleic Acids Res. 2012, 40, e115. [Google Scholar] [CrossRef] [PubMed]
  20. Villesen, P. FaBox: An Online Toolbox for Fasta Sequences. Mol. Ecol. Notes 2007, 7, 965–968. [Google Scholar] [CrossRef]
  21. Rozas, J.; Ferrer-Mata, A.; Sánchez-DelBarrio, J.C.; Guirao-Rico, S.; Librado, P.; Ramos-Onsins, S.E.; Sánchez-Gracia, A. DnaSP 6: DNA Sequence Polymorphism Analysis of Large Data Sets. Mol. Biol. Evol. 2017, 34, 3299–3302. [Google Scholar] [CrossRef]
  22. Bandelt, H.-J.; Forster, P.; Röhl, A. Median-Joining Networks for Inferring Intraspecific Phylogenies. Mol. Biol. Evol. 1999, 16, 37–48. [Google Scholar] [CrossRef]
  23. Kumar, S.; Stecher, G.; Tamura, K. MEGA7: Molecular Evolutionary Genetics Analysis Version 7.0 for Bigger Datasets. Mol. Biol. Evol. 2016, 33, 1870–1874. [Google Scholar] [CrossRef]
  24. Excoffier, L.; Laval, G.; Schneider, S. Arlequin (Version 3.0): An Integrated Software Package for Population Genetics Data Analysis. Evol. Bioinform. 2005, 1, 47–50. [Google Scholar] [CrossRef]
  25. Nei, M. Genetic Distance between Populations. Am. Nat. 1972, 106, 283–292. [Google Scholar] [CrossRef]
  26. Peakall, R.; Smouse, P.E. GenAlEx 6.5: Genetic Analysis in Excel. Population Genetic Software for Teaching and Research—An Update. Bioinformatics 2012, 28, 2537–2539. [Google Scholar] [CrossRef]
  27. Patwardhan, A.; Ray, S.; Roy, A. Molecular Markers in Phylogenetic Studies—A Review. J. Phylogen. Evolution. Biol. 2014, 2, 131. [Google Scholar] [CrossRef]
  28. Tobe, S.S.; Kitchener, A.C.; Linacre, A.M.T. Reconstructing Mammalian Phylogenies: A Detailed Comparison of the Cytochrome b and Cytochrome Oxidase Subunit I Mitochondrial Genes. PLoS ONE 2010, 5, e14156. [Google Scholar] [CrossRef] [PubMed]
  29. Schlegel, M.; Ali, H.S.; Stieger, N.; Groschup, M.H.; Wolf, R.; Ulrich, R.G. Molecular Identification of Small Mammal Species Using Novel Cytochrome b Gene-Derived Degenerated Primers. Biochem. Genet. 2011, 50, 440–447. [Google Scholar] [CrossRef] [PubMed]
  30. Mahmoudi, A.; Darvish, J.; Aliabadian, M.; Yazdani Moghaddam, F.; Kryštufek, B. New insight into the cradle of the grey voles (subgenus Microtus) inferred from mitochondrial cytochrome b sequences. Mammalia 2017, 81, 583. [Google Scholar] [CrossRef]
  31. Nygren, J.; Rasmuson, M. Allozyme variation in natural populations of field vole (Microtus agrestis L.) I. Survey of the “Semi-stable” population in southern Sweden. Hereditas 1980, 92, 65–72. [Google Scholar] [CrossRef]
  32. Jaarola, M.; Tegelström, H.; Fredga, K. A contact zone with non-coincident clines for sex-specific markers in the field vole (Microtus agrestis). Evolution 1997, 51, 241–249. [Google Scholar]
  33. Jaarola, M.; Tegelström, H.; Fredga, K. Colonization history in Fennoscandian rodents. Biol. J. Linn. Soc. 1999, 68, 113–127. [Google Scholar] [CrossRef]
  34. Jaarola, M.; Martínková, N.; Gündüz, İ.; Brunhoff, C.; Zima, J.; Nadachowski, A.; Amori, G.; Bulatova, N.S.; Chondropoulos, B.; Fraguedakis-Tsolis, S.; et al. Molecular phylogeny of the speciose vole genus Microtus (Arvicolinae, Rodentia) inferred from mitochondrial DNA sequences. Mol. Phylogenet. Evol. 2004, 33, 647–663. [Google Scholar] [CrossRef]
  35. Mammal Species of the World. A Taxonomic and Geographic Reference, 3rd ed.; Wilson, D.E., Reeder, D.M., Eds.; Johns Hopkins University Press: Baltimore, US, 2005; Volume 2, pp. 956–1038. [Google Scholar]
  36. Handbook of the Mammals of the World, Rodents II; Wilson, D.E.; Mittermeier, R.A.; Lacher, T.E. (Eds.) Lynx Edicions: Barcelona, Spain, 2017; Volume 7, pp. 333–334. [Google Scholar]
  37. Cheprakov, M.I.; Chernousova, N.F. Variability of the Ecological and Morphological Characteristics of Field Vole (Microtus agrestis) in the Southern and Middle Urals. Russ. J. Ecol. 2020, 51, 565–569. [Google Scholar] [CrossRef]
  38. Jiang, J.-Q.; Wu, S.-X.; Chen, J.-J.; Liu, C.-Z. Characterization of the complete mitochondrial genome of short-tailed field vole, Microtus agrestis. Mitochondr. DNA Part B 2018, 3, 845–846. [Google Scholar] [CrossRef]
  39. Jancewicz, E.; Falkowska, E.; Ratkiewicz, M. mtDNA evidence for a local northern latitude Pleistocene refugium for the root vole (Microtus oeconomus, Arvicolinae, Rodentia) from Eastern Poland. J. Zool. Syst. Evol. Res. 2015, 53, 331–339. [Google Scholar] [CrossRef]
  40. Stojak, J.; McDevitt, A.D.; Herman, J.S.; Kryštufek, B.; Uhlíková, J.; Purger, J.J.; Lavrenchenko, L.A.; Searle, J.B.; Wójcik, J.M. Between the Balkans and the Baltic: Phylogeography of a Common Vole Mitochondrial DNA Lineage Limited to Central Europe. PLoS ONE 2016, 11, e0168621. [Google Scholar] [CrossRef] [PubMed] [Green Version]
  41. Czarnomska, S.D.; Niedziałkowska, M.; Borowik, T.; Jędrzejewska, B. Regional and local patterns of genetic variation and structure in yellow-necked mice—The roles of geographic distance, population abundance, and winter severity. Ecol. Evol. 2018, 8, 8171–8186. [Google Scholar] [CrossRef] [PubMed]
  42. Łopucki, R.; Mróz, I.; Nowak-Życzyńska, Z.; Perlińska-Teresiak, M.; Owadowska-Cornil, E.; Klich, D. Genetic Structure of the Root Vole Microtus oeconomus: Resistance of the Habitat Specialist to the Natural Fragmentation of Preferred Moist Habitats. Genes 2022, 13, 434. [Google Scholar] [CrossRef] [PubMed]
  43. Balčiauskas, L.; Alejūnas, P. Small mammal species diversity and abundance in Žagarė Regional Park. Acta Zool. Litu. 2011, 21, 163–172. [Google Scholar] [CrossRef]
  44. Čepukienė, A.; Jasiulionis, M. Small mammal community changes during forest succession (Pakruojis district, north Lithuania). Zool. Ecol. 2012, 22, 144–149. [Google Scholar] [CrossRef]
  45. Balčiauskas, L.; Čepukienė, A.; Balčiauskienė, L. Small mammal community response to early meadow–forest succession. Forest Ecosystems 2017, 4, 11. [Google Scholar] [CrossRef]
  46. Balčiauskas, L.; Skipitytė, R.; Balčiauskienė, L.; Jasiulionis, M. Resource partitioning confirmed by isotopic signatures allows small mammals to share seasonally flooded meadows. Ecol. Evol. 2019, 9, 5479–5489. [Google Scholar] [CrossRef]
  47. Beysard, M.; Perrin, N.; Jaarola, M.; Heckel, G.; Vogel, P. Asymmetric and differential gene introgression at a contact zone between two highly divergent lineages of field voles (Microtus agrestis). J. Evolution. Biol. 2012, 25, 400–408. [Google Scholar] [CrossRef]
  48. Herman, J.S.; Searle, J.B. Post-glacial partitioning of mitochondrial genetic variation in the field vole. P. R. Soc. B. 2011, 278, 3601–3607. [Google Scholar] [CrossRef]
  49. Herman, J.S.; McDevitt, A.D.; Kawałko, A.; Jaarola, M.; Wójcik, J.M.; Searle, J.B. Land-Bridge Calibration of Molecular Clocks and the Post-Glacial Colonization of Scandinavia by the Eurasian Field Vole Microtus agrestis. PLoS ONE 2014, 9, e103949. [Google Scholar] [CrossRef]
  50. Myers, P.; Lundrigan, B.L.; Hoffman, S.M.G.; Haraminac, A.P.; Seto, S.H. Climate-induced changes in the small mammal communities of the Northern Great Lakes Region. Glob. Chang. Biol. 2009, 15, 1434–1454. [Google Scholar] [CrossRef]
  51. Mitchell, D.; Snelling, E.P.; Hetem, R.S.; Maloney, S.K.; Strauss, W.M.; Fuller, A. Revisiting concepts of thermal physiology: Predicting responses of mammals to climate change. J. Anim. Ecol. 2018, 87, 956–973. [Google Scholar] [CrossRef] [PubMed]
  52. Pacifici, M.; Visconti, P.; Rondinini, C. A framework for the identification of hotspots of climate change risk for mammals. Glob. Change Biol. 2018, 24, 1626–1636. [Google Scholar] [CrossRef] [PubMed]
  53. Zárybnická, M.; Riegert, J.; Bejček, V.; Sedláček, F.; Šťastný, K.; Šindelář, J.; Heroldová, M.; Vilímová, J.; Zima, J. Long-term changes of small mammal communities in heterogenous landscapes of Central Europe. Eur. J. Wildl. Res. 2017, 63, 89. [Google Scholar] [CrossRef]
  54. Fuentes-Montemayor, E.; Ferryman, M.; Watts, K.; Macgregor, N.A.; Hambly, N.; Brennan, S.; Coxon, R.; Langridge, H.; Park, K.J. Small mammal responses to long-term large-scale woodland creation: The influence of local and landscape-level attributes. Ecol. Appl. 2019, 30, e02028. [Google Scholar] [CrossRef]
  55. Marcinkevičiūtė, L.; Vilkevičiūtė, J.; Žukovskis, J.; Pranskūnienė, R. Social Dimensions of Projected Climate Change Impacts on Ecosystem Services in the Coastal-Rural Area of Nemunas River Reaches and Curonian Lagoon (Lithuania). Water 2021, 13, 1114. [Google Scholar] [CrossRef]
  56. Tripolskaja, L.; Kazlauskaitė-Jadzevičė, A. Trend Analyses of Percolation of Atmospheric Precipitation Due to Climate Change: Case Study in Lithuania. Agronomy 2022, 12, 1784. [Google Scholar] [CrossRef]
  57. Senetra, A.; Szczepańska, A.; Veteikis, D.; Wasilewicz-Pszczółkowska, M.; Šimanauskienė, R.; Volungevičius, J. Changes of the land use patterns in the Polish and Lithuanian trans-border rural area. Baltica 2013, 26, 157–168. [Google Scholar] [CrossRef]
  58. Veteikis, D.; Piškinaitė, E. Geografiniai žemėnaudos kaitos tyrimai Lietuvoje: Raida, kryptys, perspektyvos. Geologija. Geografija 2019, 5, 14–29. [Google Scholar] [CrossRef]
  59. Mizaras, S.; Doftartė, A.; Lukminė, D.; Šilingienė, R. Sustainability of Small-Scale Forestry and Its Influencing Factors in Lithuania. Forests 2020, 11, 619. [Google Scholar] [CrossRef]
Figure 1. The sampling of Microtus agrestis for genetic analysis (sites: 1—Joniškis, 2—Pakruojis, 3—Zarasai, 4—Rusnė), and the distribution of genetic lineages based on cytb (pie charts) and D-loop (bubble). Published data [11,12] are represented by paler colors. Note: the proportion of lineages according to cytb and D-loop differs only in site 2.
Diversity 14 00820 g001
Figure 2. Median-joining networks of M. agrestis based on cytb (a) and D-loop (b) haplotypes detected in Lithuania. The circle area is proportional to the haplotype frequency. Hypothetical intermediate haplotypes are shown in black. Dashes display mutational steps. Colors are used to represent the sampling sites in Lithuania, JNS Joniškis, PKR Pakruojis, RSN Rusnė and ZRS Zarasai.
Diversity 14 00820 g002
Figure 3. Fragments of maximum-likelihood phylogenetic trees based on cytb sequences of M. agrestis showing phylogenetic placement of haplotypes identified in Lithuania. (a) The Eastern European phylogenetic line encompassing some haplotypes determined in Lithuania, Russia, Finland, Norway, and Sweden. (b) The Western European line including some haplotypes identified in Lithuania and Poland. Haplotypes established in the present study are in boldface. LTU Lithuania, RUS Russia, FIN Finland, NOR Norway, SWE Sweden, POL Poland.
Diversity 14 00820 g003
Figure 4. Principal coordinate analysis (PCoA) of genetic distances between four samples of M. agrestis from Lithuania based on cytb (a) and D-loop (b) sequences.
Diversity 14 00820 g004
Table 1. Intraspecific and interspecific genetic comparison of obtained cytb sequences.
SampleGenBank acc. No.NSequence Similarity (%)
BelarusAY167155398.76–99.59
FinlandAY167169, AY167173, AY167195-96, AY167198-99, AY167205, JX284248-511398.49–99.73
RomaniaAY167172398.49–99.04
LithuaniaAY167176-78398.35–99.86
DenmarkAY167179, AY167184, AY167194, GU563297-99, MT410884898.21–99.31
CzechiaAY167151-52, AY167212498.07–99.59
Germany AY167210, DQ662095-102, DQ768138-42, DQ768145-47, GU563292-96, MK535087-922898.07–99.59
Sweden AY167167-68, AY167200-201, AY167203-204, AY167206-209, AY1672111298.07–99.59
Russia AY167149, AY167153-54, AY16715356-57, AY167165-66, AY167171, AY167174-75, AY167180, AY167213, KF218950-52, GQ3524701697.94–99.59
Scotland AY167181-82, AY167190, FJ619746-52, FJ619754-FJ619758, FJ619760-63, GU563195-23910597.94–99.59
Luxembourg GU563291197.94–98.76
Netherlands AY167183197.94–98.76
Poland AY167176, AY167185, DQ662095, KF218875-949 10997.80–99.86
Norway AY167202, KF218851-732997.66–99.59
Wales FJ619778, FJ619782, FJ619784-86, GU563260-671797.52–99.18
England AY167150, AY167170, AY167191-93, AY167197, FJ619753, FJ619759, FJ619764-77, FJ619779-81, FJ619783, GU563240-59, GU563268-8310597.25–99.45
France AY167188-89, GU563284-90, JX284281-83 1592.85–99.59
Switzerland AY167158-61, MW478038 592.85–99.04
Spain AY167162-64, AY167187, JX284265, JX284273-803091.88–94.22
Portugal AY167186, JX284253-64, JX284266-726791.61–93.26
N number of sequences.
Table 2. Intra-population genetic variability of D-loop and cytb sequences of M. agrestis sensu lato.
SamplenhSKHd ± SDπ ± SD
cytb
Switzerland544727.7000001.000 ± 0.1260.03810 ± 0.01049
France15115919.352380.943 ± 0.0450.02662 ± 0.00669
Russia1616438.241671.000 ± 0.0220.01134 ± 0.00104
Poland10966727.384730.989 ± 0.0030.01016 ± 0.00042
Spain3013507.374710.903 ± 0.0310.01014 ± 0.00234
Czechia43127.166670.833 ± 0.2220.00986 ± 0.00258
Norway2924447.054190.985 ± 0.0140.00970 ± 0.00115
Germany2813216.300720.920 ± 0.0380.00867 ± 0.00052
England 10552566.201800.875 ± 0.0290.00853 ± 0.00063
Sweden1210225.878790.970 ± 0.0440.00809 ± 0.00114
Wales 1710254.970590.919 ± 0.0440.00684 ± 0.00110
Scotland10552614.972890.957 ± 0.0100.00684 ± 0.00033
Finland1311163.923080.974 ± 0.0390.00540 ± 0.00072
Denmark87133.607140.964 ± 0.0770.00496 ± 0.00203
Portugal 6712151.702400.767 ± 0.0460.00234 ± 0.00032
Joniškis2911195.389160.845 ± 0.0450.00741 ± 0.00038
Pakruojis2411174.637680.851 ± 0.0540.00638 ± 0.00066
Zarasai84114.392860.821 ± 0.1010.00604 ± 0.00138
Rusnė 13220.307690.154 ± 0.1260.00042 ± 0.00035
Lithuania *7728355.042720.841 ± 0.0380.00694 ± 0.00039
Overall64833124020.982180.990 ± 0.0010.02890 ± 0.00001
D-loop
Pakruojis248164.590580.819 ± 0.0500.01093 ± 0.00172
Joniškis299124.524220.829 ± 0.0470.01077 ± 0.00061
Zarasai8393.500000.607 ± 0.1640.00833 ± 0.00278
Rusnė 13340.743590.295 ± 0.1560.00177 ± 0.00097
Overall7419254.815990.890 ± 0.0210.01147 ± 0.00070
* 74 sequences determined in the present study and 3 sequences (AY167176-78) from [11]. N sample size, h number of haplotypes, S number of polymorphic sites, K average number of nucleotide differences, Hd the haplotype diversity, π the nucleotide diversity, SD standard deviation.
Table 3. Evaluation of genetic differentiation of M. agrestis samples from Lithuania. Pairwise ΦST values were calculated on the basis of cytb and D-loop, and the sequences are presented below and above the diagonal, respectively.
JoniškisPakruojisZarasaiRusnė
Joniškis 0.17332 **0.063410.35922 ***
Pakruojis0.08884 * 0.31469 *0.11994 *
Zarasai0.063490.16033 * 0.67878 ***
Rusnė 0.34939 ***0.23161 **0.68462 ***
* p < 0.05, ** p < 0.01, *** p < 0.001.
Table 4. Relative abundance (RA, individuals per 100 trap days) of M. agrestis populations in the sampling sites and species proportion among all trapped individuals (%).
Site Average, 2004–2020In the Year of Genetic Sampling
%RA%RASource
Joniškis3.30.672.20.49[43]
Pakruojis9.11.1112.61.00[44]
Zarasai7.90.113.10.12[45]
Rusnė1.50.277.60.70[46]
Publisher’s Note: MDPI stays neutral with regard to jurisdictional claims in published maps and institutional affiliations.

