Article

Bill Variation of Captive and Wild Chukar Partridge Populations: Shape or Size

by
Tamer Albayrak
1,* and
Ahmet İhsan Aytek
2
1
Department of Biology, Science and Art Faculty, Burdur Mehmet Akif Ersoy University, 15100 Burdur, Turkey
2
Department of Anthropology, Science and Art Faculty, Burdur Mehmet Akif Ersoy University, 15100 Burdur, Turkey
*
Author to whom correspondence should be addressed.
Diversity 2022, 14(1), 48; https://doi.org/10.3390/d14010048
Submission received: 16 December 2021 / Revised: 3 January 2022 / Accepted: 8 January 2022 / Published: 12 January 2022
(This article belongs to the Special Issue 2021 Feature Papers by Diversity’s Editorial Board Members)

Abstract

:
Traditionally, morphological characters are widely used to distinguish between interspecies and intraspecies. In addition to the size of morphological characters, shape has also been used as an indicator in the last decades. We evaluated the geometric morphometry and morphometric of the bill of Chukar Partridge, Alectoris chukar from captive and wild populations to determine the bill variation and population relationships. Although there was a size difference between the sexes, no shape difference was found. However, captive populations differed from wild populations in both size and shape. Although there was no difference in shape among wild populations, some differences were found in size. Moreover, bill sizes of captive populations were statistically longer than western, centre, and eastern wild populations. It was also shown that the western populations had the most significant variation among the wild populations. The results revealed that using the size and shape together was more effective in comparing populations.

1. Introduction

Morphological differences in species with the effect of evolutionary forces are significant in species identification, and these differences may be in the shape and the size of the morphological character. Moreover, Darwin described the finch species and explained their evolutionary relationship using bill characters. Supporting this argument, the size of the morphological characters was found to be important in distinguishing similar species from each other, such as Insecta [1], Amphibia [2], Reptilia [3], Mammalia [4], and Aves [5]. Although the size of morphometric characters is the same, species can be distinguished each other based on their shape [6,7,8]. In the morphological comparisons of different populations of the same species, geometric morphometry studies based on the shape of the morphological character, as well as the classical size comparison, have become increasingly common in the last decades [6,9,10,11,12,13].
Geometric morphometric is a method of shape analysis defined as the analysis of all geometric information taken from Cartesian coordinates of anatomical points [14]. Many scholars have argued that shape is more relevant than size because the shape is more variable than size between groups within a species [15,16]. Many shape differences can be seen between individuals due to different biological processes. Some shape differences can be attributed to disease or injury, ontogenetic development, adaptation to local geographic factors, and long-term evolutionary diversification [17]. Using geometric morphometry, species can be grouped into different animal classes, such as Mammalia [18,19], Reptilia and Amphibia [6,20,21], and Insecta [13,22,23].
The interest in using geometric morphometry on avian species has increased in the last decade [8,9,10,24,25,26,27]. In addition to actual specimens, geometric morphometry reveals significant results in avian fossil specimens [28]. Though most of the studies have focused on the skull shape of avian species, some studies have provided valuable results with respect to bill shape changes. For example, Foster et al. [11] assessed Darwin finches’ bill size and shape, and they reported that geometric morphometric analysis had better results than traditional measurements to discriminate specimens. In another study by Myczko et al. [8], three woodpecker species (Dendrocopos major, Dendrocopos syriacus, and Dendrocopos leucotos) were evaluated by traditional and geometric morphometric methods. The results showed that the species significantly differed in bill shapes, although the standard measurements were similar. Contrary to these studies, Kass et al. [29] reported that traditional morphometrics could separate two different skua species (Catharacta antartica lonnbergi and Catharacta maccormcki), but geometric morphometry could not separate them.
Morphological studies in birds are usually used to determine the size of the morphological characters [30] and to determine their differentiation between populations [2]. For example, Albayrak et al. [31] determined the description of the morphological characters of Kurper’s Nuthatch, Sitta krueperi and revealed that some morphological characters were significantly different between the northern and southern populations in Anatolia.
Whereas morphometrical studies are concerned with the character’s size, geometric morphometry is concerned with shape rather than size. In this respect, evaluating the size and shape of a morphological character together can be more efficient for comparing intraspecific and interspecific differentiation. We evaluated Chukar Partridge, Alectoris chukar samples from different wild and captive populations to compare their morphometric and geomorphometric differences and to determine their population relationship. The Chukar Partridge is farmed in many countries and released into nature since it is an important game bird. Its range is from the Balkans to the Middle East and Central Asia up to the Yellow Sea [32]. This study is based on the hypothesis that the size and shape of bills of Chukar Partridges may be different in wild and captive populations since the species is a non-migratory native species and the same lineage is used at the breeding stations. The bill of Chukar Partridge was studied to determine both the morphometry (size) and geometric morphometry (shape). In the light of the facts mentioned above, in this study, we aimed (i) to find out whether there is sexual dimorphism, (ii) to test the differences among different wild and captive populations, and (iii) to compare the shapes and sizes of the bills of Chukar Partridges.

2. Materials and Methods

2.1. Study Area

Wild Chukar Partridges were randomly sampled during the 2018–2019 hunting seasons in four western (Burdur: BUR, Çanakkale: CAN, Eskişehir: ESK, Muğla: MUG), three centre (Çankırı: CNK, Niğde: NIG, Sivas: SIV), and three eastern (Bitlis: BIT, Erzurum: ERZ, Van: VAN) localities throughout Turkey. We used three breeding stations (in Afyon: BSA, in Kahramanmaraş: BSK, in Malatya: BSM) belonging to the ministry. Approximately 10,000 Chukar Partridges are produced with the same bloodline in each breeding station annually. Captive ones were randomly selected and euthanized by the principal veterinary of each station. In total, 128 wild and 44 captive Chukar Partridges were sampled. All captive samples were used together in the analyses because they came from the same bloodline. All legal permissions required for study were obtained from the ministry. The MAKU-HADYEK-169 protocol controlled all the experiments on Chukar Partridges by MAKU, Local Ethical Committee on Animal Experiments regulations.

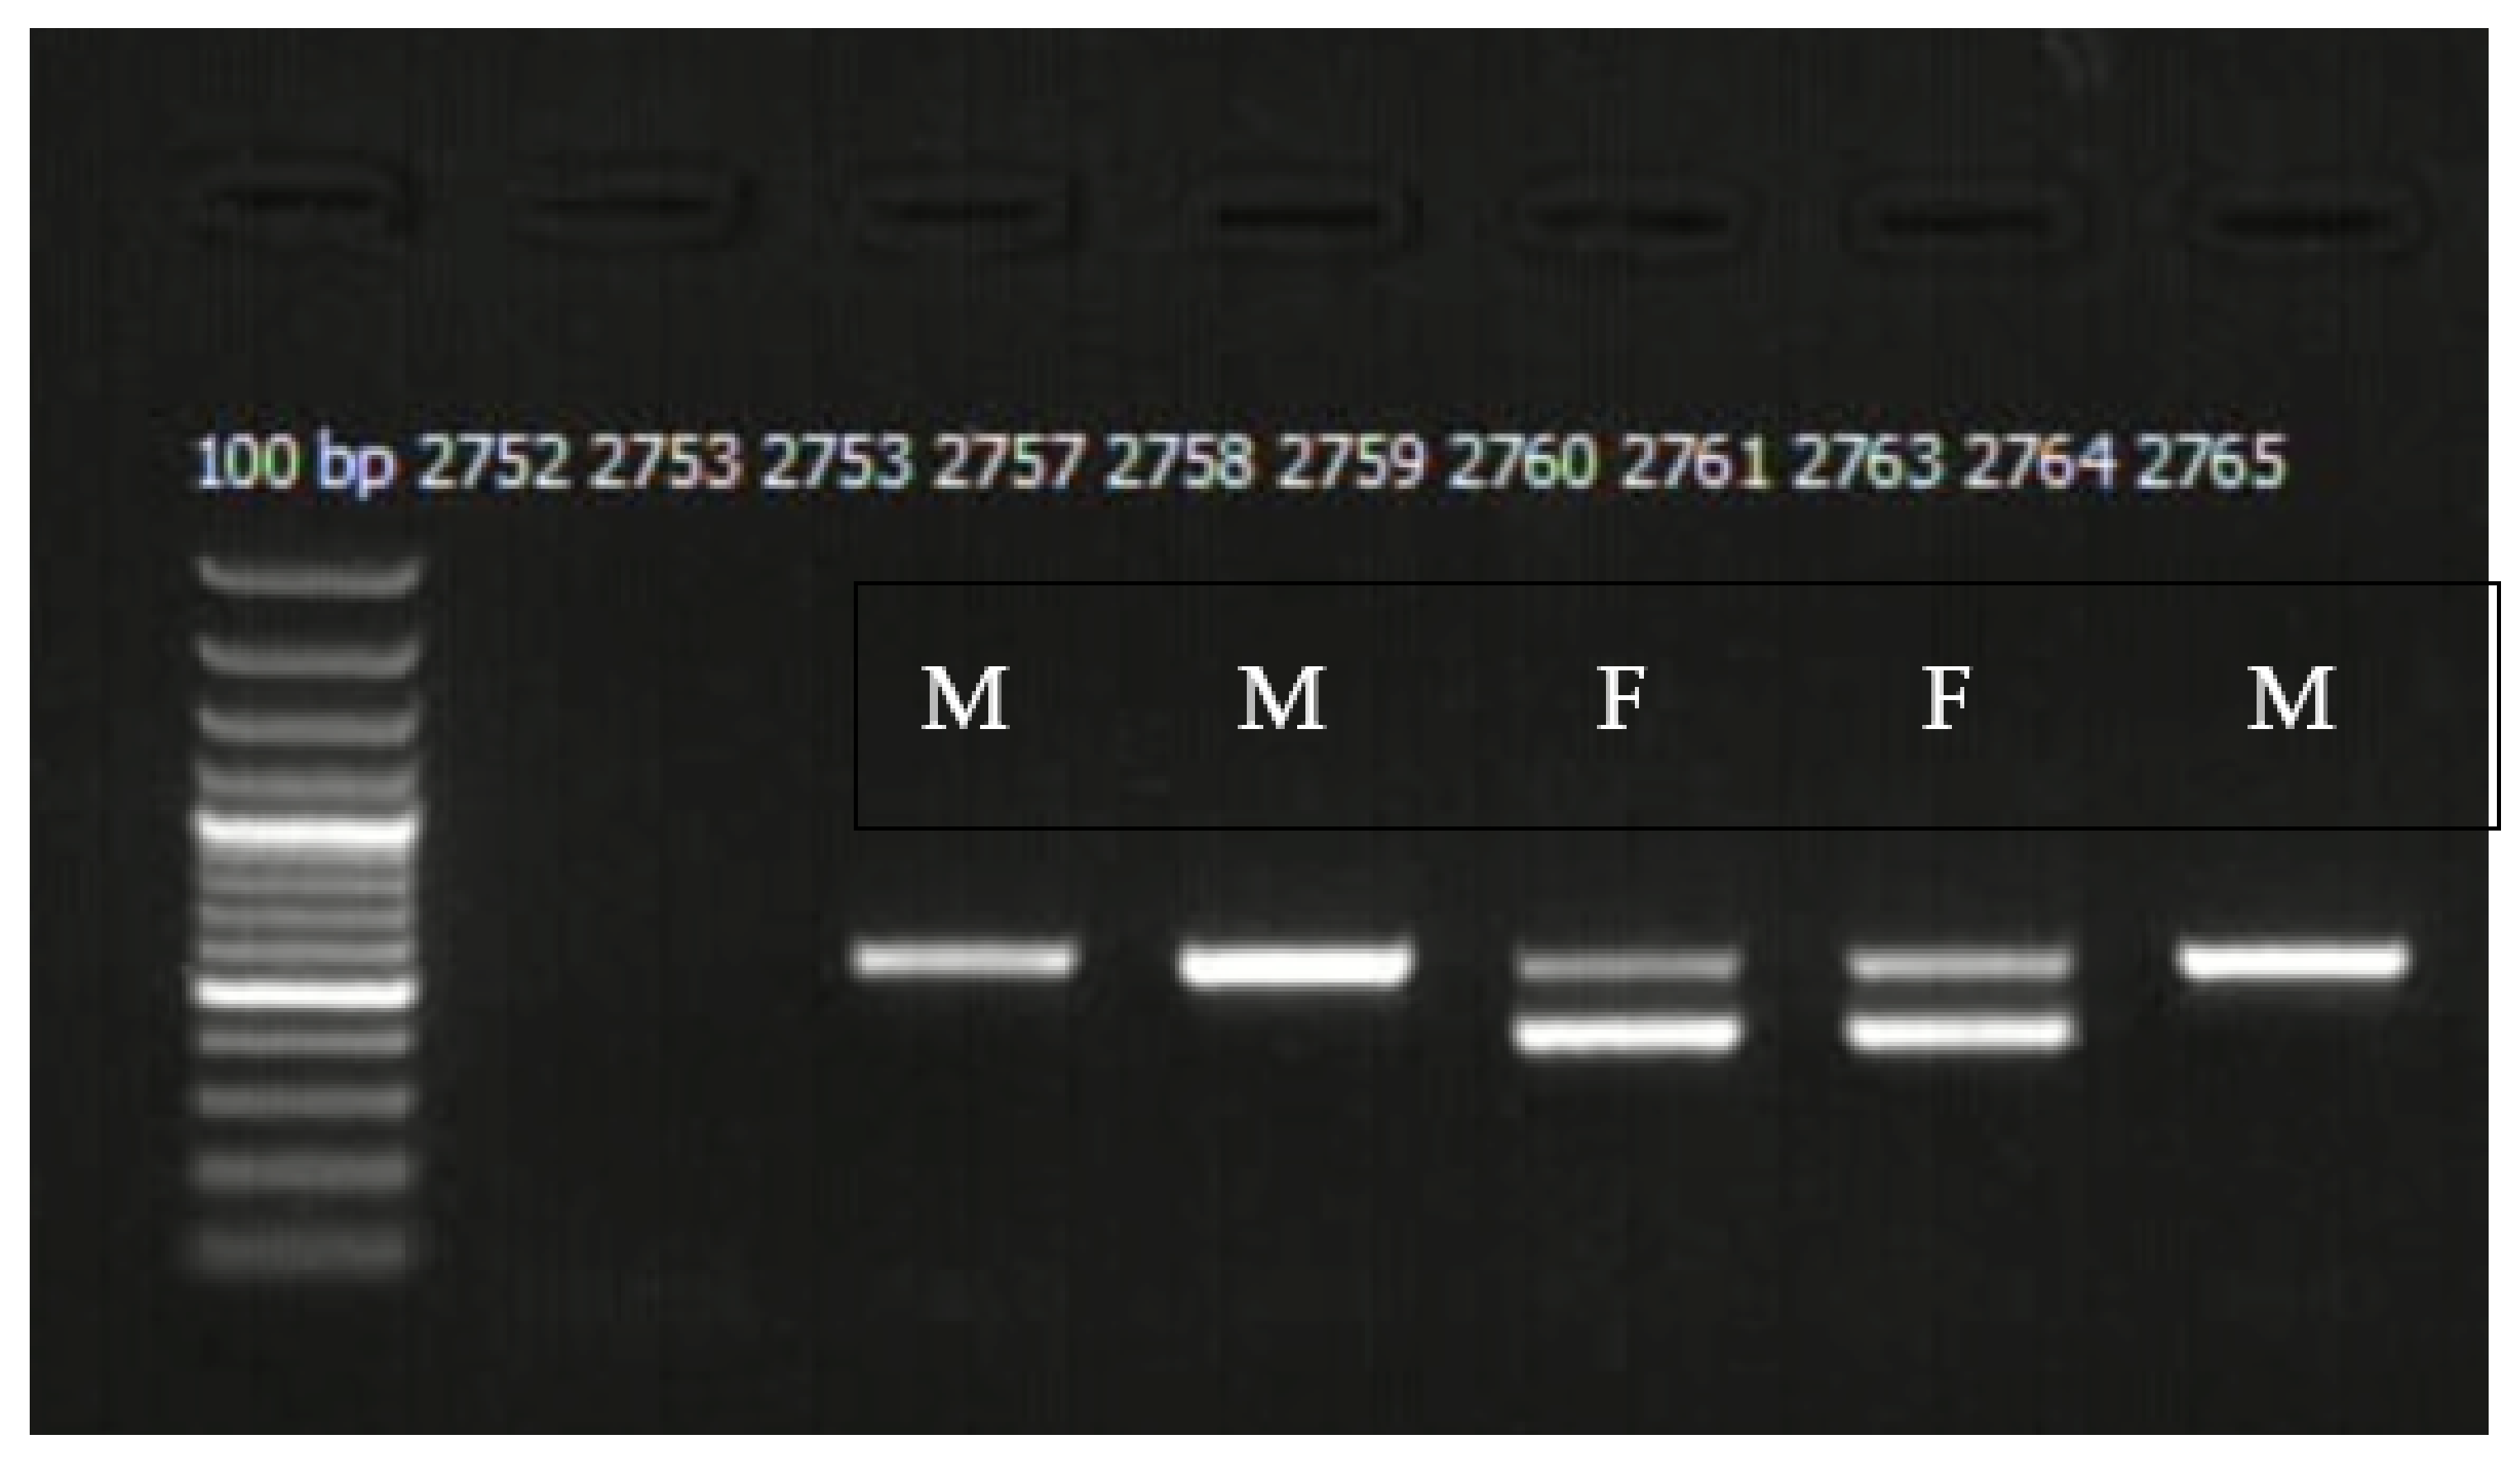
2.2. Molecular Sexing

The secondary sex characters of male and female Chukar Partridge are not wholly reliable in sex determination, for example, spur occurs in males and old females. For this reason, molecular sexing methods should be used to determine their sexes precisely. Muscle or blood tissues were preserved at room temperature in absolute ethanol. According to the manufacturer’s instructions, total DNA was extracted using the Thermo, GeneJET Genomic DNA Purification Kit, or Qiagen Dneasy Blood & Tissue Kit. Molecular sex determination was performed using 2550 F (5′-GTTACTGATTCGTCTACGAGA-3′) and 2718 R (5′-ATTGAAATGATCCAGTGCTTG-3′) primers. These primers were designed to amplify the homologous parts of CHD-W and the related gene CHD- Z. The PCR conditions were as follows: 100 to 200 ng/μL total DNA, 1 μL for each primer (2550F, 2718R), 0.2 μL Taq DNA Polymerase (Thermo Scientific), 5 μL dNTP mix, 2.5 μL MgCl2, 5 μL 10X PCR Buffer (Invitrogen), and sterile dH2O up to a total volume of 50 μL. The PCR profile was performed with an initial denaturation step at 94 °C for 7 min, followed by 30 cycles of 94 °C denaturations for 60 s, annealing at 55.5 °C for 120 s, and extension at 72 °C for 60 s. A final 10 min extension at 72 °C completed the PCR profile. PCR products were separated by electrophoresis for 60 min at 80 V in a 3% agarose gel stained with cyber green and visualized under UV light. Due to size differences between the W and Z fragments, females displayed two bands, W and Z copies while males display one band, two copies of the Z fragment (Figure 1).

2.3. Morphometry

As suggested by Svensson [33], four morphometrical bill characters of the Chukar Partridge were measured using a digital calliper (0.01 mm) by the same researcher in the laboratory: bill length (BL), bill width (BW), bill height (BH), and length of the nostril to bill apex (LNBa) (File S1). Descriptive statistics, such as mean and standard deviation (SD) of the four bill sizes by locations and gender, were investigated before the further analyses. A quantile-quantile (Q-Q) plot showing these data distributions against the expected normal distribution and the Shapiro-Wilk normality test were used to investigate the morphometric characters for normal distributions. To determine whether there was sexual dimorphism (aim i) and differences among different wild and captive populations (aim ii), we used a t-test and Principal Component Analysis (PCA). Each bill character was used for the t-test to understand the potential differences between two groups, such as gender and location. Using all four bill characters together, Principal Component Analysis (PCA) was performed to determine whether there was a difference between genders and locations. PCA is a statistical analysis that allows us to summarize the information contained in large data tables by means of smaller set of summary indices that can be more easily visualized and analysed.
To understand the overall differentiation between the size or shape of the bill of Chukar Partridges (aim iii), we used all the samples without using sex information. All characters were used together in the Hopkins statistic and cluster analysis. The Hopkins statistic was conducted to understand whether our data could be clustered or not. The Hopkins statistic is a way of measuring the cluster tendency of a dataset, and Hopkins statistic values greater than 0.5 indicate a tendency of data to cluster. This statistic measures the nearest-neighbour distance for each point in the dataset and compares this with the nearest distances from simulated datapoints to a real datapoint. Cluster analysis was performed to understand how many clusters the entire dataset would be grouped in without any location information. All statistical analyses were conducted using R Studio software [34].

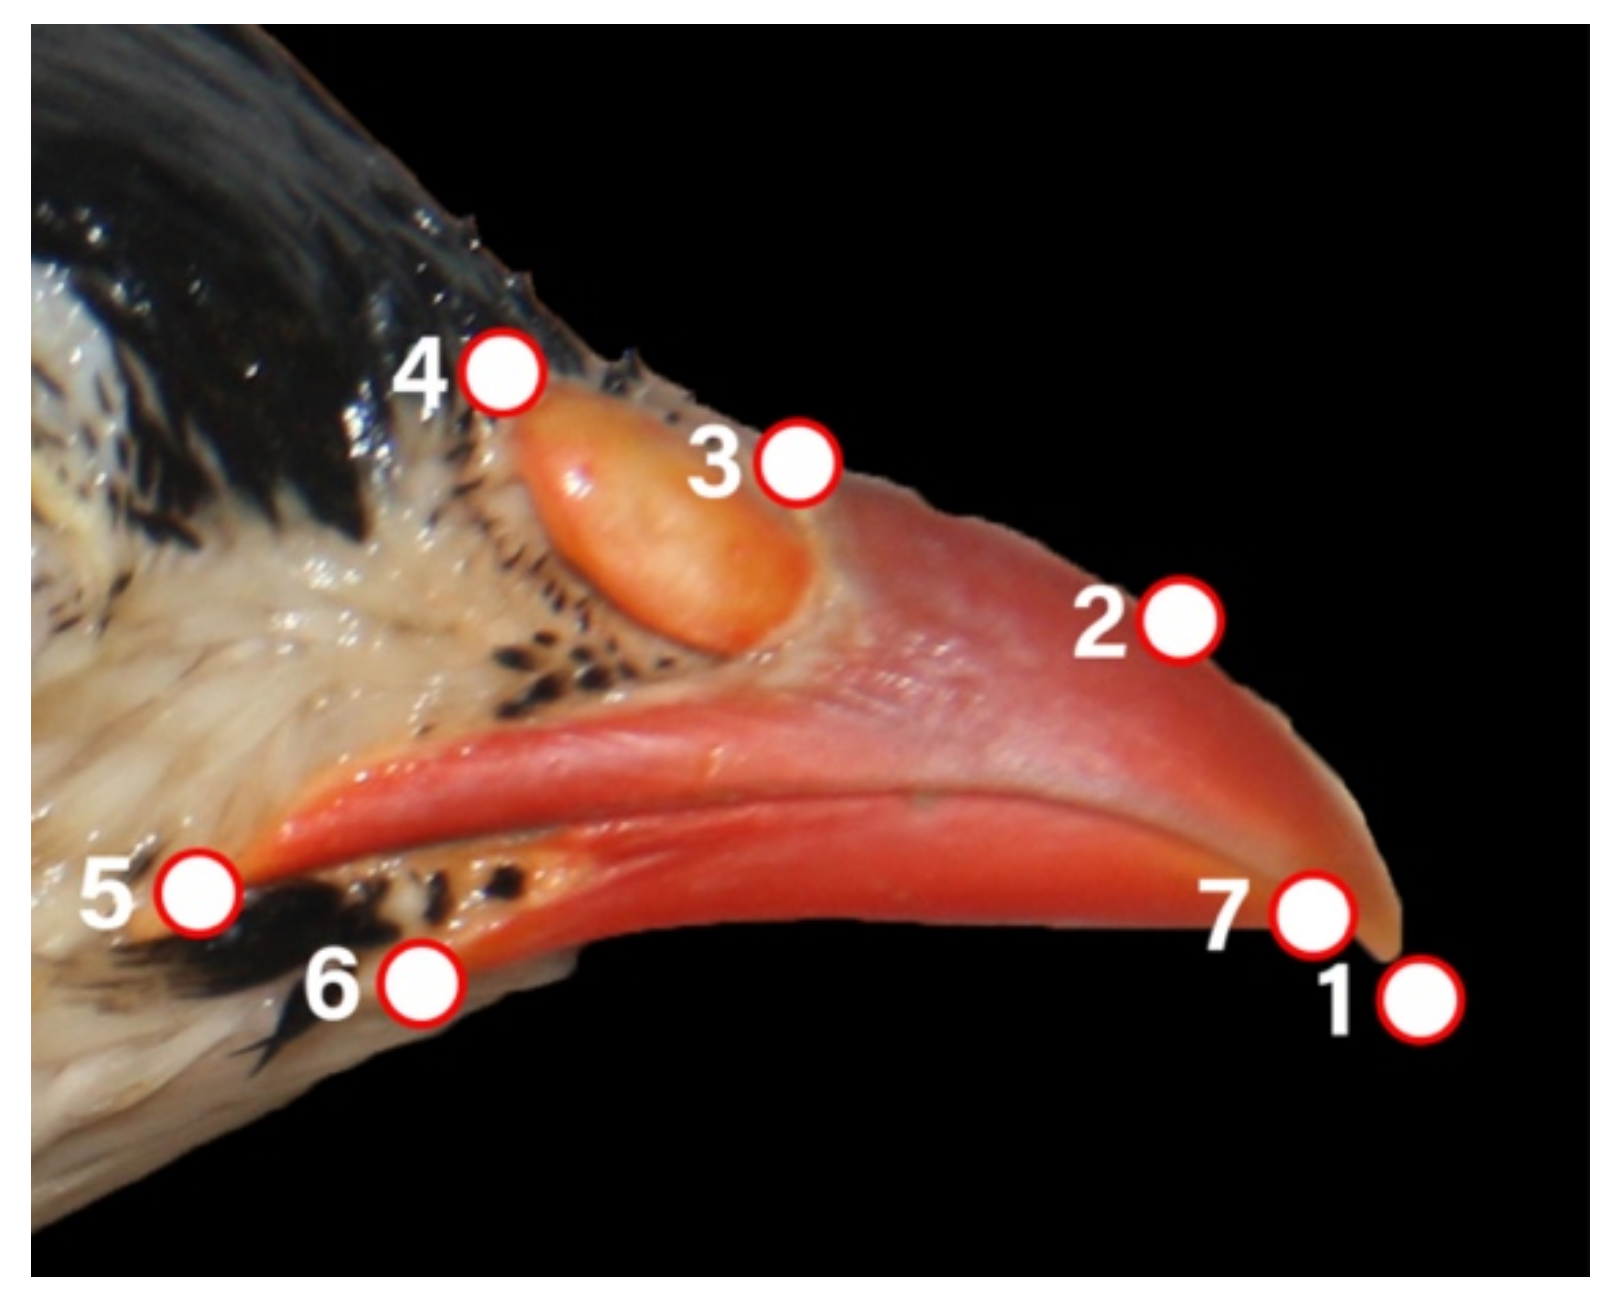
2.4. Geometric Morphometry

We captured 2-dimensional photographs of the skull (18 × 205 Canon EOS 1000D with Sigma lens) from the right lateral side. The pictures were taken from 50 cm by a camera placed on a tripod with a water gauge. The landmarks were detected in two phases using Tps programs over 2-dimensional photographs. In the first phase, the pictures were introduced into the tpsUtil Version 1.60 [35] and saved as tps files. The landmarks were marked on the photographs in the second phase through the tpsDig2 Version 2.18 program [36], and the Cartesian coordinates were determined. Totally 7 landmarks were taken on the bill (Figure 2). To remove the effect of direction, position, and size on variation over the Cartesian coordinates obtained by marking the landmarks, these data were overlapped by Generalized Procrustes Analysis using the MorphoJ 1.06 [37]. We performed Prinicpal Component Analysis over the new coordinates obtained by overlapping, and the shape variation was revealed. In addition, it was shown that the principal components caused shape changes the landmarks’ program using the MorphoJ 1.06. Data on the landmarks were saved as a text file for statistical analyses (File S1). The PAST 3.21 software was used for statistical analyses [38].

3. Results

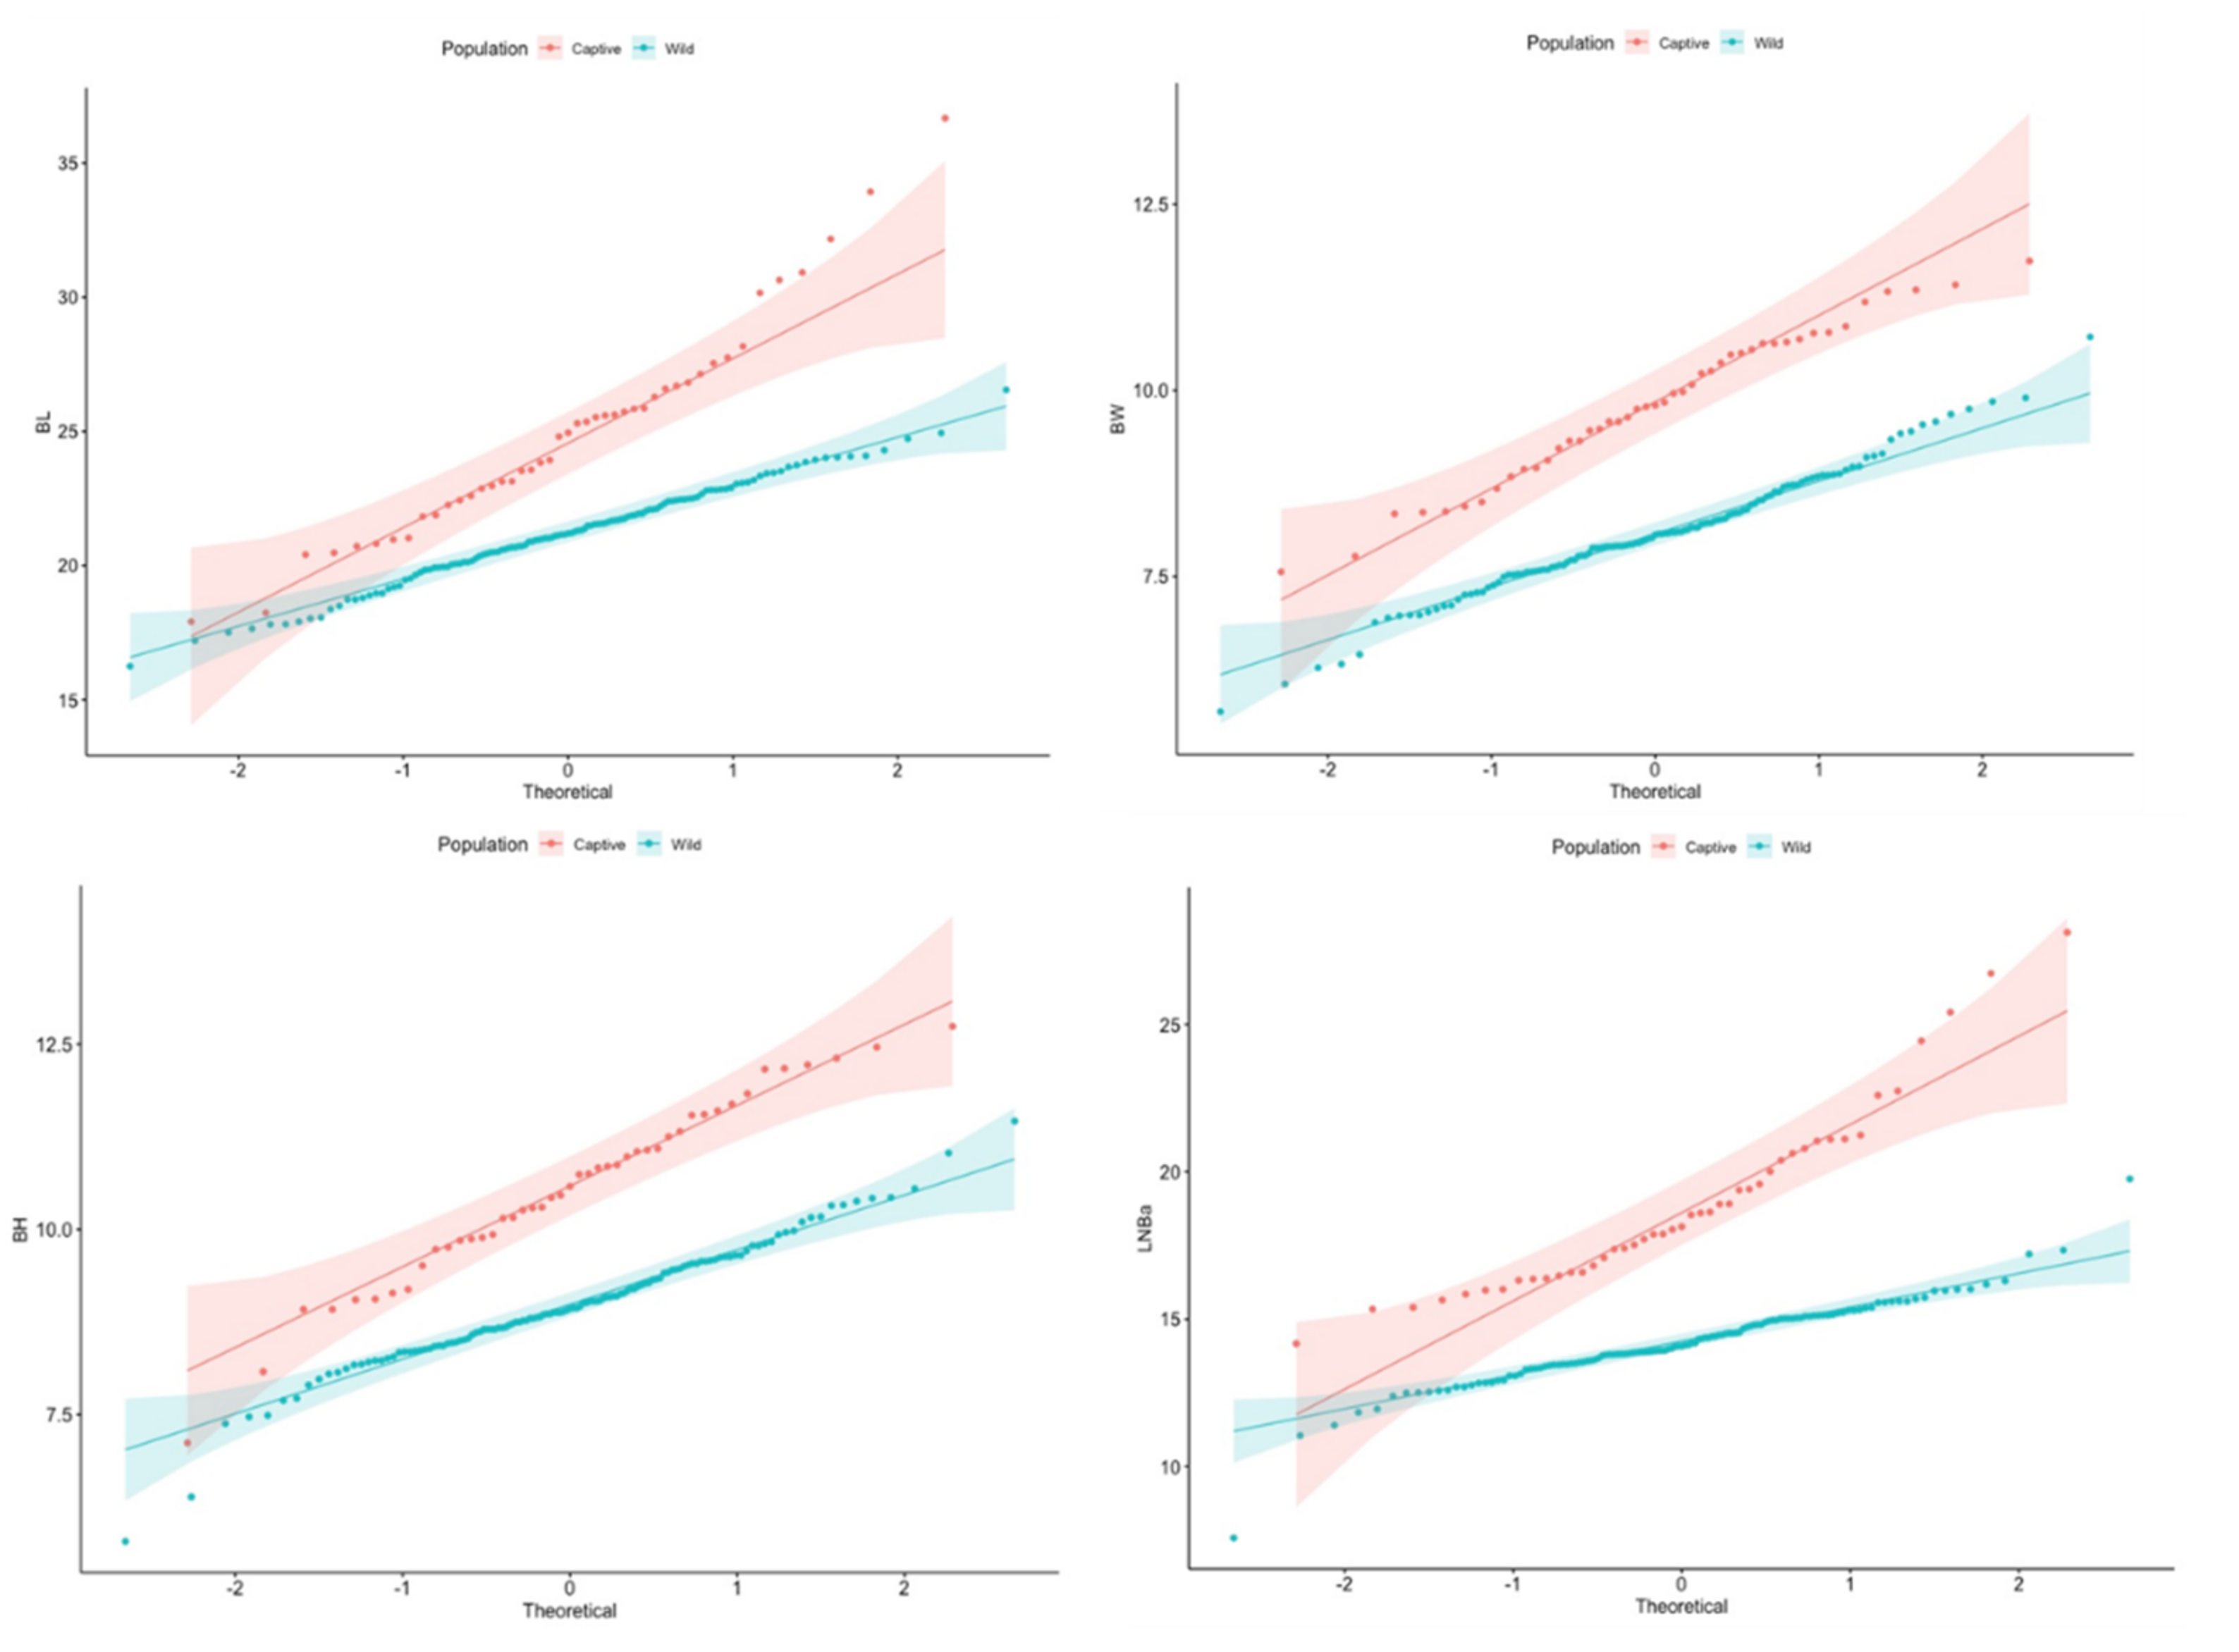
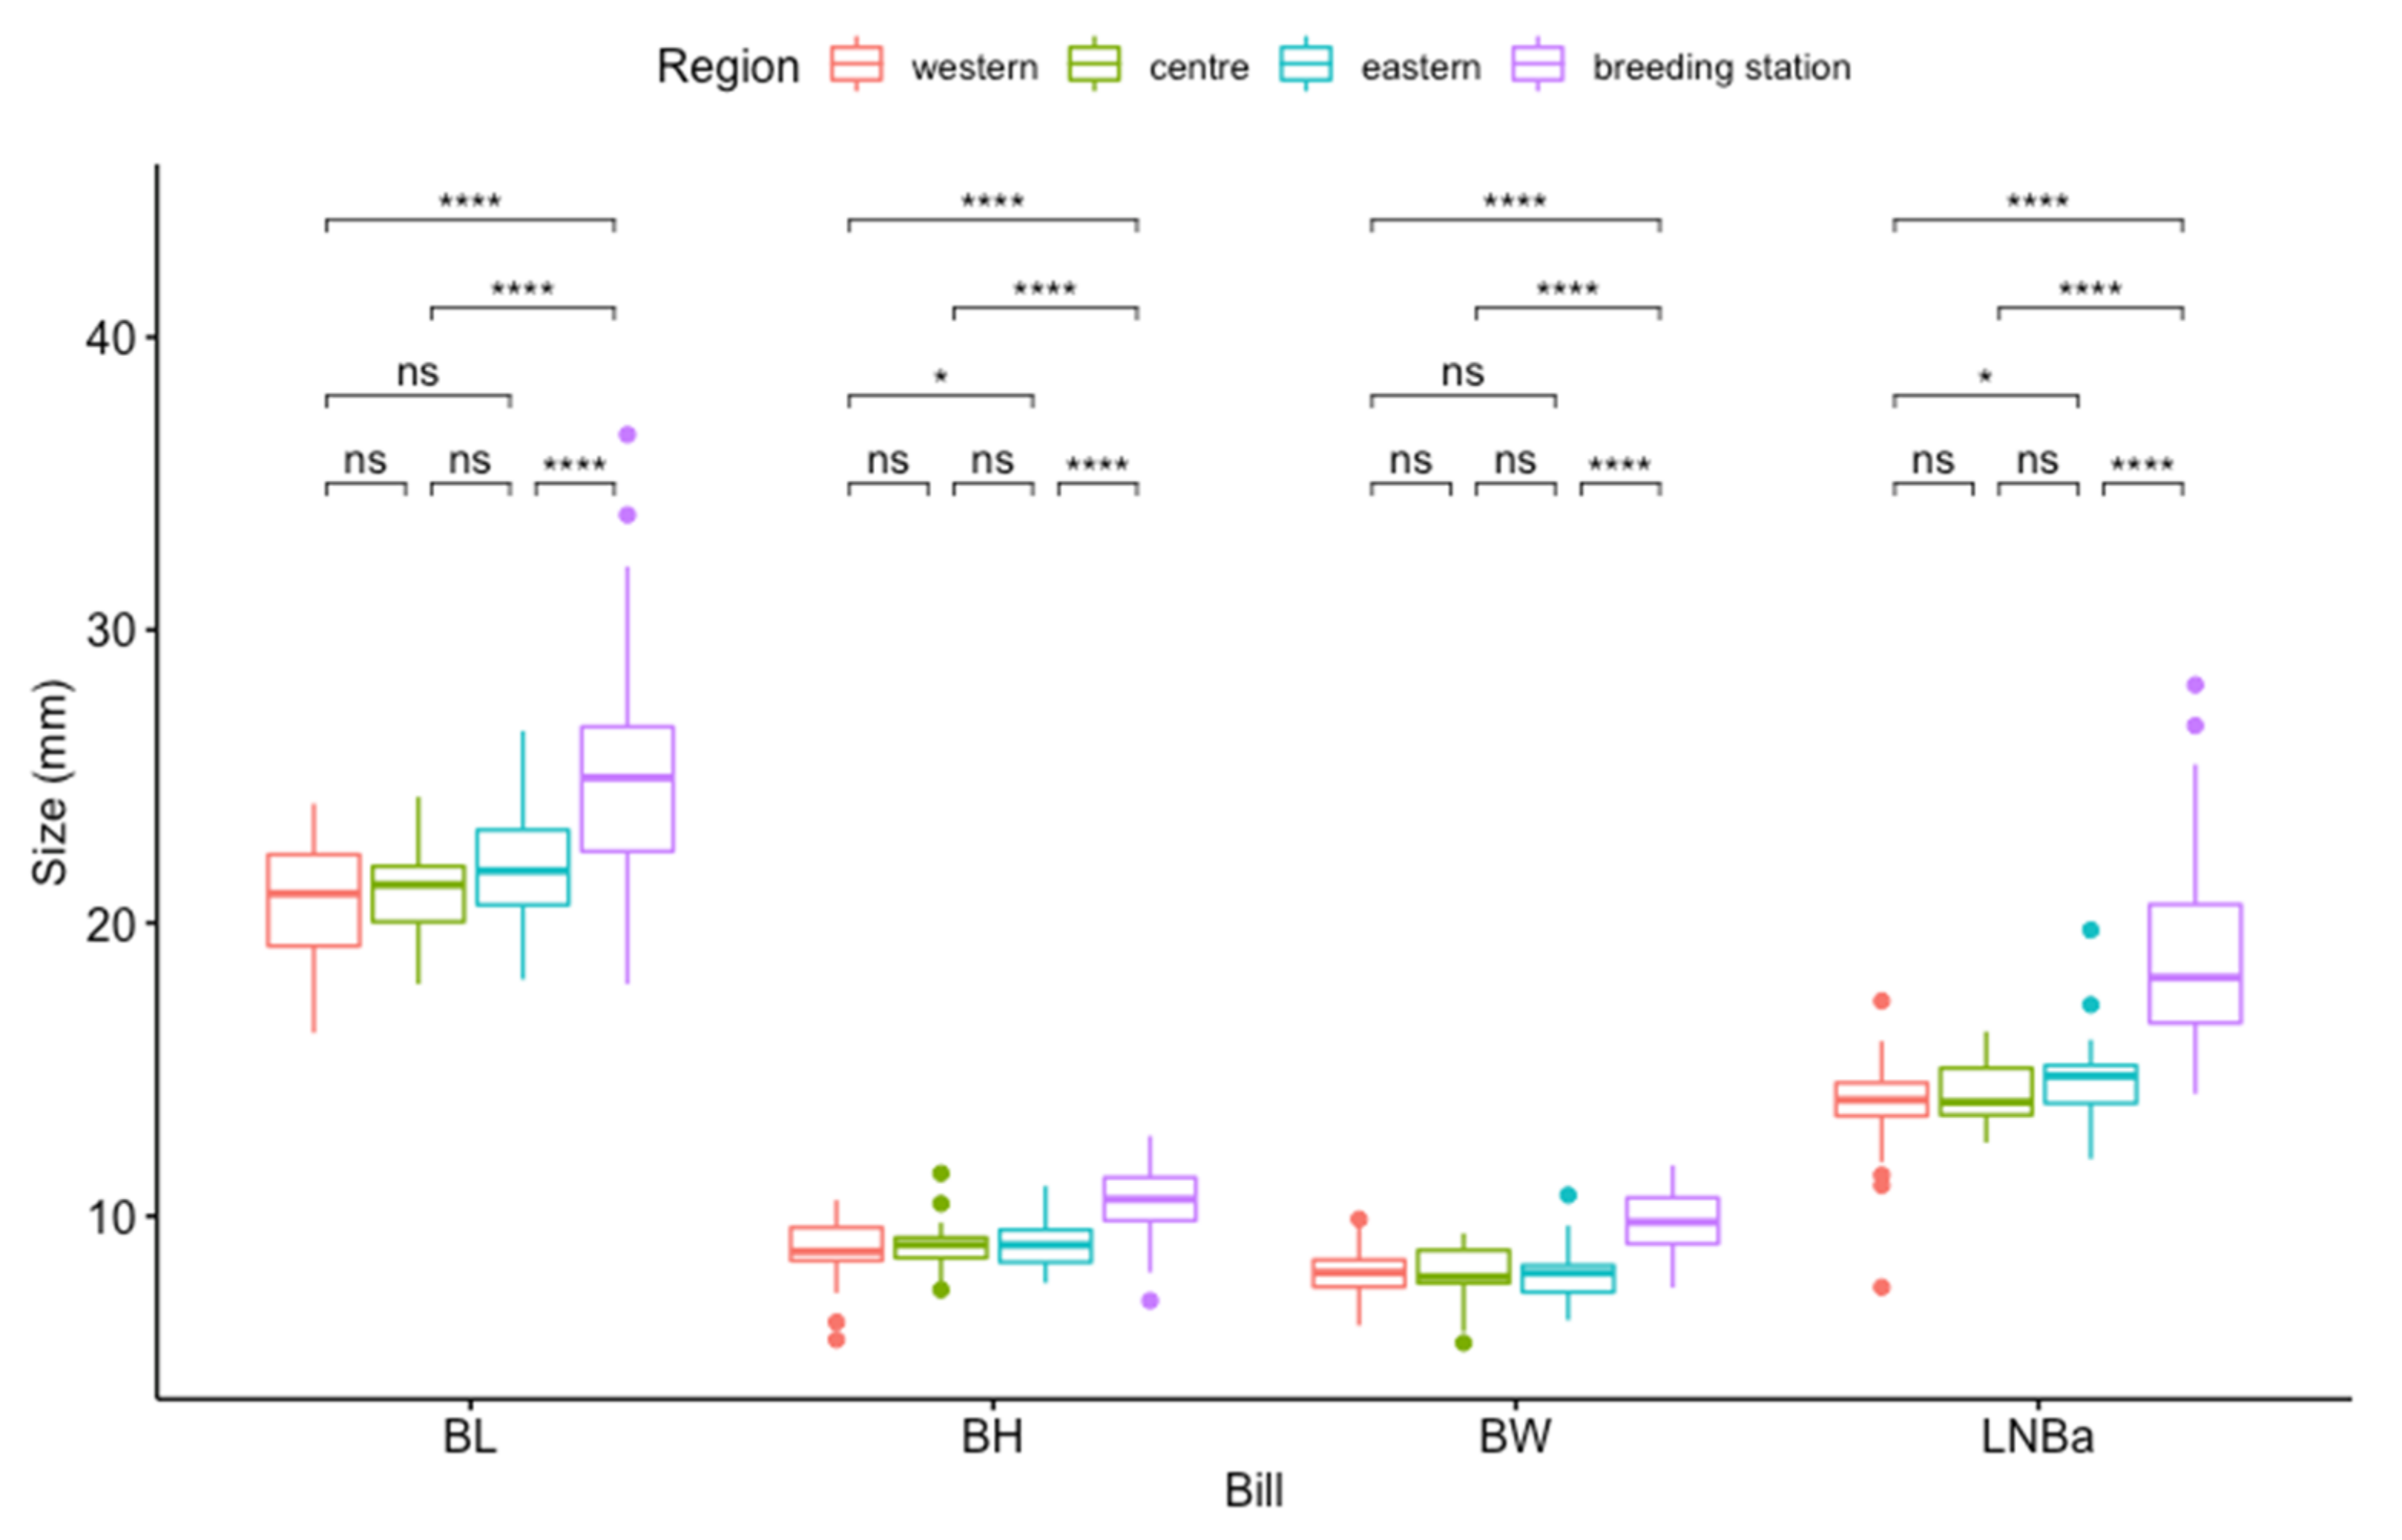
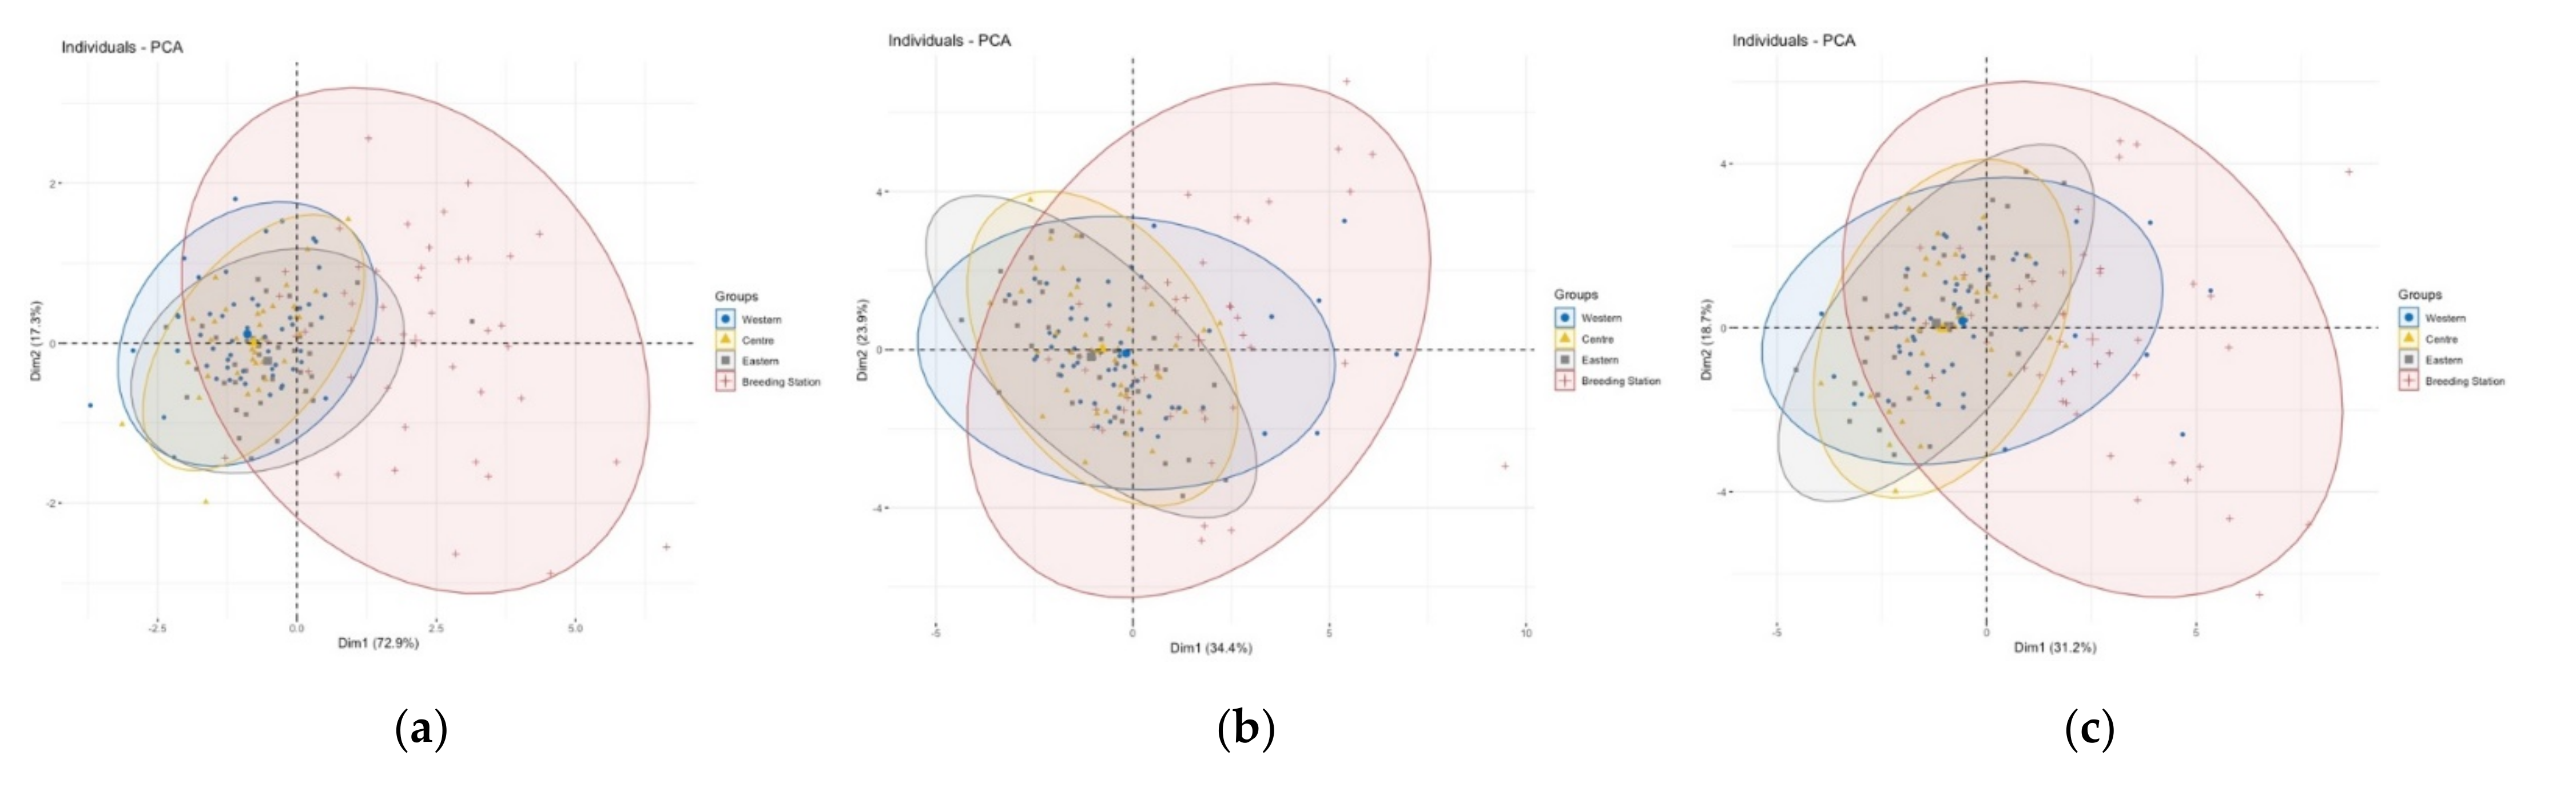
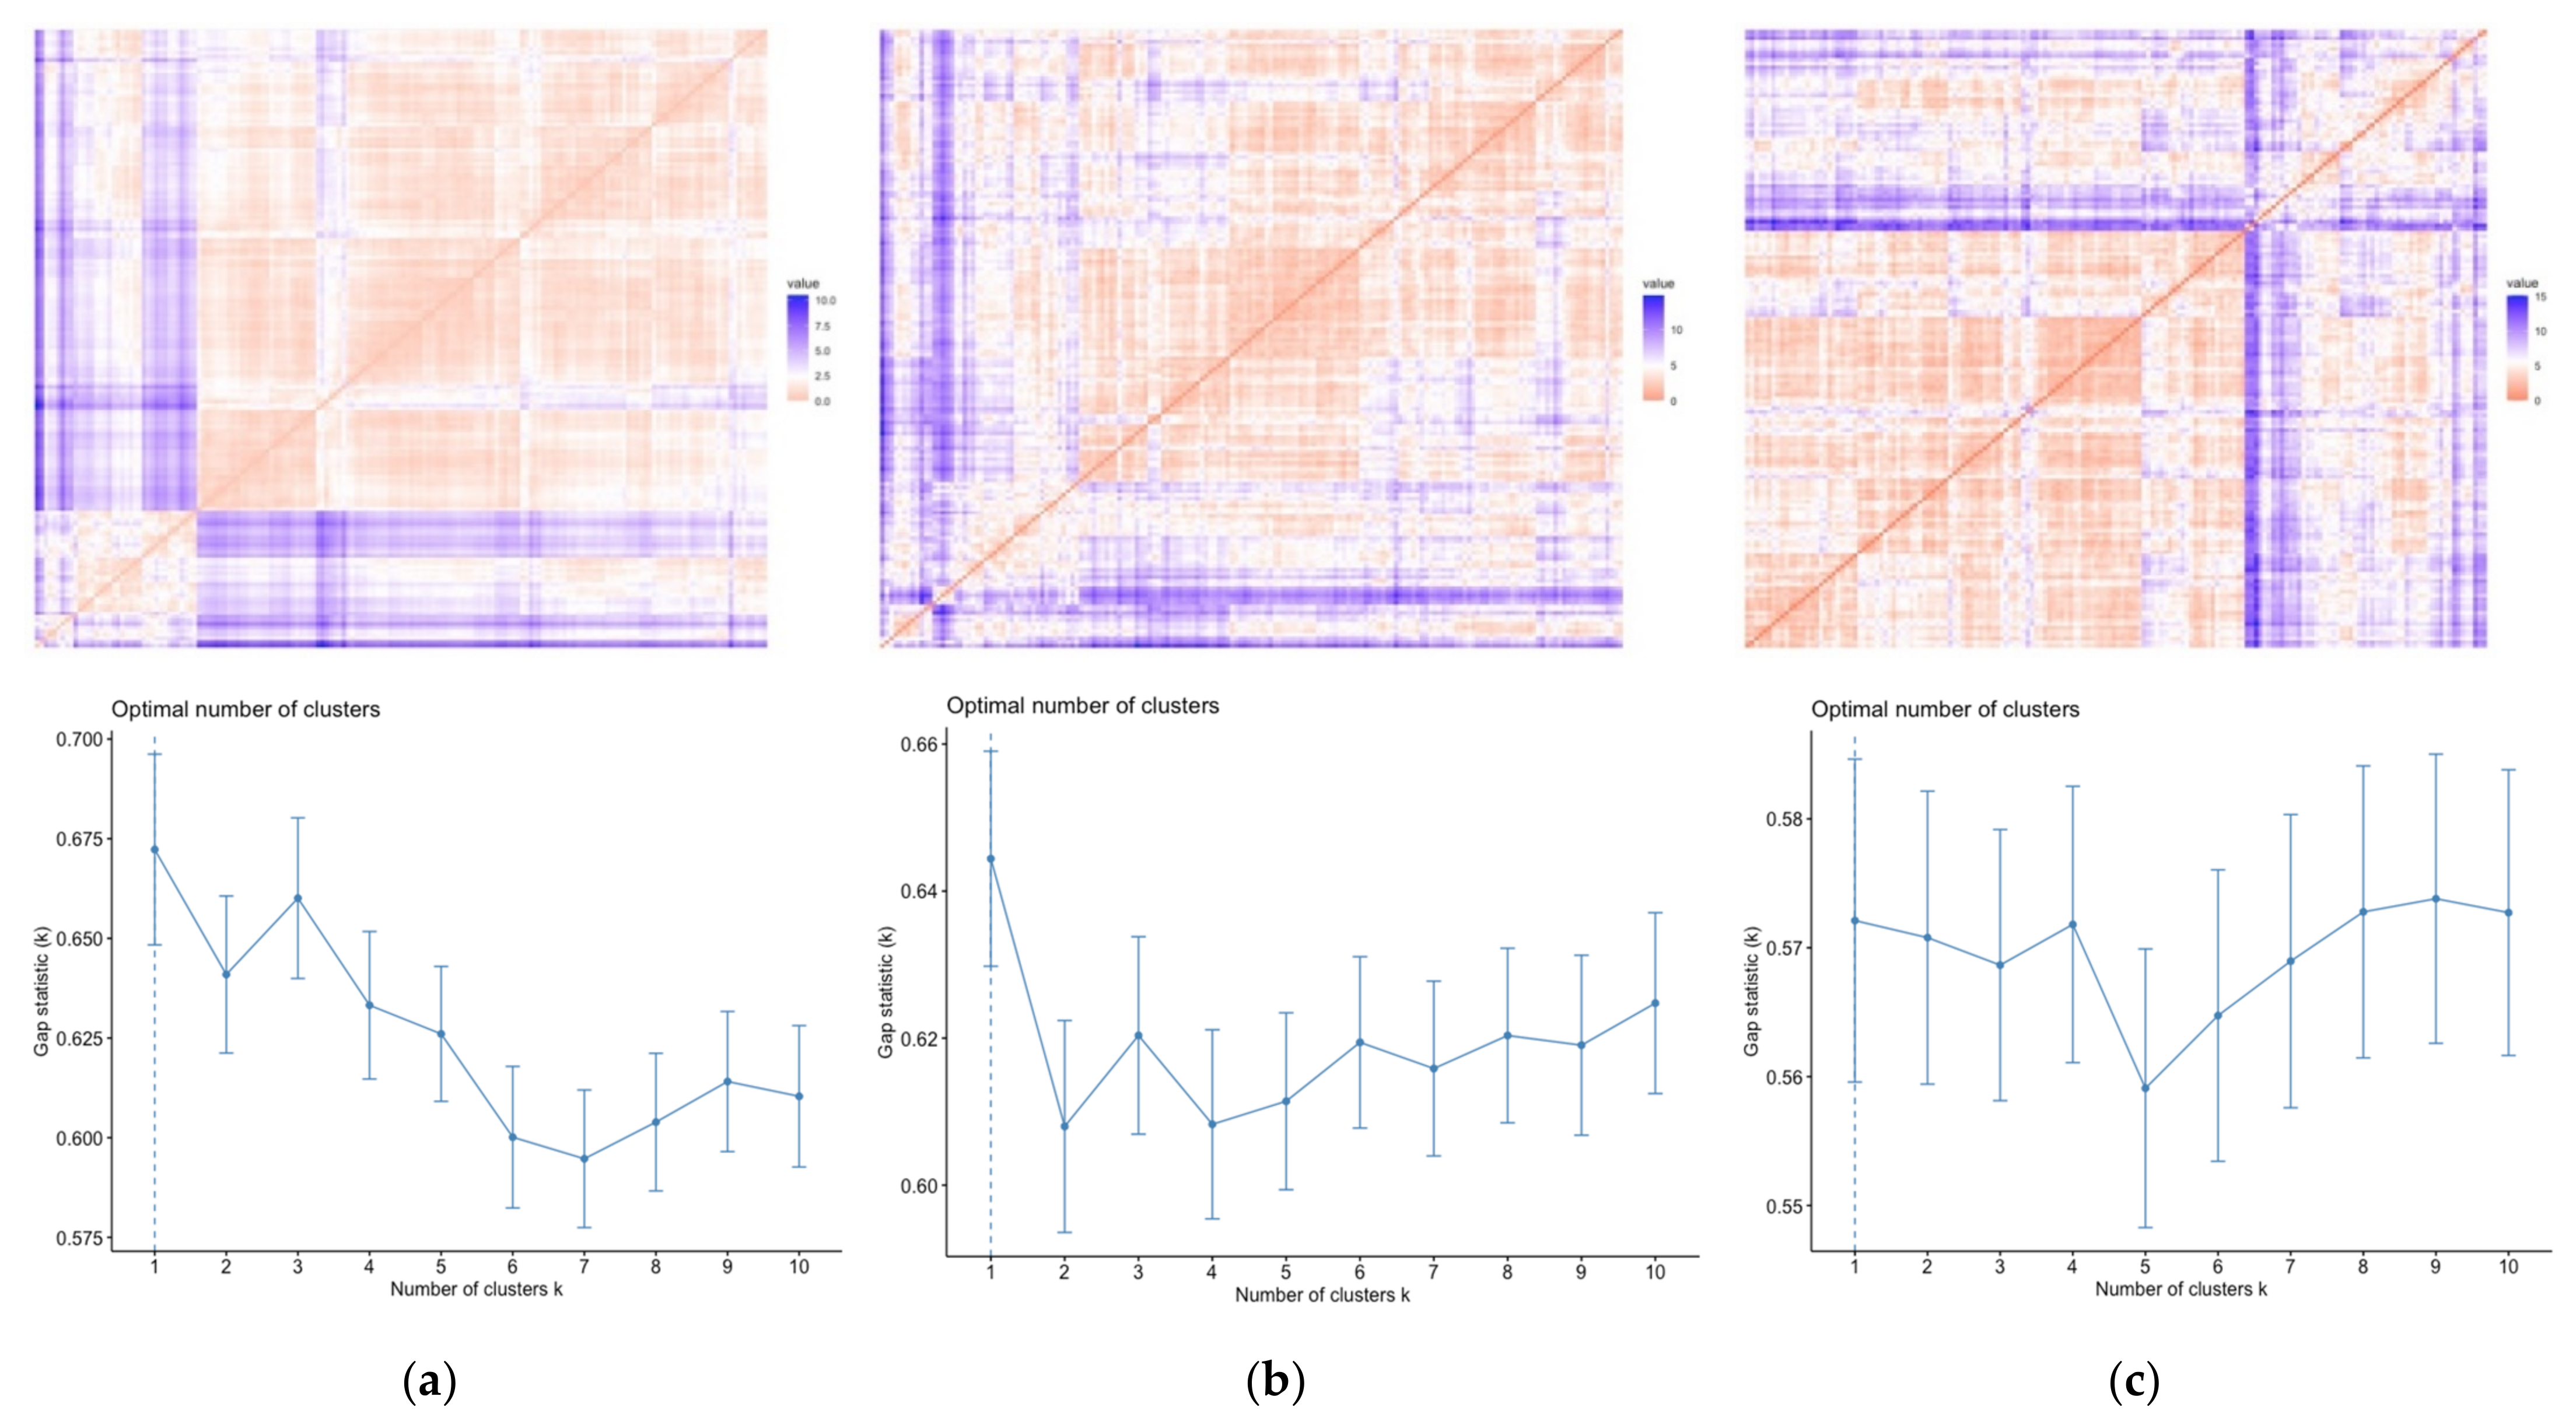
3.1. Population Differences

The data of the morphometric characters and sizes of the bill were found to be normally distributed by a Shapiro-Wilk’s test (p < 0.05) and a visual inspection of Q-Q plots (Figure 3). We found that 48 females and 50 males, accounted for 56.9% of the 172 samples using the molecular sexing method (File S1). Three sets of morphometric (M; size), geometric morphometric (GM; shape), and M + GM analyses were conducted to determine the sex differences of the Chukar Partridge’s bill.
We found some differentiation between male and female bill sizes, M, but not BW (Table 1). Chukar Partridge males were found to have bigger bill sizes than females. However, the PCA did not support the differentiation when using the four M characters together (Figure 4). In addition, no significant difference in bill shape, GM, was found between male and female specimens in wild, captive, and together (Figure 4). Furthermore, we did not find differences between sexes using M + GM together (Figure 4).
All specimens were evaluated together for comparison of the localities. The smallest bill length in the western populations was CAN and ESK for BL, ESK for BH, CAN for BW, and ESK for LNBa. The largest bill length was VAN for BL, SIV for BH, MUG for BW, and VAN for LNBa (Table 2). The bill sizes of captive populations were statistically bigger than the western, centre, and eastern wild populations (p < 0.05; Figure 5).

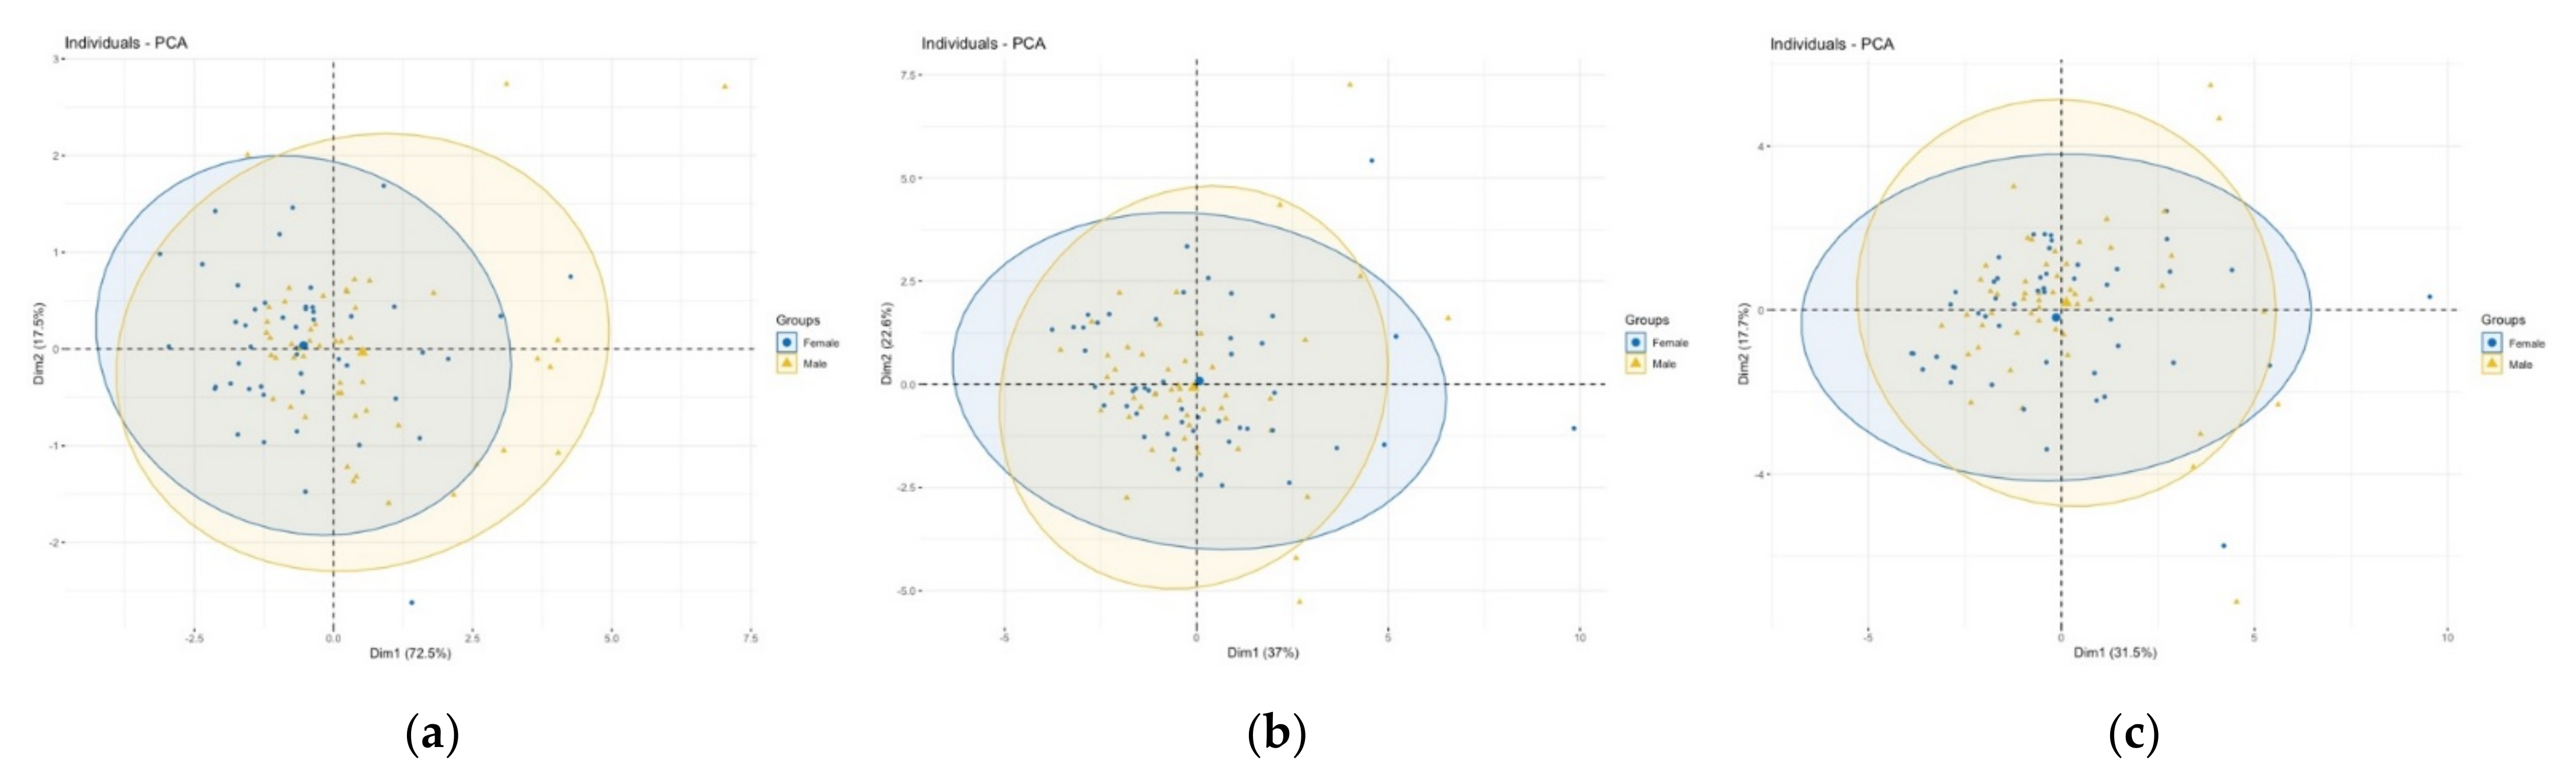
3.2. Comparison of Size and Shape

The principle component analysis showed that the variation in captive specimens was more remarkable than wild specimens for M, GM, and M + GM (Figure 6). All wild populations—western, centre, and eastern—were mixed in the PCA of M, GM, and M + GM. Although the M and M + GM of captive Chukar Partridges were different than the wild populations separated from Dim 1, the difference of GM was not fully observed (Figure 6).
The Hopkins statistic shows that these data are highly clustered. The lowest similarity was the size, followed by the shape and size + shape, respectively (M = 0.83, GM = 0.77, M + GM = 0.75; Figure 7), when using all samples together without any location information. The optimal number of clusters was one for the M, GM, and M + GM data using all samples together in cluster analysis. The second optimal number of clusters was three for M and GM but four for M + GM (Figure 7).

4. Discussion

Our results indicate the population diversity of the bill in wild and captive Chukar Partridges populations located in Turkey. The bill size and shape of Chukar Partridges were compared between sexes and locations.

4.1. Population Differences

Chukar Partridge is one of the most famous game birds throughout America, Europe, and Asia [39]. Although both sexes are very similar morphologically, the traditional method of identifying males with a spur at the tarsus is unreliable because old females have also spurred. Sex ratios need to be known to analyse the population’s effective population size and trend. In general, the proportion of sexes in the population is theoretically expected to be 1:1 if the production costs of males and females are equal, and this ratio is essential in protecting endangered species [40,41]. The molecular sexing method, which helps determine the sexes of species such as the Black Francolin (Francolinus francolinus) [42] and Woodcock (Scolopax rusticola) [43] without secondary sex characteristics and chicks [44], was also used for Chukar Partridges. As a result of using the molecular sexing method on 98 randomly selected Chukar Partridges, the sex ratio was found in the population with the theoretically expected 1:1 ratio (F:M, 0.98:1.02), showing that there is no selection on one sex in the population. Males of Chukar Partridges are larger than females [39]. This was also found in bill size, with males having a more extended bill size. We found that captive Chukar Partridges have a longer bill than wild individuals. Although there were some differences in morphometric size (M) between the sexes, no difference was found in shape based on the geometric morphometric (GM) analysis. We understood that the sizes of the morphometric characters of the bill are different except for BW, but the shape is same in male and female Chukar Partridges. The reason why the bill shape is the same while the size is different between genders may be related to the fact the only difference between partridges of different sexes is body size [39]. However, the PCA showed that when size (M), shape (GM), and size + shape (M + GM) were evaluated, there was no size or shape difference between the sexes. As a result, all samples were assessed together without gender information. We used the PCA because the values could be log-transformed and standardized. Kark et al. [45] suggested that there were two possibilities for applying a PCA: one could run (i) a separate PCA of the individuals in each population or (ii) an overall PCA of individuals in all populations combined, and then project each population onto the new global principle component variables and calculate variances.
When we evaluated all samples together, similar results were only found with sex-specific evaluation, revealing that the lengths of all M characters of Chukar Partridges in breeding stations were statistically larger than the wild ones (p < 0.05). A larger bill in captive individuals may be due to the feeding strategy in breeding stations and the fact that partridges are produced in small cage environments. Moreover, while Chukar Partridges feed in the natural environment, they prevent their bills from elongating by rubbing them on the ground and stones. Captive Chukar Partridges’ bills may have been longer because they could not perform these behaviours in a cage environment. Areas of environmental transition, ecotone, and heavy metal affected the bill size of Chukar Partridges [45,46]. When only wild populations were evaluated, it was determined that the eastern Chukar Partridges had statistically longer BL and LNBa than western populations. This longer bill of eastern Chukar Partridges may be related to the Bergmann hypothesis that individuals living in cold regions are larger than individuals living in hot regions. The eastern region has a colder climate than the western region in Turkey. Similarly, it was found that the populations living in cold areas are larger [47]. When localities were compared with respect to bill shape (GM), individuals in breeding stations were more diverse but were not statistically different from wild ones. Although GM studies on Geospiza fortis [11] and Tyrannus savana species [25] found a shape difference between populations, no such difference was determined between the populations of Chukar Partridge.

4.2. Comparison of Size and Shape

Traditionally, M characters, i.e., size, are important markers used to distinguish species [1] and to determine differences between populations of the same species [5]. GM studies developed in the last decade have been used to distinguish morphometric characters, such as the bill, based on shape differences rather than size [10,24,28,29]. Thus, it was found that there is a significant difference in bill shape, whereas the traditional body measurements between the Great Spotted Woodpecker and Syrian Woodpecker are similar [8]. Furthermore, geometric morphometry is also valuable for showing shape differences in different populations of the same species [9,10,26]. In differentiating species of the Scolopacidae family from each other, in addition to bill size, the shape is also important in the distinction of the species identification, i.e., whether the bill is flat, down, or upwardly curved [48]. Bill lengths of Chukar Partridges in the breeding station were statistically separated from the wild ones, but an absolute difference was not found in shape. This is because the bill shapes of Chukar Partridges are the same, but their sizes are different. When only wild populations were evaluated, although the shape variation was high, no statistical difference was found in terms of shape or size. Moreover, when M + GM were assessed together, no significant difference was found.
The Hopkins statistics revealed different levels of general clustering tendency for bird songs [49]. The Hopkins statistic values were found as M = 0.83, GM = 0.77, M + GM = 0.75 when all samples were evaluated without locality information. The Hopkins statistic values of our data were found to be greater than 0.5. This value indicated that our data were suitable to cluster. In addition, the Hopkins’ statistic values greater than 0.5 with larger k values indicate a tendency of data to cluster in larger cluster sizes. The highest Hopkins statistic value was found in M, followed by GM and M + GM. When we performed cluster analyses, we found that in all three cluster analyses for M, GM, and M + GM, the optimal number of the cluster was determined as 1. However, the second optimal cluster number was M, whereas GM was 3 and M + GM was 4. This is compatible with the four regions, the western, centre, eastern, and breeding stations used in the study. Klingenberg [7] suggested that not only size but also shape should be used in allometric studies. Allometry refers to the size-related changes of morphological traits and remains an essential concept for studying evolution and development. This has led to the conclusion that, in addition to comparing populations in terms of size and shape of the morphological character, both M and GM may be more effective in grouping the populations.

5. Conclusions

We compared the size and shape of the bill of Chukar Partridge from captive and wild populations. Although there was a difference between the sexes of Chukar Partridges in bill length, no difference was found in shape. In addition, we found a significant difference in size between captive and wild populations, but difference was found in shape. Moreover, there was no significant difference in size or shape between the wild populations evaluated. The hypothesis of the study that “the size and shape of bills of Chukar Partridges may be different in wild and captive populations” was partially confirmed for size, but it was not confirmed for shape. The morphological characters used to compare populations should not be evaluated only as size or shape. Instead, both size and shape should be considered together to make a more efficient grouping.

Supplementary Materials

The following supporting information can be downloaded at: https://www.mdpi.com/article/10.3390/d14010048/s1, File S1: Data of M and GM.

Author Contributions

A.İ.A. and T.A. designed and directed the study. T.A. provided material, conducted genetic tests for sex determination, and conducted metric analysis. A.İ.A. conducted the geometric morphometric analysis. All authors have read and agreed to the published version of the manuscript.

Funding

This research was funded by TUBITAK, 117O580.

Institutional Review Board Statement

The animal study protocol was approved by The MAKU-HADYEK-169 protocol controlled all the experiments on Chukar Partridges by MAKU, Local Ethical Committee on Animal Experiments regulations.

Informed Consent Statement

Not applicable.

Data Availability Statement

The data presented in this study are available in Supplementary Material File S1.

Acknowledgments

The authors would like to thank the farmers, hunters, lab volunteers, and the DKMPGM for their help and cooperation. Furthermore, the authors would like to thank Özlem Özmen for preparing the samples.

Conflicts of Interest

The authors declare no conflict of interest.

References

  1. Rivas, N.; Sánchez Espíndola, M.E.; Camacho, A.D.; Moreno, E.R.; Rocha-Gómez, M.A.; Aguilar, R.A. Morphology and morphometry of the scutellum of six species in the genus Meccus (Hemiptera: Triatominae). J. Vector Ecol. 2014, 39, 14–20. [Google Scholar] [CrossRef] [PubMed]
  2. Papežík, P.; Kubala, M.; Jablonski, D.; Doležálková-Kaštánková, M.; Choleva, L.; Benovics, M.; Mikulíček, P. Morphological differentiation of endemic water frogs (Ranidae: Pelophylax) from the southwestern balkans. Salamandra 2021, 57, 105–123. [Google Scholar]
  3. Kadry, M.A.M.; Al-Qahtani, A.R.; Amer, S.A.M. Morphometric and molecular differentiation between Egyptian Stellagama stellio vulgaris and S. stellio salehi (Reptilia: Agamidae). Zool. Middle East 2020, 66, 295–301. [Google Scholar] [CrossRef]
  4. Islam, M.M.; Farag, E.; Mahmoudi, A.; Hassan, M.M.; Atta, M.; Mostafavi, E.; Alnager, I.A.; Farrag, H.A.; Eljack, G.E.A.; Bansal, D.; et al. Morphometric study of Mus musculus, Rattus norvegicus, and Rattus rattus in Qatar. Animals 2021, 11, 2162. [Google Scholar] [CrossRef]
  5. Kayvanfar, N.; Aliabadian, M.; Ghasempouri, S.M. Morphometric and morphological differentiation of the subspecies of Phasianus colchicus (Linnaeus, 1758) on the Iranian Plateau (Aves: Galliformes). Zool. Middle East 2015, 61, 9–17. [Google Scholar] [CrossRef]
  6. Liu, Q.; Xiong, J.; Gou, J.; Gao, X. Geographic variation in the skull morphometry of four populations of Batrachuperus karlschmidti (Urodela: Hynobiidae). Asian Herpetol. Res. 2020, 11, 194–204. [Google Scholar] [CrossRef]
  7. Klingenberg, C.P. Size, shape, and form: Concepts of allometry in geometric morphometrics. Dev. Genes Evol. 2016, 226, 113–137. [Google Scholar] [CrossRef]
  8. Myczko, Ł.; Mizerová, Z.; Kubicka, A.M.; Sparks, T.H.; Hromada, M. Bill morphology and biometrics of three sibling woodpecker species from sympatric populations. Bird Study 2020, 67, 8–18. [Google Scholar] [CrossRef]
  9. Angst, D.; Barnoud, J.; Cornette, R.; Chinsamy, A. Sex and Ontogenetic Variation in the Crest of Numida meleagris: Implications for Crested Vertebrates. Anat. Rec. 2020, 303, 1018–1034. [Google Scholar] [CrossRef]
  10. Dalton, H.A.; Wood, B.J.; Widowski, T.M.; Guerin, M.T.; Torrey, S. An analysis of beak shape variation in two ages of domestic turkeys (Meleagris gallopavo) using landmark-based geometric morphometrics. PLoS ONE 2017, 12, e0185159. [Google Scholar] [CrossRef]
  11. Foster, D.J.; Podos, J.; Hendry, A.P. A geometric morphometric appraisal of beak shape in Darwin’s finches. J. Evol. Biol. 2008, 21, 263–275. [Google Scholar] [CrossRef]
  12. Souza, A.T.; Soukalová, K.; Děd, V.; Šmejkal, M.; Blabolil, P.; Říha, M.; Jůza, T.; Vašek, M.; Čech, M.; Peterka, J.; et al. Ontogenetic and interpopulation differences in otolith shape of the European perch (Perca fluviatilis). Fish. Res. 2020, 230, 105673. [Google Scholar] [CrossRef]
  13. Wells, C.; Munn, A.; Woodworth, C. Geomorphic Morphometric Differences between Populations of Speyeria diana (Lepidoptera: Nymphalidae). Florida Entomol. 2018, 101, 195–202. [Google Scholar] [CrossRef]
  14. Slice, D.E. Geometric morphometrics. Annu. Rev. Anthropol. 2007, 36, 261–281. [Google Scholar] [CrossRef]
  15. Ariza-Marín, E.R.; De Luna, E. Linear and geometric morphometric analyses of variation of the plectrum in four species of bess beetles, tribe Proculini (Coleoptera: Passalidae). Arthropod Struct. Dev. 2020, 59, 100994. [Google Scholar] [CrossRef]
  16. Corruccini, R.S. Shape in morphometrics: Comparative analyses. Am. J. Phys. Anthropol. 1987, 73, 289–303. [Google Scholar] [CrossRef]
  17. Zelditch, M.; Swiderski, D.; Sheets, H.; Fink, W. Geometric Morphometrics for Biologists; Elsevier: New York, NY, USA, 2004; ISBN 9780127784601. [Google Scholar]
  18. Cardini, A. Modern morphometrics and the study of population differences: Good data behind clever analyses and cool pictures? Anat. Rec. 2020, 303, 2747–2765. [Google Scholar] [CrossRef]
  19. Cardini, A.; Elton, S.; Kovarovic, K.; Strand Viđarsdóttir, U.; Polly, P.D. On the Misidentification of Species: Sampling Error in Primates and Other Mammals Using Geometric Morphometrics in More than 4000 Individuals. Evol. Biol. 2021, 48, 190–220. [Google Scholar] [CrossRef]
  20. Gray, J.A.; McDowell, M.C.; Hutchinson, M.N.; Jones, M.E.H. Geometric morphometrics provides an alternative approach for interpreting the affinity of fossil lizard jaws. J. Herpetol. 2017, 51, 375–382. [Google Scholar] [CrossRef] [Green Version]
  21. Kaliontzopoulou, A. Geometric morphometrics in herpetology: Modern tools for enhancing the study of morphological variation in amphibians and reptiles. Basic Appl. Herpetol. 2011, 25, 5–32. [Google Scholar] [CrossRef] [Green Version]
  22. Tatsuta, H.; Takahashi, K.H.; Sakamaki, Y. Geometric morphometrics in entomology: Basics and applications. Entomol. Sci. 2018, 21, 164–184. [Google Scholar] [CrossRef] [Green Version]
  23. Sumruayphol, S.; Chaiphongpachara, T. Geometric morphometrics as a tool for three species identification of the firefly (Coleoptera: Lampyridae) in Thailand. Biodiversitas 2019, 20, 2388–2395. [Google Scholar] [CrossRef]
  24. Bright, J.A.; Marugán-Lobón, J.; Cobb, S.N.; Rayfield, E.J. The shapes of bird beaks are highly controlled by nondietary factors. Proc. Natl. Acad. Sci. USA 2016, 113, 5352–5357. [Google Scholar] [CrossRef] [Green Version]
  25. Carvalho Provinciato, I.C.; Araújo, M.S.; Jahn, A.E. Drivers of wing shape in a widespread Neotropical bird: A dual role of sex-specific and migration-related functions. Evol. Ecol. 2018, 32, 379–393. [Google Scholar] [CrossRef] [Green Version]
  26. Gündemir, O.; Özkan, E.; Dayan, M.O.; Aydoğdu, S. Sexual analysis in Turkey (Meleagris gallopavo) neurocranium using geometric morphometric methods. Turkish J. Vet. Anim. Sci. 2020, 44, 681–687. [Google Scholar] [CrossRef]
  27. Tokita, M.; Yano, W.; James, H.F.; Abzhanov, A. Cranial shape evolution in adaptive radiations of birds: Comparative morphometrics of Darwin’s finches and Hawaiian honeycreepers. Philos. Trans. R. Soc. B Biol. Sci. 2017, 372, 20150481. [Google Scholar] [CrossRef] [Green Version]
  28. Haidr, N.S.; Acosta Hospitaleche, C. Fossil penguin beaks from the Eocene of Antarctica: New materials from La Meseta Formation. Contrib. MACN 2017, 1, 57–68. [Google Scholar]
  29. Kass, N.; Montalti, D.; Acosta Hospitaleche, C. Comparison of the skull of Brown Skua (Catharacta antarctica lonnbergi) and South Polar Skua (Catharacta maccormicki): Differentiation source identification and discriminant analysis. Polar Biol. 2018, 41, 1049–1053. [Google Scholar] [CrossRef]
  30. Ottvall, R.; Gunnarsson, G. Morphological and molecular sex identification of Redshanks Tringa totanus. Bird Study 2007, 54, 127–129. [Google Scholar] [CrossRef]
  31. Albayrak, T.; Besnard, A.; Erdogan, A. Morphometric Variation and Population Relationships of Kruper’s Nuthatch (Sitta krueperi) in Turkey. Wilson J. Ornithol. 2011, 123, 734–740. [Google Scholar] [CrossRef]
  32. Madge, S.; McGowan, P. Pheasants, Partridges, and Grouse: A Guide to the Pheasants, Partridges, Quails, Grouse, Guineafowl, Buttonquails, and Sandgrouse of the World; Christopher Helm, A & C Black: London, UK, 2002. [Google Scholar]
  33. Svensson, L. Identification Guide to European Passerines; British Trust for Ornithology: Norfolk, UK, 1992. [Google Scholar]
  34. R Core Team. R: A Language and Environment for Statistical Computing; R Foundation for Statistical Computing: Vienna, Austria, 2021; Available online: http://www.R-project.org (accessed on 3 March 2021).
  35. Rohlf, F.J. TpsUtil, Version 1.60; Department of Ecology and Evolution, State University of New York: Stone Brook, NY, USA, 2013.
  36. Rohlf, F.J. TpsDig2, Version 2.18; Department of Ecology and Evolution, State University of New York: Stone Brook, NY, USA, 2015.
  37. Klingenberg, C.P. MorphoJ: An integrated software package for geometric morphometrics. Mol. Ecol. Resour. 2011, 11, 353–357. [Google Scholar] [CrossRef] [PubMed]
  38. Hammer, Ø.; Harper, D.A.T.; Ryan, P.D. Past: Paleontological statistics software package for education and data analysis. Palaeontol. Electron. 2001, 4, 1–9. [Google Scholar]
  39. Christensen, G.C. Chukar (Alectoris chukar), version 1.0. In Birds of the World; Poole, A.F., Gill, F.B., Eds.; Cornell Lab of Ornithology: Ithaca, Greece, 2020. [Google Scholar]
  40. Ewen, J.G.; Clarke, R.H.; Moysey, E.; Boulton, R.L.; Crozier, R.H.; Clarke, M.F. Primary sex ratio bias in an endangered cooperatively breeding bird, the black-eared miner, and its implications for conservation. Biol. Conserv. 2001, 101, 137–145. [Google Scholar] [CrossRef]
  41. Robertson, B.C.; Elliott, G.P.; Eason, D.K.; Clout, M.N.; Gemmell, N.J. Sex allocation theory aids species conservation. Biol. Lett. 2006, 2, 229–231. [Google Scholar] [CrossRef] [PubMed] [Green Version]
  42. Forcina, G.; Guerrini, M.; Khaliq, I.; Khan, A.A.; Barbanera, F. Human-modified biogeographic patterns and conservation in game birds: The dilemma of the black francolin (Francolinus francolinus, Phasianidae) in Pakistan. PLoS ONE 2018, 13, e0205059. [Google Scholar] [CrossRef] [Green Version]
  43. Aradis, A.; Landucci, G.; Tagliavia, M.; Bultrini, M. Sex determination of Eurasian Woodcock Scolopax rusticola: A molecular and morphological approach. Avocetta 2015, 39, 83–89. [Google Scholar]
  44. Kabasakal, B.; Albayrak, T. Offspring sex ratios and breeding success of a population of the Great Tit, Parus major (Aves: Passeriformes). Zool. Middle East 2012, 57, 27–34. [Google Scholar] [CrossRef]
  45. Kark, S.; Mukerji, T.; Safriel, U.N.; Noy-Meir, I.; Nissani, R.; Darvasi, A. Peak morphological diversity in an ecotone unveiled in the chukar partridge by a novel Estimator in a Dependent Sample (EDS). J. Anim. Ecol. 2002, 71, 1015–1029. [Google Scholar] [CrossRef]
  46. Albayrak, T.; Pekgöz, A.K. Heavy metal effects on bird morphometry: A case study on the house sparrow Passer domesticus. Chemosphere 2021, 276, 130056. [Google Scholar] [CrossRef]
  47. Asthon, K.G. Patterns of Within-Species Body Size Variation of Birds: Strong Evidence for Bergmann’s. Glob. Ecol. Biogeogr. 2002, 11, 505–523. [Google Scholar]
  48. Barbosa, A.; Moreno, E. Evolution of foraging strategies in shorebirds: An ecomorphological approach. Auk 1999, 116, 712–725. [Google Scholar]
  49. Lachlan, R.F.; Verhagen, L.; Peters, S.; Ten Cate, C. Are There Species-Universal Categories in Bird Song Phonology and Syntax? A Comparative Study of Chaffinches (Fringilla coelebs), Zebra Finches (Taenopygia guttata), and Swamp Sparrows (Melospiza georgiana). J. Comp. Psychol. 2010, 124, 92–108. [Google Scholar] [CrossRef]
Figure 1. Molecular sexing results. One band is male, and two bands are female.
Diversity 14 00048 g001
Figure 2. Landmarks used to describe the shape of Chukar Partridge’s bill (the side of upper mandible, 1: tips, 2: middle, 3: the first place the feathers come out, 4: apex of nostril, 5: angle of the mouth; the side of under mandible, 6: rictus, 7: tips).
Diversity 14 00048 g002
Figure 3. Visual inspection of the Q-Q plots of morphometric data of the wild and captive populations for each bill character.
Diversity 14 00048 g003
Figure 4. PCA of male (yellow) and female (blue) Chukar Partridges bills. (a) Morphometric (M; size), (b) geometric morphometric (GM; shape), and (c) M + GM together.
Diversity 14 00048 g004
Figure 5. Comparison of bill length by regions. ns: nonsignificant, *: p < 0.05, ****: p < 0.0001.
Diversity 14 00048 g005
Figure 6. PCA of the bills from the locations of Chukar Partridges. The colours represent localities, blue: western, yellow: centre, grey: eastern, red: breeding station. (a) Morphometric (M; size), (b) geometric morphometric (GM; shape), and (c) M + GM together.
Diversity 14 00048 g006
Figure 7. The top is the Hopkins statistic (Red: high similarity (i.e., low dissimilarity) | Blue: low similarity). Hopkins statistic: M = 0.83, GM = 0.77, M + GM = 0.75). The bottom is a cluster analysis of all bills of Chukar Partridges using all samples together without any locations information. (a) Morphometric (M; size), (b) geometric morphometric (GM; shape), and (c) M + GM together.
Diversity 14 00048 g007
Table 1. Descriptive statistics of the morphometric data of bill characters and overall corporations of sexes using the t-test. ns: nonsignificant; *: p < 0.05; **: p < 0.01.
CaptiveWildOverall
FemaleMaleFemaleMaleFemaleMalep
(n = 12)(n = 10)(n = 36)(n = 40)(n = 48)(n = 50)
BL **
Mean (SD)23.8 (3.18)26.9 (4.48)20.3 (1.85)21.8 (1.42)21.2 (2.71)22.9 (3.07)
Median [Min, Max]23.5 [17.9, 30.6]26.1 [20.8, 36.7]20.1 [16.3, 23.4]21.6 [18.9, 24.9]21.1 [16.3, 30.6]21.9 [18.9, 36.7]
BW ns
Mean (SD)9.50 (0.907)10.3 (0.861)7.81 (0.814)8.25 (0.766)8.23 (1.11)8.66 (1.14)
Median [Min, Max]9.56 [7.77, 11.2]10.6 [8.34, 11.4]7.89 [5.68, 9.85]8.09 [6.05, 9.90]8.02 [5.68, 11.2]8.21 [6.05, 11.4]
BH
Mean (SD)9.96 (1.01)11.3 (1.04)8.52 (0.704)9.39 (0.715)8.88 (1.00)9.77 (1.09)**
Median [Min, Max]10.0 [8.08, 11.3]11.6 [9.19, 12.5]8.67 [5.79, 9.93]9.44 [7.69, 11.5]8.76 [5.79, 11.3]9.57 [7.69, 12.5]
LNBa *
Mean (SD)17.6 (1.60)20.8 (2.99)14.0 (1.07)14.7 (1.02)14.9 (2.01)15.9 (2.92)
Median [Min, Max]16.9 [16.0, 21.0]20.0 [17.5, 28.1]13.9 [11.4, 16.0]14.6 [12.7, 17.3]14.4 [11.4, 21.0]15.1 [12.7, 28.1]
Table 2. Basic descriptive statistics of the bill for wild and captive populations. SD is given in parent brackets.
Bill
LocationnBLBHBWLNBa
Western
BUR1321.8 (1.6)9.2 (0.7)8.5 (0.8)14.4 (0.8)
CAN920.4 (1.9)8.8 (1.4)7.5 (0.8)13.9 (1.6)
ESK2120.4 (1.6)8.6 (0.8)7.9 (0.4)13.6 (0.9)
MUG820.3 (2.6)9.3 (0.6)8.9 (0.7)13.7 (2.9)
Centre
CNK1421.1 (1.3)8.7 (0.6)7.7 (0.9)14.6 (1.1)
NIG320.5 (0.7)8.7 (0.4)8.2 (0.9)13.8 (1.2)
SIV1121.2 (1.6)9.5 (0.9)8.4 (0.7)14.2 (0.9)
Eastern
BIT1221.8 (1.7)8.9 (0.5)7.9 (0.5)14.7 (0.9)
ERZ1220.9 (1.6)8.8 (0.8)7.9 (0.6)14.1 (1.1)
VAN1122.8 (1.5)9.3 (0.6)7.9 (0.9)14.9 (0.9)
Unknown1422.1 (3.1)9.2 (0.8)8.4 (1.0)14.7 (2.9)
Captive
BSA625.4 (3.5)9.0 (1.0)8.2 (0.5)19.0 (2.9)
BSK2126.4 (4.1)11.0 (1.1)10.1 (0.8)20.2 (3.4)
BSM1722.8 (2.6)10.4 (0.9)10.0 (0.9)17.0 (1.4)
Total
Wild12821.3 (1.9)8.9 (0.8)8.1 (0.8)14.3 (1.5)
Captive4424.9 (3.8)10.5 (1.2)9.8 (1.0)18.8 (3.1)
Total17222.2 (3.0)9.4 (1.1)8.5 (1.1)15.4 (2.8)
Publisher’s Note: MDPI stays neutral with regard to jurisdictional claims in published maps and institutional affiliations.

