Article

Annual Cycle of the Synechococcus spp. and Picoeukaryotic Growth and Loss Rates in a Subtropical Coastal Ecosystem

1
Institute of Marine Environment and Ecology, National Taiwan Ocean University, Keelung 202-24, Taiwan
2
Center of Excellence for the Oceans, National Taiwan Ocean University, Keelung 202-24, Taiwan
3
A.O. Kovalevsky Institute of Biology of the Southern Seas, Russian Academy of Sciences, 299011 Sevastopol, Russia
*
Author to whom correspondence should be addressed.
Diversity 2022, 14(1), 49; https://doi.org/10.3390/d14010049
Submission received: 30 December 2021 / Revised: 7 January 2022 / Accepted: 11 January 2022 / Published: 12 January 2022
(This article belongs to the Special Issue Planktonic Food Web: Feeding, Growth, and Trophic Interactions)

Abstract

:
Seasonal variations in the picophytoplankton community structure (Synechococcus spp. and picoeukaryotes) were studied by flow cytometry in the coastal ecosystem of the subtropical western Pacific from October 2019 to September 2020. Synechococcus spp. was dominant in abundance during the study period, with its density ranging from 0.05 to 5.6 × 10⁴ cells mL−1; its maximum occurred in July 2020. Picoeukaryotes were less abundant, with their density ranging from 0.2 to 13.6 × 10³ cells mL−1. Their highest abundance was recorded in January 2020. The growth rates of Synechococcus spp. and picoeukaryotes ranged from −0.39 to 1.42 d−1 and 0.38 to 2.46 d−1, respectively, throughout the study period. Overall, the growth rate of the picoeukaryotes was significantly higher than that of Synechococcus spp. It is interesting to note that the grazing mortality of Synechococcus spp. and picoeukaryotes during the warmer period (April to September) was relatively low. Based on this study, we suggest that mixotrophic nanoflagellates lowered their feeding activity that obtained nutrients from prey and instead used additional nutrients during the incubation experiments. Our study demonstrated that a shift in the picophytoplankton community composition and grazing activity of predacious nanoflagellates in cold and warm periods can impact on the seasonal dynamics of the microbial food web.

1. Introduction

Picophytoplankton mainly consist of picocyanobacteria (e.g., Synechococcus spp. and Prochlorococcus) and picoeukaryotes, and form an important component of the phytoplankton community in oligotrophic warm environments [1,2,3,4]. Picoeukaryotes are smaller in density than Synechococcus spp. [5], especially in the tropical and subtropical oceans [5,6]; however, they also contribute significantly to the primary production of biomass in the oceans [7]. Understanding the temporal changes of picophytoplankton abundance and its response to environmental drivers is essential for determining the lower trophic levels of the food web.
Given the importance of picophytoplankton in marine biogeochemical cycling and oceanic carbon flux, it is essential to gather information on their growth and mortality rates. The dynamics of picophytoplankton in aquatic ecosystems are not only strictly dependent upon temperature, nutrient, and light limitation through bottom-up controls [8,9,10] but are also regulated by mortality from grazing and viral lysis (top-down controls) [11,12]. Although the estimates of growth and mortality rates (from grazing or viral lysis) of Synechococcus and Prochlorococcus are from widely disparate oceanographic regimes [12,13,14,15,16,17], few growth and mortality rate measurements are available for photosynthetic picoeukaryotes, especially for seasonal observations [17]. In subtropical western Pacific coastal ecosystems, the seasonal trends of Synechococcus spp. abundance and its growth rate approximately follow the annual cycle of temperatures [12,18]. Tsai et al. [15] found that pigmented nanoflagellates consume approximately 63% of the mean Synechococcus spp. production during the warmer seasons; thus, pigmented nanoflagellates are the key grazers of the Synechococcus spp. population in subtropical western Pacific coastal waters. Furthermore, Tsai et al. [16] confirmed that although nanoflagellate grazing was a significant cause of Synechococcus spp. mortality, viral lysis was also an important source of mortality, especially at night-time. Although there is much information regarding the influence of these processes on the seasonal and diel dynamics of Synechococcus spp., little is known about their influence on picoeukaryotes in this coastal environment.
In previous studies, picoeukaryotes were found to be better adapted to low temperatures and NO3 availability whereas Synechococcus spp. generally favored high temperatures and NH4 availability [19]. Moreover, the physiological characteristics of Synechococcus spp. and picoeukaryotes—such as their cell surface properties, cell size, and the nutritional content of the cells—could also influence the feeding behavior of protists [20,21]. Thus, we hypothesized that the abundance, growth, and mortality of Synechococcus spp. and picoeukaryotes exhibit distinct seasonal patterns in subtropical western Pacific coastal waters.
This study aims to explore the abundance, growth, and mortality rates (grazing and viral lysis) of two groups of picophytoplankton (Synechococcus spp. and picoeukaryotes) and their annual cycle at a sampling station located in subtropical western Pacific coastal waters. Here, we report for the first time the seasonal variability in growth and mortality of Synechococcus spp. and picoeukaryotes in order to better understand the complex trophic interactions in microbial food webs.

2. Materials and Methods

2.1. Water Sampling

Monthly field sampling was conducted from October 2019 to September 2020 (0900 am to 1000 am local time) from the surface waters at an established station located in coastal waters off the north-eastern Taiwan coast (25°09.4′ N, 121°46.3′ E) and all samples reached the laboratory within 30 min. The abundance of Synechococcus spp. and picoeukaryotes from natural seawater and incubation samples were fixed in paraformaldehyde (1% final concentration) and frozen prior to a flow cytometric analysis. The water samples were filtered (25 mm GF/F: Whatman glass microfiber filters) for a Chl a analysis and the Chl a concentration was measured after the extraction by an in vitro fluorometer (Turner Design 10-AU-005) (Turner Designs, Inc., San Jose, CA, USA) [22]. The concentrations of nutrients in the seawater were measured by the methods described by Gong et al. (2000).

2.2. Incubation Experimental Design

To explore the seasonal changes in the growth and mortality rate of Synechococcus spp. and picoeukaryotics in our study site, we performed a two-point modified dilution experiment with a 24 h incubation to measure the Synechococcus spp. and picoeukaryotic growth and mortality rates by grazing and viral lysis [13,23]. The samples for the experiments were kept in 2 L polyethylene containers and transported to a local field laboratory. A total of 1 L of seawater was screened through a 200 μm Nitex mesh to remove the larger mesozooplankton grazers (200 μm filtered waters). First, a dilution was performed using 0.2 μm filtered water (47 mm diameter polycarbonate filters, AMD Manufacturing; operated at a low pressure <50 mm Hg), which represented the grazer-free diluents. Second, another dilution was produced by tangential flow filtration through a 30 kDa cartridge to generate virus-free water. Fresh 200 μm filtered water was then collected, as described above, and combined with grazer- and virus-free diluents in 25% filtered water of a 200 μm proportion. Nutrients were added to these bottles at a final concentration of 20 μM NO3 and 2 μM PO43 to eliminate the nutrient limitation of picophytoplankton growth during the incubation.
All treatments were incubated in triplicate for 24 h in 100 mL polycarbonate bottles under natural light in a water bath of an in situ temperature at the time of sampling. Subsamples were taken at the beginning (t0) and the end of the 24 h incubation (t24) to estimate the abundance change of the picophytoplankton (Synechococcus spp. and picoeukaryotics). The net growth rate of the picophytoplankton (k, d−1) was calculated as k = ( lnN t lnN 0 ) / t where t was the incubation time and Nt and N0 were the picophytoplankton abundance at the end and the start of the experiments, respectively. The picophytoplankton was detected and measured by using flow cytometry (FCM) (BD FACSCalibur™; United States). The analysis of the abundance and structure of the picophytoplankton communities highlighted the presence of two distinct groups in the study area: Synechococcus spp. and picoeukaryotes (Figure 1).
The net growth rate of picophytoplankton in the 200 μm filtered treatment signified the differences between the gross growth rate (μ) and the total mortality rate (grazing rates, Mg, and viral lysis, Mv). Thus, the net growth rate of picophytoplankton in the 200 μm filtered treatment ( k   ( 200   μ m   filtered ) )   was expressed as in Equation (1):
k   ( 200   μ m   filtered ) = μ ( M g + M v ) .
In the diluted water with 25% of 0.2 μm filtration treatments, the picophytoplankton mortality as a result of the grazing activity reduced to only 25%, as shown in the equation below:
k   ( 0 . 2   μ m   diluted ) = ( μ M v ) 0 . 25 × ( M g ) .
Finally, in the sample diluted with 25% of 30 kDa filtration treated water, the picophytoplankton mortality was reduced to 25% of the grazing and viral lysis (Mg + Mv) in this incubation experiment. Thus, the equation was expressed as:
k   ( 30   kDa   diluted ) = μ 0 . 25 × ( M g + M v ) .
The picoplankton grazing rate (Mg) was calculated from Equations (1)–(3):
M g = ( 4 3 ) × ( k   ( 0.2   μ m   diluted ) k   ( 200   μ m   filtered ) ) .
Furthermore, Mv was calculated from Equations (1)–(3):
M v = ( 4 3 ) × ( k   ( 30   kDa   diluted ) k   ( 0 . 2   μ m   diluted ) ) .
We thereby obtained the values of Mg and Mv; the value of the gross growth rate (μ) was calculated as μ = k (200 μm filtered) + (Mg + Mv).
The assumption was that grazing and viral mortality was linear with respect to the picophytoplankton concentration; when the picophytoplankton net growth rate (k) was lower in the diluted treatments than in the 200 μm filtered treatments, it pointed to a violation of a central assumption of the dilution method [24] and represented a negative value of the grazing or viral lysis rate.
A Kruskal–Wallis test was used to test the significant differences in the net growth rates (k) of the picoplankton among treatments. In addition, the differences in the means of any two treatments were tested by a Welch’s t-test. Thus, in this case, the losses were considered to be undetectable. The significance level for all tests was set at < 0.05.

3. Results

3.1. Environmental Parameters

During the one year sampling period described in this study, the seawater temperature showed a regular seasonal trend and ranged from 17.5 °C (February) to 30.0 °C (August) (Figure 2A). The NO3 concentrations showed the lowest values in the surface waters (0.7 μM for NO3 in May 2020) (Figure 2B). The PO4 concentrations did not vary seasonally, and the values were higher (>20 μM) during the rainy period, especially in April and July (Figure 2C). The total Chl a concentrations in the surface water were at a minimum during winter, increased in April, and maintained higher concentrations during summer (Figure 2D).

3.2. Seasonal Variations of Picophytoplankton Abundance

During the study period, Synechococcus spp. was numerically dominant during the study period, with its abundance ranging from 0.05 to 5.6 × 10⁴ cells mL−1. Its maximum was observed in July 2020 (Figure 3). Picoeukaryotes were less abundant; the values ranged from 0.2 to 13.6 × 10³ cells mL−1 (Figure 3). The highest picoeukaryotic abundance was recorded in January 2020 (Figure 3). Figure 4 provides information on the initial Chl a concentration as well as the Synechococcus spp. and picoeukaryotic abundance in the experiments conducted. When considered separately, significant relationships were found between the Synechococcus spp. and picoeukaryotic abundance. The range of Chl a was < 1 mg m−3 (p < 0.05) (Figure 4).
Furthermore, a significant correlation was found between Synechococcus spp. and the temperature (r = 0.58, p < 0.05, n = 20) (Supplemental Figure S1).

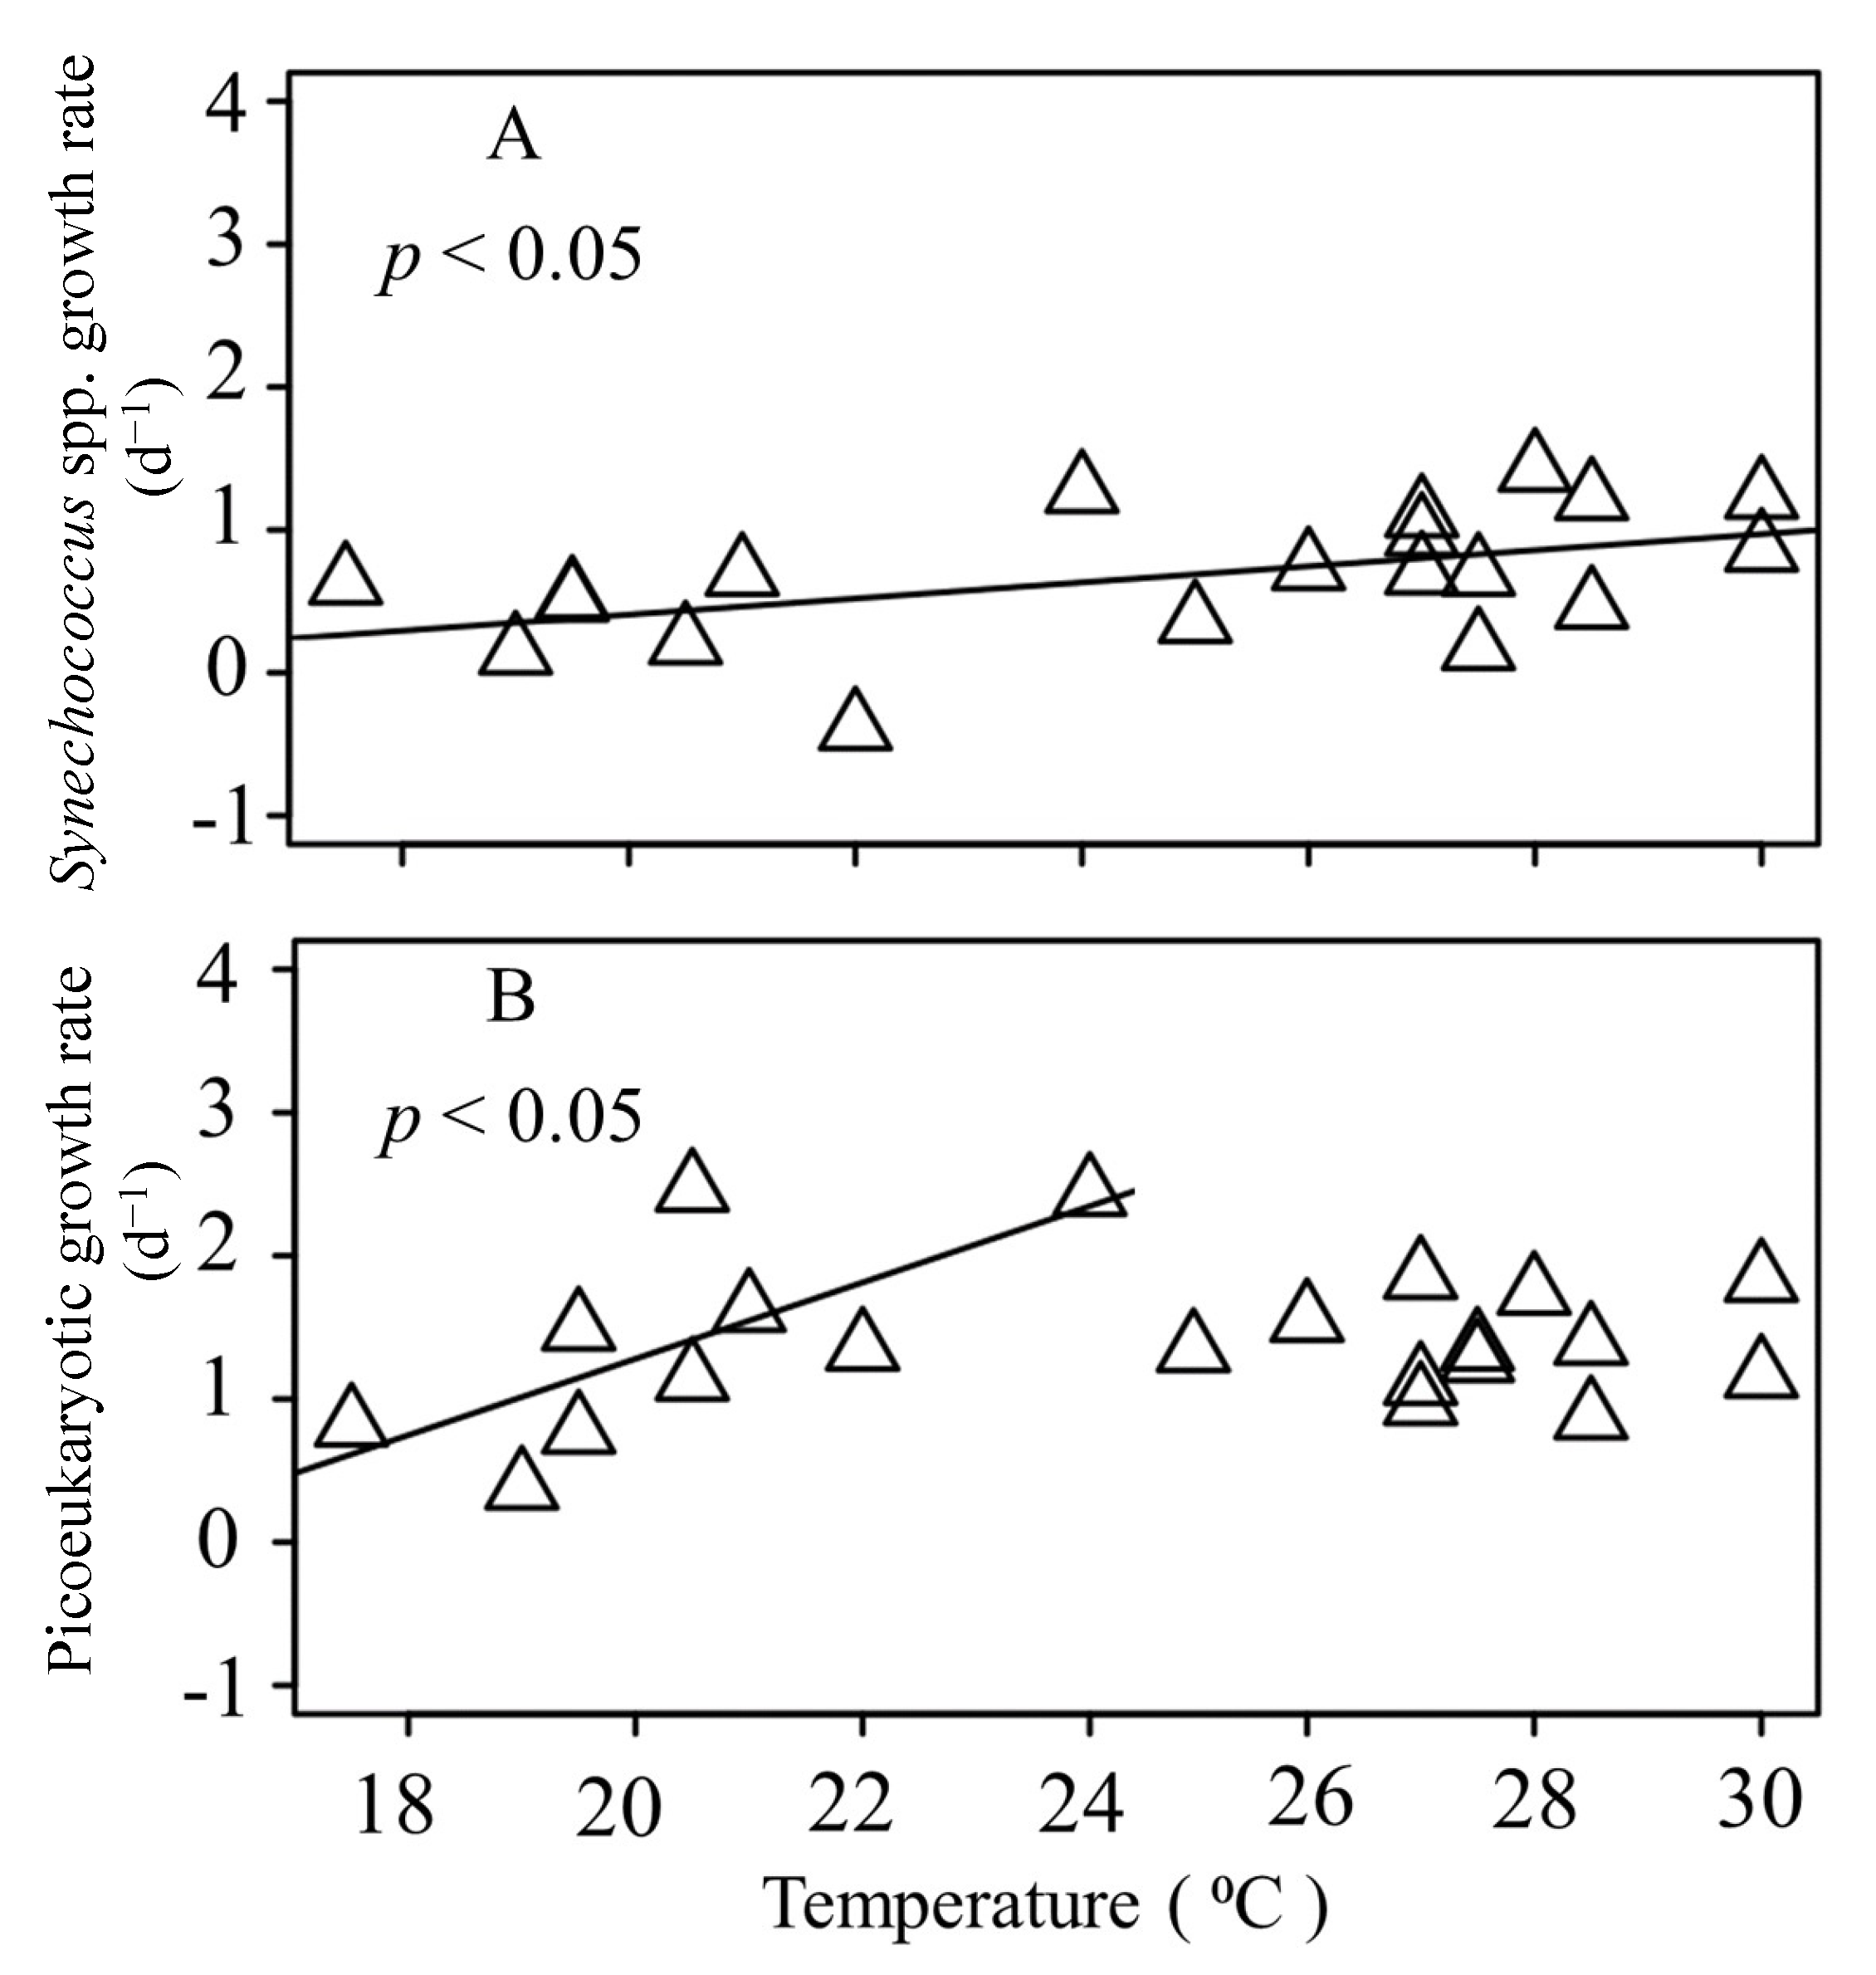
3.3. Seasonal Variations of Picophytoplankton Growth Rates

The net growth rates of Synechococcus spp. and picoeukaryotes are summarized in Table 1 and Table 2. Based on the calculations of Equations (1)–(5) from the data of Table 1 and Table 2, the gross growth rates of Synechococcus spp. and picoeukaryotes ranged from −0.39 to 1.42 d−1 and 0.38 to 2.46 d−1, respectively, throughout the study year (Figure 5A). The highest gross growth rate of Synechococcus spp. (1.42 d−1) was found in September 2020 (Figure 5A). Furthermore, the higher gross growth rate of the picoeukaryotes (2.46 d−1) was found in late March 2020, when the temperature was lower (20 °C) and dissolved inorganic nutrient concentrations were higher (NO3: 8.5 μM; PO4: 4.3 μM) during this study (Figure 2B,C and Figure 5A). Overall, the gross growth rate estimates for the picoeukaryotes were significantly higher than for Synechococcus spp. (paired t-tests, p < 0.05, n = 20).
The gross growth rates of Synechococcus spp. showed a statistically significant positive correlation with the water temperature (p < 0.05) (Figure 6A). Furthermore, a significant positive relationship with the temperature was also found for the gross growth rate of the picoeukaryotes when the temperature < 25 °C (p < 0.05); however, there was no significant relationship between the gross growth rate of the picoeukaryotes and the temperature when the temperature was >25 °C (Figure 6B).

3.4. Seasonal Variations of Picophytoplankton Mortality

When comparing the net growth rates in 200 μm filtered water (k (200 μm filtered)) and 0.2 μm diluted water (k (0.2 μm diluted)) (Table 1 and Table 2), only 10 and 11 (48% and 52%) out of 20 and 21 dilution experiments conducted in this study generated a statistically significant grazing mortality of Synechococcus spp. and picoeukaryotes, respectively (Figure 5B). During the study period, the grazing mortality of Synechococcus spp. and picoeukaryotes ranged from 0.08 to 1.86 d−1 and 0.04 to 2.5 d−1, respectively (Figure 5B). However, it was interesting to note that the grazing mortality of Synechococcus spp. and picoeukaryotes during the warmer period (April to September) was of a relatively low value. In our study, the grazing mortality of Synechococcus spp. and picoeukaryotes observed between April and September was lower than that between October and March (t-test, p < 0.05) (Figure 5B).
When considering picophytoplankton loss by viral lysis, and comparing the net growth rates in 0.2 μm diluted (k (0.2 μm diluted)) and 30 kDa diluted (k (30 kDa diluted)) water from Table 1 and Table 2 in the present study, the estimated virus-mediated mortality rates for the natural communities of Synechococcus spp. and picoeukaryotes ranged from 0.04 to 0.20 d−1 and 0.04 to 0.58 d−1, respectively (Figure 5C). The estimates indicated that, on average, viruses were responsible for the mortality of approximately 5% of the production of Synechococcus and 10% of picoeukaryotes on a daily basis during the warmer seasons.

4. Discussion

The coastal ecosystem of the subtropical western Pacific was particularly well-suited to this microbial ecological study because its seasonal water temperature variations are significant (17 to 30 ℃), being cold and nutrient-enriched in winter and warm and nutrient-poor in summer. In this study, we showed the seasonal abundance changes of the picophytoplankton communities and their growth and mortality in the coastal ecosystem of the subtropical western Pacific. The major findings of this study were that a maximal Synechococcus spp. abundance of 5 × 10⁴ cells mL−1 was observed during summer, which coincided with the high temperature and low nutrient conditions. In contrast, the picoeukaryotic abundance peaked in January 2020, at 20 °C. In addition, the growth rate for the picoeukaryotes was significantly higher than for Synechococcus spp. A strong seasonality in the growth and abundance of Synechococcus spp. related to the in situ temperature is reported here.

4.1. Seasonal Dynamics of Synechococcus spp. and Picoeukaryotic Abundance

Picophytoplankton have a competitive advantage for nutrient uptake in oligotrophic environments where they can be responsible for most of the primary production [8,25]. The seasonal variability of the Synechococcus spp. abundance from the same region was studied by Tsai et al. [12,18]. In this study, a maximum Synechococcus abundance (5 × 10⁴ cells mL−1) was observed in summer (Figure 3) and these abundances were similar to the previous field records by Tsai et al. [12,18], with its abundance showing a clear correlation with the surface water temperature. Our observations were also similar to the pattern in temperate waters where the seasonal variation of the Synechococcus spp. abundance usually reaches a maximum in summer and a minimum in winter [26]. However, information on the seasonal abundance of picoeukaryotes at our study site was limited.
A peak of picoeukaryote abundance of up to 13.6 × 10³ cells mL−1 was observed during spring at a lower temperature (20 °C) and higher dissolved inorganic nutrients (NO3: 8.5 μM; PO4: 4.3 μM) (Figure 2B,C and Figure 3). In previous studies, the increase in picoeukaryote abundance was usually related to low temperatures and high nutrient concentrations [19,27]. Similar results were also shown from the Bay of Palma where the two picophytoplankton groups exhibited important seasonality and differed in the period of peak abundance: in summer, Synechococcus spp. reached a maximal density and in spring, the picoeukaryote abundance peaked [28]. Previous studies have suggested that picoeukaryotes appear to be better adapted to low temperatures and NO3 availability whereas Synechococcus spp. generally favors high temperatures and NH4 availability [19,29]. Moreover, the Synechococcus spp. preference for NH4 over NO3 has also been observed in laboratory experiments on isolates [30]. In this situation, the picoeukaryotic growth rates would have been overestimated in our experiments due to NO3 being added to these bottles. Specific resources (inorganic nutrients) and temperatures have been reported to be the main limiting factors of growth in Synechococcus spp. [12,31] although the availability of nutrients appears to be the strongest factor in the warmer seasons [18]. Data from the study of Ayukai [32] suggested that Synechococcus spp. may depend on locally recycled nutrients and a similar study found that viral-induced ammonium regeneration resulted in an increased growth as well as the proportion of dividing Synechococcus spp. cells in the warmer seasons [33]. The above results could explain why Synechococcus spp. was present throughout the year, with a maximum abundance during summer. The increase of the picoeukaryotes at lower temperatures and Synechococcus spp. during summer could shift the picophytoplankton community composition and have a large impact on the microbial food web. If we assumed that all Synechococcus spp. and picoeukaryotes were retained on the GF/F filters, the importance of the picophytoplankton contribution to the total phytoplankton biomass was significant in the low Chl a periods in our study (Figure 4). Thus, the composition change of picophytoplankton should be systematically included in future phytoplankton biomass studies and carbon flux models.

4.2. Seasonal Dynamics of Synechococcus spp. and Picoeukaryotic Growth Rates

This study is the first annual high-resolution description of Synechococcus spp. and picoeukaryotic abundance and growth dynamics in the coastal ecosystem of the subtropical western Pacific. The growth rates over the study period for Synechococcus spp. and picoeukaryotes ranged from −0.39 to 1.42 d−1 and 0.38 to 2.46 d−1, respectively (Figure 5A). Few rate measurements are available for photosynthetic picoeukaryotes. In this study, however, it was noteworthy that the growth rates of the picoeukaryotes tended to be higher than those of Synechococcus spp., which was in agreement with the study of the seasonal cycle of a Mediterranean coastal lagoon [34]. Bec et al. [34] found that picoeukaryotes always exhibited a higher growth rate than cyanobacteria. In a Pacific Ocean coastal site in the Southern California Bight, picoeukaryotes had a higher growth rate (0.71–1.29 d−1) than Synechococcus spp. (0.52–0.86 d−1) [14]. These results indicate that picophytoplankton do not have a universal photosynthetic response to environmental conditions [1] as the eukaryotic cell types perform better than the prokaryotic ones in coastal ecosystems.
Tsai et al. [12,18] found that both the abundance and growth rate of Synechococcus spp. increase as the water temperature increases in this study region. This phenomenon is similar to the early results of Agawin et al. [35], who indicated that a Synechococcus spp. abundance is closely related to the water temperature. Furthermore, a correlation between the picoeukaryotic growth rate and temperature was observed in the Pacific Ocean [14]. The analysis of our incubated data supported the existence of a significant correlation between the seawater temperature versus Synechococcus spp. and picoeukaryotic growth (Figure 6). However, it is worth noting that no significant relationship between the growth rate of the picoeukaryotes and temperature was found when the temperature was >25 °C in the present study (Figure 6B). The decoupling between the growth rate of the picoeukaryotes in response to the temperature during the warmer seasons highlighted the role of another environmental factor that would influence its activity. A possible explanation could be the inhibition of the photosynthetic rates by UVR, which has been observed in many regions of the oceans such as tropical, temperate, and polar areas [36,37]. The underwater oceanic levels of UVR and visible light can induce significant cell death in the picophytoplankton communities. A previous study showed that the decay rate of living cells induced by solar radiation was the lowest for Synechococcus spp. [38] and that it had the highest resistance to solar radiation, which indicated that Synechococcus spp. had better photoprotection or repair systems than picoeukaryotes. It was likely that the higher levels of UVR and visible light were more advantageous for Synechococcus spp., which adapted to strong solar radiation in this coastal site during summer, than for the picoeukaryote competitors.

4.3. Seasonal Dynamics of Synechococcus spp. and Picoeukaryotic Mortality Rate

Microzooplankton consume a wide size range of phytoplankton cells, from picophytoplankton to microphytoplankton [39]. However, at our western subtropical Pacific coastal study site, microzooplankton (such as ciliates) have been reported to account for the removal of only 3% of the Synechococcus spp. production [15]. Furthermore, feeding experiments with fluorescent-labeled beads (with a size of 1 μm) have strongly suggested that pigmented nanoflagellates are the key grazers of Synechococcus spp. populations in subtropical western Pacific coastal waters [15]. Although the ingestion of picoeukaryotes by nanoflagellates was not measured in the study of Tsai et al. [15], we believed that the pigmented nanoflagellates frequently fed on picoeukaryotes (an average size of 1.02 ± 0.08 μm, unpublished data) as the potential ingestion impact on 1 μm fluorescent-labeled beads by pigmented nanoflagellates was shown in Tsai et al. [15].
Generally, phytoplankton growth rates and grazing mortality are closely coupled [18,33,39], which suggests a high transfer efficiency of picophytoplankton production to higher trophic levels. However, in the present study, it was interesting to note that the Synechococcus spp. and picoeukaryotic grazing mortality during the warmer period (April to September) was relatively low (Figure 5B) when a higher Synechococcus spp. growth was observed. The grazing activity may be driven by complex grazer–prey interactions, which can be modulated by the prey selectivity of the grazers (e.g., size or nutritional ratio) and this may result in mismatches between the grazers and their prey [40]. We plotted the relationship between the growth and grazing rates of Synechococcus spp. and picoeukaryotes; our grazing experiments showed that, in contrast, there was no response to the growth state of their prey, especially in the warmer seasons (>25 °C) (Figure 7). We were unable to assert exactly why low grazing mortality rates were often observed during this study but a variety of factors, including food selection, trophic cascades, prey switching, and dilution effects on grazers [41,42,43], may be responsible for such low mortality in the warm seasons. Another possible explanation for the low grazing mortality during the warm seasons could be the nutrients added to these bottles in this study: the mixotrophic pigmented nanoflagellates consumed additional nutrients and lowered their feeding ability to uptake nutrients from their prey during the incubation experiments. A similar result was discussed in another nutrient enrichment experiment with Sargasso Sea populations, which also produced a marked decline in phagotrophically-active pigmented nanoflagellates after the addition of phosphorus [44]. Furthermore, nutrient enrichment experiments in the Mediterranean Sea [45], which is oligotrophic, resulted in a significant decline in the phagotrophically-active pigmented nanoflagellates in the treatments. All of the evidence strongly supports our results that were obtained with natural pigmented nanoflagellate assemblages, suggesting that these mixotrophic nanoflagellates that inhabit these oligotrophic coastal waters could use their feeding capability to supplement nutrients but that they would take up nutrients primarily from a dissolved pool with high nutrient concentrations.
This study is the first description of the influence of seasonality on the viral-mediated mortality of picophytoplankton in subtropical western Pacific coastal waters. Viral lysis alone was detected in 5 and 12 of the analyses of Synechococcus spp. and the picoeukaryotes in this study (Figure 5C). However, we did not find that the seasonal or environmental factors affected viral lysis in these experiments. Although viral infections of Synechococcus spp. are commonly found in marine waters [46,47,48,49], the lysis of Synechococcus spp. was rarely detected in our experiments, which implied that most of the Synechococcus spp. population was resistant to infection or that the efficiency of the infection was low.
Other factors were likely to influence the weak viral-mediated processes of the picophytoplankton in our study. Viral infections are host specific, and if there were no specific virus strains infecting the picophytoplankton in our dilution experiments or their density was not sufficient to affect the picophytoplankton [50], mortality by viral lysis would be low. One previous study conducted at our study site observed virus subpopulation groups by analyzing the flow cytometry (FCM) data and reported that two virus subpopulations, VLP1 and VLP2, were detected [51]. VLP1, which emits the lowest green fluorescence, is considered to be mostly bacteriophages [52]; VLP2, which emits a higher green fluorescence, is assumed to be cyanophages [53]. In the study of Tsai et al. [51], it was suggested that a VLP1 abundance, ranging from 84–89% of the viral density, was significantly associated with bacterial abundance. VLP1 dominated the viral community of the marine environments in our study region and implied that the viruses mostly comprised bacteriophages. This might explain why viral lysis was rarely strong over the annual cycle of the picophytoplankton groups in this study. Considering the dominance of bacteriophages and their hosts (bacteria), the low viral mortality of the picophytoplankton may not be surprising. An alternative explanation might be that the incubation period used in our dilutions might have been too short to capture the viral infection as the viral lytic cycle can often exceed 24 h [11,54]. Finally, nanoflagellate grazers would have a positive influence on the viruses. In a study in a reservoir, it was found that the presence of nanoflagellates could stimulate the viral production and viral infection of bacterioplankton [55,56]. A possible explanation was that there could have been a general stimulation of the picoplankton growth by increasing the supply of substrates from nanoflagellate excretion, which then increased the viral infection. Thus, in this study, we found that a lower nanoflagellate grazing rate may induce a lower viral lysis of picophytoplankton during the warmer seasons.
In summary, a picophytoplankton community dominated by Synechococcus spp. was present throughout the year in subtropical western Pacific coastal waters. Our study demonstrated that the picophytoplankton community composition shifted in cold and warm seasons. Picoeukaryotes increased when the temperature was low and Synechococcus spp. reached a maximal density during summer. The two picophytoplankton groups showed different seasonal growth rate patterns in these coastal waters and our results indicated that the abundance of Synechococcus spp. was closely related to the water temperature; however, there was no significant relationship between the growth rate of the picoeukaryotes and temperatures >25 °C during the warmer seasons. The grazing activity might be driven by complex grazer–prey interactions and the low grazing mortality of Synechococcus spp. and the picoeukaryotes during the warmer seasons could be due to the nutrients added to the incubations. This suggested that the mixotrophic nanoflagellates inhabiting these oligotrophic coastal waters could feed on picophytoplankton to supplement their nutrients in a low nutrient environment but they would take up nutrients primarily from a dissolved nutrient pool with a sufficient nutrient supply. The further study of the viral and prokaryotic community compositions is needed to explain why the virus-mediated mortality of the picophytoplankton is low in this oligotrophic subtropical coastal area.

Supplementary Materials

The following supporting information can be downloaded at: https://www.mdpi.com/article/10.3390/d14010049/s1, Figure S1: Relationship between Synechococcus spp. (Δ) and picoeukaryotic abundance (×) and sea surface water temperature. Solid lines exhibit the fitted linear regressions.

Author Contributions

Conceptualization and methodology, A.-Y.T.; writing—review and editing, A.-Y.T. and P.-C.H.; supervision and comments, G.-C.G. and V.M., collected data: Z.-Y.Z. All authors have read and agreed to the published version of the manuscript.

Funding

Ministry of Science and Technology, ROC (Taiwan), Grant Number NSC 109-2611-M-019-013. RFBR project 21-55-52001. Russian state assignment No. 121040600178-6.

Institutional Review Board Statement

Not applicable.

Data Availability Statement

Not applicable.

Acknowledgments

The research was conducted in the framework of the Russian state assignment No. 121040600178-6 and supported by RFBR project 21-55-52001 and the Ministry of Science and Technology, ROC (Taiwan), Grant Number NSC 109-2611-M-019-013.

Conflicts of Interest

The authors declare no conflict of interest.

References

  1. Raven, J.A. The twelfth Tansley Lecture. Small is beautiful: The picophytoplankton. Funct. Ecol. 1998, 12, 503–513. [Google Scholar] [CrossRef]
  2. DuRand, M.D.; Olson, R.J.; Chisholm, S.W. Phytoplankton population dynamics at the Bermuda Atlantic Time-series station in the Sargasso Sea. Deep Sea Res. Part II Top. Stud. Oceanogr. 2001, 48, 1983–2003. [Google Scholar] [CrossRef]
  3. Mann, N.H. Phages of the marine cyanobacterial picophytoplankton. FEMS Microbiol. Rev. 2003, 27, 17–34. [Google Scholar] [CrossRef]
  4. Medlin, L.K.; Metfies, K.; Mehl, H.; Wiltshire, K.; Valentin, K. Picoeukaryotic plankton diversity at the Helgoland time series site as assessed by three molecular methods. Microb. Ecol. 2006, 52, 53–71. [Google Scholar] [CrossRef]
  5. Kirkham, A.R.; Lepère, C.; Jardillier, L.E.; Not, F.; Bouman, H.; Mead, A.; Scanlan, D.J. A global perspective on marine photosynthetic picoeukaryote community structure. ISME J. 2013, 7, 922–936. [Google Scholar] [CrossRef] [Green Version]
  6. Morán, X.A.G.; Fernández, E.; Pérez, V. Size-fractionated primary production, bacterial production and net community production in subtropical and tropical domains of the oligotrophic NE Atlantic in autumn. Mar. Ecol. Prog. Ser. 2004, 274, 17–29. [Google Scholar] [CrossRef]
  7. Li, W.K.W. Primary production of prochlorophytes, cyanobacteria, and eucaryotic ultraphytoplankton: Measurements from flow cytometric sorting. Limnol. Oceanogr. 1994, 39, 169–175. [Google Scholar] [CrossRef] [Green Version]
  8. Agawin, N.S.R.; Duarte, C.M.; Agustí, S. Nutrient and temperature control of the contribution of picoplankton to phytoplankton biomass and production. Limnol. Oceanogr. 2000, 45, 591–600. [Google Scholar] [CrossRef]
  9. Calbet, A.; Landry, M.R. Phytoplankton growth, microzooplankton grazing, and carbon cycling in marine systems. Limnol. Oceanogr. 2004, 49, 51–57. [Google Scholar] [CrossRef] [Green Version]
  10. Chen, B.; Laws, E.A. Is there a difference of temperature sensitivity between marine phytoplankton and heterotrophs? Limnol. Oceanogr. 2017, 62, 806–817. [Google Scholar] [CrossRef]
  11. Evans, C.; Archer, S.D.; Jacquet, S.; Wilson, W.H. Direct estimates of the contribution of viral lysis and microzooplankton grazing to the decline of a Micromonas spp. population. Aquat. Microb. Ecol. 2003, 30, 207–219. [Google Scholar] [CrossRef] [Green Version]
  12. Tsai, A.-Y.; Chiang, K.-P.; Chang, J.; Gong, G.-C. Seasonal diel variations of picoplankton and nanoplankton in a subtropical western Pacific coastal ecosystem. Limnol. Oceanogr. 2005, 50, 1221–1231. [Google Scholar] [CrossRef]
  13. Worden, A.Z.; Binder, B.J. Application of dilution experiments for measuring growth and mortality rates among Prochlorococcus and Synechococcus populations in oligotrophic environments. Aquat. Microb. Ecol. 2003, 30, 159–174. [Google Scholar] [CrossRef] [Green Version]
  14. Worden, A.Z.; Nolan, J.K.; Palenik, B. Assessing the dynamics and ecology of marine picophytoplankton: The importance of the eukaryotic component. Limnol. Oceanogr. 2004, 49, 168–179. [Google Scholar] [CrossRef]
  15. Tsai, A.-Y.; Chiang, K.-P.; Chan, Y.-F.; Lin, Y.-C.; Chang, J. Pigmented nanoflagellates in the coastal western subtropical Pacific are important grazers on Synechococcus populations. J. Plankton Res. 2007, 29, 71–77. [Google Scholar] [CrossRef] [Green Version]
  16. Tsai, A.-Y.; Gong, G.-C.; Sanders, R.W.; Chiang, K.-P.; Huang, J.-K.; Chan, Y.-F. Viral lysis and nanoflagellate grazing as factors controlling diel variations of Synechococcus spp. summer abundance in coastal waters of Taiwan. Aquat. Microb. Ecol. 2012, 66, 159–167. [Google Scholar] [CrossRef] [Green Version]
  17. Guo, C.; Liu, H.; Zheng, L.; Song, S.; Chen, B.; Huang, B. Seasonal and spatial patterns of picophytoplankton growth, grazing and distribution in the East China Sea. Biogeosciences 2014, 11, 1847–1862. [Google Scholar] [CrossRef] [Green Version]
  18. Tsai, A.-Y.; Chiang, K.-P.; Chang, J.; Gong, G.-C. Seasonal variations in trophic dynamics of nanoflagellates and picoplankton in coastal waters of the western subtropical Pacific Ocean. Aquat. Microb. Ecol. 2008, 51, 263–274. [Google Scholar] [CrossRef] [Green Version]
  19. Otero-Ferrer, J.L.; Cermeño, P.; Bode, A.; Fernández-Castro, B.; Gasol, J.M.; Morán, X.A.G.; Marañon, E.; Moreira-Coello, V.; Varela, M.M.; Villamaña, M.; et al. Factors controlling the community structure of picoplankton in contrasting marine environments. Biogeosciences 2018, 15, 6199–6220. [Google Scholar] [CrossRef] [Green Version]
  20. Christaki, U.; Dolan, J.R.; Pelegri, S.; Rassoulzadegan, F. Consumption of picoplankton-size particles by marine ciliates: Effects of physiological state of the ciliate and particle quality. Limnol. Oceanogr. 1998, 43, 458–464. [Google Scholar] [CrossRef]
  21. Monger, B.C.; Landry, M.R.; Brown, S.L. Feeding selection of heterotrophic marine nanoflagellates based on the surface hydrophobicity of their picoplankton prey. Limnol. Oceanogr. 1999, 44, 1917–1927. [Google Scholar] [CrossRef] [Green Version]
  22. Gong, G.-C.; Shiah, F.-K.; Liu, K.-K.; Wen, Y.-H.; Liang, M.-H. Spatial and temporal variation of chlorophyll a, primary productivity and chemical hydrography in the southern East China Sea. Cont. Shelf Res. 2000, 20, 411–436. [Google Scholar] [CrossRef]
  23. Anderson, S.R.; Harvey, E.L. Seasonal variability and drivers of microzooplankton grazing and phytoplankton growth in a subtropical estuary. Front. Mar. Sci. 2019, 6, 174. [Google Scholar] [CrossRef]
  24. Landry, M.R.; Hassett, R.P. Estimating the grazing impact of marine micro-zooplankton. Mar. Biol. 1982, 67, 283–288. [Google Scholar] [CrossRef]
  25. Rii, Y.M.; Karl, D.M.; Church, M.J. Temporal and vertical variability in picophytoplankton primary productivity in the North Pacific Subtropical Gyre. Mar. Ecol. Prog. Ser. 2016, 562, 1–18. [Google Scholar] [CrossRef] [Green Version]
  26. Li, W.K.W. Annual average abundance of heterotrophic bacteria and Synechococcus in surface ocean waters. Limnol. Oceanogr. 1998, 43, 1746–1753. [Google Scholar] [CrossRef]
  27. Kuosa, H. Picoplanktonic algae in the northern Baltic Sea: Seasonal dynamics and flagellate grazing. Mar. Ecol. Prog. Ser. 1991, 73, 269–276. [Google Scholar] [CrossRef]
  28. Alonso-Laita, P.; Navarro, N.; Duarte, C.M.; Agusti, S. Seasonality of pico-phytoplankton abundance and cell death in a Mediterranean Bay (Bay of Palma, Majorca Island). Vie Milieu 2005, 55, 177–184. [Google Scholar]
  29. Glibert, P.M.; Wilkerson, F.P.; Dugdale, R.C.; Raven, J.A.; Dupont, C.L.; Leavitt, P.R.; Parker, A.E.; Burkholder, J.M.; Kana, T.M. Pluses and minuses of ammonium and nitrate uptake and assimilation by phytoplankton and implications for productivity and community composition, with emphasis on nitrogen-enriched conditions. Limnol. Oceanogr. 2016, 61, 165–197. [Google Scholar] [CrossRef]
  30. Moore, L.R.; Post, A.F.; Rocap, G.; Chisholm, S.W. Utilization of different nitrogen sources by the marine cyanobacteria Prochlorococcus and Synechococcus. Limnol. Oceanogr. 2002, 47, 989–996. [Google Scholar] [CrossRef]
  31. Carlsson, P.; Caron, D.A. Seasonal variation of phosphorus limitation of bacterial growth in a small lake. Limnol. Oceanogr. 2001, 46, 108–120. [Google Scholar] [CrossRef] [Green Version]
  32. Ayukai, T. Possible limitation of the dilution technique for estimating growth and grazing mortality rates of picoplanktonic cyanobacteria in oligotrophic tropical waters. J. Exp. Mar. Bio. Ecol. 1996, 198, 101–111. [Google Scholar] [CrossRef]
  33. Tsai, A.Y.; Gong, G.C.; Huang, Y.W. Importance of the viral shunt in nitrogen cycling in Synechococcus spp. growth in subtropical Western Pacific coastal waters. Terr. Atmos. Ocean. Sci. 2014, 25, 839–846. [Google Scholar] [CrossRef] [Green Version]
  34. Bec, B.; Husseini-Ratrema, J.; Collos, Y.; Souchu, P.; Vaquer, A. Phytoplankton seasonal dynamics in a Mediterranean coastal lagoon: Emphasis on the picoeukaryote community. J. Plankton Res. 2005, 27, 881–894. [Google Scholar] [CrossRef] [Green Version]
  35. Agawin, N.S.R.; Duarte, C.M. Growth and abundance of Synechococcus sp. in a Mediterranean Bay: Seasonality and relationship with temperature. Mar. Ecol. Prog. Ser. 1998, 170, 45–53. [Google Scholar] [CrossRef] [Green Version]
  36. Behrenfeld, M.; Hardy, J.; Gucinski, H.; Hanneman, A.; Lee, H.; Wones, A. Effects of ultraviolet-B radiation on primary production along latitudinal transects in the South Pacific ocean. Mar. Environ. Res. 1993, 35, 349–363. [Google Scholar] [CrossRef]
  37. Helbling, E.W.; Buma, A.G.J.; Boer, M.K. de In situ impact of solar ultraviolet radiation on photosynthesis and DNA in temperate marine phytoplankton. Mar. Ecol. Prog. Ser. 2001, 211, 43–49. [Google Scholar] [CrossRef] [Green Version]
  38. Llabrés, M.; Agustí, S. Picophytoplankton cell death induced by UV radiation: Evidence for oceanic Atlantic communities. Limnol. Oceanogr. 2006, 51, 21–29. [Google Scholar] [CrossRef] [Green Version]
  39. Zhou, L.; Tan, Y.; Huang, L.; Huang, J.; Liu, H.; Lian, X. Phytoplankton growth and microzooplankton grazing in the continental shelf area of northeastern South China Sea after Typhoon Fengshen. Cont. Shelf Res. 2011, 31, 1663–1671. [Google Scholar] [CrossRef]
  40. Poulin, F.J.; Franks, P.J. Size-structured planktonic ecosystems: Constraints, controls and assembly instructions. J. Plankton Res. 2010, 32, 1121–1130. [Google Scholar] [CrossRef]
  41. Dolan, J.R.; Gallegos, C.L. Dilution effects on microzooplankton in dilution grazing experiments. Mar. Ecol. Prog. Ser. 2000, 200, 127–139. [Google Scholar] [CrossRef] [Green Version]
  42. Kamiyama, T.; Arima, S. Feeding characteristics of two tintinnid ciliate species on phytoplankton including harmful species: Effects of prey size on ingestion rates and selectivity. J. Exp. Mar. Bio. Ecol. 2001, 257, 281–296. [Google Scholar] [CrossRef]
  43. Calbet, A.; Trepat, I.; Almeda, R.; Saló, V.; Saiz, E.; Movilla, J.I.; Alcaraz, M.; Yebra, L.; Simó, R. Impact of micro- And nanograzers on phytoplankton assessed by standard and size-fractionated dilution grazing experiments. Aquat. Microb. Ecol. 2008, 50, 145–156. [Google Scholar] [CrossRef] [Green Version]
  44. Arenovski, A.L.; Lim, E.L.; Caron, D.A. Mixotrophic nanoplankton in oligotrophic surface waters of the Sargasso Sea may employ phagotrophy to obtain major nutrients. J. Plankton Res. 1995, 17, 801–820. [Google Scholar] [CrossRef]
  45. Christaki, U.; Van Wambeke, F.; Dolan, J.R. Nanoflagellates (mixotrophs, heterotrophs and autotrophs) in the oligotrophic eastern Mediterranean: Standing stocks, bacterivory and relationships with bacterial production. Mar. Ecol. Prog. Ser. 1999, 181, 297–307. [Google Scholar] [CrossRef] [Green Version]
  46. Suttle, C.A.; Chan, A.M. Dynamics and distribution of cyanophages and their effect on marine Synechococcus spp. Appl. Environ. Microbiol. 1994, 60, 3167–3174. [Google Scholar] [CrossRef] [PubMed] [Green Version]
  47. Baudoux, A.; Veldhuis, M.; Noordeloos, A.; van Noort, G.; Brussaard, C.P.D. Estimates of virus- vs. grazing induced mortality of picophytoplankton in the North Sea during summer. Aquat. Microb. Ecol. 2008, 52, 69–82. [Google Scholar] [CrossRef]
  48. Baudoux, A.-C.; Veldhuis, M.J.W.; Witte, H.J.; Brussaard, C.P.D. Viruses as mortality agents of picophytoplankton in the deep chlorophyll maximum layer during IRONAGES III. Limnol. Oceanogr. 2007, 52, 2519–2529. [Google Scholar] [CrossRef]
  49. Long, A.; McDaniel, L.D.; Mobberley, J.; Paul, J.H. Comparison of lysogeny (prophage induction) in heterotrophic bacterial and Synechococcus populations in the Gulf of Mexico and Mississippi river plume. ISME J. 2008, 2, 132–144. [Google Scholar] [CrossRef] [PubMed] [Green Version]
  50. Kimmance, S.A.; Wilson, W.H.; Archer, S.D. Modified dilution technique to estimate viral versus grazing mortality of phytoplankton: Limitations associated with method sensitivity in natural waters. Aquat. Microb. Ecol. 2007, 49, 207–222. [Google Scholar] [CrossRef]
  51. Tsai, A.-Y.; Gong, G.-C.; Chung, C.-C.; Huang, Y.-T. Different impact of nanoflagellate grazing and viral lysis on Synechococcus spp. and picoeukaryotic mortality in coastal waters. Estuar. Coast. Shelf Sci. 2018, 209, 1–6. [Google Scholar] [CrossRef]
  52. Jacquet, S.; Heldal, M.; Iglesias-Rodriguez, D.; Larsen, A.; Wilson, W.; Bratbak, G. Flow cytometric analysis of an Emiliana huxleyi bloom terminated by viral infection. Aquat. Microb. Ecol. 2002, 27, 111–124. [Google Scholar] [CrossRef]
  53. Sandaa, R.-A.; Larsen, A. Seasonal variations in virus-host populations in norwegian coastal waters: Focusing on the cyanophage community infecting marine Synechococcus spp. Appl. Environ. Microbiol. 2006, 72, 4610–4618. [Google Scholar] [CrossRef] [Green Version]
  54. Jacquet, S.; Domaizon, I.; Personnic, S.; Ram, A.S.P.; Hedal, M.; Duhamel, S.; Sime-Ngando, T. Estimates of protozoan- and viral-mediated mortality of bacterioplankton in Lake Bourget (France). Freshw. Biol. 2005, 50, 627–645. [Google Scholar] [CrossRef] [Green Version]
  55. Šimek, K.; Pernthaler, J.; Weinbauer, M.G.; Hornák, K.; Dolan, J.R.; Nedoma, J.; Mašín, M.; Amann, R. Changes in bacterial community composition and dynamics and viral mortality rates associated with enhanced flagellate grazing in a mesoeutrophic reservoir. Appl. Environ. Microbiol. 2001, 67, 2723–2733. [Google Scholar] [CrossRef] [PubMed] [Green Version]
  56. Weinbauer, M.G.; Christaki, U.; Nedoma, J. Comparing the effects of resource enrichment and grazing on viral production in a meso-eutrophic reservoir. Aquat. Microb. Ecol. 2003, 31, 137–144. [Google Scholar] [CrossRef]
Figure 1. Resolution of picophytoplankton cell groups by flow cytometry. Typical red (chlorophyll a) versus orange fluorescence (phycoerythrin) cytograms exhibiting the resolution of Synechococcus spp. (Syn) and picoeukaryotes (Pico-Euk).
Diversity 14 00049 g001
Figure 2. Seasonal variations of surface water temperature (A), NO3 concentrations (B), PO4 concentrations (C), and Chl a concentrations (D).
Diversity 14 00049 g002
Figure 3. Seasonal variations of Synechococcus spp. (Δ) and picoeukaryotic (X) abundance.
Diversity 14 00049 g003
Figure 4. Relationship between Chl a concentrations and Synechococcus spp. (Δ) and picoeukaryotic (×) abundance. The data points of the linear regressions were below 1 mg m−3 of Chl a concentration.
Diversity 14 00049 g004
Figure 5. Seasonal variations of Synechococcus spp. (Δ) and picoeukaryotic (×) gross growth rates (A), grazing mortality (B), and viral lysis mortality rates (C).
Diversity 14 00049 g005
Figure 6. Relationship between Synechococcus spp. (A) and picoeukaryotic gross growth rates (B) and sea surface water temperature. Solid lines exhibit the fitted linear regressions.
Diversity 14 00049 g006
Figure 7. Comparison between the Synechococcus spp. (A) and picoeukaryotic growth rates (B) and nanoflagellate grazing rate during the study period. Dotted lines represent a 1:1 ratio. (■): cold seasons <25 °C, (□): warm seasons >25 °C.
Diversity 14 00049 g007
Table 1. Net growth rates of Synechococcus spp. in each treatment incubation: 200 μm filtered water (k (200 μm filtered)), 0.2 μm diluted (k (0.2 μm diluted)), and 30 kDa diluted (k (30 kDa diluted)). ND: no data.
Synechococcus spp.
Datek (200 μm Filtered)
(d−1)
k (0.2 μm Diluted)
(d−1)
k (30 kDa Diluted)
(d−1)
4 Oct0.69 ± 0.07−0.5 ± 0.12−4.2 ± 0.31
9 Oct0.73 ± 0.140.43 ± 0.17−1.92 ± 0.48
22 Oct−2.21 ± 0.24−1.3 ± 0.14−2.01 ± 0.51
4 Nov−0.59 ± 0.270.34 ± 0.21−0.13 ± 0.42
3 Dec0.14 ± 0.31−0.39 ± 0.33−0.91 ± 0.17
17 DecNDNDND
5 Jan−0.77 ± 0.31−0.12 ± 0.11−0.52 ± 0.42
11 Feb−0.39 ± 0.240.02 ± 0.040.12 ± 0.05
9 Mar−0.01 ± 0.030.05 ± 0.020.1 ± 0.03
26 Mar0.69 ± 0.140.71 ± 0.220.71 ± 0.31
16 Apr0.37 ± 0.030.44 ± 0.020.45 ± 0.07
6 May0.28 ± 0.020.32 ± 0.010.32 ± 0.08
17 May0.66 ± 0.070.66 ± 0.010.68 ± 0.01
2 Jun0.75 ± 0.040.86 ± 0.020.86 ± 0.07
15 Jun0.17 ± 0.140.18 ± 0.070.19 ± 0.09
17 Jul1.04 ± 0.041.13 ± 0.031.14 ± 0.08
27 Jul0.7 ± 0.020.74 ± 0.010.78 ± 0.02
15 Aug1.17 ± 0.081.19 ± 0.041.22 ± 0.01
27 Aug0.46 ± 0.110.47 ± 0.090.47 ± 0.12
2 Sep1.1 ± 0.241.11 ± 0.141.12 ± 0.48
8 Sep1.42 ± 0.421.43 ± 0.171.43 ± 0.28
Table 2. Net growth rates of picoeukaryotes in each treatment incubation: 200 μm filtered water (k (200 μm filtered)), 0.2 μm diluted (k (0.2 μm diluted)), and 30 kDa diluted (k (30 kDa diluted)).
Picoeukaryotes
Datek (200 μm Filtered)
(d−1)
k (0.2 μm Diluted)
(d−1)
k (30 kDa Diluted)
(d−1)
4 Oct0.77 ± 0.520.62 ± 0.120.91 ± 0.14
9 Oct1.55 ± 0.711.54 ± 0.42−1.14 ± 0.78
22 Oct−0.25 ± 0.04−1.1 ± 0.15−0.3 ± 0.11
4 Nov−0.06 ± 0.071.19 ± 0.150.76 ± 0.32
3 Dec0.38 ± 0.140 ± 0.090 ± 0.48
17 Dec1.14 ± 0.421.39 ± 0.511.12 ± 0.34
5 Jan−0.63 ± 0.620.43 ± 0.11−0.12 ± 0.09
11 Feb0.82 ± 0.470.82 ± 0.270.42 ± 0.14
9 Mar1.58 ± 0.031.9 ± 0.022.02 ± 0.01
26 Mar1.16 ± 0.041.26 ± 0.021.39 ± 0.03
16 Apr0.43 ± 0.040.57 ± 0.020.6 ± 0.01
6 May0.84 ± 0.030.96 ± 0.031.09 ± 0.04
17 May0.93 ± 0.120.94 ± 0.010.96 ± 0.01
2 Jun1.73 ± 0.011.76 ± 0.011.79 ± 0.02
15 Jun1.17 ± 0.111.18 ± 0.021.23 ± 0.01
17 Jul1.31 ± 0.011.33 ± 0.011.35 ± 0.01
27 Jul0.8 ± 0.030.88 ± 0.020.98 ± 0.04
15 Aug1.73 ± 0.021.78 ± 0.021.79 ± 0.07
27 Aug0.87 ± 0.090.88 ± 0.040.9 ± 0.03
2 Sep1.05 ± 0.081.07 ± 0.021.1 ± 0.01
8 Sep1.6 ± 0.021.67 ± 0.031.69 ± 0.07
Publisher’s Note: MDPI stays neutral with regard to jurisdictional claims in published maps and institutional affiliations.

