Article

Bryophyte Diversity along an Elevational Gradient on Pico Island (Azores, Portugal)

by
Márcia C. M. Coelho
1,†,
Rosalina Gabriel
1,*,†,
Helena Hespanhol
2,
Paulo A. V. Borges
1 and
Claudine Ah-Peng
3
1
Azorean Biodiversity Group, CE3C–Centre for Ecology, Evolution and Environmental Changes, Universidade dos Açores, Angra do Heroísmo, 9700-042 Açores, Portugal
2
CIBIO/InBIO–Centro de Investigação em Biodiversidade e Recursos Genéticos, Universidade do Porto, Porto, 4485-661 Vairão, Portugal
3
Pôle de Protection des Plantes, Université de La Réunion, UMR PVBMT, 7 Chemin de l’IRAT, Saint-Pierre, 97410 Ile de La Réunion, France
*
Author to whom correspondence should be addressed.
Both of these authors contributed equally to the paper.
Diversity 2021, 13(4), 162; https://doi.org/10.3390/d13040162
Submission received: 9 March 2021 / Revised: 2 April 2021 / Accepted: 4 April 2021 / Published: 8 April 2021
(This article belongs to the Special Issue Plant Diversity on Islands)

Abstract

:
The study of elevational patterns is a valuable method for inferring the influence of the climate and other variables in the regional distributions of species. Bryophytes are ideal for revealing different environmental patterns in elevational studies, since they occur from sea level to above the tree line. Taking advantage of the long elevational transect of Pico Island and the use of standardized survey methods, our main aims were: (1) to identify and characterize the alpha and beta diversities of bryophytes across the full elevational gradient (12 sites of native vegetation, ranging from 10 to 2200 m above sea level [a.s.l.]); (2) to detect the ecological factors driving bryophyte composition; (3) to identify bryophytes’ substrate specificity; and (4) to check the presence of rare and endemic species. The identification of 878 microplots yielded 141 species (71 liverworts and 70 mosses), almost half of those known to occur on Pico Island. The bryophyte species richness followed a parabolic unimodal pattern with a mid-elevation peak, where the richest native forests occur. A canonical correspondence analysis (CCA) of the bryophyte composition and explanatory variables revealed the effect of the elevation, precipitation, disturbance, richness of vascular plants and bark pH in explaining bryophyte compositions at regional levels. Very few species of bryophytes showed substrate specificity. Pico Island’s elevational gradient could be an asset for studying long-term changes in bryophyte species composition and alpha diversity under global change.

1. Introduction

Bryophytes are an important and ecologically significant component of the vegetation in many regions of the world [1], and since they are found from sea level to above the tree line, their communities are ideal for extended elevational studies [2]. Bryophyte distribution is influenced by several factors both at local and regional levels, such as precipitation, temperature, humidity [3,4], shade [5], age and composition of the forest [6], substrate chemistry (e.g., pH [7]) and geographical structure (e.g., size, exposure and microtopography) [8,9]. Usually, local processes (e.g., biotic interactions between species, abiotic characteristics of the habitat and disturbance) influence their distribution on a local scale, whereas regional processes such as historical constraints, as well as immigration and extinction events (e.g., random colonization and extinction), shape their regional distribution [10]. The study of the impact of local and regional processes in the distribution of species is critical for the understanding of the species community assembly [11].
Ecological gradients, such as elevational ones, help to identify the most important explanatory variables, which may be used to predict species distribution patterns on local and regional scales [12]. The bryophyte richness (alpha diversity) and distribution along elevational gradients have been reported in four main patterns: decrease, increase, mid- elevational peak and double peak. In Uganda, Tusiime et al. [13] described a decreasing richness trend with increasing elevation between 1160 m and 2607 m. In Fennoscandia, Bruun et al. [14] found that the richness of mosses and liverworts followed an increasing pattern with increasing elevation between 250 m and 1525 m. In the island of La Réunion, Ah-Peng et al. [15], found a parabolic unimodal pattern with a mid-elevation peak, when analyzing epiphytic bryophytes from 350 m to 2750 m. In China, Sun et al. [16] showed that the ground-dwelling bryophyte richness, studied between 2001 m and 4221 m, presented a double peak of diversity around 2750 m and at the top of the transect.
The current evergreen forests of the Azores, owing to their characteristics (dense shrubs and ferns, small-statured tree species and a dense and closed canopy) [17] and particular climate conditions (high levels of atmospheric humidity, moderate temperature and low rates of evaporation) [18], offer high diversity of microhabitats for bryophyte colonization. In fact, bryophytes may be found in all type of substrates, such as rocks, soil, humus, dead wood, trees (bark of trunks and branches) and even living leaves [19,20]. The studies of Sjögren on native vegetation in the Azores [21,22] suggest that Azorean bryophyte vegetation presents complex patterns of distribution owing to several factors, such as the large number of species and their wide ecological ranges. Climate differences within and among islands also seem to affect the selection of differential species. Gabriel and Bates [7], working on Terceira Island, found that the distribution of bryophytes in the native forests was dependent on climate factors such as water availability, physical-chemical aspects such as the substrate pH, and ecological factors such as the differences among the vascular plant community. Other studies in forests from different parts of the world showed that bryophyte species exhibited high fidelity to particular substrates, but that ecological variables explained a larger proportion of bryophyte species diversity, in particular in species richness [23].
Pico Island has attracted the attention of several bryologists over the years. The first study including Pico Island [24] cited only four moss species, but other studies followed (e.g., [21,25,26,27,28,29,30,31]), and that number was updated. In the first checklist of Macaronesia [32], 175 taxa (species and subspecies) were already registered for the island, while Sjögren [33] cited 246, and more recently, Gabriel et al. [34] referred to 286 (4 hornworts, 121 liverworts and 161 mosses), which represent c. 60% of the bryophyte richness found in the Azores [35]. However, despite this fair amount of floristic research, practically no ecological studies were made on Pico Island. Even though bryophytes play important roles in forests and other vegetation types, the patterns of their local and regional distributions remain poorly explored. The knowledge about how bryophyte communities are assembled, and how and why they differ, remains limited. This type of knowledge is essential in community ecology [36] and in conservation studies, especially in the context of climate change [15,37].
Thus, taking advantage of the long elevational transect of Pico Island and the use of standardized survey methods, this paper aims to (1) identify and characterize the diversity of bryophytes, including alpha and beta diversity patterns, along an elevational transect on Pico Island (Azores); (2) detect the ecological factors driving bryophyte composition; (3) identify the substrate specificity of bryophytes along the elevational gradient; and (4) discuss standardized ecological sampling as a contribution to the global knowledge of the Azorean flora, especially for rare species.

2. Materials and Methods
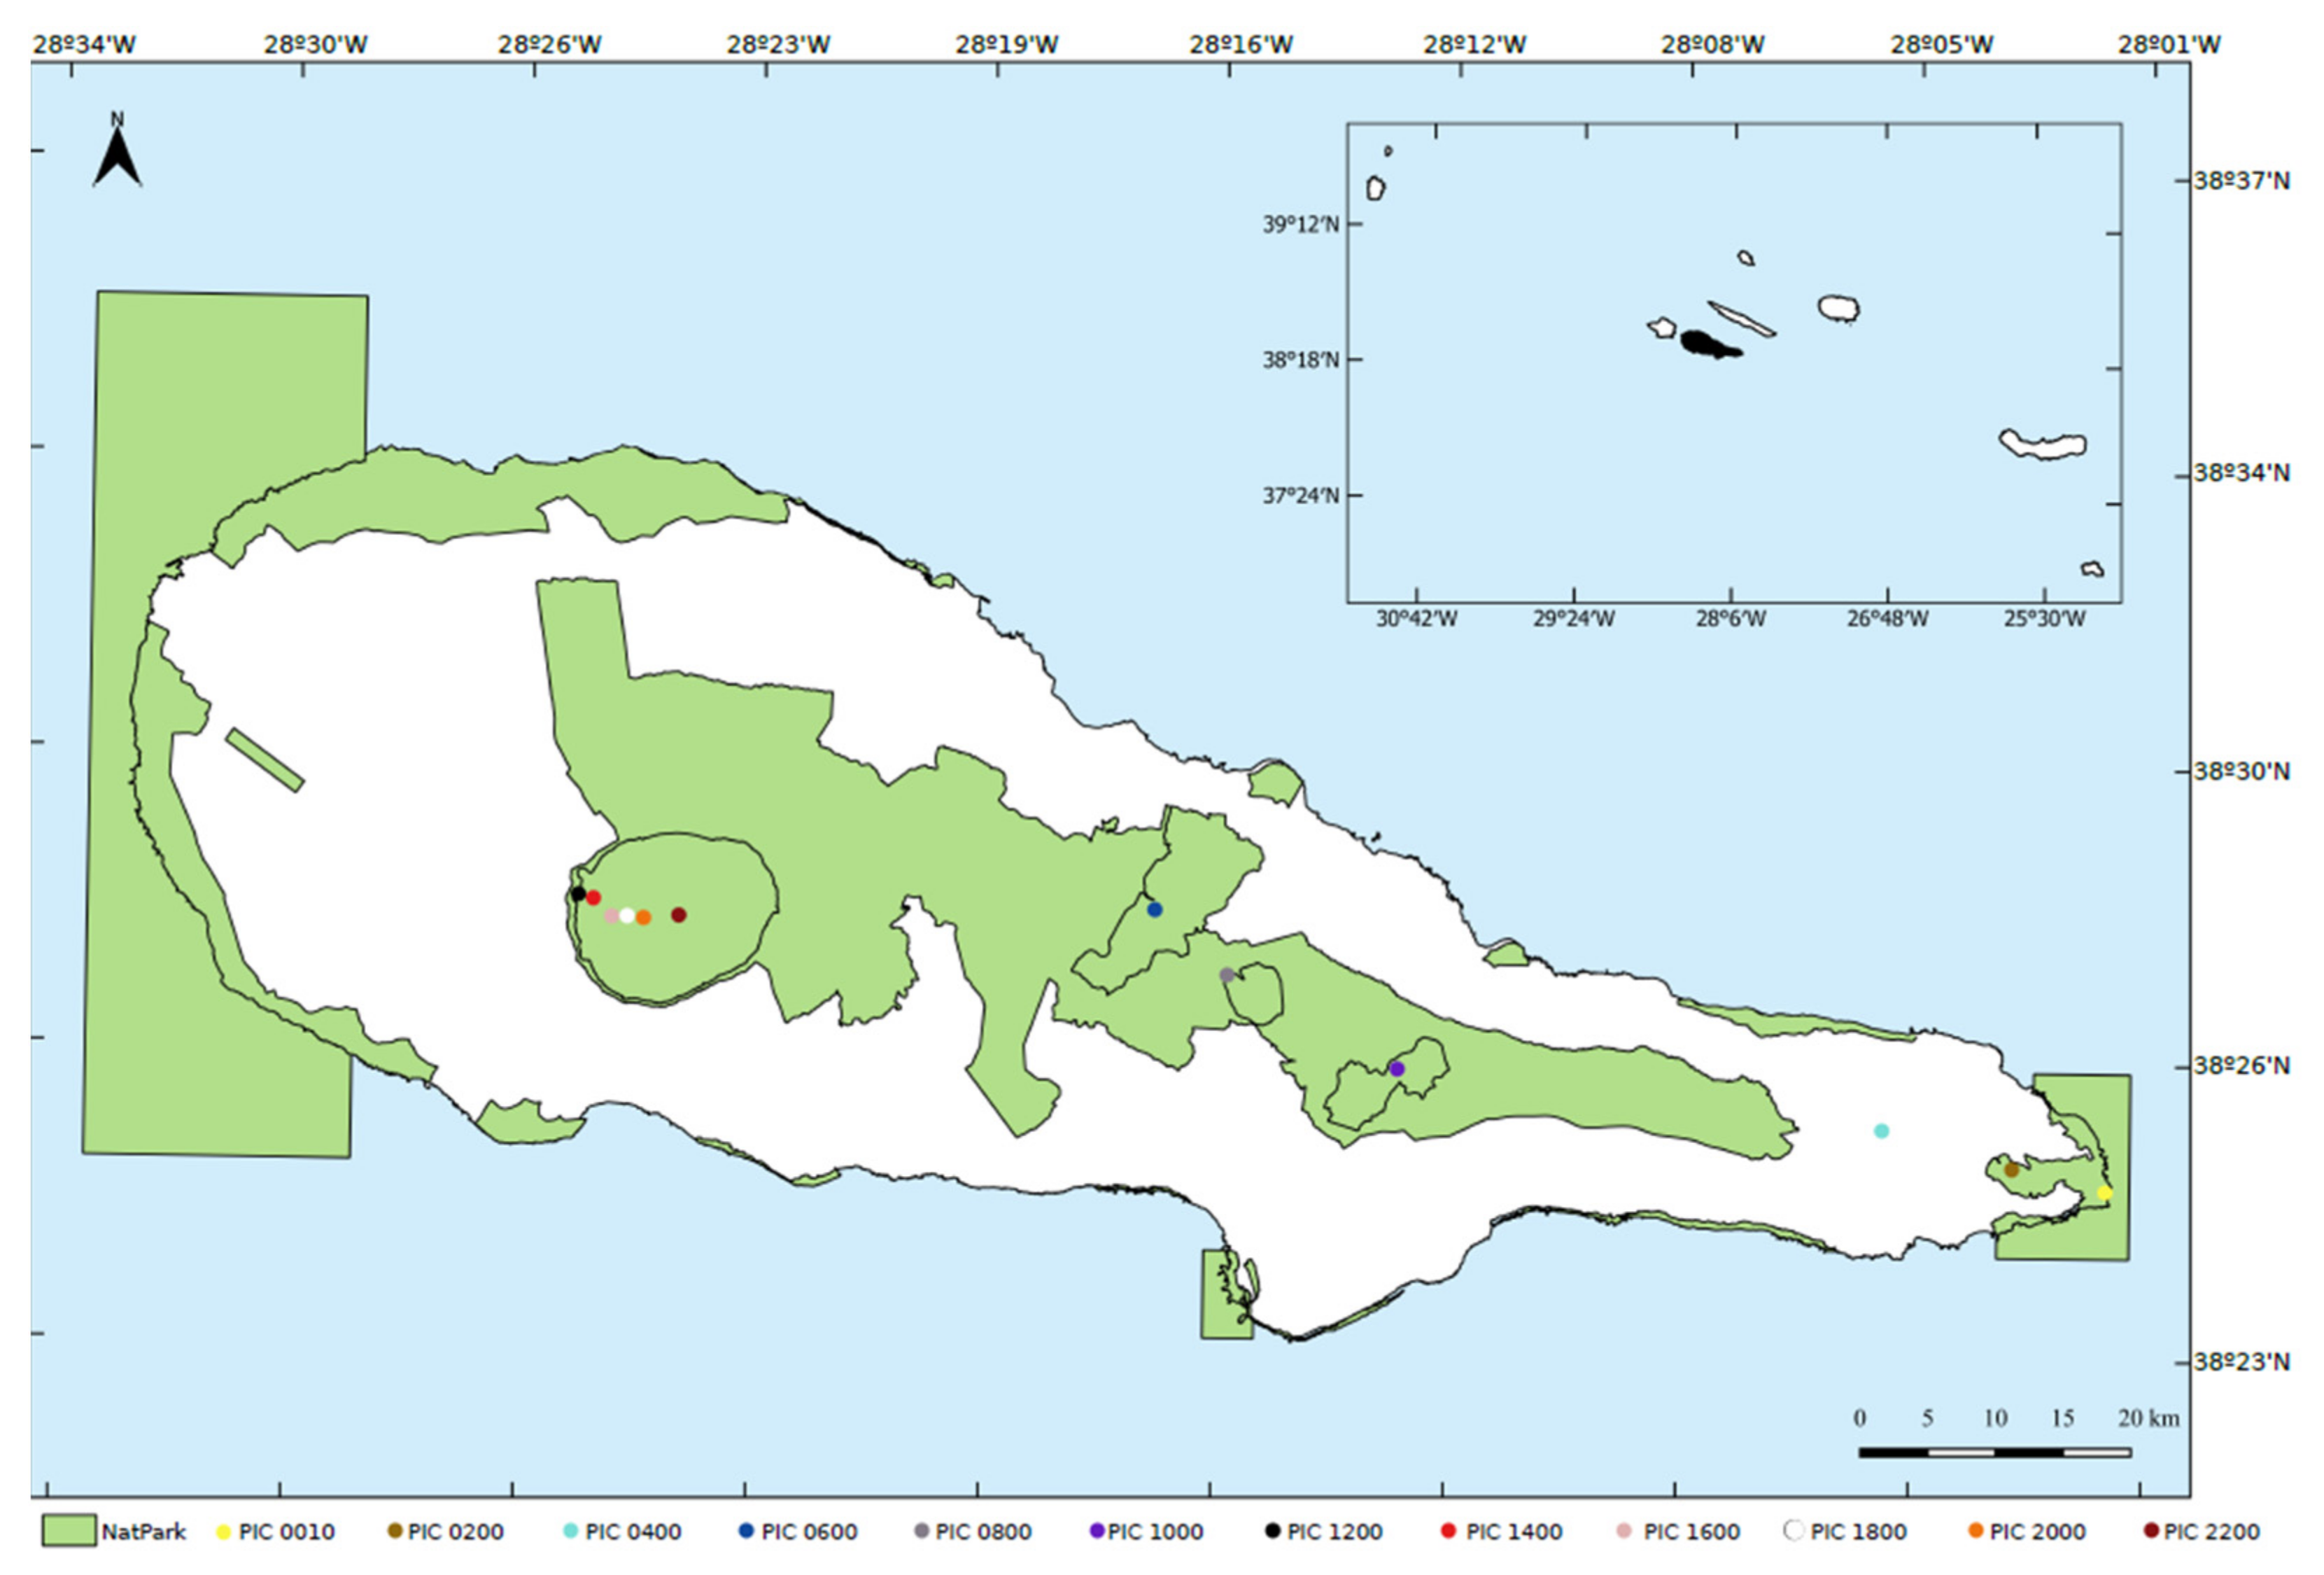
2.1. Study Area

Pico Island is set in the central group of the archipelago of the Azores (Portugal) in the North Atlantic Ocean, between the coordinates 38°33′57″ and 38°33′44″ N and 28°01′39″ and 28°32′33″ W [38]. Pico Island is the second-largest (445 km2), the highest (2350 m a.s.l.) and the youngest (0.27 MY) island of the Azores [39].
The climate is temperate oceanic, with regular and abundant rainfall and high levels of relative humidity increasing with the elevation. This is also a windy region, especially during the winter and autumn seasons [18].
The study was mostly conducted in Pico Natural Park (Figure 1), a large protected area (156 km2 (terrestrial), 79 km2 (maritime)), encompassing the mountain (roughly from 1200 m a.s.l.), native forests and woodlands, several small- to medium-sized lagoons [40] and the coastal zones. Due to the different bioclimatic belts of the island, the potential vegetation is quite diversified, including eight formations: Erica-Morella coastal woodlands, Picconia-Morella lowland forest, Laurus submontane forest, Juniperus-Ilex montane forest, Juniperus montane forest, Calluna-Juniperus altimontane scrubland, Calluna-Erica subalpine scrubland and Calluna alpine scrubland [41]. In spite of the fragmented land use of Pico Island, the collection sites were placed in such way that the real vegetation sampled was quite similar to the potential vegetation described [42]. Indeed, the lowland areas (0–400 m a.s.l.) were dominated by Erica azorica Hochst. ex Seub., Morella faya (Aiton) Wilbur and Picconia azorica (Tutin) Knobl., although Pittosporum undulatum Vent. was also present (especially at 200 m a.s.l.). In the middle elevation areas (600–1000 m a.s.l.), the vegetation was dominated by Laurus azorica (Seub.) Franco, Juniperus brevifolia (Seub.) Antoine and Ilex azorica Gand., including a large number of ferns and bryophytes. The intermediate elevations of Pico Mountain (1200–1600 m a.s.l.) were dominated by Calluna vulgaris (L.) Hull, with or without Erica azorica, while the upper elevations were mostly colonized by C. vulgaris, Thymus caespititius Brot. and Cardamine caldeirarum Guthn. ex Seub. growing among bryophytes and lichens. A total of 88 vascular plant species were recorded in the present transect, including more than one third (35%) of the indigenous flora and just 5% of the exotic species found on the island. The maximum relative richness of the indigenous species was recorded around the middle of the elevational gradient (600–1000 m), while the exotic species richness peaks at 200–400 m a.s.l., being negligible at the other stations (<2%). Further descriptions of the habitats may be seen in Coelho et al. [42].

2.2. Sampling Design and Fieldwork

During September 4–12, 2012, a longitudinal (east to west) elevational transect was set across Pico Island Natural Park (except for 400 m a.s.l.), including the best-preserved native vegetation areas. Twelve sites were set along this elevational gradient (Figure 1) and sampled according to BRYOLAT, a standardized protocol originally designed for the study of bryophyte diversity and distribution along environmental gradients in the tropics and subtropics [15,43,44].
Some adaptations were included for the Azores, namely identifying phorophyte species and estimating the light, evaporation, and shelter for each sample according to categorical variables [7] and collecting samples of soil and bark for pH determination [44,45]. The phorophytes included Calluna vulgaris, Erica azorica, Euphorbia stygiana, H. C. Watson subsp. stygiana, Ilex azorica, Juniperus brevifolia, Laurus azorica, Morella faya, Myrsine africana L., Picconia azorica, Pittosporum undulatum, Thymus caespititius and Vaccinium cylindraceum Sm. (cf. [35,42,46]).
Climate data were obtained from the CIELO model [47,48,49]. After testing for autocorrelations, the following variables were considered: annual precipitation (mm), mean temperature (°C) and mean relative humidity (%). The vapor pressure deficit (VPD; Pa) was calculated according to Monteith and Unsworth [50]. The landscape disturbance index (D) formulated by Cardoso et al. [51] was computed to assess the level of anthropogenic disruption in each plot.
Along the elevational gradient (from 10 m to 2200 m), 12 sites were selected using a 200 m elevational step. Detailed information regarding the vascular plant composition of the transect may be seen in Coelho et al. [42]. For bryophytes, two plots of 10 m × 10 m were set out at 12 elevation sites. Each plot was further subdivided into 25 quadrats (2 m × 2 m), from which three were randomly selected for the collection of bryophyte species. Within each quadrat, bryophytes were collected in small sampling units (microplots of 10 cm × 5 cm), obtaining, whenever possible, three replicates per surveyed substrate. The relatively small size of the microplots allowed the collection of identifiable units, but avoided the removal of large populations of bryophytes, which was essential to ensure that no harm would be done to the communities, particularly at low elevations, where their regeneration is especially slow [22]. In each quadrat, six substrates were assessed: (1) rocks; (2) soil; (3) humus; (4) dead wood; (5) bark of living trees and shrubs; and (6) living leaves of trees, shrubs, and fern fronds. Three height levels were considered when analyzing each tree or shrub: lower (0–50 cm), medium (50–100 cm) and higher stratum (100–200 cm). In each microplot, the percentage of coverage for each bryophyte species was estimated according to a seven-level scale proposed by the Braun-Blanquet method [52]: one individual + (1) 1–5%, (2) 5–25%, (3) 25–50%, (4) 50–75%; (5) 75–95%; and (6) 95–100%. Assuming that all substrates were colonized within the sampling area, a maximum of 144 microplots per site (two plots of 100 m2) could be retrieved, potentially totaling 1728 microplots. However, this would be an unrealistic expectation since, since Pico Island does not have trees above 1300 m a.s.l., and soil is scarce due to its geological youth. The number of microplots per elevation and per substrate may be checked in Table 1.
This protocol accounted for the heterogeneity within each site by the randomized selection of quadrats of 2 m × 2 m, collection of all microhabitats for bryophytes within each quadrat, five samples of 50 cm2 per microhabitat and identification of all species present in a sample of 50 cm2.

2.3. Species Inventory and Sampling Completeness

The complete species’ names are reported in Appendix A, following the latest checklists [46,53].
In order to evaluate the completeness of the sampling process, the following procedures were performed: (1) Species accumulation curves were generated based on a presence–absence microplot-scale matrix in order to evaluate the tendency of the curve (SDR-IV: Species Diversity and Richness 4.0 software [54]). (2) First- (Sjack1; Equation (1)) and second-order Jackknife (Sjack2; Equation (2)), and Chao 2 (SC2; Equation (3)) [55] estimators were computed. The Jackknife 1 method estimates the total number of species based on the observed number of species and the number of species that only occur in a single sample (unique). The Jackknife 2 method also uses the number of species that occur only in two microplots (duplicates). The Chao 2 method is an adaptation used for presence–absence data matrixes of the Chao 1 index, using unique and duplicate species instead of singletons (species represented by one individual) and doubletons (two individuals). The equations are as follows:
Sjack1 = Sobs + Q1 ((m − 1)/m)
Sjack2 = Sobs + [(Q1 (2m − 3)/m) − (Q2 (m − 2)2/m(m − 1)]
SC2 = Sobs + (Q12/2Q2)
where Sjack1, Sjack2 and SC2 correspond to the estimated number of species, Sobs represents the number of species observed in the sample, m represents the number of microplots, Q1 is the number of species occurring in only one microplot (unique) and Q2 is the number of species occurring in only two microplots (duplicate).

2.4. Diversity Measurement

Measuring diversity in species assemblages is not a simple task and cannot be described with a single index [56]. Classic measurements of species diversity include the number of species (S, or species richness) and two other indices that incorporate the relative abundance of each species (e.g., Shannon entropy and the Simpson indices), also targeting dominance in a species assemblage with both the Simpson and Berger–Parker indices [56]. Currently, the most accepted way to quantify abundance-based species diversity is the use of the effective number of species, also called Hill numbers [57,58,59]. Hill numbers are a group of indices that differ only in a single parameter q, in which the higher the value, the more sensitive the index is to species relative abundances [57]. The conversion of Shannon entropy and the Simpson index to the Hill series was made by taking the exponential of Shannon and the inverse of Simpson, which would thus use the same units as species richness [57]. With q = 1, all species relative abundances are weighted equally, but at q = 2, the most abundant species are favored (inverse Simpson), and dominance is targeted in diversity measurement, or the “effective number of dominant or very abundant species in the assemblage” [57,59]. An increase in the number of species or a higher homogeneity of the abundances increases the different diversity values. Therefore, the Hill numbers use a diversity profile organized in four orders (q) as follows: (1) species richness (S) (q = 0), taken as a count of the number of species in a particular site; (2) the exponential Shannon–Wiener (H’) (q = 1) [60]; (3) the inverse of Simpson’s concentration index (D) (q = 2); and (4) Berger–Parker’s index (d) (q = 3) [61]. The Hill numbers combine information on species richness, species rarity (species relative abundances) and species dominance [56,62]. The Jackknife statistical test was applied to the exponential Shannon–Wiener, since this index is highly sensitive to species richness [56]. All indices were calculated using SDR-IV (Species Diversity and Richness 4.0 software [54]).
To investigate the relationship between species, the richness of bryophytes (S_Bryo) and elevation were used in a linear regression with a cubic term to account for the non-linearity of the response variable). As the area of the fragments in which plots were located may have also influenced the richness of species, regression analysis was first performed between S_Bryo and the fragments’ area at each elevation. Then, the residuals of that relationship were used to obtain the final model of S_Bryo with the elevation. A log transformation of continuous explanatory variables (area and elevation) did not improve the distribution of residuals and was not implemented. The results for the richness of liverworts and mosses followed a similar pattern to S_Bryo and are not shown in the results section.
Beta diversity assesses how different communities are in terms of species composition. The lower the number of common species among different communities, the higher the beta diversity is [63]. Similarity coefficients measure beta diversity between pairs of places, comparing communities in qualitative or quantitative ways. The qualitative Sørensen similarity index (SSI; Equation (4)) [64] was used to compare the groups of taxa found in the sampled sites of Pico Island. The SSI varies from zero (no similarity) to 1 (maximum similarity). It was calculated as
SSI   =   2 w m + n
where w is the number of species common to both communities, m is the total number of species in the first community but not in the second and n is the total number of species in the second community but not in the first.
Species composition similarity was also investigated using cluster analysis, both for elevation and the substrate. Clusters were made with PAST software [54], using Bray–Curtis ordination and the unweighted pair group average (UPGMA) algorithm. In this method, the sites or substrates are joined based on the average distance between all members in the two groups.

2.5. Substrate Specificity of Species

The Lloyd Index of Patchiness (LIP; Equation (5)) [65] was selected to test the generalized idea that bryophytes in the Azores are not as faithful to substrates as in other parts of the world. This index is projected to evaluate the frequency of species in different substrates, assessing the substrate specificity of each species [7,66]. Thus, the LIP shows if a particular species exhibits substrate specificity, and it is determined as follows:
L I P   =   S x 2   x x 2 + 1
where Sx2 corresponds to the value of the variance and x corresponds to the mean value of the number of microplots in the different substrates assessed in the study.
To standardize the sampling effort among the different substrates, prior to applying the LIP, the number of microplots where the species were found was divided by the total number of microplots obtained in that substrate. Thus, the index was only calculated for species represented by a minimum of six microplots, because that was the number of substrates from which the species could be collected. Species were considered specialists if a minimum of 85% of the species records came from one single substrate, which translated to an index value higher than three.

2.6. Floristic Composition and Ecological Variables

Canonical correspondence analysis (CCA) [54] was performed to obtain the ordination of bryophyte species according to the sites and to a set of biological, environmental and climatic variables. This method describes the distribution of species according to predefined parameters. The data matrix of bryophyte abundance was calculated with the number of microplots where each species was present. The explanatory variables included the elevation (ALTI), mean annual precipitation (RAIN), richness of vascular plant species (S_VA), disturbance index (DIST) [67], bark pH (pH_C), soil pH (pH_S), mean annual temperature (TEMP), relative humidity (RH), vapor pressure deficit (VPD, Pa), the area of the fragments where the plots were implemented (A_FR) (land use data extracted from Azorean governmental agencies [40]) and a surrogate of sampling effort (S_EF), operationalized as the number of collected samples per site. All explanatory variables were tested for autocorrelation, excluding those with correlations higher than 0.75, retaining those with the highest correlation with the Bryophyte richness (S_Bryo). The first five variables were used in the CCA. The CCA was performed with PAST software [54], which implemented the algorithms proposed by Legendre and Legendre [68].

3. Results

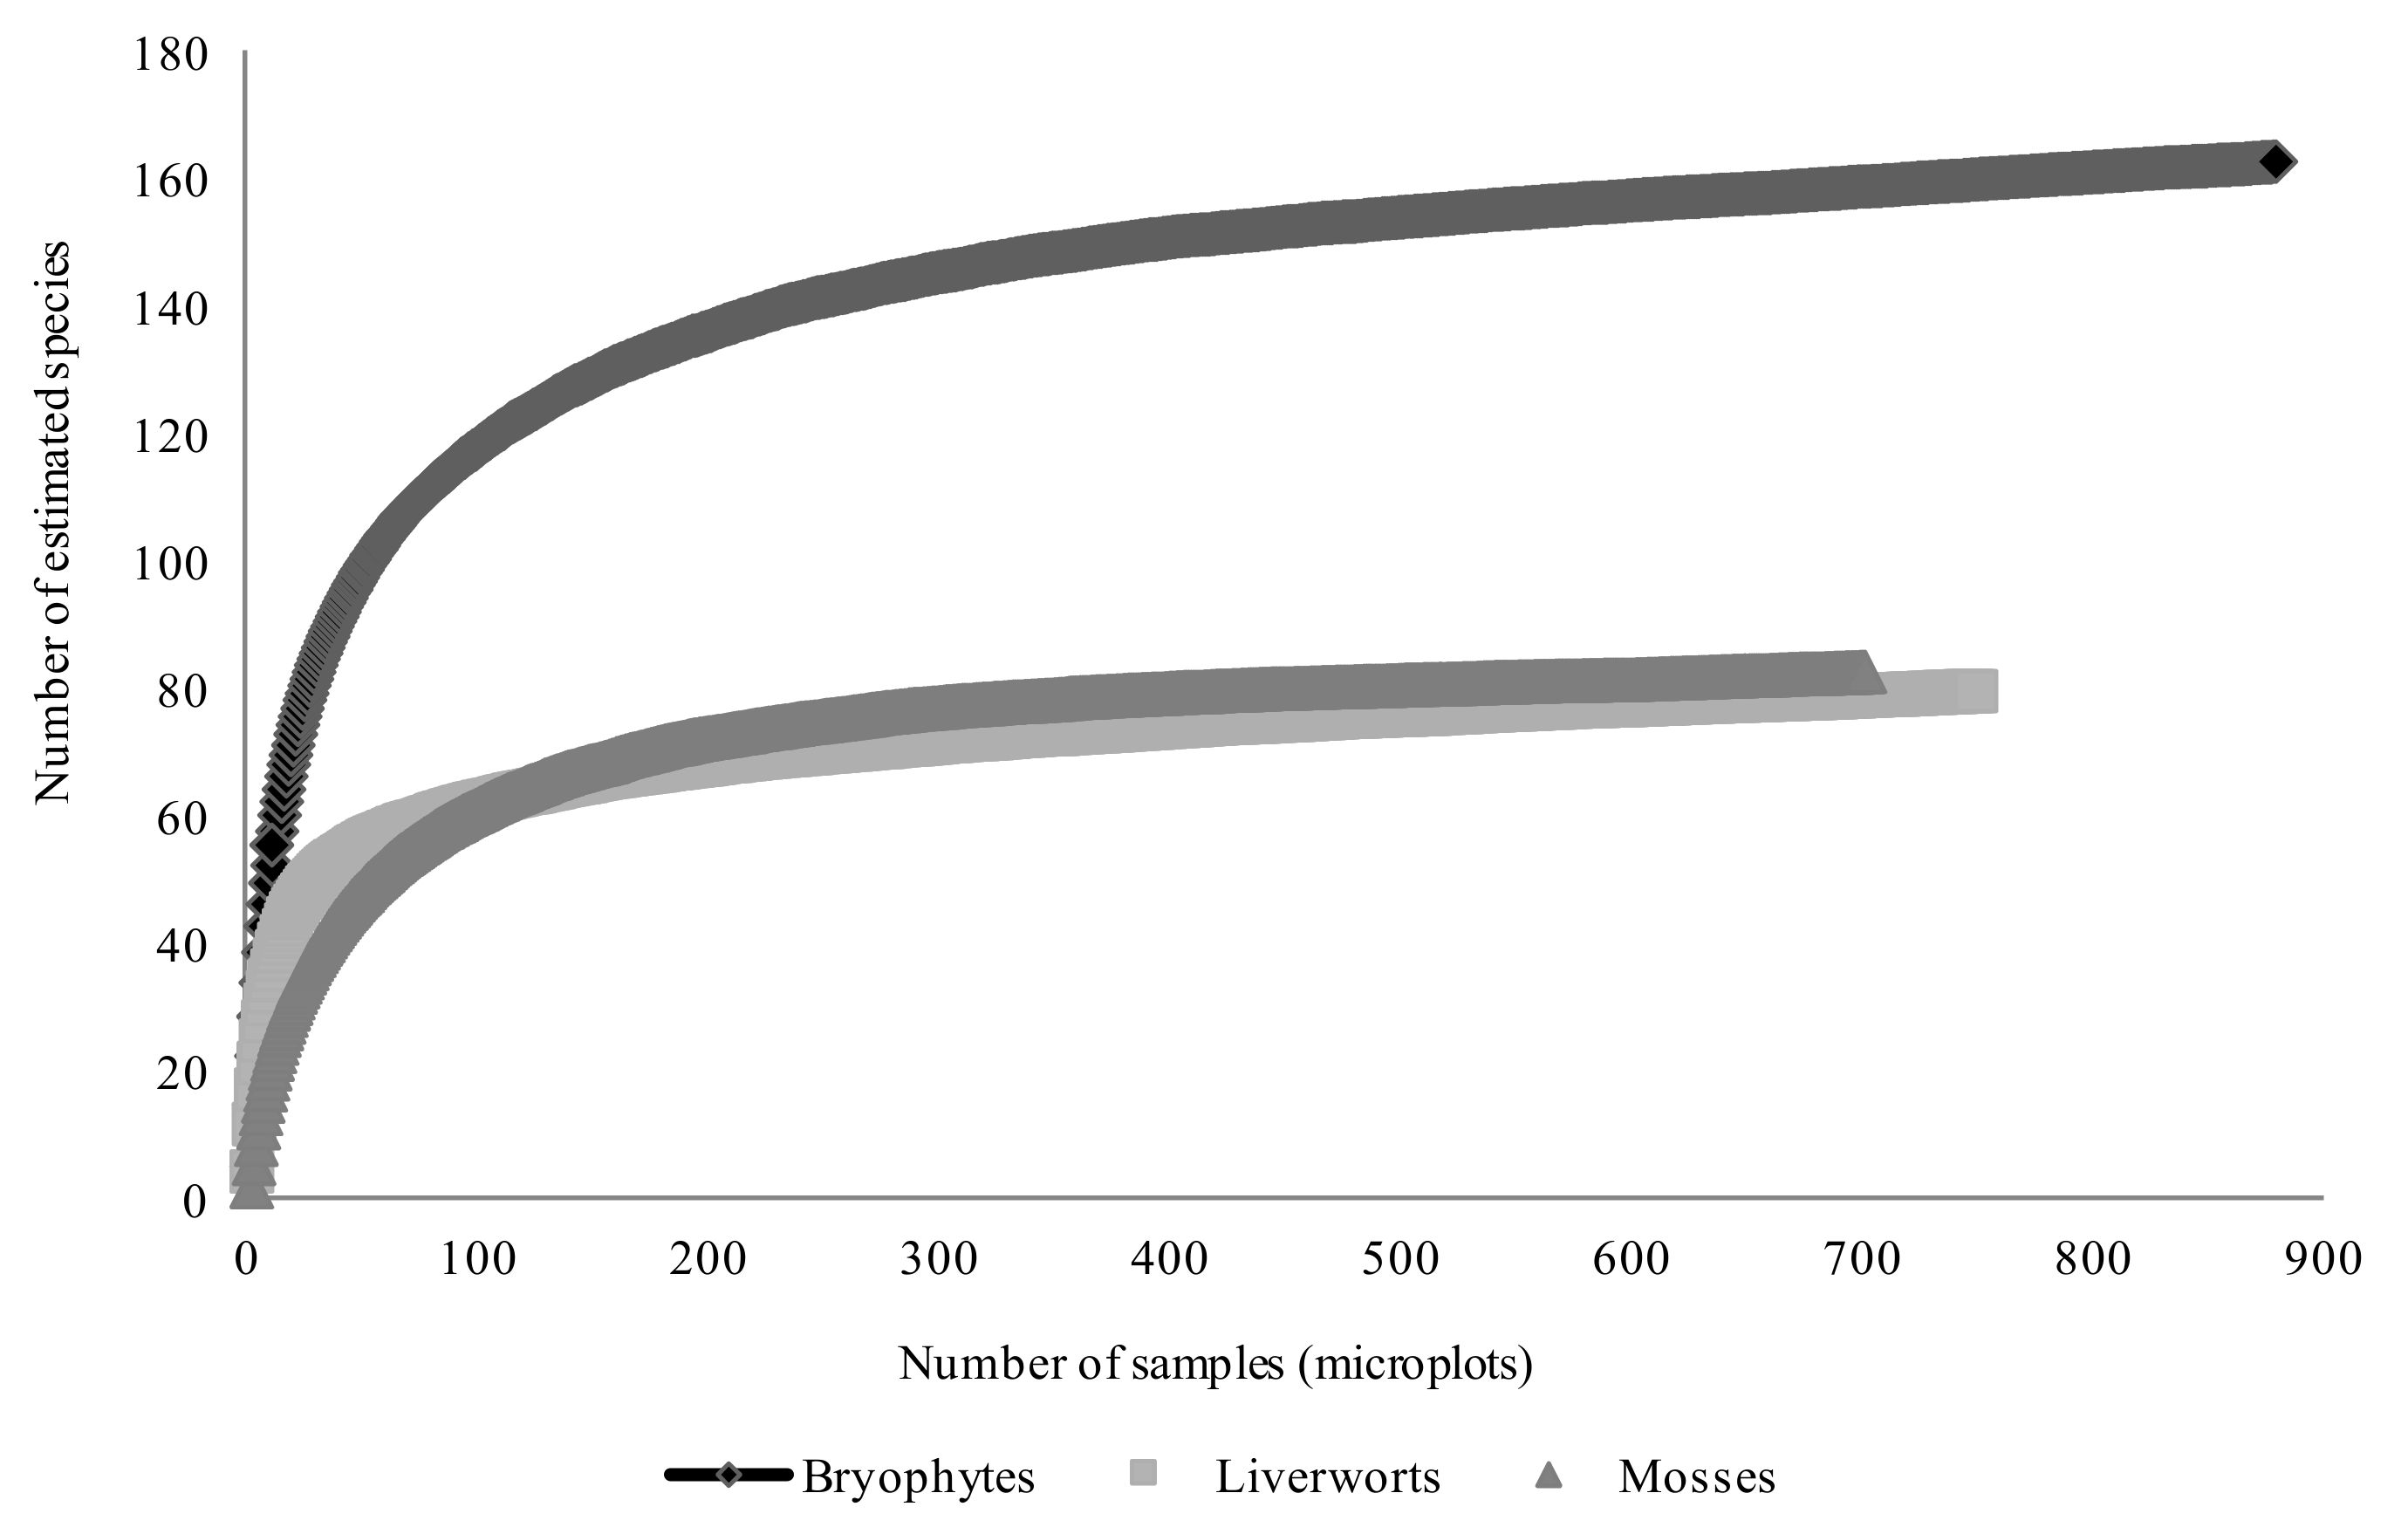
3.1. Species Inventory and Sampling Completeness

The 878 sampled microplots yielded a total of 71 liverwort and 70 moss species (see Appendix A). Due to scarcity of specimens, six liverworts and four mosses were not identified, while two moss species were identified only at the genus level. Bryophytes were classified into five classes, 18 orders, 51 families and 89 genera. The overall ratio of liverwort/moss was 1.01. Three families stood out among the liverworts, presenting more than five species each: Lejeuneaceae (n = 14; 9.7%), Calypogeiaceae and Lophocoleaceae (n = 6; 4.2%), while Brachytheciaceae (n = 9; 6.3%) and Leucobryaceae (n = 6; 4.2%) were the richest moss families.
At the sample level, the ten most frequently recorded species included eight liverworts (Cololejeunea microscopica, Drepanolejeunea hamatifolia, Frullania microphylla, F. tamarisci, F. teneriffae, Lejeunea lamacerina, Plagiochila bifaria and Radula aquilegia) and two mosses (Hypnum uncinulatum and Thuidium tamariscinum). The most recorded liverwort species was Frullania tamarisci (n = 330 microplots; 6.8%), occurring from 10–1800 m a.s.l., while Hypnum uncinulatum was the most-recorded moss (n = 323 microplots; 6.6%), occurring from 10–1600 m a.s.l. Both species were found predominantly as epiphytes and lignicolous. Another six species (three liverworts and three mosses) also exhibited a broad distribution range, occurring in more than six sites. Most of the species (n = 114; 79.2%) occurred up to 1000 m, and a fifth (n = 30; 20.8%) was found only above that elevation. Some species were only recorded once for the whole gradient (nuniques = 19; 13.2%) (e.g., Calypogeia azorica, C. sphagnicola, Geocalyx graveolens, Heterocladium heteropterum and Sciuro-hypnum plumosum). The pleurocarpous moss Antitrichia curtipendula, found at 1600 m a.s.l., was recorded as new for Pico Island and the Azores [69], almost 10 years after Erik Sjögren had postulated its possible presence on the island [70]. Two endemic Azorean species (a liverwort, Bazzania azorica, and a moss, Echinodium renauldii [71]), eight Macaronesian endemic species, five liverworts (Calypogeia azorica, Cheilolejeunea cedercreutzii, Heteroscyphus denticulatus, Radula wichurae and Telaranea azorica) and three mosses (Alophosia azorica, Andoa berthelotiana and Isothecium prolixum) were reported from the surveyed sites. Some were new for the sites, especially at lower elevations. No introduced bryophyte species were recorded in this transect.
Sampling completeness was high for both taxonomic groups, varying from 87.5% (liverworts; Chao 2) to 94.5% (mosses; Chao 2) (Figure 2). The number of unique entries exceeded the number of duplicates for every taxonomic group, but the values were similar between mosses and liverworts. The high values obtained with the three estimators are reflected in the shape of the mean accumulation curves built for the total number of bryophytes, liverworts, and mosses (Figure 2), which appear to be reaching an asymptote.
The completeness of bryophyte samplings along the 12 sites tended to be high, with all estimators, generally above 80%, reaching values of more than 90% at 1000 m in the hyper humid forest zone. The lowest values of completeness (about 75%) were found at the limits of the gradient (200 m and 2000–2200 m) for liverworts, while for mosses, the lowest values of completeness were lower than 75% (e.g., 58.8% at 10 m a.s.l., Jackknife 1), arising at several elevational bands, though not necessarily at the extremes.
About 342 records (38.9%) and 98 species (68.1%) were obtained when considering just three elevational bands (600–1000 m a.s.l.). The highest three elevational sites (above 1600 m a.s.l.) exhibited a lower number of microplots (about 30 per site), records (less than 100) and species (9–15). These values were only comparable to the lowest elevational site (64 microplots, 135 records and 16 species).
The completeness values among the six different substrates were higher for the epiphyllous mosses, probably due to the limited number of species (n = 6) that colonized that substrate. The humicolous species exhibited values approaching 90% completeness for all bryophytes and mosses, and the humicolous liverworts showed values of 79.4% (Jackknife 2) and 88.5% (Jackknife 1). Almost 44.9% of the records (n = 2179) and 57.6% of the species (n = 83) were obtained in the epiphytic microplots (n = 341; 38.8%). The epiphyllous and terricolous substrates revealed the lowest number of microplots—about 60—but the numbers of records and species were quite different. While soil exhibited almost half of the recorded species (n = 62), leaves and fronds presented only about a quarter (n = 37). The six substrates revealed a high degree of redundancy, since three of them exhibited more than half of the species (epiphytic, humicolous and rupicolous), and two of them (lignicolous and terricolous) showed more than four tenths of the 141 recorded species.

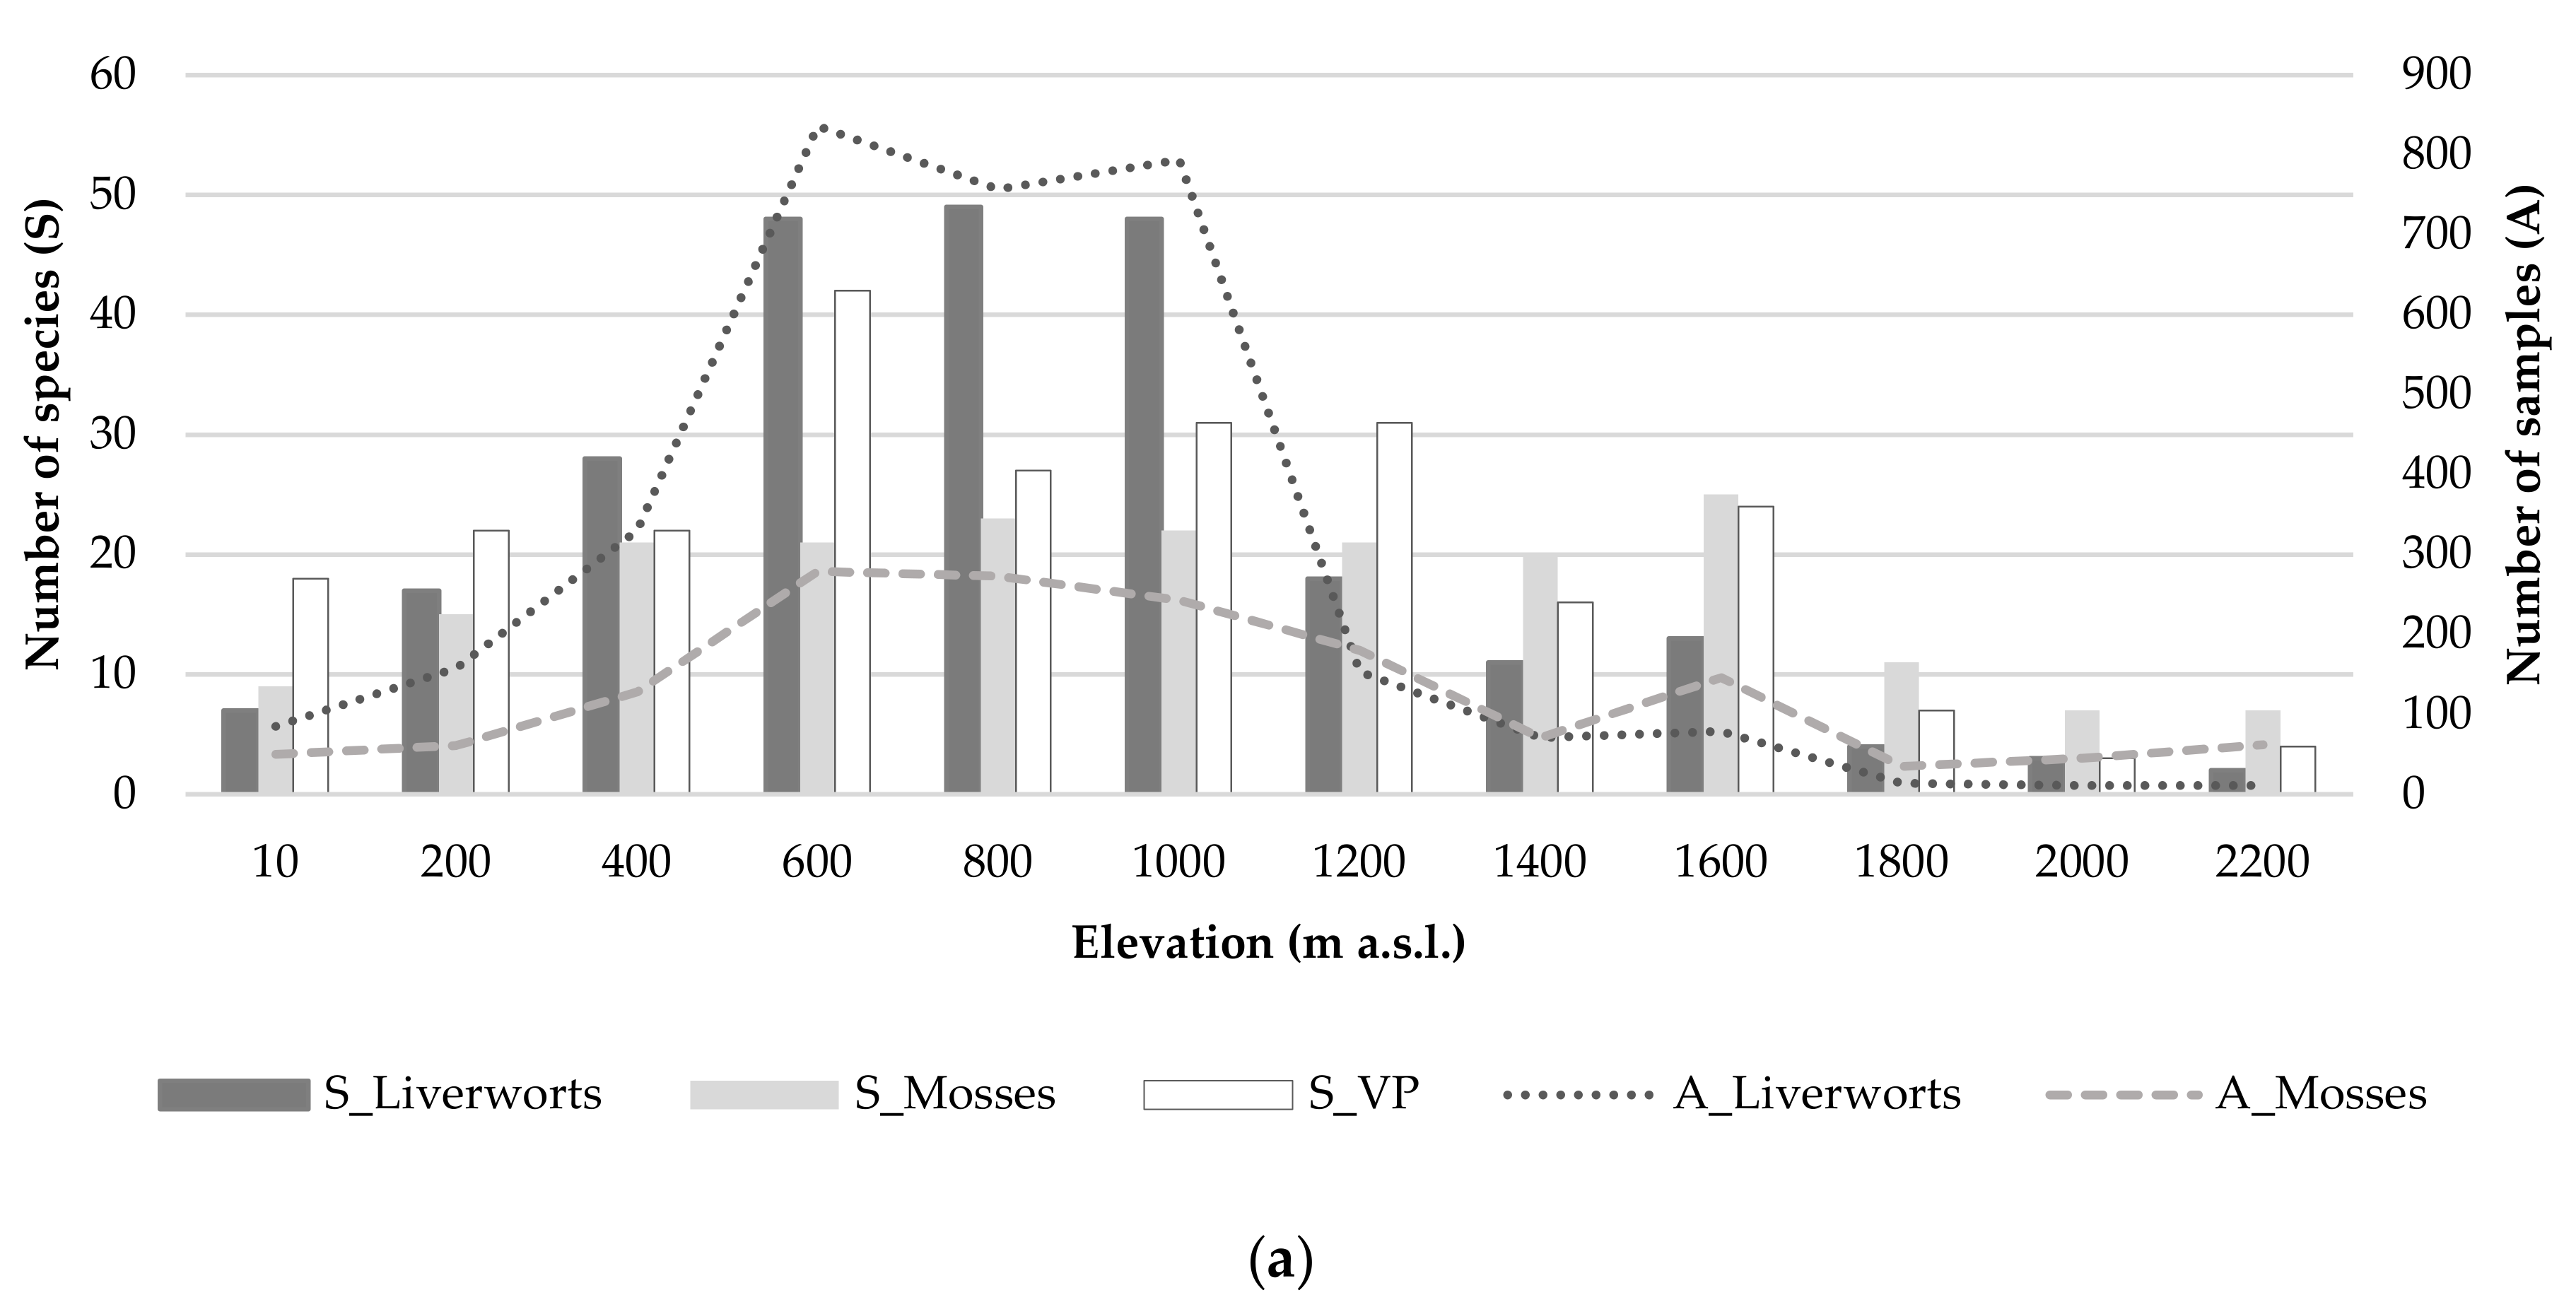
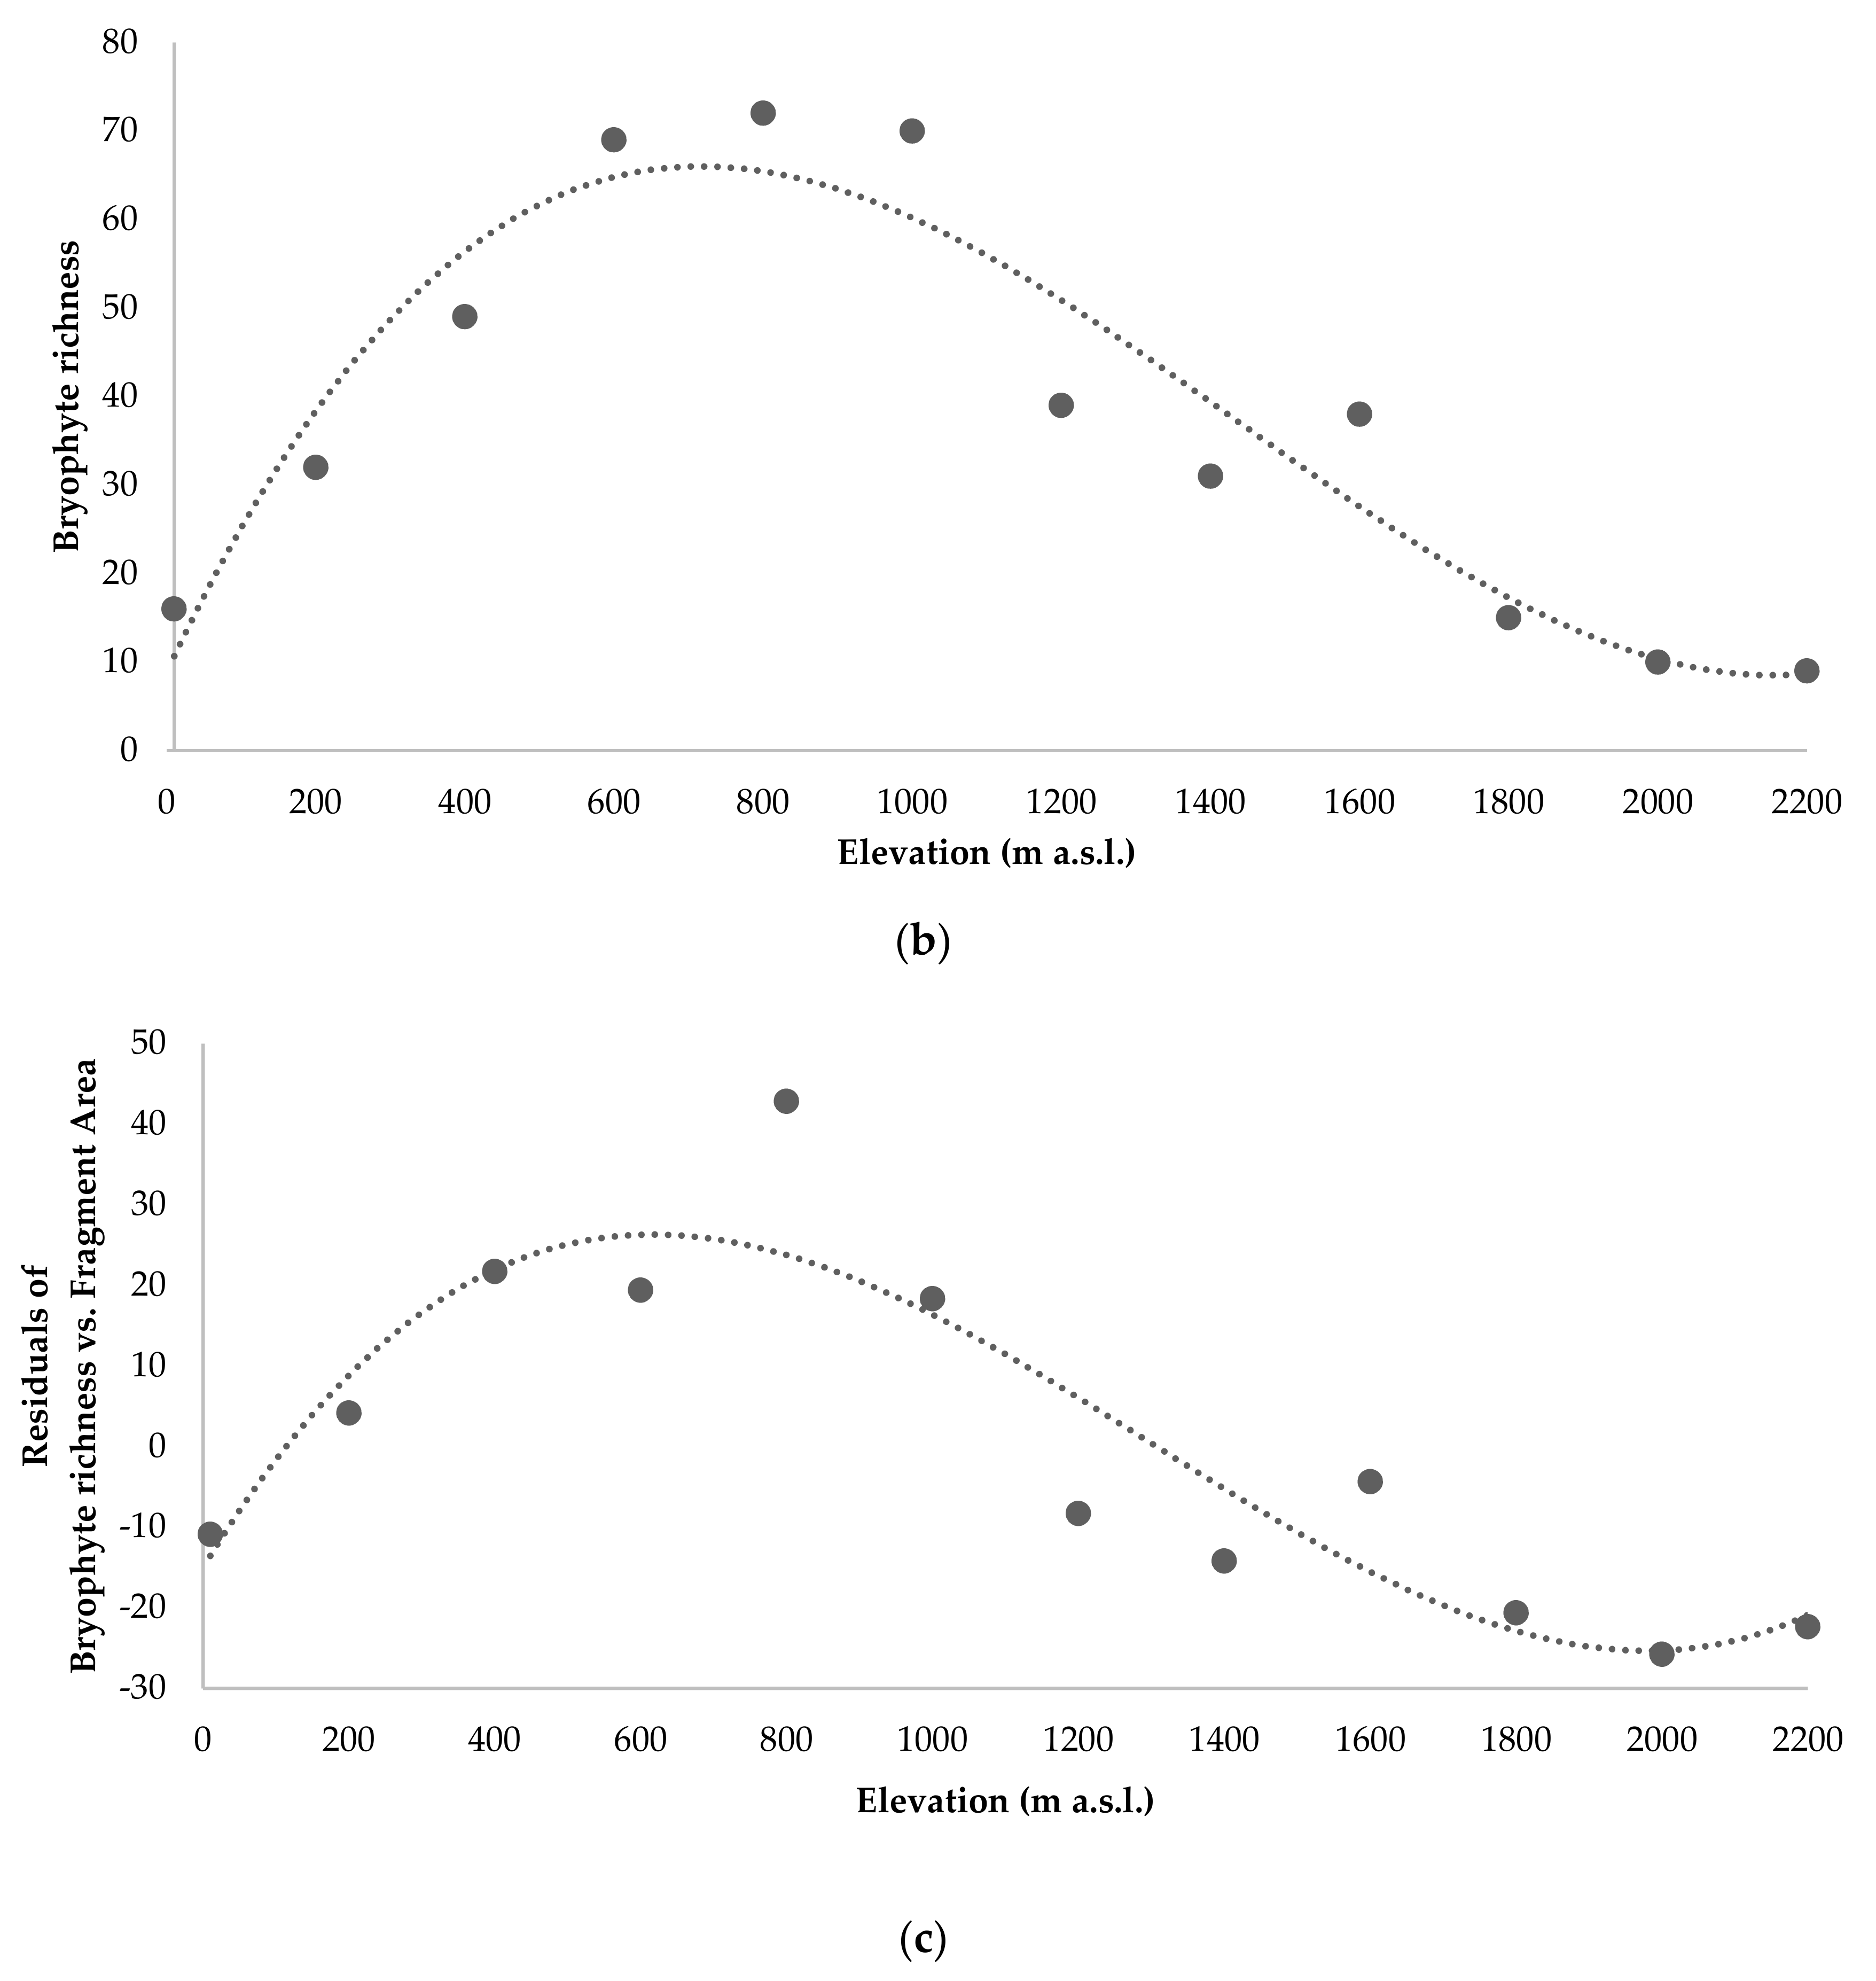
3.2. Species Richness (Alpha Diversity)

The bryophyte species richness distribution along the studied gradient presented a parabolic unimodal pattern with a mid-elevation peak at 800 m (S = 72), mostly due to liverworts, and another modal class around 1600 m (S = 38), mostly due to mosses (Figure 3a,b). The model that described the richness of bryophytes and elevation is described by the polynomial regression in Equation (6):
S_Bryo = 8.88 + 0.18 ALTI − 0.0002 ALTI 2 + 0.00000004 ALTI 3
where R2 = 0.899 (Figure 3b). The contribution of the area for this pattern was minimal, since the model considering the relationship between the residuals of the bryophyte richness and the fragment area (A_FR) and elevation showed only a small decrease of R2 (R2 = 0.829), according to the polynomial regression in Equation (7) (Figure 3c):
Residuals_S_Bryo vs. A_FR = − 15.02+ 0.15 ALTI − 0.0002 ALTI 2 + 0.00000004 ALTI 3
When considering the total richness of bryophytes, the species-to-families ratio was higher (above 2.0) in the forest areas (400–1000 m a.s.l.) and above 2000 m a.s.l. This high ratio could be related to the high number of species at these elevations or to a low number of families. This pattern was roughly the same for liverworts, but among mosses, the values were more constant, except at the highest elevation, the only circumstance where the ratio of moss species/families exceeded 2.0. Values of the same order of magnitude were observed when comparing different substrates. Epiphytic liverwort species showed the highest ratio of species/families (above 3.0), and the other three tree-related substrates (dead wood, leaves and fronds) were also quite high. In contrast, the highest value for mosses (above 2.0) came from rocky substrates, while the other two ground substrates (soil and humus) also exhibited relatively high values.
The richness of vascular plants (n = 88), following a hump-shaped pattern (with a maximum of species at 600 m) along the elevational transect of Pico Island (Figure 3a), was positively correlated with the richness of bryophyte species (rs = 0.86), liverworts (rs = 0.81) and, to a lesser extent, mosses (rs = 0.77). The correlation between liverworts and mosses was lower (rs = 0.65) than either of these groups of bryophytes with vascular plants. This was probably due to the diversity of mosses from 1200–1600 m a.s.l., where the number of moss species was similar to that found on the precedent elevational zone (600–1000 m), while liverwort richness decreased to less than half.
Richness values varied both with the elevational band and substrate type. The average number of species per microplot of 50 cm2 was above five ( x ¯   = 5.5 ± 4.1), but from 600–1000 m a.s.l., the average number of species per microplot exceeded nine, while values lower than two were only found at 1800 m a.s.l. Similar patterns were found for liverworts and mosses. Different substrates also exhibited different average values of bryophyte species per sample unit (microplot). Microplots gathered on bark (epiphytes) presented the highest richness values ( x ¯   = 6.4 ± 4.7), while rock dwellers exhibited the lowest ( x ¯ = 3.8 ± 2.5).

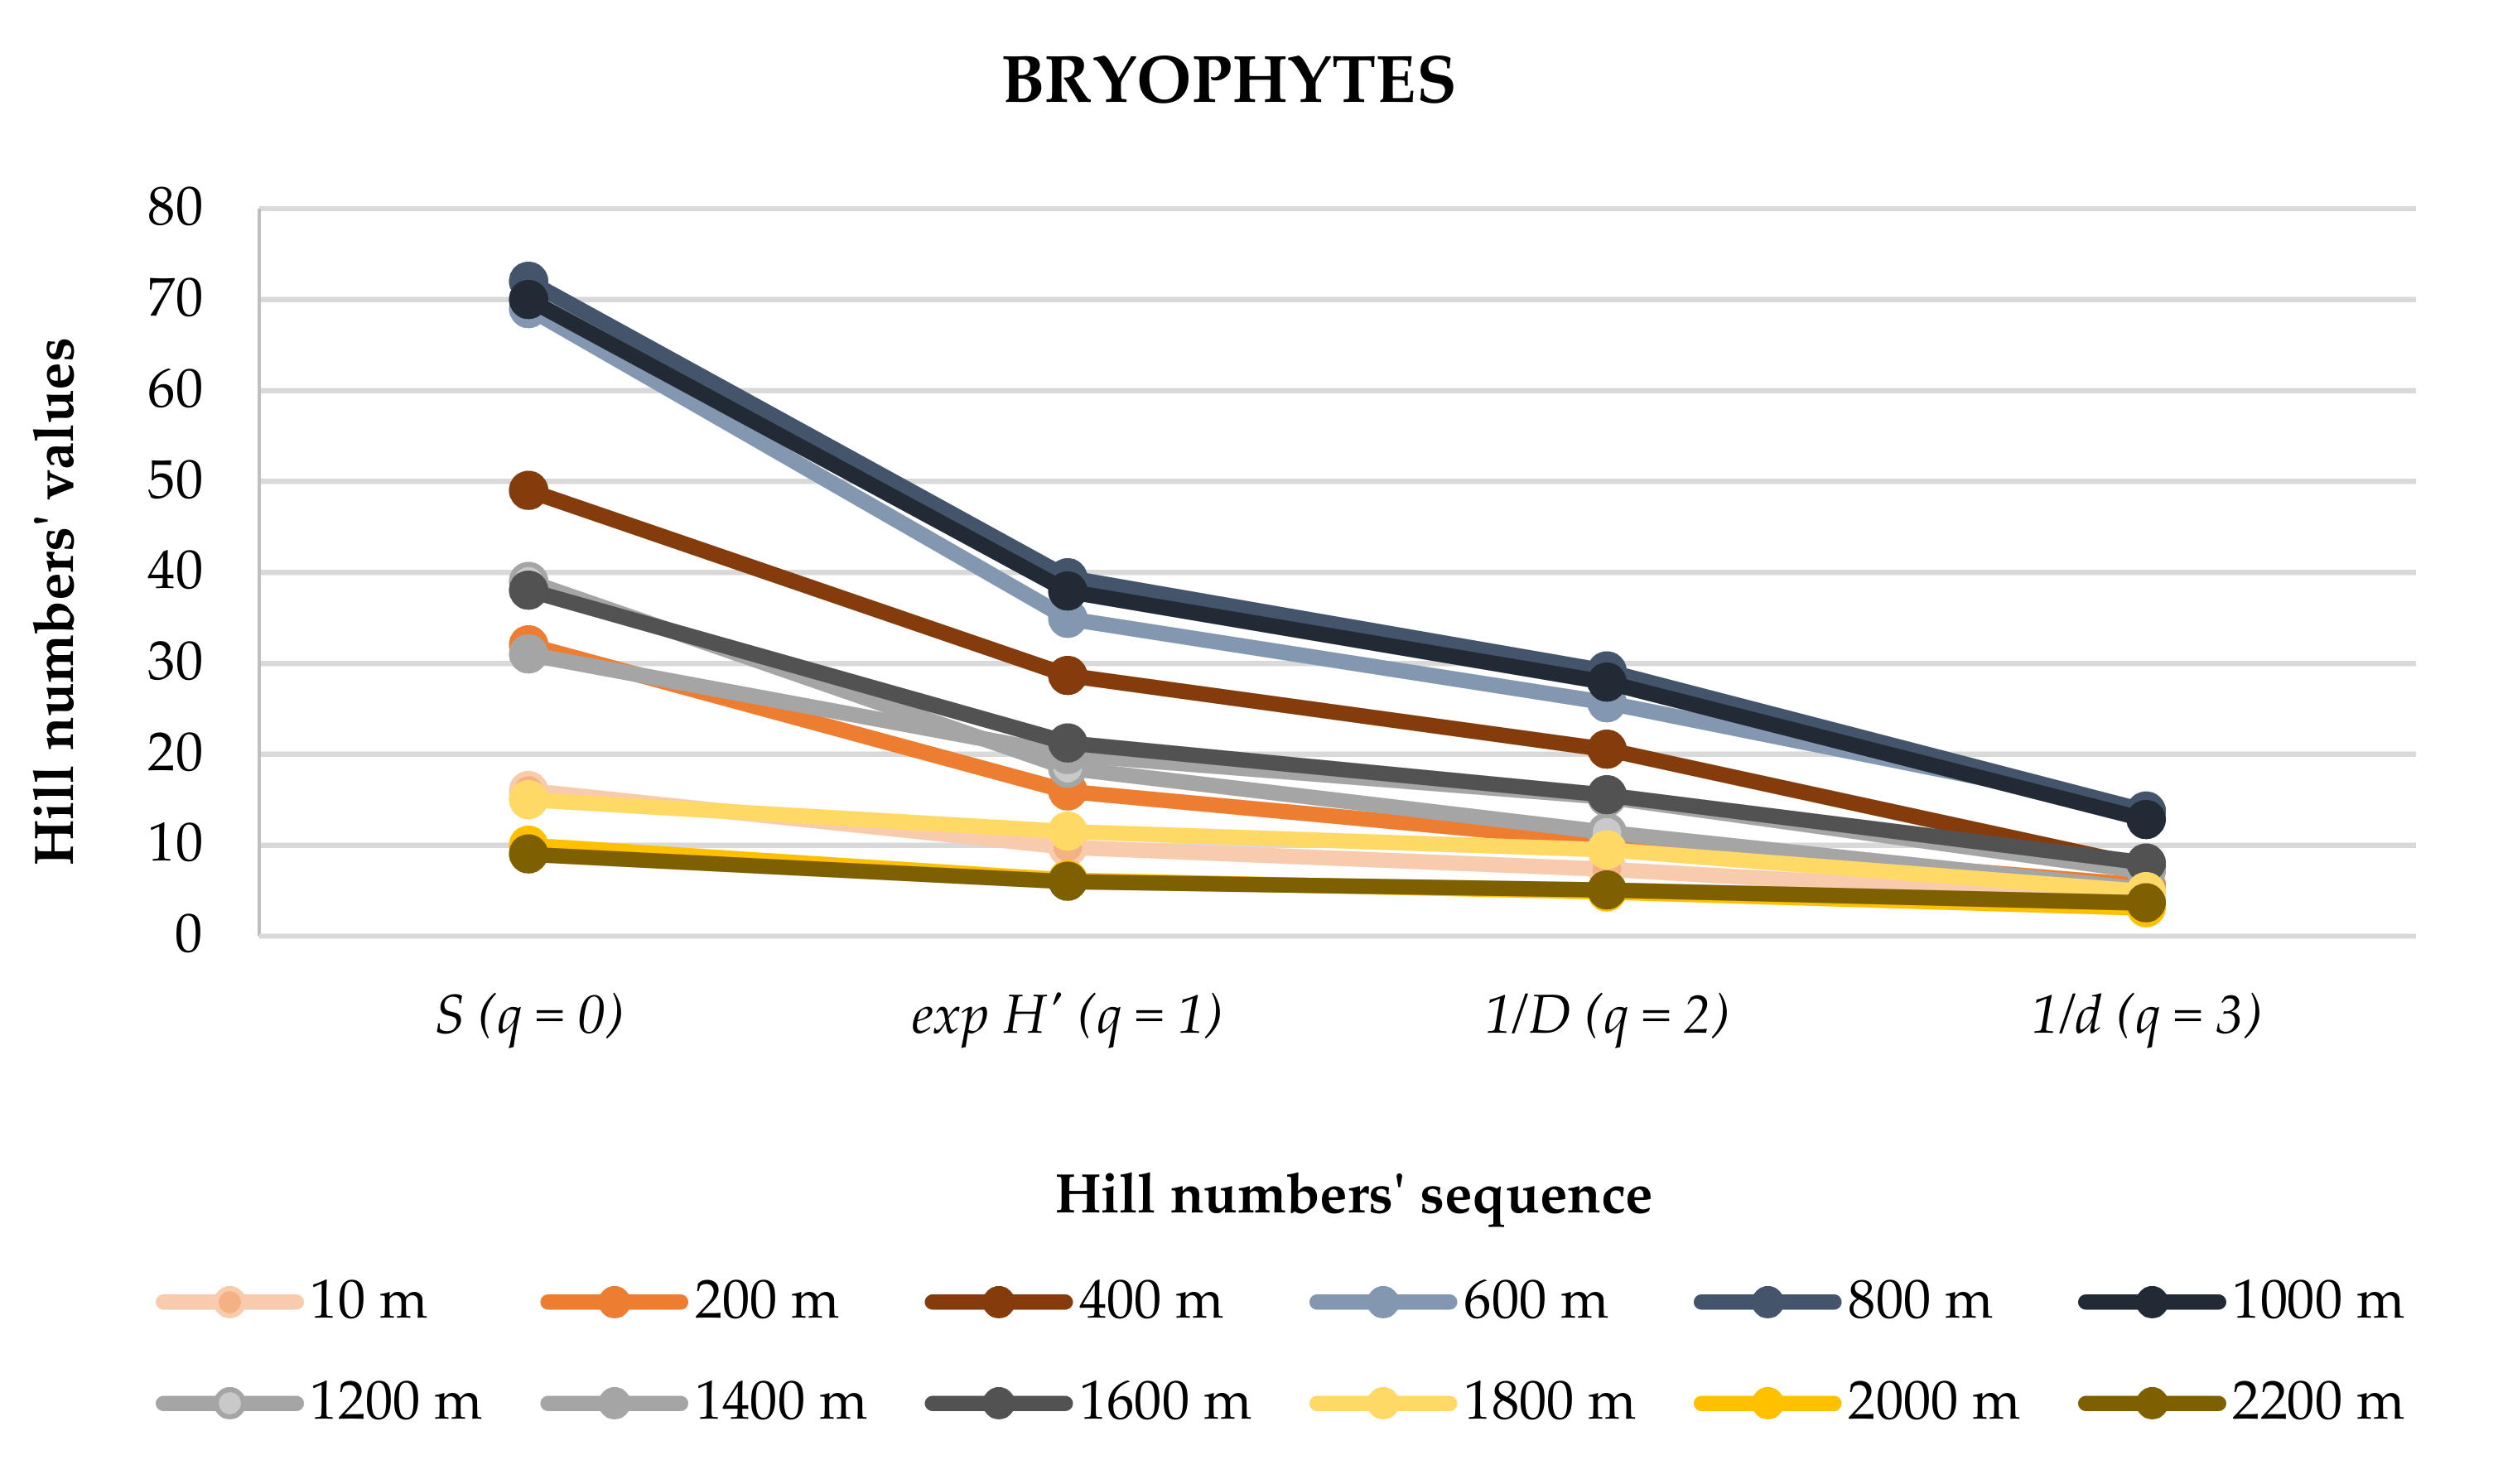
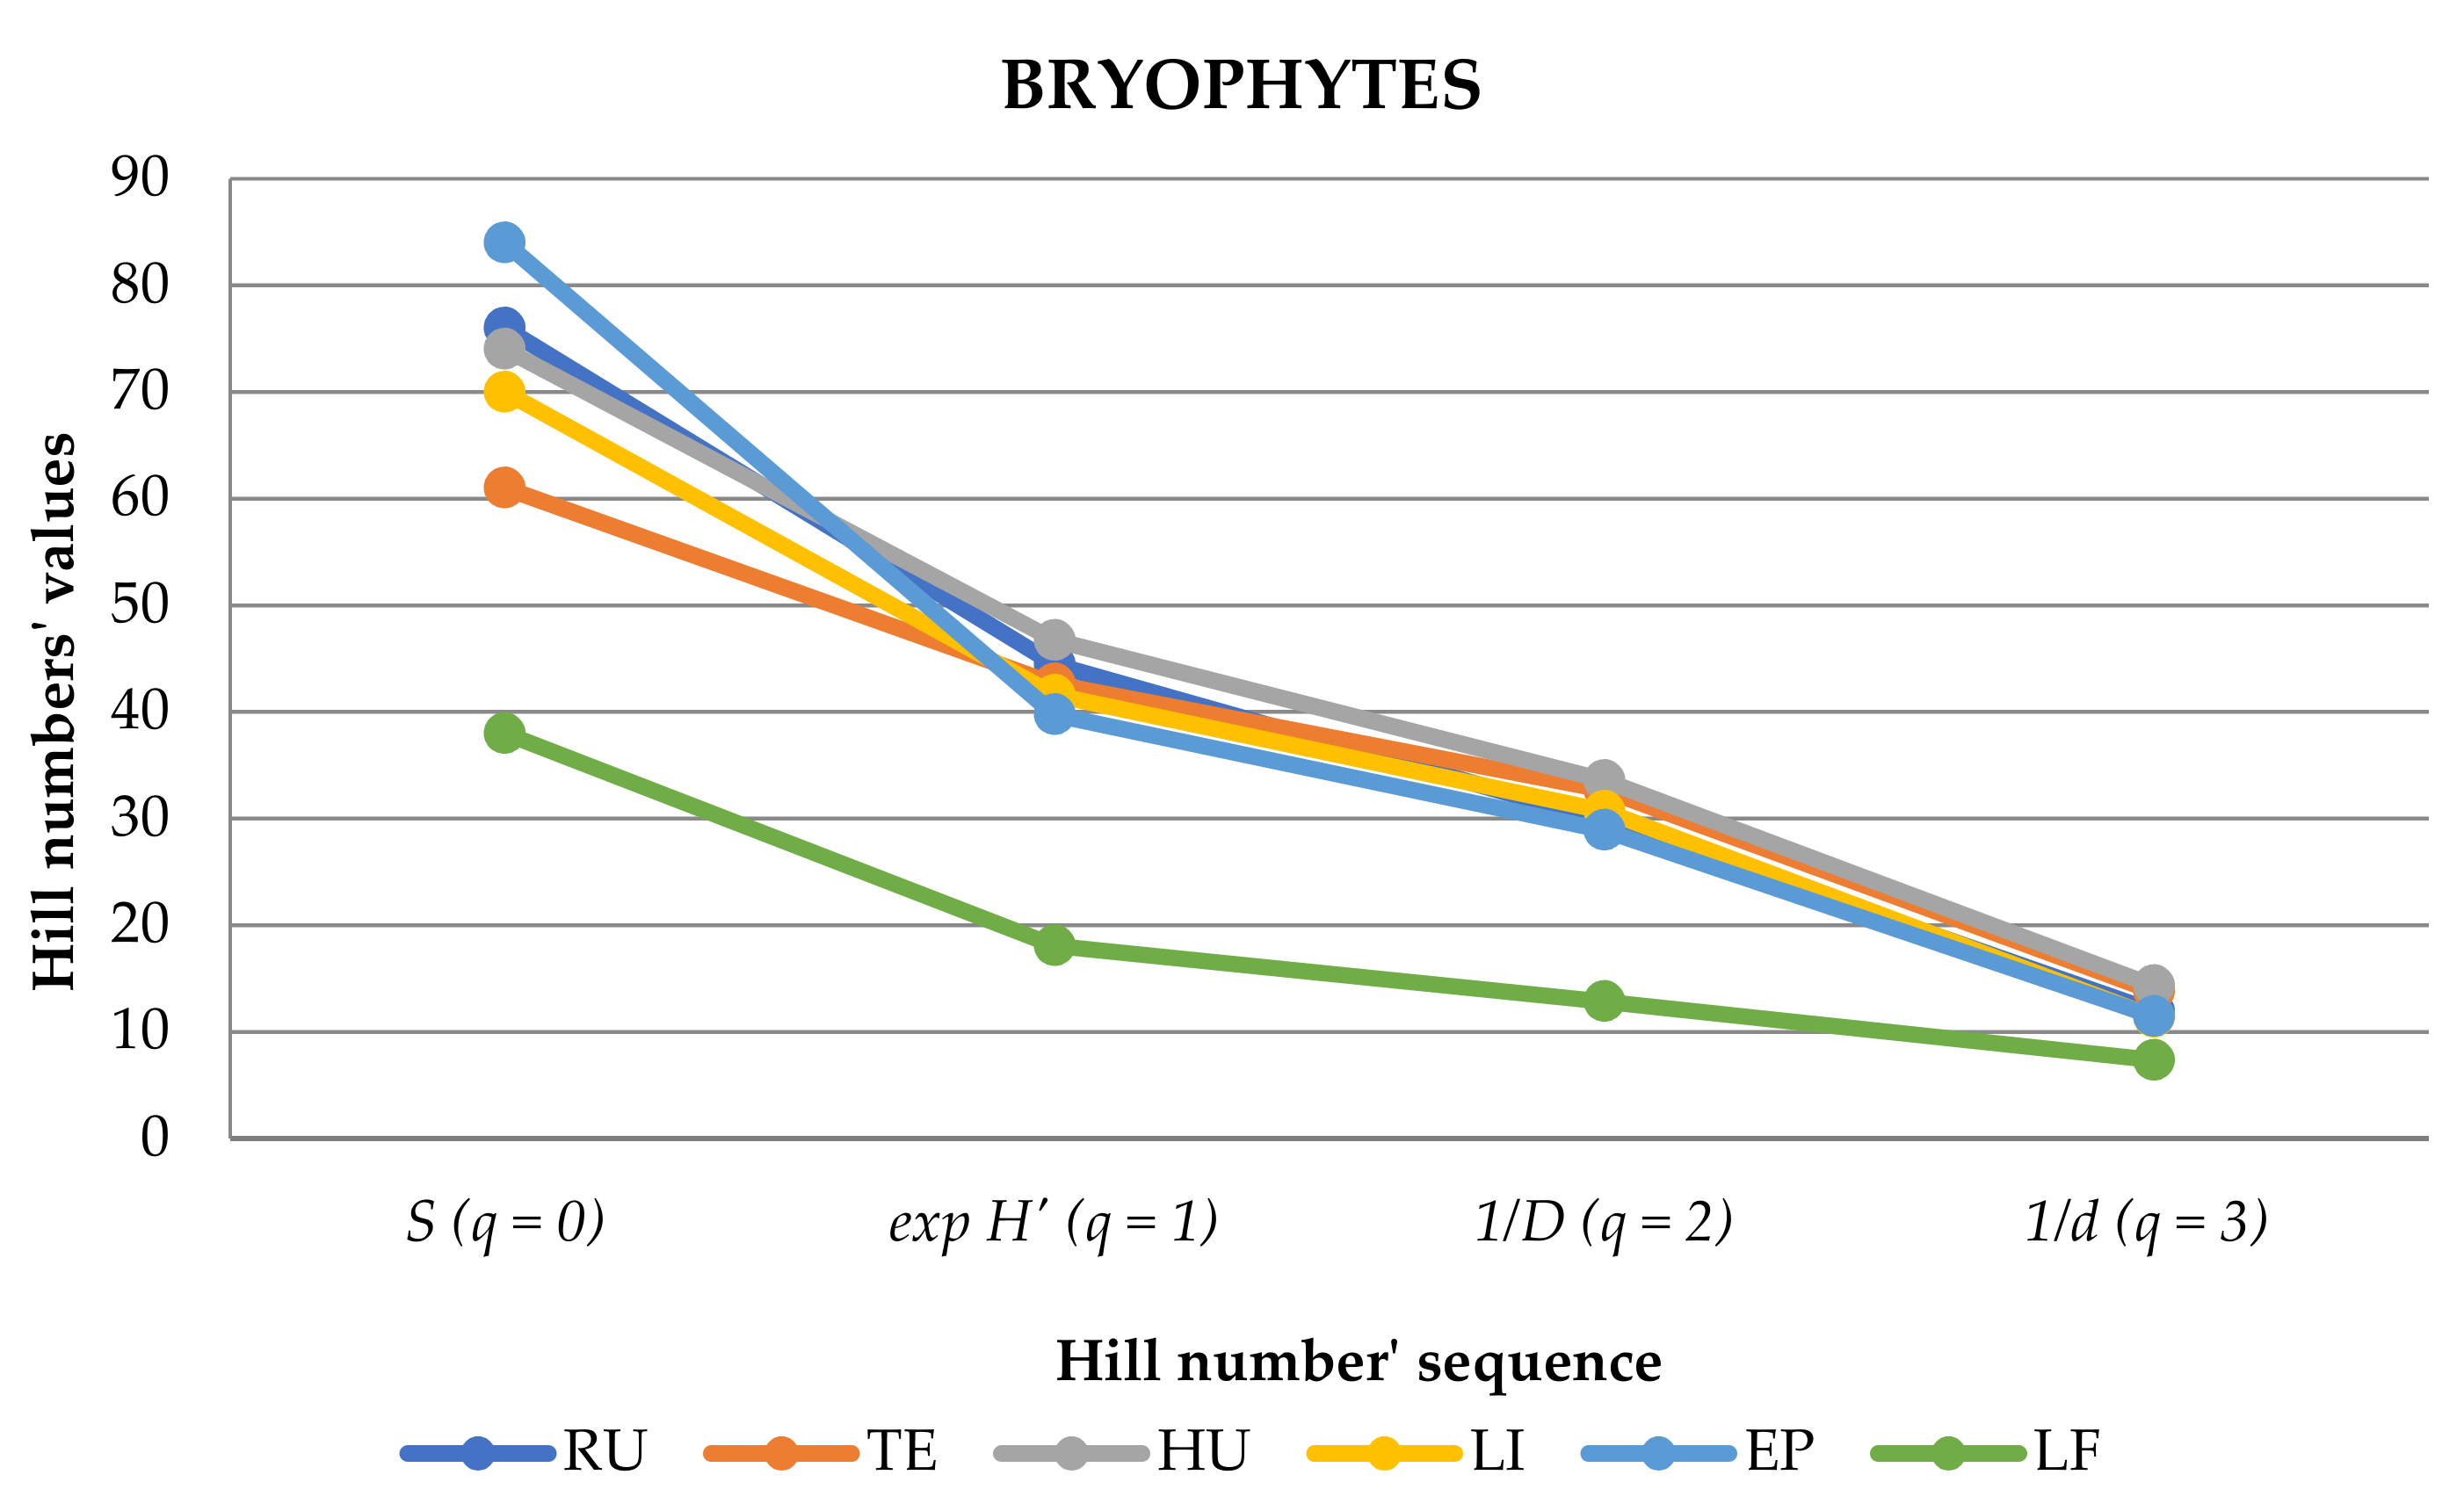
3.3. Species Diversity (Hill Numbers)

The Hill diversity numbers showed clear differences among different elevational sites (Table 2) and substrates (Table 3).
For bryophytes and liverworts, the band from 600–1000 m a.s.l. exhibited the highest diversity values and the lowest dominance, while mosses showed more comparable values across the 12 elevational sites (Table 2). Among liverworts, the richest sampled sites (S = 48–49) included almost two thirds of the total number of liverwort species recorded in the transect (Table 2). Among mosses, the highest diversity value was obtained at 1600 m a.s.l., a particularly rich site, harboring 35.7% of all moss species (S = 25). The lowest value of species richness (S = 7) was recorded at the summit of the mountain (2000–2200 m a.s.l.) (Table 2).
The results from comparing the Hill numbers’ profiles between elevation bands showed somewhat contrasting patterns. The richest sites (600–1000 m a.s.l.) also showed the greater decrease in the effective number of species due to the high dominance of some species (e.g., Radula aquilegia and Hypnum uncinulatum) and a large number of rare species. In contrast, particularly at the highest elevations, these numbers stayed more constant, revealing a high evenness (Figure 4).
The three ground substrates (rock, soil and humus) tended to exhibit the highest diversity and the lowest dominance values, although bryophytes collected on bark (EP) showed the highest richness of bryophyte species (S = 84) (Table 3).
This pattern was exhibited by mosses but not by liverworts, where tree dwelling species showed higher diversity values (Table 3). Lignicolous and epiphytic microplots were the richest sampled substrates (S = 47–51) (Table 3). By contrast, liverworts exhibited the lowest richness in soil (S = 29) while mosses showed the lowest richness on epiphyllous substrates (S = 6). For mosses, this low richness was reflected by the low values of the diversity indices (Table 3).
Regarding the Hill numbers profile, epiphytic bryophyte species stood out due to their highest overall number of species, dominance and proportion of rare species sharply contrasting with the epiphylls (LF), which exhibited the lowest effective number of species (Figure 5).
Mosses growing on rocks (RU) showed the highest effective number of species, while liverworts followed the general pattern presented in Figure 5.

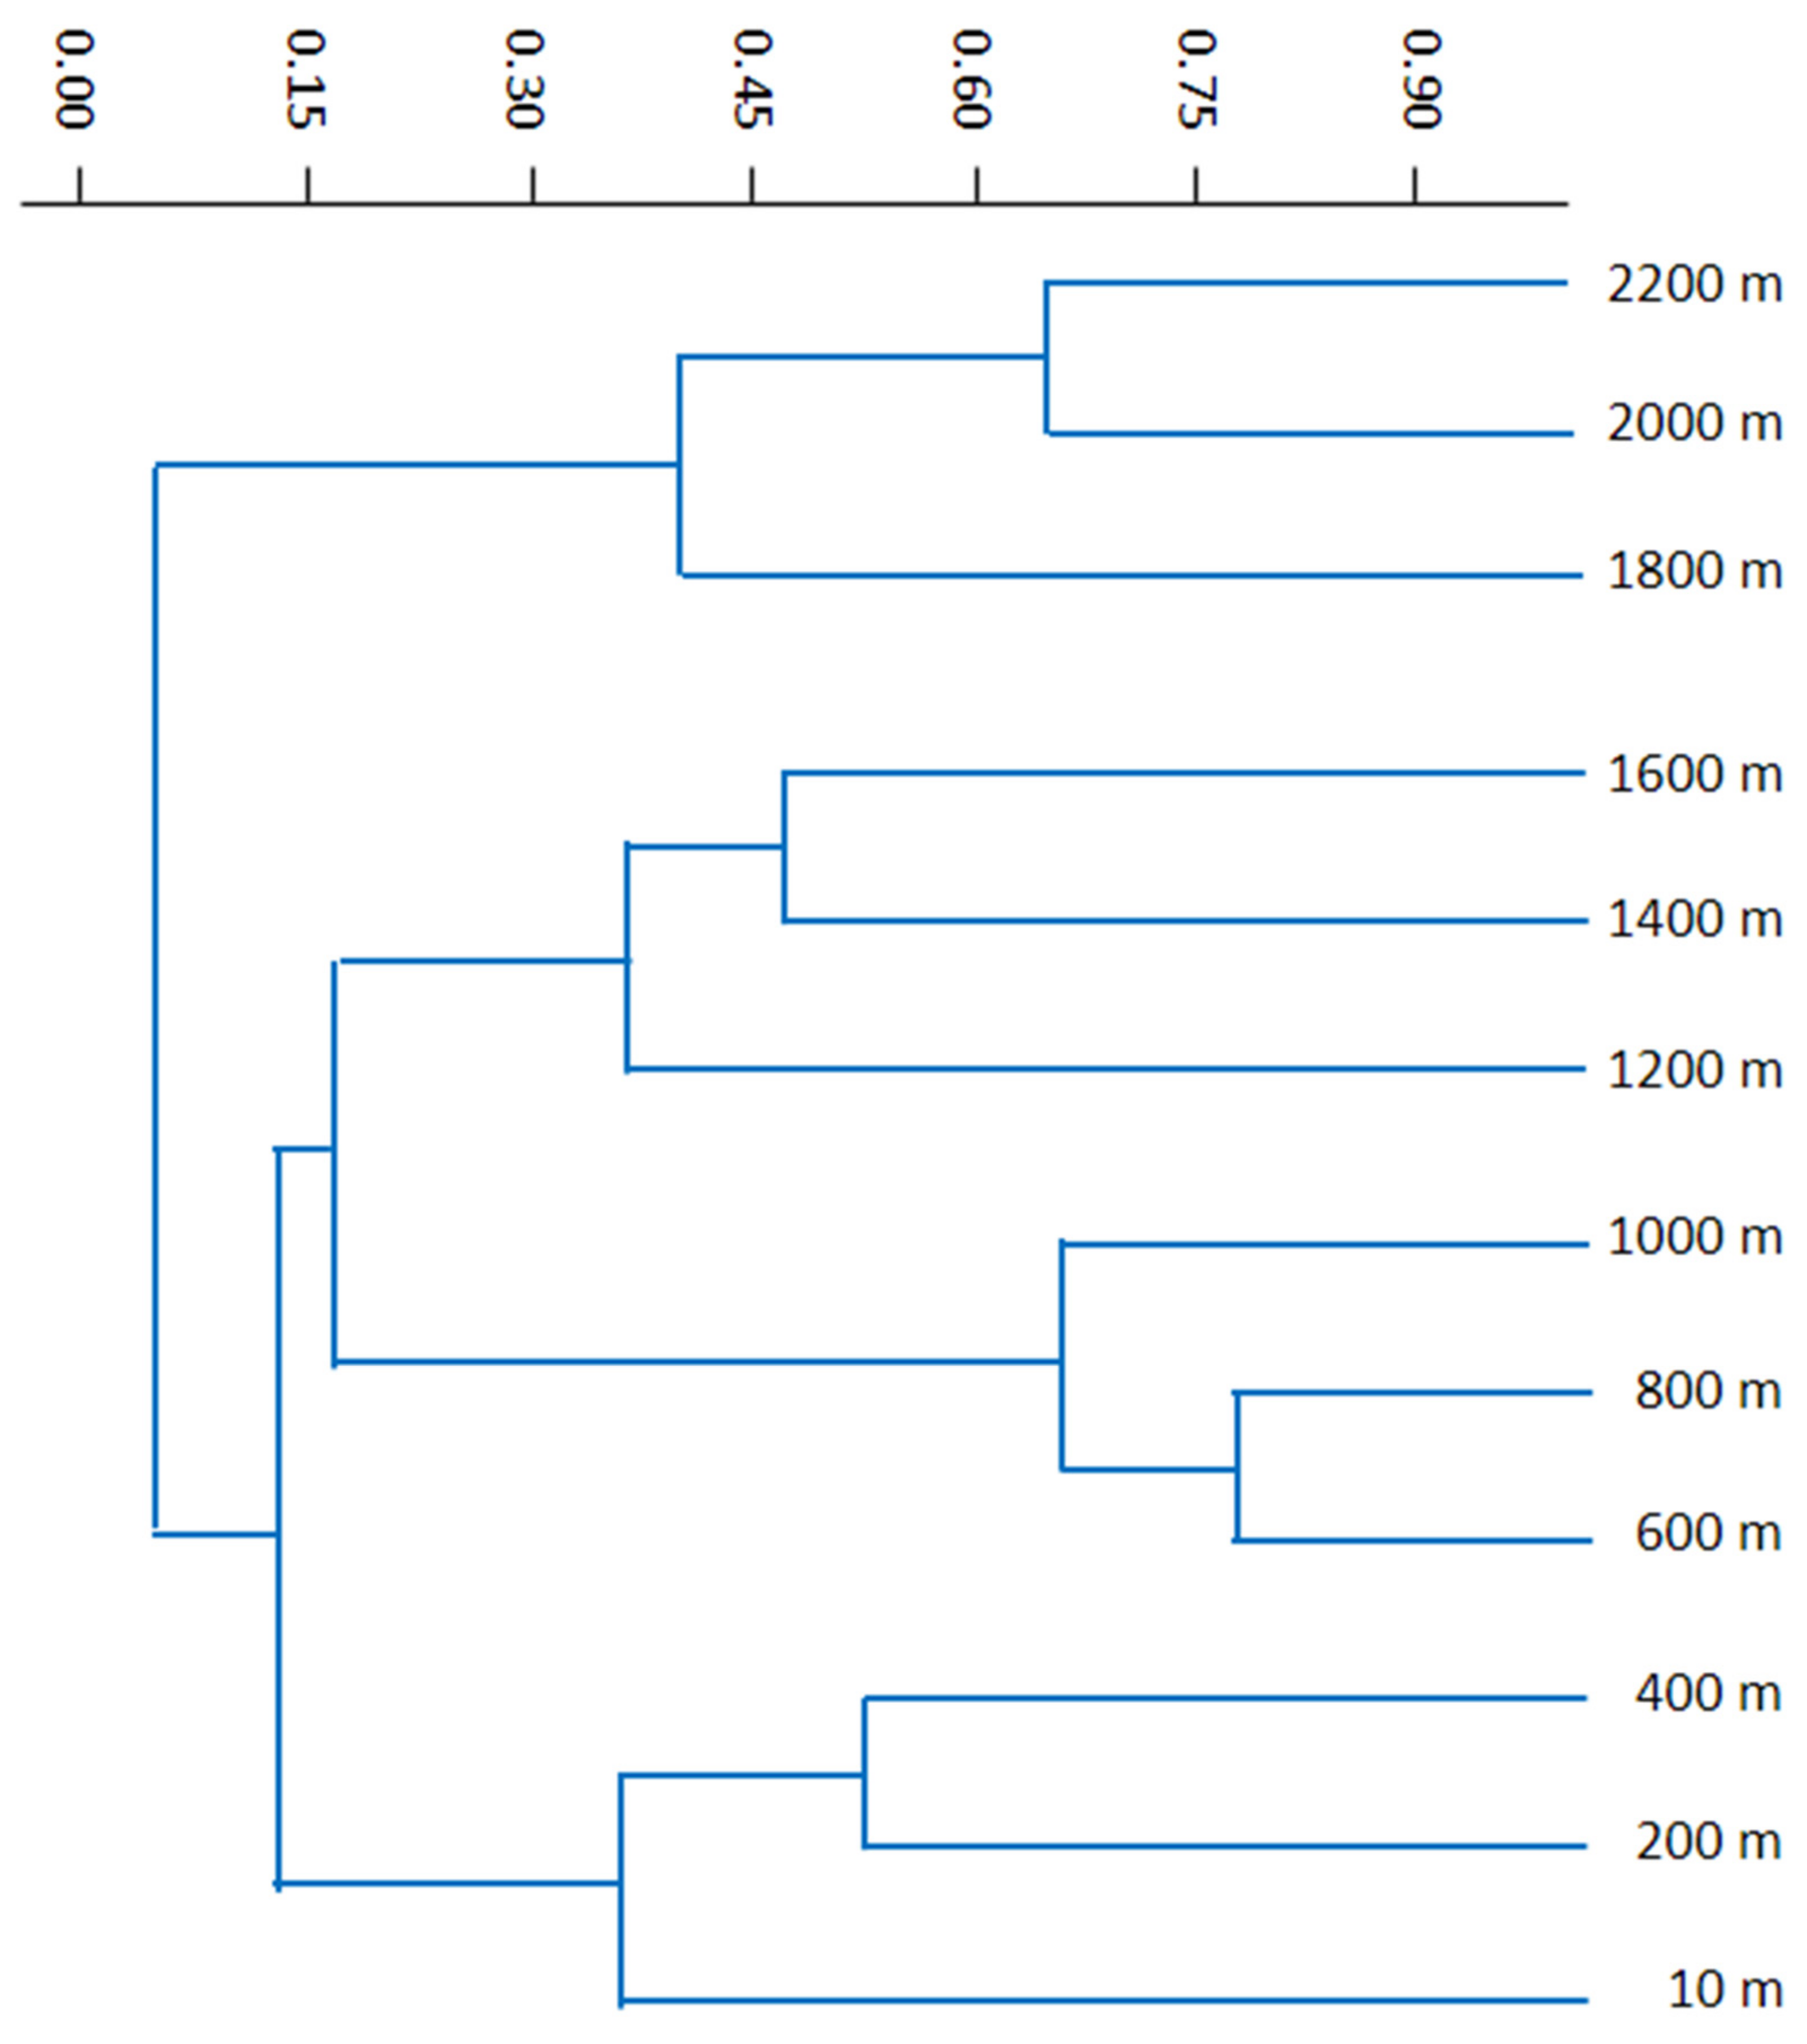
3.4. Similarities and Differences among Elevational Bands and Substrates

When using the unweighted pair group average algorithm (UPGMA), the bryophyte species composition among the 12 elevational bands were grouped in four clusters according to similarity (Figure 6).
The first group separated the microplots collected from the highest elevations (1800–2200 m a.s.l.), grouping the species growing on the most environmentally challenging habitat. Among the other three groupings, one aggregates the microplots from the lowest part of Pico Mountain (1200–1600 m a.s.l.), characterized by a scrub with some of the vascular plants found in the forests; a group encompassing the three sites placed within the richest, most dense and complex forest areas (600–1000 m a.s.l.), and, a fourth group including the sites found at the lowest elevations (10–400 m). A similar grouping was found for liverworts, while for mosses, the samples collected at 1200 m a.s.l. were combined with those collected from 600–1000 m a.s.l. (data not shown).
Table 4 presents the Sørensen’s similarity values among the four elevational bands exhibited by the cluster analysis (Figure 6). The highest similarity values (from 0.52 to 0.58) were found between the first (low) and second (middle) elevational bands, both for liverworts and mosses. Mosses also presented relatively high similarity values between the third (medium-high) and fourth (high) bands (SSI = 0.47), but the same was not true for the liverworts.
Table 5 presents the Sørensen’s similarity values among all the pairs of substrates found in this transect.
The Sørensen’s similarity values were rather high among liverworts (SSIs from 0.45 to 0.82), which did not happen among the substrates colonized by mosses (SSIs from 0.16 to 0.74). The mosses generally showed lower values of similarity between substrates than liverworts. Moss species showed a clear separation of the epiphyllous species (LF) from all other substrates, and moss ground dwellers (HU, RU, and TE) presented the highest SSI values, especially between humicolous and terricolous species (SSI = 0.74). Liverwort tree dwellers (EP, LF and LI) exhibited the highest SSI values, especially between epiphytic and lignicolous species (SSI = 0.82).

3.5. Substrate Specificity of Species

According to the Lloyd index of patchiness (LIP), less than a fifth of the species (n = 22, 11 liverworts and 11 mosses) expressed substrate specificity, with most of the occurrences (≥ 80%) taking place in a single substrate (LIP ≥ 3). Three liverwort species showed a preference toward epiphytic substrates (e.g., Radula carringtonii and R. holtii), while another three were most frequently found growing on the epiphyllous microhabitat (e.g., Colura calyptrifolia). Among mosses, five of the 11 were rupicolous (e.g., Fissidens viridulus and Tortella flavovirens) and two were lignicolous (e.g., Sematophyllum substrumulosum).

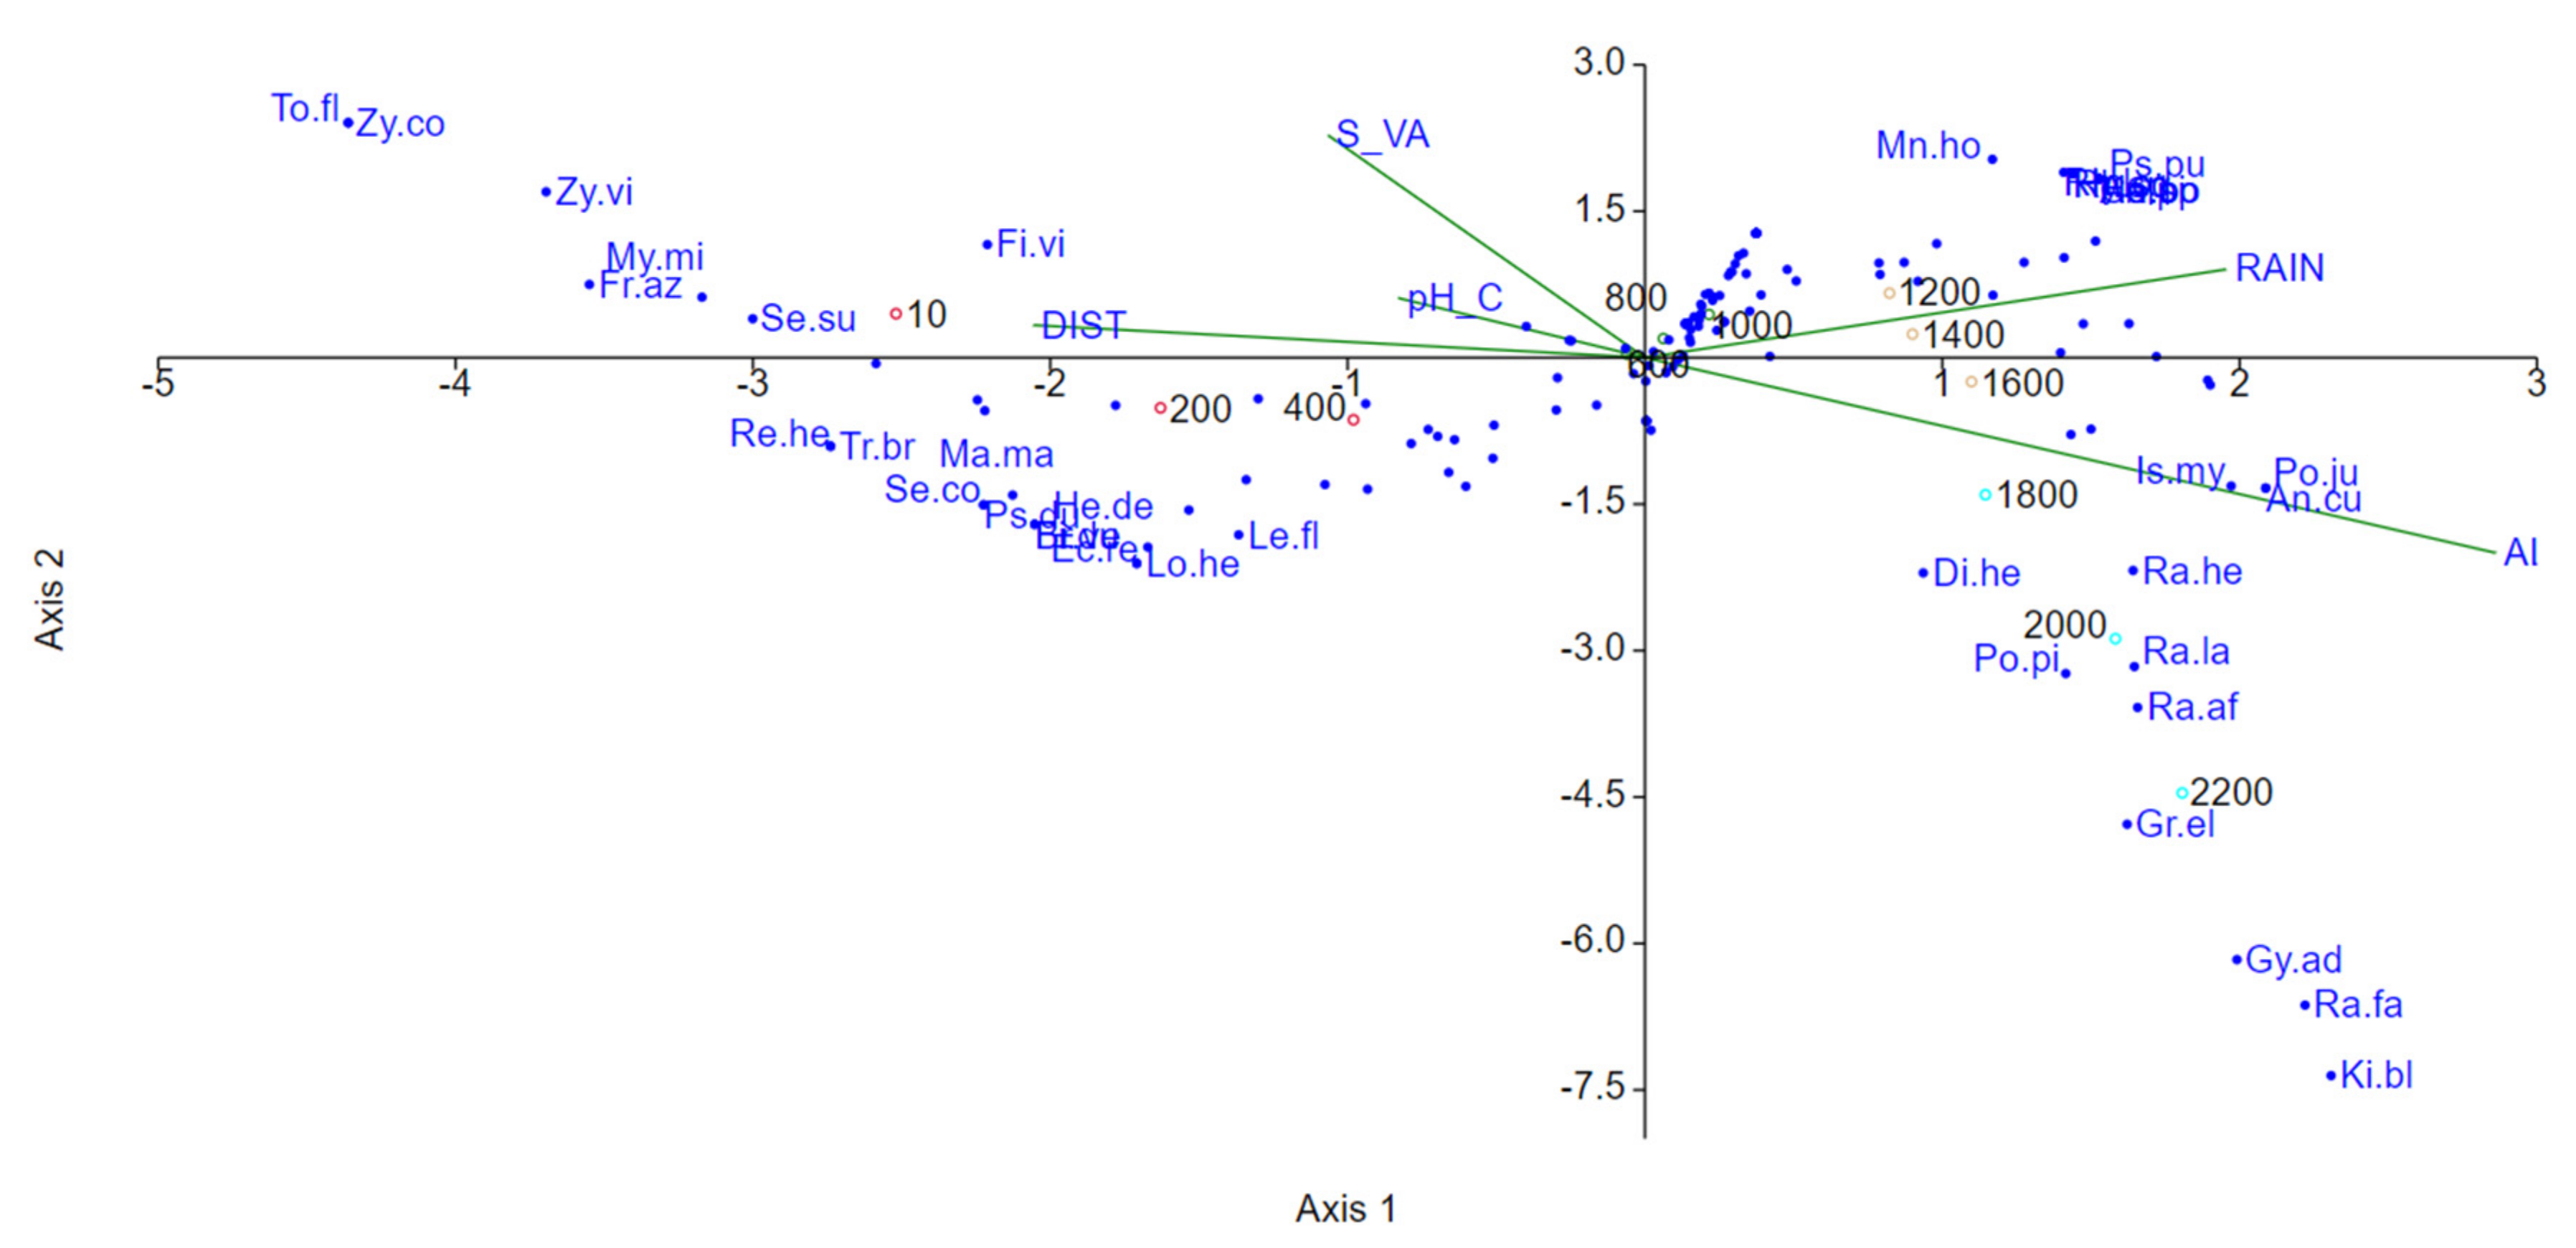
3.6. Ecological Factors Influencing Diversity Patterns

The canonical correspondence analysis (CCA) of all of the bryoflora dataset sampled on Pico Island (141 species), combined with the 12 sites and 5 explanatory variables, yielded five primary axes with eigen values of 0.587, 0.335, 0.205, 0.166 and 0.080. The first three axes explained 82.09% of the variation (42.75%, 24.41% and 14.93%) (Figure 7).
Bryophyte composition was highly correlated with elevation. Species such as Kiaeria blyttii, Gymnomytrium adustum and several species of the genus Racomitrium appeared only in the highest part of the elevation gradient, while Zygodon conoideus, Z. viridissimus or Frullania azorica appeared at the lowest elevations, where precipitation values were lower and the disturbance values were higher. Oceanic species were mostly found at the intersection of the two axes related to 600–1000 m elevations, which had the highest diversity of substrates and the richest and most complex vascular flora of the island.

4. Discussion

4.1. Bryophyte Diversity Patterns along Pico Island’ Elevational Transect (Alpha and Beta Diversity)

This study, which covered only a small area of Pico Island (12 sites × 2 plots × 100 m2), allowed the recognition of a large proportion of taxa (species and subspecies) identified both in the Azores (p = 141/480; 29.4%) and specifically on Pico Island, where the 141 taxa represented about half of all bryophytes known (p = 141/286; 49.3%) for liverworts (n = 71/121; 58.7%) and mosses (n = 70/161; 43.5%) [34]. None of the four hornwort taxa known from Pico [34] were recorded within the sampled microplots.
It is also worth mentioning that the sampling completeness values obtained from the 878 microplots for the set of all bryophytes and for the two divisions (liverworts and mosses) were generally very good, being above 75%, a common pattern in Macaronesia (e.g., [72,73]). This contrasts with the richest tropical systems, where high values of sampling completeness are often not reached [15,74]. For instance, Marline et al. [74], using the same methodology, could find up to 30 species per 50 cm2 and 225 species of bryophytes for the epiphytic microhabitat only, showing a higher diversity than the one reported on Pico Island. An exhaustive sampling of species could be hard to achieve in biodiversity hotspots for such a diverse group of plants [15].
The bryophytes’ richness distribution presented a parabolic, unimodal patterned (hump-shaped) relationship with the elevation, showing a peak of richness from 600–1000 m a.s.l. and a slight increase in richness at 1600 m. The second (much lower) peak was mainly due to the increase of the number of moss species, both for ground and tree dwellers. This site appeared to mark the transition to the upper montane landscape, since above it, there was a marked decrease of vegetation richness and stature. The separation of this new environment, roughly marked at 1500–1600 m a.s.l., was accepted by the generality of authors (cf. [42] for a revision), but only Dansereau [75] and Purvis et al. [76] have furthered the discrimination of different zones, probably because they also included cryptogams (lichens) in their analysis.
It is also important to notice the small contribution of the area of the fragments to the local species richness at each elevation (Figure 3b,c), which suggests that local environmental conditions are more important than area-constrained regional processes for bryophytes. Patchy vegetation can affect the diversity and distribution of organisms, especially for vascular plants or animals. Bryophytes, being dispersed by small diaspores, are not as affected by oceans or disturbed vegetations in their dispersion; the availability and presence of microhabitats may be the most important limiting factor of their installation. Within one vegetation belt, bryophytes may be more homogeneously distributed than other groups of plants or animals.
The hump-shaped pattern recorded on Pico Island is in accordance with several elevational studies with plants (revision by [77]), mostly with those that studied complete and long gradients. In fact, such a pattern was found for bryophytes along elevational gradients in several islands, such as La Réunion [15], Madagascar [78] and La Palma (Canary Islands) [73] and in the continental transects in Colombia [15,79,80]. In shorter gradients, such as the ones studied on Terceira Island (Azores; 40–1000 m a.s.l.) [72] and in the Piton de la Fournaise volcano (Réunion; 250–850 m a.s.l.) [81], the pattern reported was an increase in the bryophyte diversity with the elevation.
Comparing the shared elevations (from 10 m to 1000 m a.s.l.) and substrates, on Pico and Terceira [72], it was perceptible that the number of microplots and species was in the same order of magnitude for both Azorean islands. However, more terricolous (n = 73 vs. 26) and humicolous (n = 106 vs. 61) microplots were collected on the older island (Terceira). This is in accordance with the geologic matrix of the territory, since Pico is much younger than Terceira (oldest part: 0.27 vs. 3.52 MY) [39], and thus soil is not similarly evolved [82]. The closest number of microplots per substratum was observed from trees (epiphytes and epiphyllous), and indeed, this was the preferred substratum in many bryophyte studies (e.g., [15]) due to the potential diversity it conveys.
Along the 12 sites of the elevational transect on Pico Island, many species of bryophytes could be observed. However, the maximum richness was achieved at the middle of the gradient, where the most pristine vegetation could be assessed. In fact, liverworts predominated over mosses from 200 m to 1000 m a.s.l., with the highest richness (S, H’) and lowest dominance values (d) found from 600 m to 1000 m (a.s.l.). The high number of species and frequency is typical of hyper humid environments such as the Azorean forests all year round (e.g., [18,21]). Favorable climate conditions, mostly related to water availability (precipitation and relative humidity), are decisive for the effective colonization of bryophytes. However, the temperature presented better correlation values with the diversity of species found on Pico Island, possibly because once the water requirements are satisfied, milder temperatures favor the growth and establishment of species. This climate variable was already found to be extremely important in explaining the growth of some bryophytes [83].
Pico Island revealed higher diversity levels than Terceira Island, possibly due to the exceptionally well-preserved forests found from 600 m to 1000 m a.s.l., encompassing the most complex habitats surveyed in the transects. These are also optimal habitats for epiphyllous bryophytes, since other references for the Azores had mentioned 15 common epiphyllous species in the same zone [84]. However, as many as 37 species collected in this study were found colonizing the epiphyllous microhabitat. These results corroborate the findings of Sjögren [20] based on 30 years of studies in Azorean forests, where the presence of epiphyllous vegetation, mostly common in tropical rainforests, truly evidenced the high level of humidity typical of Azorean forests. Species growing on leaves and fronds should be carefully monitored because epiphyllous species may serve as good indicators of environmental changes, including climate change, due to their particular sensitivity to the relative humidity [85,86] and air pollution [87].

4.2. Bryophyte Substrate Specificity along the Elevational Transect

The hypothesis that bryophytes show reduced substrate affinities in the Azorean forests was proposed by Sjögren [21] and later confirmed by Gabriel and Bates [7] for native forests. However, this was the first time that it was tested for a longer elevational gradient. Regarding substrate specificity along the Pico Island transect, only a minority of species (n = 22; 15.3%) showed substrate specificity according to the Lloyd index of patchiness. Sjögren [20,22] also observed a minimum specialization of bryophytes per particular substrate in the Azores, assuming that the species recorded on only one type of substrate were just a few, contrary to what happens in continental Europe. This may well be related to the optimal habitat and environmental conditions in the Azores (high humidity and mild temperature). Only the epiphyllous liverwort Colura calyptrifolia was considered a specialist in the three studies (cf. [7,20]), which also indicates the heterogeneity of conditions where bryophytes may grow in the Azores. Moreover, the moss Hypnum uncinulatum is considered typical of hard rock in Great Britain according to BRYOATT [88], while in this study, it was recorded on all six substrates, preferably as epiphyte. Something similar happens with Myurium hochstetteri and other species.
This lack of specialization was also reflected in the high similarity values among the different substrates, especially for liverworts, which appeared to be able to colonize a wide range of substrate conditions in different substrates and elevations in Pico Island. This may be related to the mild climate, lack of pollution and to the physiological characteristics that appear to confer these plants a high tolerance to desiccation, as suggested by transplant experiments of Bazzania azorica and Lepidozia cupressina to different elevations [83].

4.3. Bryophyte vs. Vascular Plants

In the present study, the highest diversity of bryophytes species corresponded to the belts at 600–1000 m a.s.l., which coincided with the richest sites for vascular plants [42], representing the Laurus submontane forest [41]. These sites were also the richest in endemic species, either from the Azores or Macaronesia [71]. This peak of richness may be partially explained by the presence of tall and wide trees, which add complexity to the vegetation structure, providing more suitable habitats for bryophyte colonization. This is different from the conclusions of other studies in different climate conditions, where the richness of vascular plant species had a negative correlation with that of bryophytes (e.g., Australia [89]).
However, it was not only at the middle elevations that the presence of bryophytes showed to be strongly correlated with the distribution of vascular plants. Remarkable similarities were observed in the clusters obtained with vascular plant species and bryophytes. Both groups responded similarly to elevation- and climate-associated variables. Many plant species favor high levels of precipitation, high relative humidity and lower evaporation rates (e.g., [17,83,90]). Besides that, bryophytes can colonize all types of substrates, including bare rocks and the living leaves of taller trees, two quite impermeable substrates where communities are only able to thrive if the climate values compensate for that shortcoming. Reinforcing this idea, liverworts were more abundant between 600 m and 1000 m a.s.l., showing lower dominance for any given species (e.g., Berger–Parker dominance index). On the other hand, the dominance of some moss species along the elevational transect was more obvious at the limits of the gradient, mainly at the mountaintop.

4.4. Rare Species: Uniques and Duplicates

Rare species such as Echinodium renauldii and Antitrichia curtipendula were found in the field work on Pico Island. In fact, a few shoots of the pleurocarpous endemic moss E. renauldii were found at 400 m at the Fetais, Piedade site, mostly growing in the soil but also as an epiphytic on Laurus azorica [71]. This species has been found between 75 m and 1250 m but preferentially around 425 m [84,91,92], mostly in very sheltered habitats like deeply shaded ravines and craters [20]. It is considered endangered by the International Union for Conservation of Nature (IUCN) [92], mainly due to climate change and land cover changes threatening endemic Macaronesian bryophytes (e.g., [37,93,94]).
The finding of the moss Antitrichia curtipendula was also relevant for the archipelago [69]. Growing as an epiphyte on Erica azorica at 1600 m, this large moss was already known from Macaronesia on both the Canary Islands and the Madeira archipelago but not yet in the Azores [70]. This species is on the red list of several European countries, such as in Ireland and Slovakia (near threatened); Germany (vulnerable); and the Netherlands, Poland and Hungary (endangered) [53].
Besides providing information on rare and endemic species, one striking feature of this study was the improvement of the knowledge of the distribution of some common species found in relatively unknown locations of Pico Island (especially at lower elevations). This information, soon to be added to the Azores Biodiversity Portal [95], will be important in modeling the present and future distribution of bryophytes, thereby allowing more security in the predictions and scenarios. Common species are of extreme importance in the ecosystems, since they shape the world and are largely responsible for all the functions performed by the ecosystems (e.g., [96,97]), while rare species behave as sentinels for future environmental changes (e.g., [98]). Following the MOVECLIM studies, the Atlantis database [95] is now more complete regarding bryoflora of the Azores archipelago, both for common and rare species. Moreover, much ecological information on the species (e.g., elevational range, pH and fructification) was also collected for a considerable number of species occurring in the Azores.
Finally, it is remarkable that in such small sampling units (microplots with only 50 cm2) it was possible to record a maximum of 22 bryophyte species. This evidences the richness and uniqueness of the Azorean vegetation, corroborating the present complexity and importance of the existing forests, probably due to a set of favorable conditions: a temperate climate, high level of humidity and the purity of the air [83,99].

5. Conclusions

The standardized elevational approach used in this study, analyzing only a minimum fraction of the available area of the island (2400 m2), resulted in a list of almost half (n = 141; 49.3%) of the species present on Pico Island. The middle elevations and the mountain were rather well studied, but the lower elevations (up to 400 m a.s.l.) were almost unknown in the bryological literature, and this study greatly increased the information on the richness of that part of the island.
Concerning the original research questions, it is possible to conclude the following: (1) The wide range of climatic and geographic conditions along Pico Island’s elevational gradient (from sea level to the mountain summit) provides a wealth of different habitats for bryophyte colonization (e.g., high montane areas). In this first study of its complete elevational transect, it was possible to identify and characterize the bryophyte diversity growing in six different substrates. Bryophyte richness followed a parabolic unimodal pattern, with a peak just below the middle of the gradient (600–1000 m a.s.l.). This peak evidences the importance of the mature evergreen forest of Pico Island, mostly composed of indigenous vegetation [42], hosting luxuriant and diverse bryophyte communities. (2) The diversity and distribution of bryophytes seem to be mostly driven by factors such as elevation (highly correlated with temperature), vascular plant richness and precipitation, reinforcing the role of regional processes associated with elevation also found on other islands (e.g., [66]). (3) Very few bryophyte species showed substrate specificity, confirming the trends found in previous studies in the Azores [7,66], while some species exhibited a much wider substrate occurrence than in other European regions [88].
Further studies with historical (e.g., substrate age and landscape change) and spatial (e.g., land use changes) approaches may contribute to better understanding of the mechanisms that shape the richness trends and species assemblages of the bryophytes from Pico Island to best preserve these ecosystems.

Author Contributions

Conceptualization, M.C.M.C., R.G. and C.A.-P.; methodology, M.C.M.C., R.G., P.A.V.B. and C.A.-P.; validation, M.C.M.C., R.G. and H.H.; formal analysis, M.C.M.C.; investigation, M.C.M.C.; data curation, M.C.M.C. and R.G.; writing—original draft preparation, M.C.M.C.; writing—review and editing, M.C.M.C., R.G., P.A.V.B., H.H. and C.A.-P.; supervision, R.G., and C.A.-P.; project administration, R.G. and C.A.-P.; funding acquisition, C.A.-P. as principal investigator. All authors have read and agreed to the published version of the manuscript.

Funding

This research was funded by ERANET BIOME MOVECLIM ‘Montane vegetation as listening posts for climate change’ of the regional government of the Azores, grant number M2.1.2/F/04/2011/NET, and M.C.M.C. was funded by the FUNDO REGIONAL PARA A CIÊNCIA E TECNOLOGIA (FRCT) of the regional government of the Azores, grant number M3.1.2/F/007/2012.

Institutional Review Board Statement

Not applicable.

Informed Consent Statement

Not applicable.

Data Availability Statement

The data presented in this study are available on request from the corresponding author.

Acknowledgments

We gratefully acknowledge the help provided by Fernando Pereira and Débora S.G. Henriques during the field collections; Cecília Sérgio (LISU, University of Lisbon) and Manuela Sim-Sim (Faculty of Sciences, University of Lisbon) for controlling of some the difficult taxa; João Filipe Fernandes for helping with the calculation of the fragments’ area; Enésima Pereira and Luís Barcelos for technical support with Figure 1; the Director of the Natural Park of Pico Island Paulino Costa for his cooperation with this project; and three anonymous reviewers for their helpful comments.

Conflicts of Interest

The authors declare no conflict of interest.

Appendix A

Table A1. List of the bryophytes found on Pico Island during the NETBIOME expedition (September 2012) across the elevational transect. Authorities followed Hodgetts et al. [53] (D = division; Abrev. = abbreviation).
DSpeciesAbrev.10 m200 m400 m600 m800 m1000 m1200 m1400 m1600 m1800 m2000 m2200 m
Bryophyta
Alophosia azorica (Renauld and Cardot) CardotAl.az 3 1 1 5
Andoa berthelotiana (Mont.) OchyraAn.be 1123321431 4
Antitrichia curtipendula (Hedw.) Brid.An.cu 15
Brachytheciastrum velutinum (Hedw.) Ignatov and HuttunenBr.ve 12
Brachythecium mildeanum (Schimp.) Schimp.Br.mi 14 1
Campylopus flexuosus (Hedw.) Brid.Ca.fl 12371 1
Campylopus fragilis (Brid.) Bruch and Schimp.Ca.fr 113
Campylopus pilifer Brid.Ca.pi 4 1
Campylopus pyriformis (Schultz) Brid.Ca.py 22121
Campylopus shawii WilsonCa.sh 11
Cyclodictyon laetevirens (Hook. and Taylor) Mitt.Cy.la 7
Daltonia lindigiana HampeDa.li 42
Dicranella heteromalla (Hedw.) Schimp.Di.he 1
Dicranum flagellare Hedw.Di.fl 2
Dicranum scottianum TurnerDi.sc 117263423 1
Diphyscium foliosum (Hedw.) D.MohrDi.fo 1 111
Ditrichum subulatum HampeDi.su 1 1
Echinodium renauldii (Cardot) Broth.Ec.re 9
Fissidens bryoides Hedw.Fi.br 2 1
Fissidens dubius P. Beauv.Fi.du 12
Fissidens serrulatus Brid.Fi.se 41 9
Fissidens taxifolius Hedw.Fi.ta 7182 1 11
Fissidens viridulus (Sw.) Wahlenb.Fi.vi4 2
Grimmia elongata Kaulf.Gr.el 11
Heterocladium heteropterum (Brid.) Schimp.He.he 1
Heterocladium wulfsbergii I. HagenHe.wu 81 2
Hylocomium splendens (Hedw.) Schimp.Hy.sp 258
Hymenoloma crispulum (Hedw.) OchyraHy.cr 23
Hypnum cupressiforme Hedw.Hy.cu 164948
Hypnum uncinulatum Jur.Hy.un381781756553812
Isothecium interludens Stirt.Is.in1 2 4202
Isothecium myosuroides Brid.Is.my 184
Isothecium prolixum (Mitt.) M. Stech, Sim-Sim, Tangney and D. QuandtIs.pr 1329348 12
Kiaeria blyttii (Bruch and Schimp.) Broth.Ki.bl 4
Leucobryum glaucum (Hedw.) Ångstr.Le.gl 31 2
Leucobryum juniperoideum (Brid.) Müll. Hal.Le.ju 41 1
Mnium hornum Hedw.Mn.ho 1
Myurium hochstetteri (Schimp.) Kindb.My.ho 4362827122
Plagiomnium undulatum (Hedw.) T.J. Kop.Pl.un 4
Polytrichum commune Hedw.Po.co 12127
Polytrichum formosum Hedw.Po.fo 1 2
Polytrichum juniperinum Hedw.Po.ju 1
Polytrichum piliferum Hedw.Po.pi 1 395
Pseudorhynchostegiella duriaei (Mont.) Ignatov and Vanderp.Ps.du 11
Pseudoscleropodium purum (Hedw.) M. Fleisch.Ps.pu 4
Pseudotaxiphyllum laetevirens (Dixon and Luisier ex F. Koppe and Düll) HedenäsPs.la1 137 2
Ptychostomum torquescens (Bruch and Schimp.) Ros and MazimpakaPt.to 21 2
Racomitrium affine (F. Weber and D. Mohr) Lindb.Ra.af 27101820
Racomitrium fasciculare (Hedw.) Brid.Ra.fa 1 12
Racomitrium heterostichum (Hedw.) Brid.Ra.he 1 1 1
Racomitrium lanuginosum (Hedw.) Brid.Ra.la 55351419
Rhynchostegiella curviseta (Brid.) Limpr.Rh.cu9861 2
Rhynchostegium confertum (Dicks.) Schimp.Rh.co 1
Rhytidiadelphus loreus (Hedw.) Warnst.Rh.lo 21
Rhytidiadelphus squarrosus (Hedw.) Warnst.Rh.sq 31
Sciuro-hypnum plumosum (Hedw.) Ignatov and HuttunenSc.pl 1
Sematophyllum substrumulosum (Hampe) E. BrittonSe.su983 2
Serpoleskea confervoides (Brid.) Schimp.Se.co 22
Sphagnum palustre L.Sp.pa 2
Tetrastichium fontanum (Mitt.) CardotTe.fo 1015
Tetrastichium virens (Cardot) S.P. ChurchillTe.vi 20124
Thamnobryum alopecurum (Hedw.) GanguleeTh.al 3
Thamnobryum maderense (Kindb.) HedenäsTh.ma 1613
Thuidium tamariscinum (Hedw.) Schimp.Th.ta 575122313
Tortella flavovirens (Bruch) Broth.To.fl15
Trichostomum brachydontium BruchTr.br 5
Ulota calvescens WilsonUl.ca 1 2
Ulota crispa (Hedw.) Brid.Ul.cr 15 28
Zygodon conoideus (Dicks.) Hook. and TaylorZy.co1
Zygodon viridissimus (Dicks.) Brid.Zy.vi71 1
Marchantiophyta
Aneura pinguis (L.) Dumort.An.pi 2
Bazzania azorica H. Buch and Perss.Ba.az 3232
Blepharostoma trichophyllum (L.) Dumort.Bl.tr 13
Calypogeia arguta Nees and Mont.Ca.ar 11 12 1
Calypogeia azorica Bischl.Ca.az 1
Calypogeia fissa (L.) RaddiCa.fi 81226112813
Calypogeia muelleriana (Schiffn.) Müll. Frib.Ca.mu 129
Calypogeia sphagnicola (Arnell and J. Perss.) Warnst. and LoeskeCa.sp 1
Cephalozia bicuspidata (L.) Dumort.Ce.bi 2 63
Cheilolejeunea cedercreutzii (H. Buch and Perss.) GrolleCh.ce 4522
Cololejeunea azorica V. Allorge and Jovet-AstCo.az 1
Cololejeunea microscopica (Taylor) Schiffn.Co.mi 5394759 1
Cololejeunea sintenisii (Steph.) PócsCo.si 9131
Colura calyptrifolia (Hook.) Dumort.Co.ca 58815 1
Diplophyllum albicans (L.) Dumort.Di.al 1 11201665
Drepanolejeunea hamatifolia (Hook.) Schiffn.Dr.ha 153314312
Frullania acicularis Hentschel and von KonratFr.ac 4448472171
Frullania azorica Sim-Sim, Sérgio, Mues and KrautFr.az11
Frullania microphylla (Gottsche) PearsonFr.mi243929204
Frullania tamarisci (L.) Dumort.Fr.ta2816513081912115
Frullania teneriffae (F. Weber) NeesFr.te 262848669242
Fuscocephaloziopsis crassifolia (Lindenb. and Gottsche) Váňa and L. Söderstr.Fu.cr 71014 12
Geocalyx graveolens (Schrad.) NeesGe.gr 1
Gymnomitrion adustum NeesGy.ad 310
Harpalejeunea molleri (Steph.) GrolleHa.mo 836144
Herbertus azoricus (Steph.) P.W. RichardsHe.az 2
Herbertus borealis Crundw.He.bo 1
Heteroscyphus denticulatus (Mitt.) Schiffn.He.de 120 1
Jubula hutchinsiae (Hook.) Dumort.Ju.hu 81512
Lejeunea eckloniana Lindenb.Le.ec 5 1
Lejeunea flava (Sw.) NeesLe.fl 41
Lejeunea hibernica Bischl., H.A. Mill. and Bonner ex GrolleLe.hi 2 14
Lejeunea lamacerina (Steph.) Schiffn.Le.la153560755920
Lejeunea patens Lindb.Le.pa 1104
Lepidozia cupressina (Sw.) Lindenb.Le.cu 91825
Lepidozia reptans (L.) Dumort.Le.re 192
Leptoscyphus porphyrius (Nees) GrolleLe.po 7833
Lophocolea coadunata (Sw.) Mont.Lo.co 324
Lophocolea fragrans (Moris and De Not.) Gottsche, Lindenb. and NeesLo.fr 1289253
Lophocolea heterophylla (Schrad.) Dumort.Lo.he 1
Marchantia polymorpha L.Ma.po 1
Marchesinia mackaii (Hook.) GrayMa.ma 33284
Marsupella sparsifolia (Lindb.) Dumort.Ma.sp 541131
Metzgeria furcata (L.) CordaMe.fu 222589162
Mnioloma fuscum (Lehm.) R.M. Schust.Mn.fu 132921
Myriocoleopsis minutissima (Sm.) R.L. Zhu, Y. Yu and PócsMy.mi341316 2 1
Nardia scalaris GrayNa.sc 2
Nowellia curvifolia (Dicks.) Mitt.No.cu 1373
Odontoschisma denudatum (Mart.) Dumort.Od.de 1
Pallavicinia lyellii (Hook.) GrayPa.ly 3
Pellia epiphylla (L.) CordaPe.ep 219
Plagiochila bifaria (Sw.) Lindenb.Pl.bi 36734545
Plagiochila exigua (Taylor) TaylorPl.ex 191513
Plagiochila punctata (Taylor) TaylorPl.pu 2512336
Plagiochila retrorsa GottschePl.re 21
Porella canariensis (F. Weber) Underw.Po.ca 11278 3
Porella obtusata (Taylor) Trevis.Po.ob 11372
Pseudomarsupidium decipiens (Hook.) GrollePs.de 151532
Radula aquilegia (Hook. f. and Taylor) Gottsche, Lindenb. and NeesRa.aq 175757022
Radula carringtonii J.B. JackRa.ca3 193933171
Radula complanata (L.) Dumort.Ra.co 22
Radula holtii SpruceRa.ho 566
Radula wichurae Steph.Ra.wi68129721 2
Reboulia hemisphaerica (L.) RaddiRe.he 1
Riccardia chamedryfolia (With.) GrolleRi.ch 44
Riccardia multifida (L.) GrayRi.mu 833
Saccogyna viticulosa (L.) Dumort.Sa.vi 26163715
Scapania gracilis Lindb.Sc.gr 10163313
Scapania scandica (Arnell and H. Buch) MacvicarSc.sc 3
Telaranea azorica (H.Buch and Perss.) PócsTe.az 5
Telaranea europaea J.J. Engel and G.L. Merr.Te.eu 61013153 1

References

  1. Hallingbäck, T.; Hodgetts, N. Mosses, Liverworts, and Hornworts. Status Survey and Conservation Action Plan for Bryophytes; IUCN/SSC Bryophyte Specialist Group, Ed.; IUCN/SSC Bryophyte Specialist Group: Gland, Switzerland; Cambridge, UK, 2000; ISBN 2-8317-0466-9. [Google Scholar]
  2. Andrew, N.R.; Rodgerson, L. Variation in invertebrate—Bryophyte community structure at different spatial scales along altitudinal gradients. J. Biogeogr. 2003, 30, 731–746. [Google Scholar] [CrossRef]
  3. Sandvik, S.M.; Heegaard, E. Effects of Simulated Environmental Changes on Growth and Growth Form in a Late Snowbed Population of Pohlia wahlenbergii (Web. et Mohr) Andr. Arctic Antarct. Alp. Res. 2003, 35, 341–348. [Google Scholar] [CrossRef] [Green Version]
  4. Tuba, Z.; Slack, N.G.; Stark, L.R. Bryophyte Ecology and Climate Change; Tuba, Z., Slack, N.G., Stark, L.R., Eds.; Cambridge University Press: New York, NY, USA, 2011; ISBN 9780521767637. [Google Scholar]
  5. Alpert, P. Distribution quantified by microtopography in an assemblage of saxicolous mosses. Vegetatio 1985, 64, 131–139. [Google Scholar] [CrossRef]
  6. McCune, B. Gradients in epiphyte biomass in three Pseudotsuga-Tsuga forests of different ages in Western Oregon and Washington. Bryologist 1993, 96, 405–411. [Google Scholar] [CrossRef]
  7. Gabriel, R.; Bates, J.W. Bryophyte community composition and habitat specificity in the natural forests of Terceira, Azores. Plant Ecol. 2005, 177, 125–144. [Google Scholar] [CrossRef]
  8. Ashton, D.H. Ecology of bryophytic communities in mature Eucalyptus regnans F Muell forest at Wallaby Creek, Victoria. Aust. J. Bot. 1986, 34, 107–129. [Google Scholar] [CrossRef]
  9. Alpert, P. Microtopography as habitat structure for mosses on rocks. In Habitat Structure: The Physical Arrangement of Objects in Space; Springer: Dordrecht, The Netherlands, 1991; pp. 120–140. ISBN 978-94-010-5363-1. [Google Scholar]
  10. Medina, N.G.; Albertos, B.; Lara, F.; Mazimpaka, V.; Garilleti, R.; Draper, D.; Hortal, J. Species richness of epiphytic bryophytes: Drivers across scales on the edge of the Mediterranean. Ecography 2014, 37, 80–93. [Google Scholar] [CrossRef]
  11. Brown, J.H. Macroecology; University of Chicago Press: Chicago, IL, USA, 1995; ISBN 9780226076157. [Google Scholar]
  12. Rahbek, C. The elevational gradient of species richness: A uniform pattern? Ecography 1995, 18, 200–205. [Google Scholar] [CrossRef]
  13. Tusiime, F.M.; Byarujali, S.M.; Bates, J.W. Diversity and distribution of bryophytes in three forest types of Bwindi Impenetrable National Park, Uganda. Afr. J. Ecol. 2007, 45, 79–87. [Google Scholar] [CrossRef]
  14. Bruun, H.H.; Moen, J.; Virtanen, R.; Grytnes, J.-A.; Oksanen, L.; Angerbjörn, A. Effects of altitude and topography on species richness of vascular plants, bryophytes and lichens in alpine communities. J. Veg. Sci. 2006, 17, 37–46. [Google Scholar] [CrossRef]
  15. Ah-Peng, C.; Wilding, N.; Kluge, J.; Descamps-Julien, B.; Bardat, J.; Chuah-Petiot, M.; Strasberg, D.; Hedderson, T.A.J. Bryophyte diversity and range size distribution along two altitudinal gradients: Continent vs. island. Acta Oecologica 2012, 42, 58–65. [Google Scholar] [CrossRef]
  16. Sun, S.; Wu, Y.; Wang, G.; Zhou, J.; Yu, D.; Bing, H.; Luo, J. Bryophyte species richness and composition along an altitudinal gradient in Gongga Mountain, China. PLoS ONE 2013, 8, e58131. [Google Scholar] [CrossRef]
  17. Dias, E. Vegetação Natural dos Açores. Ecologia e Sintaxonomia das Florestas Naturais. Master’s Thesis, University of the Azores, Angra do Heroísmo, Portugal, 1996. [Google Scholar]
  18. Azevedo, E.B.; Rodrigues, M.C.; Fernandes, J.F. O Clima dos Açores. Climatologia: Introdução. In Atlas Básico dos Açores; Forjaz, V.H., Ed.; Observatório Vulcanológico e Geotérmico dos Açores: Ponta Delgada, Portugal, 2004. [Google Scholar]
  19. Veneklaas, E.J.; Zagt, R.J.; Leerdam, A.; Ek, R.; Broekhoven, A.J.; Genderen, M. Hydrological properties of the epiphyte mass of a montane tropical rain forest, Colombia. Vegetatio 1990, 89, 183–192. [Google Scholar] [CrossRef]
  20. Sjögren, E. Epiphyllous bryophytes in the Azores Islands. Arquipel. Life Mar. Sci. 1997, 15, 1–49. [Google Scholar]
  21. Sjögren, E. Bryophyte vegetation in the Azores islands. Mem. Soc. Broteriana 1978, 26, 1–273. [Google Scholar]
  22. Sjögren, E. Azorean Bryophyte Communities—A revision of differential species. Arquipel. Life Mar. Sci. 2003, 20A, 1–29. [Google Scholar]
  23. Pharo, E.J.; Beattie, A.J. The association between substrate variability and Bryophyte and Lichen diversity in Eastern Australian Forests. Bryologist 2002, 105, 11–26. [Google Scholar] [CrossRef]
  24. Russel, J.L. Some notes on the cryptogamic vegetation of Fayal, Azores. Proccedings Essex Inst. 1862, 2, 134–137. [Google Scholar]
  25. Trelease, W. Botanical Observations on the Azores; Annual Report of the Missouri Botanical Garden; Missouri Botanical Garden: St. Louis, MO, USA, 1897; Volume 8, pp. 77–220. [Google Scholar]
  26. Richards, P.W. A collection of bryophytes from the Azores. Ann. Bryol. 1937, 9, 131–138. [Google Scholar]
  27. Allorge, P.; Allorge, V. Hépatiques recoltées par P. et V. Allorge aux îles Açores en 1937. Rev. Bryol. Lichenol. 1950, 19, 90–118. [Google Scholar]
  28. Allorge, P.; Allorge, V. Mousses recoltées par P. et V. Allorge aux îles Açores en 1937. Rev. Bryol. Lichenol. 1952, 21, 50–95. [Google Scholar]
  29. González-Mancebo, J.M.; Losada-Lima, A.; Hérnandez-Garcia, C.D. A contribution to the floristic knwoledge of caves on the Azores. Mémoires Biospéologie 1991, 17, 219–226. [Google Scholar]
  30. Crundwell, A.C.; Greven, H.C.; Stern, R.C. Some additions to the bryophyte flora of the Azores. J. Bryol. 1994, 18, 329–337. [Google Scholar] [CrossRef]
  31. Homem, N.F.M. Biodiversidade de Briófitos nas Florestas Naturais dos Açores—Ilhas Terceira e Pico. Master’s Thesis, Universidade dos Açores, Angra do Heroísmo, Portugal, 2005. [Google Scholar]
  32. Eggers, J. Artenliste der Moose Makaronesiens. Cryptogam. Bryol. Lichenol. 1982, 3, 283–335. [Google Scholar]
  33. Sjögren, E. Distribution of Azorean bryophytes up to 1999, their island distribution and information on their presence elsewhere, including Madeira and the Canary Islands. In Boletim do Museu Municipal do Funchal (História Natural); Museum of Natural History of Funchal: Funchal, Portugal, 2001; pp. 1–89. [Google Scholar]
  34. Gabriel, R.; Sjögren, E.; Schumacker, R.; Sérgio, C.; Frahm, J.; Sousa, E. Lista dos Briófitos (Bryophyta). In A List of the Terrestrial and Marine Biota from the Azores; Princípia Editora Lda: Cascais, Portugal, 2010; pp. 117–130. [Google Scholar]
  35. Borges, P.A.V.; Costa, A.; Cunha, R.; Gabriel, R.; Gonçalves, V.; Martins, A.; Melo, I.; Parente, M.; Raposeiro, P.; Rodrigues, P.; et al. A List of the Terrestrial and Marine Biota from the Azores; Princípia: Cascais, Portugal, 2010; ISBN 9789898131751. [Google Scholar]
  36. Sutherland, W.J.; Freckleton, R.P.; Godfray, H.C.J.; Beissinger, S.R.; Benton, T.; Cameron, D.D.; Carmel, Y.; Coomes, D.A.; Coulson, T.; Emmerson, M.C.; et al. Identification of 100 fundamental ecological questions. J. Ecol. 2013, 101, 58–67. [Google Scholar] [CrossRef]
  37. Patiño, J.; Mateo, R.G.; Zanatta, F.; Marquet, A.; Aranda, S.C.; Borges, P.A.V.; Dirkse, G.; Gabriel, R.; Gonzalez-Mancebo, J.M.; Guisan, A.; et al. Climate threat on the Macaronesian endemic bryophyte flora. Sci. Rep. 2016, 6. [Google Scholar] [CrossRef] [Green Version]
  38. França, Z.; Cruz, J.V.; Nunes, J.C.; Forjaz, V.H. Geologia dos Açores: Uma perpectiva actual. Açoreana 2003, 10, 11–140. [Google Scholar]
  39. Forjaz, V.H. Atlas básico dos Açores; OVGA: Ponta Delgada, Portugal, 2004. [Google Scholar]
  40. Cruz, J.V.; Pereira, R.; Moreira, A. Carta de Ocupação do Solo da Região Autónoma dos Açores; Secretaria Regional do Ambiente e do Mar, Direcção Regional do Ordenamento do Território e dos Recursos Hídricos: Ponta Delgada, Portugal, 2007.
  41. Elias, R.B.; Gil, A.; Silva, L.; Fernández-Palacios, J.M.; Azevedo, E.B.; Reis, F. Natural zonal vegetation of the Azores Islands: Characterization and potential distribution. Phytocoenologia 2016, 46, 107–123. [Google Scholar] [CrossRef]
  42. Coelho, M.; Elias, R.; Kluge, J.; Pereira, F.; Henriques, D.; Aranda, S.; Borges, P.; Ah-Peng, C.; Gabriel, R. Long-term monitoring across elevational gradients (II): Vascular plants on Pico Island (Azores) transect. Arquipel. Life Mar. Sci. 2016, 33, 21–44. [Google Scholar]
  43. Borges, P.A.V.; Cardoso, P.; Kreft, H.; Whittaker, R.J.; Fattorini, S.; Emerson, B.C.; Gil, A.; Gillespie, R.G.; Matthews, T.J.; Santos, A.M.C.; et al. Global Island Monitoring Scheme (GIMS): A proposal for the long-term coordinated survey and monitoring of native island forest biota. Biodivers. Conserv. 2018, 27, 2567–2586. [Google Scholar] [CrossRef] [Green Version]
  44. Gabriel, R.; Coelho, M.; Henriques, D.; Borges, P.; Elias, R.; Kluge, J.; Ah-Peng, C. Long-term monitoring across elevational gradients to assess ecological hypothesis: A description of standardized sampling methods in oceanic islands and first results. Arquipel. Life Mar. Sci. 2014, 31, 45–67. [Google Scholar]
  45. ISO 10390: 2005 Soil Quality—Determination of pH; International Organization for Standardization: Geneva, Switzerland, 2005.
  46. Silva, L.; Moura, M.; Schaefer, H.; Rumsey, F.; Dias, E.F. List of vascular plants (Tracheobionta). In A List of The Terrestrial and Marine Biota from the Azores; Princípia, Ed.; Princípia: Cascais, Portugal, 2010; pp. 117–146. [Google Scholar]
  47. Azevedo, E.B. Modelação do Clima Insular à Escala Local. Modelo CIELO Aplicado à ilha Terceira. Ph.D. Thesis, University of the Azores, Angra do Heroísmo, Portugal, 1996. [Google Scholar]
  48. Azevedo, E.B.; Pereira, L.S.; Itier, B. Simulation of local climate in islands environments using a GIS interated model. In Proceedings of the Emerging Technologies for Sustainable land Use and Water Management, Lausanne, Switzerland, 1–3 September 1999. [Google Scholar]
  49. Azevedo, E.B.; Pereira, L.S.; Itier, B. Modelling the local climate in island environments: Water balance applications. Agric. Water Manag. 1999, 40, 393–403. [Google Scholar] [CrossRef]
  50. Monteith, J.L.; Unsworth, M.H. Principles of Environmental Physics, 2nd ed.; Arnold, E., Ed.; Elsevier Science: London, UK, 1990; ISBN 9780123869104. [Google Scholar]
  51. Cardoso, P.; Rigal, F.; Fattorini, S.; Terzopoulou, S.; Borges, P.A. Integrating Landscape Disturbance and Indicator Species in Conservation Studies. PLoS ONE 2013, 8, e63294. [Google Scholar] [CrossRef]
  52. Braun-Blanquet, J. Pflanzensoziologie. Grundzüge der Vegetationskunde, 2nd ed.; Springer: Wien, Austria, 1951. [Google Scholar]
  53. Hodgetts, N.; Lockhart, N. Checklist and Country Status of E Uropean Bryophytes—Update 2020. Irish Wildlife Manuals. 2020. Available online: https://www.npws.ie/sites/default/files/publications/pdf/IWM123.pdf (accessed on 7 April 2021).
  54. Hammer, Ø. PAST—Paleontological Statistics, Version 4.05—Reference Manual; Natural History Museum, University of Oslo: Oslo, Norway, 2021. [Google Scholar]
  55. Colwell, R.K.; Rahbek, C.; Gotelli, N. The mid-domain effect and species richness patterns: What have we learned so far? Am. Nat. 2004, 163, E1–E23. [Google Scholar] [CrossRef] [Green Version]
  56. Magurran, A.E. Measuring Biological Diversity; Blackwell Science Ltd.: Malden, MA, USA, 2004; ISBN 0-632-05633-9. [Google Scholar]
  57. Hill, M.O. Diversity and Evenness: A Unifying Notation and Its Consequences. Ecology 1973, 54, 427–432. [Google Scholar] [CrossRef] [Green Version]
  58. Jost, L.; Devries, P.; Walla, T.; Greeney, H.; Chao, A.; Ricotta, C. Partitioning diversity for conservation analyses. Divers. Distrib. 2010, 16, 65–76. [Google Scholar] [CrossRef]
  59. Chao, A.; Chiu, C.H.; Jost, L. Unifying species diversity, phylogenetic diversity, functional diversity, and related similarity and differentiation measures through hill numbers. Annu. Rev. Ecol. Evol. Syst. 2014, 45, 297–324. [Google Scholar] [CrossRef] [Green Version]
  60. Krebs, C.J. Ecological Methodology, 2nd ed.; Harper Collins Publishers: New York, NY, USA, 1999. [Google Scholar]
  61. Berger, W.H.; Parker, F.L. Diversity of planktonic foraminifera in deep-sea sediments. Science 1970, 168, 1345–1347. [Google Scholar] [CrossRef]
  62. Jost, L. Partitioning diversity into independent alpha and beta components. Ecology 2007, 88, 2427–2439. [Google Scholar] [CrossRef] [Green Version]
  63. Whittaker, R.J.; Willis, K.J.; Field, R. Scale and species richness: Towards a general, hierarchical theory of species diversity. J. Biogeogr. 2001, 28, 453–470. [Google Scholar] [CrossRef] [Green Version]
  64. Southwood, T.R.E.; Henderson, P.A. Ecological Methods, 3rd ed.; Blackwell Science Ltd.: Oxford, UK, 2000; ISBN 0632054778. [Google Scholar]
  65. Lloyd, M. Mean crowding. J. Anim. Ecol. 1967, 36, 1–30. [Google Scholar] [CrossRef]
  66. Henriques, D.S.G.; Borges, P.A.V.; Gabriel, R. Regional processes drive bryophyte diversity and community composition in a small oceanic island. Community Ecol. 2017, 18, 193–202. [Google Scholar] [CrossRef] [Green Version]
  67. Cardoso, P.; Borges, P.A.V.; Gaspar, C. Biotic integrity of the arthropod communities in the natural forests of Azores. Biodivers. Conserv. 2007, 16, 2883–2901. [Google Scholar] [CrossRef] [Green Version]
  68. Legendre, P.; Legendre, L. Numerical Ecology, 2nd ed.; Elsevier: Amsterdam, The Netherlands, 1998; ISBN 9780444892492. [Google Scholar]
  69. Ellis, L.T.; Ah-Peng, C.; Aranda, S.C.; Bednarek-Ochyra, H.; Borovichev, E.A.; Cykowska-Marzencka, B.; Duarte, M.C.; Enroth, J.; Erzberger, P.; Fedosov, V.; et al. New national and regional bryophyte records, 45. J. Bryol. 2015, 37, 308–329. [Google Scholar] [CrossRef] [Green Version]
  70. Sjögren, E. Bryophytes (Musci) unexpectedly rare or absent in the Azores. Arquipélago. Life Mar. Sci. 2006, 23A, 1–17. [Google Scholar]
  71. Coelho, M.; Henriques, D.; Ah-Peng, C. Espécies raras de briófitos ao longo do gradiente altitudinal de floresta nativa na ilha do Pico (Açores): O caso de Echinodium renauldii (Cardot) Broth. In Proceedings of the Ciência nos Açores—Que Futuro? Ponta Delgada, Portugal, 7–8 June 2013; pp. 129–134. [Google Scholar]
  72. Henriques, D.S.; Elias, R.B.; Coelho, M.C.; Hérnandez, R.H.; Pereira, F.; Gabriel, R. Long-term monitoring across elevational gradients (III): Vascular plants on Terceira Island (Azores) transect. Arquipel. Life Mar. Sci. 2017, 34, 1–20. [Google Scholar]
  73. Hernández-Hernández, R.; Borges, P.A.V.; Gabriel, R.; Rigal, F.; Ah-Peng, C.; González-Mancebo, J.M. Scaling α- and β-diversity: Bryophytes along an elevational gradient on a subtropical oceanic Island (La Palma, Canary Islands). J. Veg. Sci. 2017. [Google Scholar] [CrossRef]
  74. Marline, L. Diversity and Biogeography of Madagascan Bryophytes with an Analysis of Taxic and Functional Diversity Along an Elevational Gradient in Marojejy National Park. Ph.D. Thesis, University of Cape Town, Cape Town, South Africa, 2018. [Google Scholar]
  75. Dansereau, P. Études Macaronésiennes III. La zonation altitudinale. Nat. Can. 1966, 93, 779–795. [Google Scholar]
  76. Purvis, O.W.; Smith, C.W.; James, P.W. Studies in the lichens of the Azores. Part 2—Lichens of the upper slopes of Pico mountain. A comparison between the lichen floras of the Azores, Madeira and the Canary Islands at high altitudes. Arquipel. Life Mar. Sci. 1994, 12A, 35–50. [Google Scholar]
  77. Rahbek, C. The role of spatial scale and the perception of large-scale species-richness patterns. Ecol. Lett. 2005, 8, 224–239. [Google Scholar] [CrossRef]
  78. Marline, L.; Andriamiarisoa, R.L.; Bardat, J.; Chuah-Petiot, M.; Hedderson, T.A.J.; Reeb, C.; Strasberg, D.; Wilding, N.; Ah-Peng, C. Checklist of the Bryophytes of Madagascar. Cryptogam. Bryol. 2012, 33, 199–255. [Google Scholar] [CrossRef]
  79. Van Reenen, G.B.A.; Gradstein, S.R. Studies on Colombian Cryptogams XX—A transect analysis of the bryophyte vegetation along an altitudinal gradient on the Sierra Nevada de Santa Marta, Colombia. Acta Bot. Neerl. 1983, 32, 1–5. [Google Scholar] [CrossRef]
  80. Wolf, J.H.D. Diversity Patterns and Biomass of Epiphytic Bryophytes and Lichens Along an Altitudinal Gradient in the Northern Andes. Ann. Missouri Bot. Gard. 1993, 80, 928–960. [Google Scholar] [CrossRef]
  81. Ah-Peng, C.; Chuah-Petiot, M.; Descamps-Julien, B.; Bardat, J.; Stamenoff, P.; Strasberg, D. Bryophyte diversity and distribution along an altitudinal gradient on a lava flow in La Réunion. Divers. Distrib. 2007, 13, 654–662. [Google Scholar] [CrossRef]
  82. Madruga, J.S. Andossolos dos Açores. Contributo Para o Seu Estudo. Ph.D. Thesis, University of the Azores, Angra do Heroísmo, Portugal, 1986. [Google Scholar]
  83. Gabriel, R. Ecophysiology of Azorean Forest Bryophytes. Ph.D. Thesis, Imperial College of Science, Technology and Medicine, University of London, London, UK, 2000. [Google Scholar]
  84. Borges, P.A.V.; Gabriel, R. Predicting Extinctions on Oceanic Islands: Arthropods and Bryophytes; Universidade dos Açores: Ponta Delgada, Portugal, 2009. [Google Scholar]
  85. Zartman, C.E.; Amaral, J.A.; Figueiredo, J.N.; de Sales Dambros, C. Drought Impacts Survivorship and Reproductive Strategies of an Epiphyllous Leafy Liverwort in Central Amazonia. Biotropica 2015, 47, 172–178. [Google Scholar] [CrossRef]
  86. Malombe, I.; Matheka, K.W.; Pócs, T.; Patiño, J. Edge effect on epiphyllous bryophytes in Taita Hills fragmented afromontane forests. J. Bryol. 2016, 38, 33–46. [Google Scholar] [CrossRef]
  87. Glime, J.M.; Pócs, T. Tropics: Epiphylls. In Bryophyte Ecology; Ebook Sponsored by Michigan Technological University and the International Association of Bryologists; 2018; Volume 4, pp. 8-6-1–8-6-54. [Google Scholar]
  88. Hill, M.O.; Preston, C.D.; Bosanquet, S.D.S.; Roy, D.B. BRYOATT—Attributes of British and Irish Mosses, Liverworts and Hornworts; Centre for Ecology and Hydrology: Norwich, UK, 2007. [Google Scholar]
  89. Pharo, E.J.; Beattie, A.J. Bryophyte and lichen diversity: A comparative study. Austral Ecol. 1997, 22, 151–162. [Google Scholar] [CrossRef] [Green Version]
  90. Elias, R.B. Ecologia das Florestas de Juniperus dos Açores. Ph.D. Thesis, University of Azores, Angra do Heroísmo, Portugal, 2007. [Google Scholar]
  91. Gabriel, R.; Homem, N.; Couto, A.B.; Aranda, S.C.; Borges, P.A.V. Azorean bryophytes: A preliminary review of rarity patterns. Açoreana 2011, 144, 149–206. [Google Scholar]
  92. Gabriel, R.; Sim-Sim, M.; Hodgetts, N.; Martins, A. Echinodium Renauldii. The IUCN Red List of Threatened Species 2019: E.T39167A87712737; IUCN: Cambridge, UK, 2019; Available online: https://www.iucnredlist.org (accessed on 7 April 2021).
  93. Ferreira, M.T.; Cardoso, P.; Borges, P.A.V.; Gabriel, R.; de Azevedo, E.B.; Reis, F.; Araujo, M.B.; Elias, R.B. Effects of climate change on the distribution of indigenous species in oceanic islands (Azores). Clim. Chang. 2016, 138, 603–615. [Google Scholar] [CrossRef]
  94. Vergílio, M.; Fonseca, C.; Calado, H.; Borges, P.A.V.; Elias, R.B.; Gabriel, R.; Martins, A.; Azevedo, E.; Cardoso, P. Assessing the efficiency of protected areas to represent biodiversity: A small island case study. Environ. Conserv. 2016, 43, 337–349. [Google Scholar] [CrossRef]
  95. ABP—Azores Biodiversity Portal. Available online: http://azoresbioportal.uac.pt/ (accessed on 1 October 2017).
  96. Gaston, K.J.; Fuller, R.A. Commonness, population depletion and conservation biology. Trends Ecol. Evol. 2008, 23, 14–19. [Google Scholar] [CrossRef]
  97. Gaston, K.J. Ecology. Valuing common species. Science 2010, 327, 154–155. [Google Scholar] [CrossRef]
  98. Loppi, S. Lichens as sentinels for air pollution at remote alpine areas (Italy). Environ. Sci. Pollut. Res. 2014, 21, 2563–2571. [Google Scholar] [CrossRef]
  99. Sim-Sim, M.; Carvalho, S.; Fontinha, S.; Lobo, C.; Esquível, M.G.; Figueiredo, A.C. Diversity of Bryophytes—Useful indicators of Madeira Laurel forest conservation. In EFI Proceedings No. 51 Monitoring and Indicators of Forest Biodiversity in Europe—From Ideas to Operationality; European Forest Institute: Joensuu, Finland, 2005; pp. 247–257. [Google Scholar]
Figure 1. Location of Pico Island in the Azores archipelago (inset, upper right), and the natural park (in green). Dots show the location of the 12 sampled sites, from Manhenha (10 m a.s.l.) to Pico Mountain (2200 m a.s.l.), with a 200 m elevational step (September 2012).
Diversity 13 00162 g001
Figure 2. Mean species accumulation curves for bryophytes, liverworts and mosses of Pico Island using a Jackknife 1 estimator, based on 999 randomized curves.
Diversity 13 00162 g002
Figure 3. (a) Bryophyte (liverworts and mosses) richness and abundance (number of presences in 50 cm2 microplots; see the secondary axis) and vascular plant richness along Pico Island’s elevational gradient (S = number of species; A = number of samples). (b) Bryophyte species richness in relation to elevation. The fitted, dashed line resulted from a polynomial regression model. (c) Residuals of bryophyte species richness versus fragment area (ha) in relation to elevation. The fitted, dashed line results from a polynomial regression model. See the text for further details and models.
Diversity 13 00162 g003aDiversity 13 00162 g003b
Figure 4. Diversity (Hill numbers) profile for the bryophytes of the different elevational bands in the Pico Island transect.
Diversity 13 00162 g004
Figure 5. Diversity (Hill numbers) profile for the different elevational bands in the Pico Island transect (RU = rupicolous; TE = terricolous; HU = humicolous; LI = lignicolous; EP = epiphytic; and LF = epiphyllous).
Diversity 13 00162 g005
Figure 6. Unweighted pair group average (UPGMA) dendrogram based on Bray–Curtis distance analysis of the 12 sites along the elevational transect of Pico Island. Elevational sites are clustered by elevational belt.
Diversity 13 00162 g006
Figure 7. Ordination diagram showing the result of the canonical correspondence analysis (CCA) of the 141 bryophyte species (blue dots) along the first two axes, the 12 sites (open circles) and their correlation with 5 explanatory variables (green segments). The segments show the direction of maximum variation in the ecological variables; longer segments indicate stronger correlations between variables and axes. The directions and lengths of the segments show the degree of correlation between species composition and the explanatory variables. The names of the species with the highest contribution to the model (38 species of the fourth quartile) are indicated by their abbreviations (Appendix A). Explanatory variables included the elevation (ALTI), disturbance index (DIST), bark pH (pH_C); mean annual precipitation (RAIN); and richness of vascular plants (S_VA).
Diversity 13 00162 g007
Table 1. Distribution of the collected microplots per substrate (RU = rupicolous; TE = terricolous; HU = humicolous; LI = lignicolous; EP = epiphytic; LF = epiphyllous) for the 12 study sites along the elevational transect of Pico Island.
Substrate
Elevation (m a.s.l.)
RUTEHULIEPLFTotal
10183 1825 64
200165 1834 73
400181161840 93
60015 18175417121
800 418185418112
10003518184818110
1200612121336988
140081212318 53
16001710121722 78
18001822 7 29
20001817 26
220018 121 31
Total1556511714133862878
All samples are deposited in AZU-Bry, the herbarium of the University of the Azores.
Table 2. Hill numbers for the 12 study sites along the elevational transect of Pico Island (S = richness of species; H’ = Shannon–Wiener index; D = Simpson index; and d = Berger–Parker index).
Elevation
(m a.s.l.)
102004006008001000120014001600180020002200Total
BRYOPHYTES
S (q = 0)16324969727039313815109141
H’2.282.773.363.553.673.642.922.993.062.451.821.794.11
exp H’ (q = 1)9.7515.9428.6534.9239.4137.9218.4519.9721.2311.526.186.0161.13
D0.140.100.050.040.030.040.090.070.060.110.210.200.02
1/D (q = 2)7.3810.4120.5325.6429.1427.9011.4015.2815.529.494.845.0840.48
d0.250.180.130.070.070.080.200.140.120.200.320.270.07
1/d (q = 3)3.975.567.6213.7613.7312.795.117.108.044.903.113.6515.11
LIVERWORTS
S (q = 0)7172848494818111343271
H’1.482.102.853.283.393.312.072.051.971.201.070.303.59
exp H’ (q = 1)4.378.1517.3226.4929.6127.387.937.737.163.312.911.3636.09
D0.280.170.080.050.040.050.220.160.180.340.360.830.04
1/D (q = 2)3.605.9712.8719.6322.5520.684.576.325.412.972.811.2026.73
d0.400.250.180.090.100.100.430.280.300.430.450.910.08
1/d (q = 3)2.504.035.4811.1510.099.792.343.553.292.332.201.1012.48
MOSSES
S (q = 0)91521212322212025117770
H’1.862.392.532.132.292.382.362.562.652.111.391.563.27
exp H’ (q = 1)6.4210.9512.578.449.8210.7610.5512.8914.098.214.024.7526.26
D0.190.110.110.170.150.140.140.100.100.150.300.250.07
1/D (q = 2)5.399.189.306.046.787.337.039.6410.116.553.354.0513.80
d0.300.170.180.290.270.270.290.180.190.290.400.320.20
1/d (q = 3)3.336.005.563.443.643.743.405.465.213.502.503.104.88
Table 3. Hill numbers for the six substrates collected on the transect of Pico Island (S = richness of species; H’ = Shannon–Wiener index; D = Simpson index; d = Berger–Parker index; RU = rupicolous; TE = terricolous; HU = humicolous; LI = lignicolous; EP = epiphytic; and LF = epiphyllous).
RUTEHULIEPLFTotal
BRYOPHYTES
S (q = 0)766174708438141
H’3.793.753.843.733.682.894.11
exp H’ (q = 1)44.4342.6346.7341.5839.7418.0761.13
D0.030.030.030.030.030.080.02
1/D (q = 2)29.8532.6933.5830.7028.9012.8440.48
d0.080.070.070.090.090.140.07
1/d (q = 3)11.9213.8014.3311.3911.447.3515.11
LIVERWORTS
S (q = 0)32293847513271
H’2.903.033.203.413.372.723.59
exp H’ (q = 1)18.1520.6924.6330.2129.1215.2436.09
D0.080.060.050.040.040.090.04
1/D (q = 2)12.4416.1718.7824.1922.7811.0726.73
d0.190.140.100.080.080.150.08
1/d (q = 3)5.397.209.8112.0512.726.6412.48
MOSSES
S (q = 0)4733372333670
H’3.313.123.162.442.361.203.28
exp H’ (q = 1)27.3422.5423.4911.4110.623.3126.58
D0.060.060.070.140.150.450.07
1/D (q = 2)17.5916.6315.347.246.532.2313.80
d0.150.110.180.300.320.650.20
1/d (q = 3)6.538.805.543.363.121.544.88
Table 4. Sørensen’s similarity indices (SSIs) between pairs of elevational zones in the Pico Island transect. (Elevational zones: low, 10–400 m a.s.l.; middle, 600–1000 m a.s.l.; medium-high, 1200–1600 m a.s.l.; and high, 1800–2200 m a.s.l.).
Altitudinal BandsBryophytes
(n = 141)
Liverworts
(n = 71)
Mosses
(n = 70)
Low–Middle0.560.580.52
Low–Medium High0.390.490.32
Low–High0.100.060.13
Middle–Medium High0.410.440.38
Middle–High0.120.090.16
Medium High–High0.410.290.47
Table 5. Sørensen’s similarity indices (SSIs) between pairs of substrates in the Pico Island transect. The more similar the species composition between two different substrates, the closer the SSI gets to 1.00 (EP = epiphytic; HU = humicolous; LF = epiphyllic; LI = lignicolous; RU = rupicolous; and TE = terricolous).
Altitudinal BandsBryophytes
(n = 141)
Liverworts
(n = 71)
Mosses
(n = 70)
EP–HU0.540.630.43
EP–LF0.590.720.31
EP–LI0.740.820.61
EP–RU0.530.530.52
EP–TE0.510.530.49
HU–LF0.460.600.24
HU–LI0.600.660.51
HU–RU0.670.690.65
HU–TE0.700.660.74
LF–LI0.630.710.41
LF–RU0.370.530.16
LF–TE0.380.460.26
LI–RU0.520.580.45
LI–TE0.560.550.58
RU–TE0.660.690.63
Publisher’s Note: MDPI stays neutral with regard to jurisdictional claims in published maps and institutional affiliations.

