Article

All Populations Matter: Conservation Genomics of Australia’s Iconic Purple Wattle, Acacia purpureopetala

1
Research Centre for Ecosystem Resilience, Royal Botanic Garden Sydney, Mrs Macquaries Road, Sydney, NSW 2000, Australia
2
CSIRO Land and Water, Tropical Forest Research Centre, Maunds Road, Atherton, QLD 4883, Australia
*
Author to whom correspondence should be addressed.
Diversity 2021, 13(4), 139; https://doi.org/10.3390/d13040139
Submission received: 25 February 2021 / Revised: 17 March 2021 / Accepted: 21 March 2021 / Published: 25 March 2021
(This article belongs to the Special Issue Evolutionary Ecology and Conservation of Native Plants)

Abstract

:
Maximising genetic diversity in conservation efforts can help to increase the chances of survival of a species amidst the turbulence of the anthropogenic age. Here, we define the distribution and extent of genomic diversity across the range of the iconic but threatened Acacia purpureopetala, a beautiful sprawling shrub with mauve flowers, restricted to a few disjunct populations in far north Queensland, Australia. Seed production is poor and germination sporadic, but the species occurs in abundance at some field sites. While several thousands of SNP markers were recovered, comparable to other Acacia species, very low levels of heterozygosity and allelic variation suggested inbreeding. Limited dispersal most likely contributed towards the high levels of divergence amongst field sites and, using a generalised dissimilarity modelling framework amongst environmental, spatial and floristic data, spatial distance was found to be the strongest factor explaining the current distribution of genetic diversity. We illustrate how population genomic data can be utilised to design a collecting strategy for a germplasm conservation collection that optimises genetic diversity. For this species, inclusion of all field sites will capture maximum genetic diversity for both in situ and ex situ conservation. Assisted cross pollination, within and between field sites and genetically structured groups, is recommended to enhance heterozygosity particularly at the most disjunct sites and further fragmentation should be discouraged to avoid loss of genetic connectivity.

1. Introduction

While the distribution of genetic diversity within and between individuals and populations can guide our understanding of past demographic processes and life history characteristics of a species, there has been increased interest in genetic diversity from a conservation perspective as is reflected in the reference to genetic diversity in the Convention on Biological Diversity, Aichi Biodiversity Targets agreed in 2010 [1]. This is justified by the mounting evidence that higher levels of genetic diversity can facilitate fitness and long-term survival [2,3], providing some form of life-insurance for species in a rapidly changing environment. Population genetic studies have revealed low genetic diversity for some threatened species. As a result, many conservation management plans are turning to inferences of genetic diversity to guide conservation efforts in order to maximise genetic diversity for in situ and ex situ collections as well as translocation [4,5]. To the advantage of this evolutionary approach to conservation, is the advances in genomic sequencing technologies and accompanying bioinformatic tools over the last decade facilitating the inclusion of genetic information in conservation management plans [6,7].
The genus Acacia evolved c.23 million years ago (Mya) with a major radiation at 15 Mya [8,9] that led to its current ubiquitous distribution across the Australian landscape, where it occupies all biomes with more than 950 species in Australia and over 1300 worldwide [10]. However, there are now many species of Acacia listed as threatened in Australia (more than 80 threatened species counted at the time of publication [11]). Acacia purpureopetala F.M.Bailey is one of these threatened species [12].
While diverse in the habitat it occupies, the genus Acacia is also known for the array of mating systems and reproductive modes, ranging from obligate outcrossers that produce vast amounts of seed (A. mearnsii; [13]), to those with mixed mating systems producing seeds through cross fertilisation or selfing (A. terminalis; [13]), to species that are only known to reproduce through suckering with no seed production (A. atrox [14]). Hybridisation has also been recorded in the genus [15]. This variation in reproductive strategies makes gross generalisations based on distribution and functional traits across the genus dangerous [16] and a conservation genomics approach to management of the species would facilitate both in situ and ex situ conservation [17,18].
A. purpureopetala is an iconic species, being the only representative in the genus with consistently purple inflorescences and flowers (image provided in Figure S1). The mauve-pink flowers are produced throughout the year with a main flush in December and January [19] with flushes likely associated with specific rain events [20]. However, both pollen and seed dispersal traits suggest that this species is a poor disperser: The phyllodes lack nectaries to attract pollinators, the seed lacks an aril that is involved in ant dispersal, and seeds are not explosively ejected as documented with other Acacias [19]. In addition, only a small number of seeds are produced per plant with only a few seeds (1–3) per pod and few to no pods per plant [20].
This species has a very restricted geographic distribution (Extent of Occurrence = 850 km2, [19,20]) and is currently listed as Critically Endangered under the Environment Protection and Biodiversity Conservation Act (EPBC Act 1999 [12]). It is known from the broader Herberton area in north Queensland, Australia, where it is often associated with disturbed areas such as mine sites and along roadsides, but it is also found in abundance in undisturbed open woodland vegetation (images available in Figure S1) often adjacent to disturbed sites. The main perceived threats to the species are habitat loss, grazing by cattle, mining, road works, invasive weeds, and illegal collecting [12].
Despite its distinctiveness and threatened status, little research has focused on this low growing, sprawling Acacia. No genetic studies have been conducted on this species and it is only the recent floristic surveys of [19,20] and taxonomic descriptions [10,21] that can be readily found in the literature. Accordingly, there is no information on the population’s genetic diversity or the evolutionary and recent history of the species that can guide our understanding of the scales of time over which dispersal, genetic drift, and selection operate in populations [22]. Fragmentation or local sub-population extinction can lead to reduced gene flow among populations; this can in turn increase the genetic differentiation among populations and genetic structuring due to genetic drift [23,24]. However, fragmented disjunct populations can also be the product of more recent founder events with little or no genetic variation amongst sub-populations [25]. The highly fragmented nature of the sub-populations of A. purpureopetala, along with putative poor dispersal ability, suggest that genetic connectivity between sub-populations may be relatively low [4].
Spatial shifts in climate may require populations to rapidly disperse or migrate, and it is important to understand the levels of genetic connectivity between disjunct populations. This can help us formulate a picture of how these populations may respond to future change and whether local populations will be able to rapidly disperse or face local extinction. Little genetic divergence with high levels of gene flow amongst populations could indicate recent expansion and connectivity between disjunct populations, while the opposite, little gene flow and high divergence, may indicate low dispersal of pollen and seed with little gene flow. Such populations will be more prone to local extinction when conditions become unfavourable.
To increase our understanding of A. pupureopetela, we present a population genomic study that includes nearly all sub-populations of the species (access to one sub-population at the time of the work was not possible). The fragmented nature of the species questions if habitat specificity plays a critical role in the geographic distribution as well as the extent and distribution of genetic diversity of the species. Thus, to compliment the genomic data, we gathered floristic and environmental data to explore the relationship amongst the three variables using a generalised dissimilarity modelling approach (GDM).
Conservation practitioners often need to make explicit or implicit decisions regarding selection for sites to be included in targeted management plans that include in situ and ex situ conservation with trade-offs between various factors (such as stakeholders, threatened status of the species, available information on the species, funding and time [26,27]). The entire extent of A. purpureopetala occurs outside conservation reserves and this can complicate the implementation of in situ management plans across the distribution of the species. We used the genomic data to explore how we can optimise genetic diversity for germplasm conservation collections. As it is unlikely that the exact same individuals used in the genomic study will be sampled, we used an approach of randomly selecting individuals from the available pool of genotyped samples. The aims of this study were (i) to obtain genomic data suitable for population genetic inferences and (ii) utilise the data and results to provide practical guidelines for conservation practitioners specific to this species.

2. Materials and Methods

Field sites for this study (Figure 1) were based upon existing herbaria records, which represent the populations and sub-populations as presented in the Species Profile and Threats Database [28]. Acacia purpureopetala occurs in low open woodlands with a well-developed shrub layer (habitat images provided in Figure S1) but is also found along roadsides and abandoned mine sites. These woodlands tend to be very rocky, with substrates varying from granites and rhyolites to metalliferous metamorphic substrates at elevations of 64–1040 m above sea level. Nearly all plants are found at aspects of 10–140 degrees North [20]. All fieldwork was undertaken between November 2017 and May 2018. Three sets of data, environmental, floristic and genomic, were gathered for each field site.

2.1. Floristic Data

The methodology associated with floristic data collection followed [30]. After the presence of A. purpureopetala was verified at a field site, a transect of 50 m × 10 m was established. One side of the line was assessed for woody species (i.e., 50 m × 5 m line) with each woody species identified and counted into shrub strata, S1 and S2, where S1 is the tallest layer and S2 is the shortest layer. A. purpureopetala plants were counted on both sides of the centre line. Full details on vegetation surveys associated with the transects can be found in [20]. Transect data for all woody species at each site were entered into a two-way table with counts for all species included in the matrix. The data was separated into S1 and S2 per site and a total count per species per site. This was used for estimating pairwise dissimilarity matrices (see below).
To obtain an estimate of total population size of A purpureopetala, sightings in areas adjacent to the transect were recorded. Once an individual plant was observed, a count was taken within a 10 m × 5 m area, along with a GPS waypoint. Counting in this fashion was not exhaustive but provided a replicable way to assess the number of individuals at each site.

2.2. Genomic Data

2.2.1. Single Nucleotide Polymorphic (SNP) Data

Fresh leaf material for DNA extractions were collected at each of the field sites (Figure 1). Samples were taken from along the transects and from widely spaced individuals throughout the remaining site. Some individuals were many 100 s of metres apart from the next sample. Location data (latitude and longitude) was collected for each sample and the spatial distribution of the tissue samples largely reflected that of the population. Leaf material was placed in paper envelopes placed in sealed plastic bags, kept cold, and express mailed to the Royal Botanic Gardens, Sydney, where material was lyophilised immediately upon arrival.
Approximately 7 ug of dried leaf material for each of 188 samples were sent to DArT Pty Ltd. (Canberra, Australia) for DNA extractions and medium density DArTseq. This whole genome double-restriction enzyme complexity reduction and high-throughput sequencing method [31] has been successfully applied to several studies of Australian native plants and animals, and more detailed descriptions of the methodology applied by the company can be found in published literature [32,33,34,35].

2.2.2. Genomic Data Analyses

The SNP data set provided by DArT Pty Ltd. was assembled through their proprietary analytical pipelines and was provided with quality informing statistics for each marker and sample. The SNP data was filtered based on several quality criteria using an in-house R package ‘RRtools v. 1′ see [32]: (1.) only SNPs with a reproducibility score> 98% were used (the reproducibility score is an index of the precision of genotype calls between technical replicate samples); (2.) SNP loci with missing genotype calls for greater than 10% of samples were removed; (3.) for markers with more than a single SNP, only one SNP was maintained in order to minimize the effect of linkage; and (4.) samples with a high percentage of missing data (greater than 40%) were excluded from the data. This left 14,565 SNPs and 184 samples to conduct a series of population genomic analyses.
A principal component analysis (PCA) was produced using the R package adegenet 2.0.1 [36] to assess genetic similarity at the individual and population level. Genetic structure analyses were performed using LEA (an R Package for Landscape and Ecological Association Studies, [37]), which estimates ancestry coefficients from large genotypic matrices and evaluates the number of ancestral populations. The snmf function (sparse Non-Negative Matrix Factorization algorithms) was implemented to estimate individual admixture coefficients from the genotype matrix. A measure of fit (i.e., the entropy criterion) is evaluated between the statistical model and the data to choose the best number of ancestral populations (K) that explain the data. Ten replicates were run for each value of K (K ranged from 1–20), wherein optimal K was selected by examining the post-stabilisation of the steepest decline in cross-entropy values, with the best replicate of optimal K selected from the lowest minimal cross-entropy values among the 10 replicates.
Population genetic diversity measures (allelic diversity, population size, observed heterozygosity, expected heterozygosity and inbreeding coefficient) were estimated for each sub-population (or collection sites) using the R package diveRsity [38] and poppR [39]. The R package SNPrelate [40] was used to estimate population pairwise Fst values based on the estimator of [41]. These diversity estimates were also calculated for three comparable sized data sets (sample size and sequencing depth for SNPs) of three species of Acacia (A. linifolia, A. longifolia and A suaveolens) with similar available data (DArTseq SNPs, samples size and sequencing depth) previously described in [16], allowing for a better understanding of levels of inferred genetic diversity in the study species.
The extent of genetic differentiation was tested by hierarchical analysis of molecular variance (AMOVA) in poppR [39]. Significance of variance components, differentiation between clusters, differentiation among locations within clusters, and differentiation among locations was assessed using a permutation test implemented through the randtest function with 9999 permutations.
Pairwise kinship matrices were estimated for each sub-population using SNPrelate package v1.17.1 [40].

2.3. Environmental Data

The CHELSA climate data set [42,43] was used to provide a representation of the climatic conditions experienced by A. purpureopetala at each field site. The CHELSA data was interpolated from observed weather data spanning 1979–2013. The data has a spatial resolution of 30 arc seconds (approximately 885 m at the mean latitude of the study sites). The downscaling method accounts for the interactions between humidity, air mass movement, and topography to better describe rainfall distribution [42]. The basic 19 bioclimatic variables [44] were used in this study. We also used the following non-climate variables to characterise the environment at each field site: percent sand, silt and clay in the soil, slope, aspect, topographic position index (a measure of a site’s location valley, mod-slope, ridge), and topographic wetness index (a measure of the amount of water movement a site may receive from upslope areas). Soil and topographic areas were downloaded from the CSIRO Data Portal [45] and resampled to the same grid as the CHELSA climate data. All GIS processing was performed using the raster package [46] in the R statistical environment.

2.4. Relationships between Genetic, Environmental, Floristic and Spatial Distances

We fitted a Generalised Dissimilarity Model (GDM) [47] with the Fst matrix as the dependent variable and geographical distance, environmental variables, and floristic distance as explanatory covariates. For spatial distance, we computed the Great Circle Distance (WGS84 ellipsoid) between sample locations with the function spDists function in the R package sp [48]. For floristic distances, a Bray-Curtis dissimilarity matrix was generated based on Hellinger transformed abundance matrices using the function vegdist in Vegan [49]. The GDM was fitted using the package gdm in the R statistical environment [50,51].

2.5. Optimising Genetic Diversity for A Germplasm Collection

To be able to provide practical guidance to conservation practitioners regarding a genetically diverse germplasm collection, we used the genomic data to investigate how best to capture genetic diversity. For this analysis we used a SNP data set where all loci with missing data were removed (resulting in 6830 SNPs) along with a minor allele frequency of >3% as the threshold delimiting common SNPs. This represented a trade-off between keeping data for as many SNPs as possible, while removing variation that might be especially subject to genotyping error (especially singletons). We utilised the algorithms available in OptGenMix [35] available at [52] to explore sampling design using different subsets of genotyped individuals. First, we evaluated whether sampling size influence diversity (Figures S2 and S3), and based on the results, we proceeded with sampling sizes, 12, 24, 36, 48, and 60. We then simulated sampling in two ways. One of which is a genetic-based approach of sampling of individuals using simulated annealing optimization algorithm [53] to choose a subset of the available plants that maximized the value of gene diversity (expected heterozygosity) [54]. The output from this provided a benchmark of the maximum genetic diversity that can be captured under each sampling regime. Subsequently, we also chose individuals at random from the genotyped individuals for each sampling size. This was repeated 100 times, and outcomes were averaged to inform the level of diversity that could be expected if sampling was random.
From the diversity estimates, Fst and AMOVA, we were already aware that much variation resides between the field sites and we thus explored the effect of sampling from subsets of field sites rather than across all samples on diversity capture. We tested selecting only 5, 6, 7, 8, 9, 10, 11, and 12 sites (for this study we combined Jumna and Dargo as these are close in proximity and only six samples were available from Jumna), specifying that a more or less equal number of individuals should be collected from each of the selected sites to reach a sampling size of 12, 24, 36, 48, and 60 individuals. Each random selection was repeated 100 times. The “more or less equal” sampling regime across sites was set up as we felt that this emulated a field collection best.

3. Results

3.1. Floristic Data

A total of 13 transects were established to represent vegetation coverage across the distribution of A. purpureopetala at each accessible field site (Figure 1). Incidentally, two new sub-populations were discovered while conducting the surveys. Woody species diversity varied both between shrub layers at each site and between sites (Table A1). Total diversity ranged from 16–32 species and was not associated with the altitude of the transects. The different shrub layers contributed unevenly towards total diversity, with some sites recording higher site diversity from the taller shrub layer (S1) (e.g., field site Mount Misery East), whilst others had a greater diversity within the lower shrub layer (S2) (e.g., field site Emuford). Estimated numbers of A. purpureopetala at each site varied between 67–561 but these were not reflected in the abundance of the study species along each transect and are likely a better representation of total species number per site. The total area covered in the genetic sampling largely reflected the total area covered by the site survey.

3.2. Genotype Data

Medium density DArTseq analysis of 188 samples of A. purpureopetala resulted in a SNP matrix of 21659 SNPs. After removal of SNPs according to missing data and the reproducibility score, 14565 SNPs and 184 samples were retained for genomic data analyses.

3.2.1. Cluster Analyses

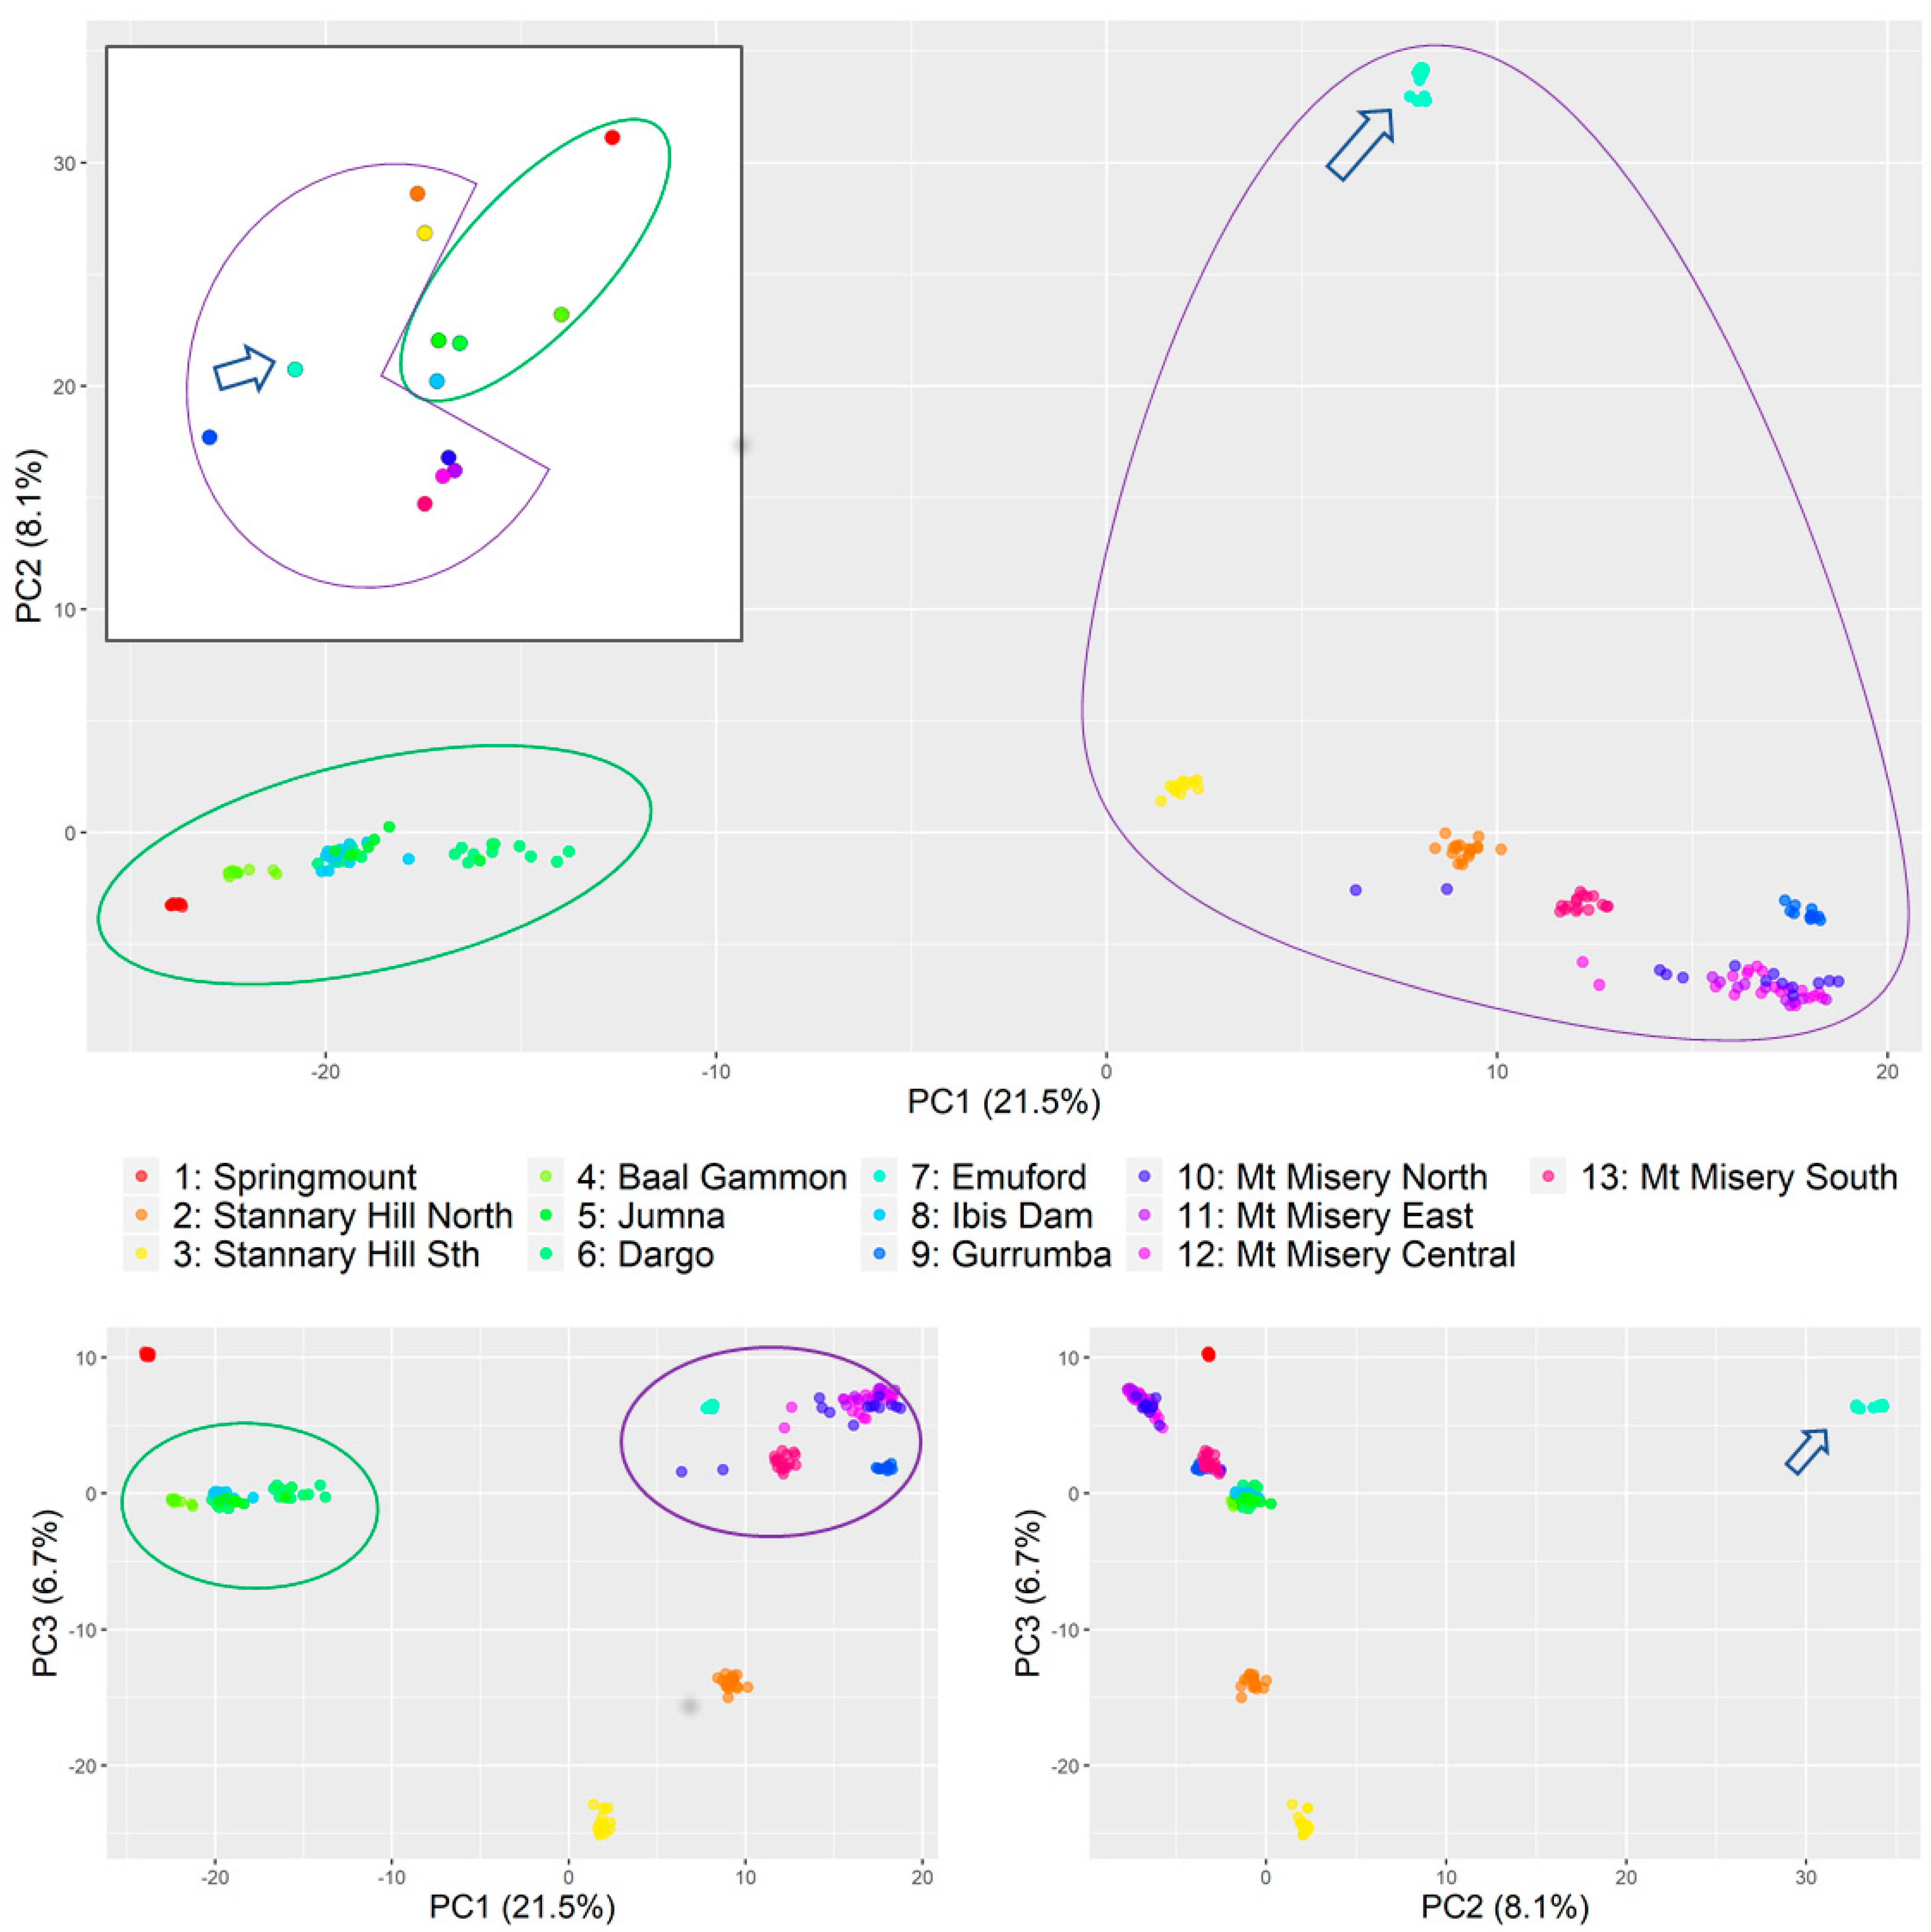
  • Principal component analysis (Figure 2) found that most of the variations were explained by the first component (21%), which indicated two strongly differentiated genetic groups (Figure 2, green and purple shapes) with component two also clearly distinguishing a third small cluster consisting only of the individuals collected at Emuford (blue arrow). Principal component three further segregated Stannary Hill North (orange), Stannary Hill South (yellow), and Springmount(red) into distinctive small clusters.
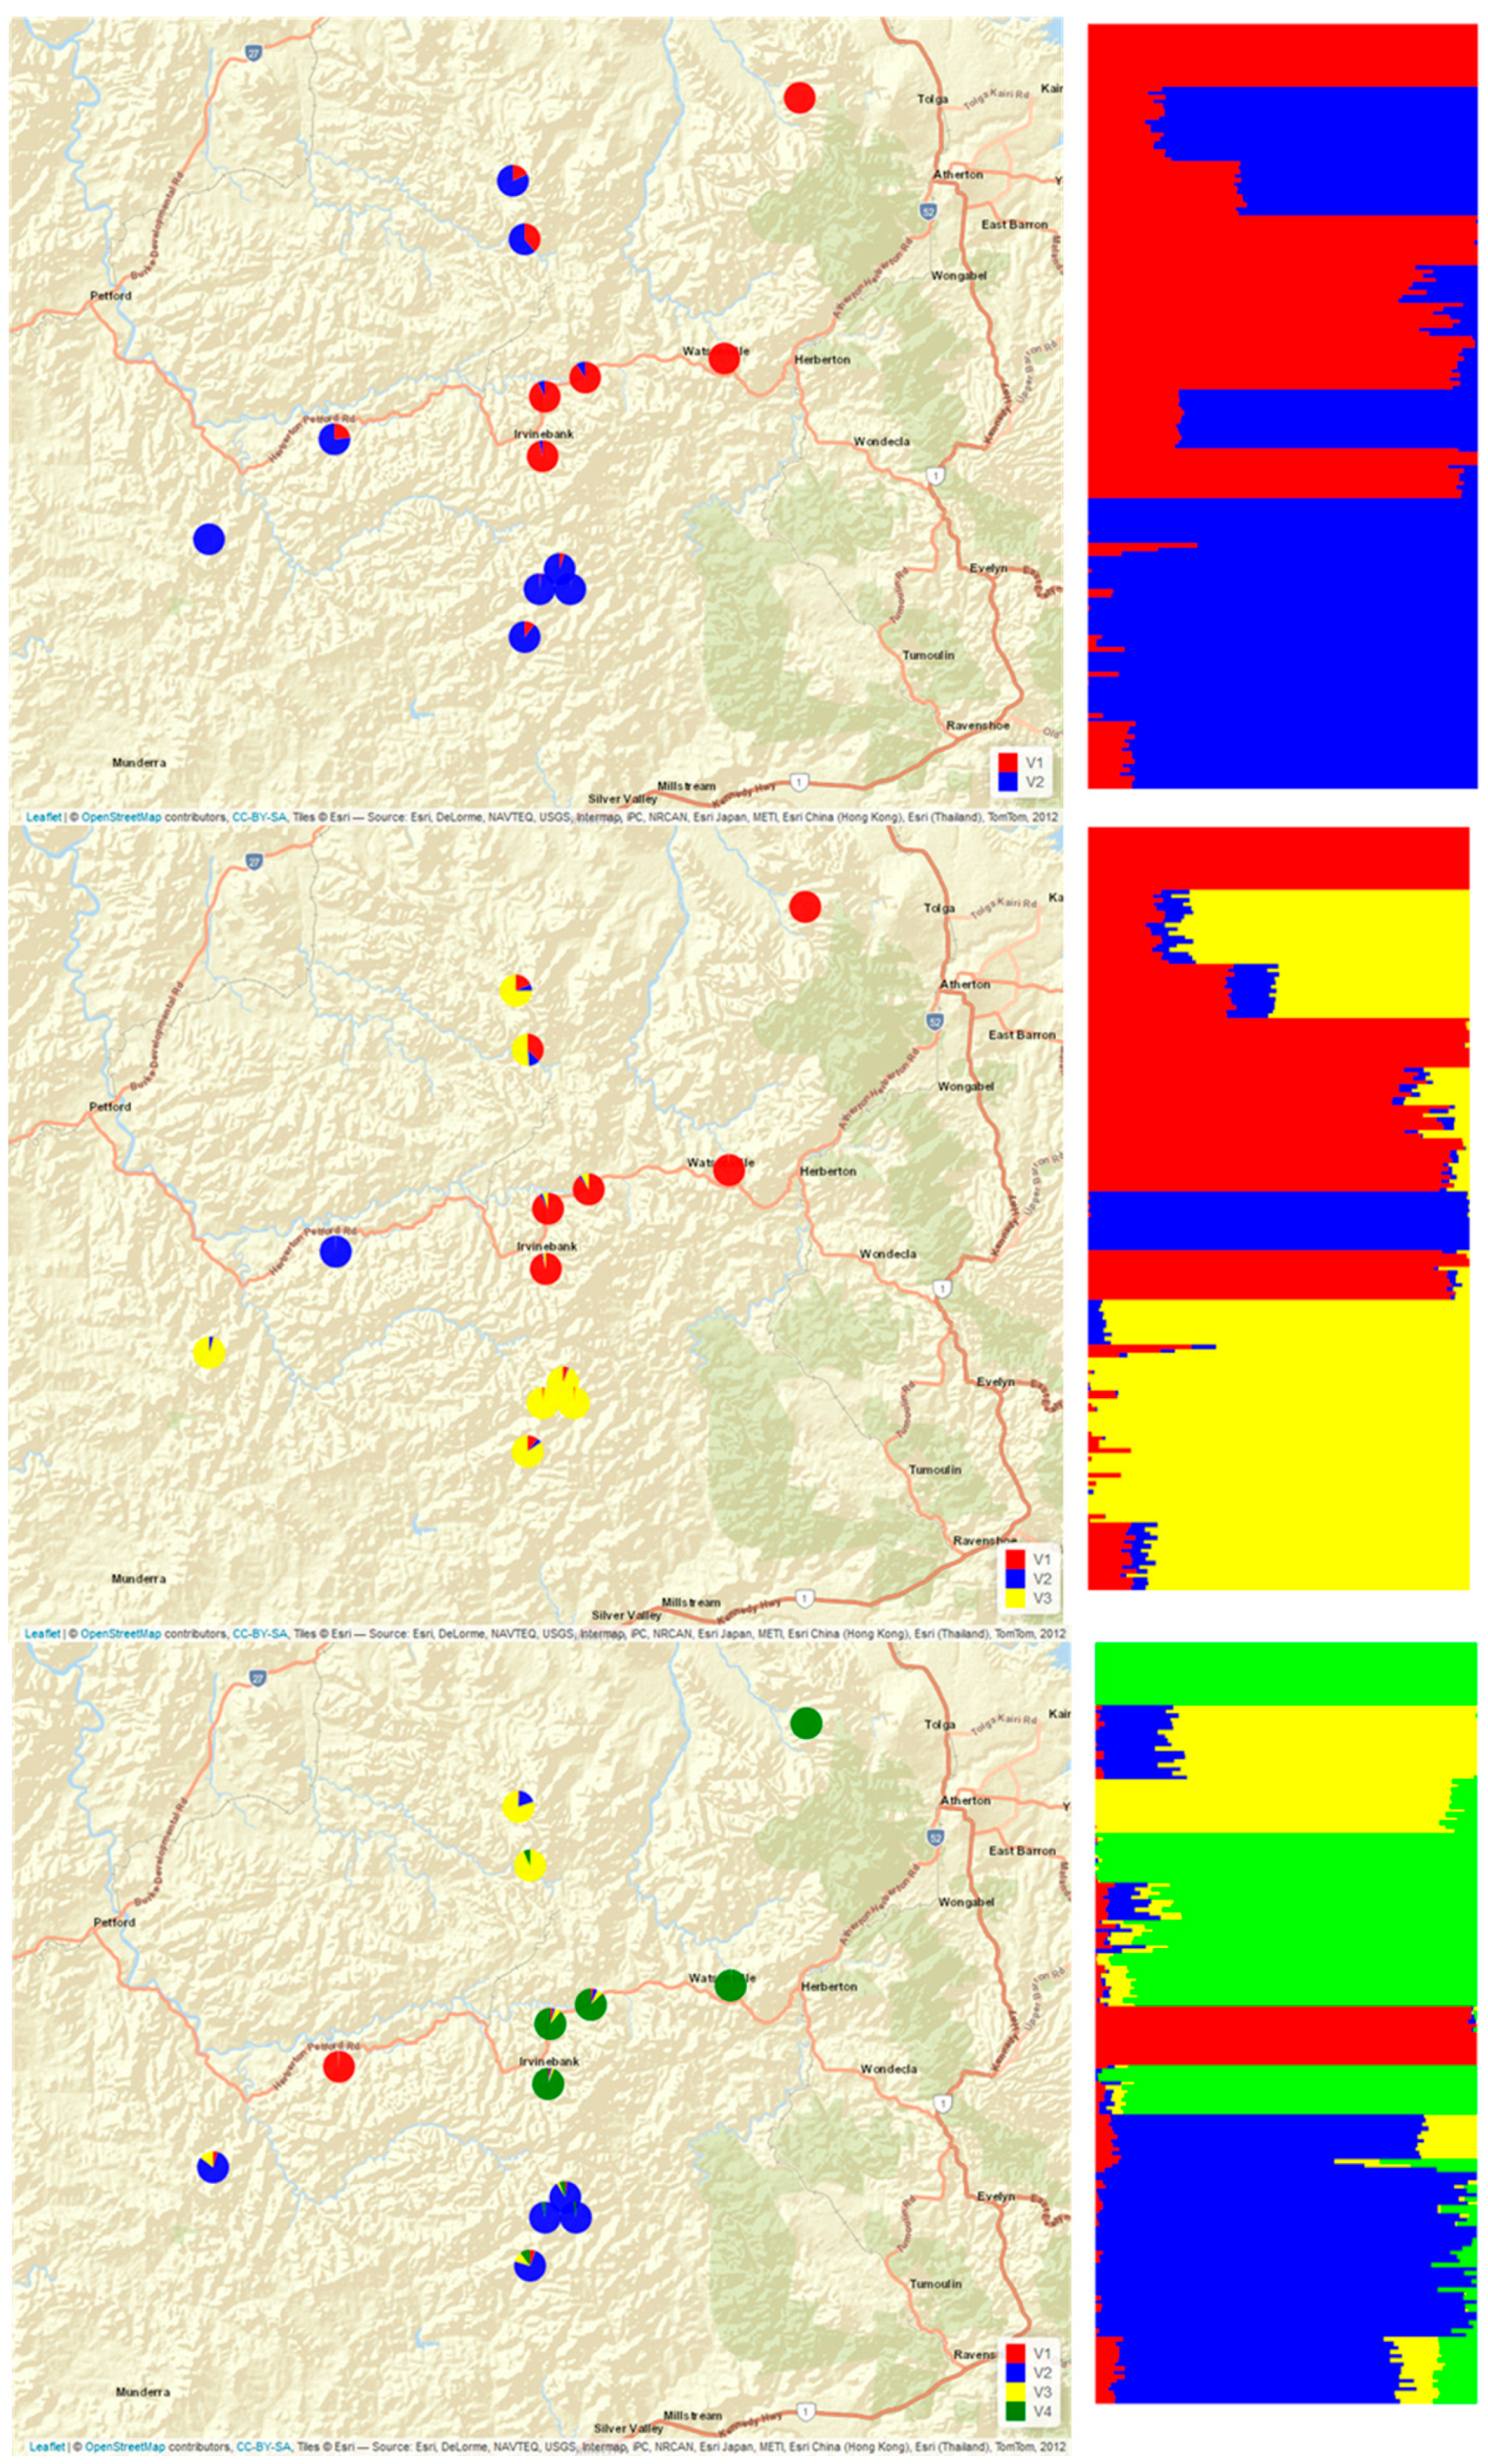
  • With the snmf analysis (Figure A1) performed in LEA, K = 2 supported the clustering of all samples from Baal Gammon, Dargo, Jumna, and Springmount as one group and all samples from Mt Misery (Central, East, North, South), Gurrumba and Emuford as the second group, while the samples from Stannary Hill North and South and Emuford were not clearly identified as belonging to either. With K = 3, the three inferred structure groups corresponded to the groups identified on PC1vs PC2 plot. The assignments to K = 4 was congruent with the clusters obtained across the three main principal components.
  • The analysis of variance (Table 1) indicated substantial variation between sites (60%) as well as between the two groups (33%) identified with the principal component analysis.

3.2.2. Population Genomic Diversity Estimates

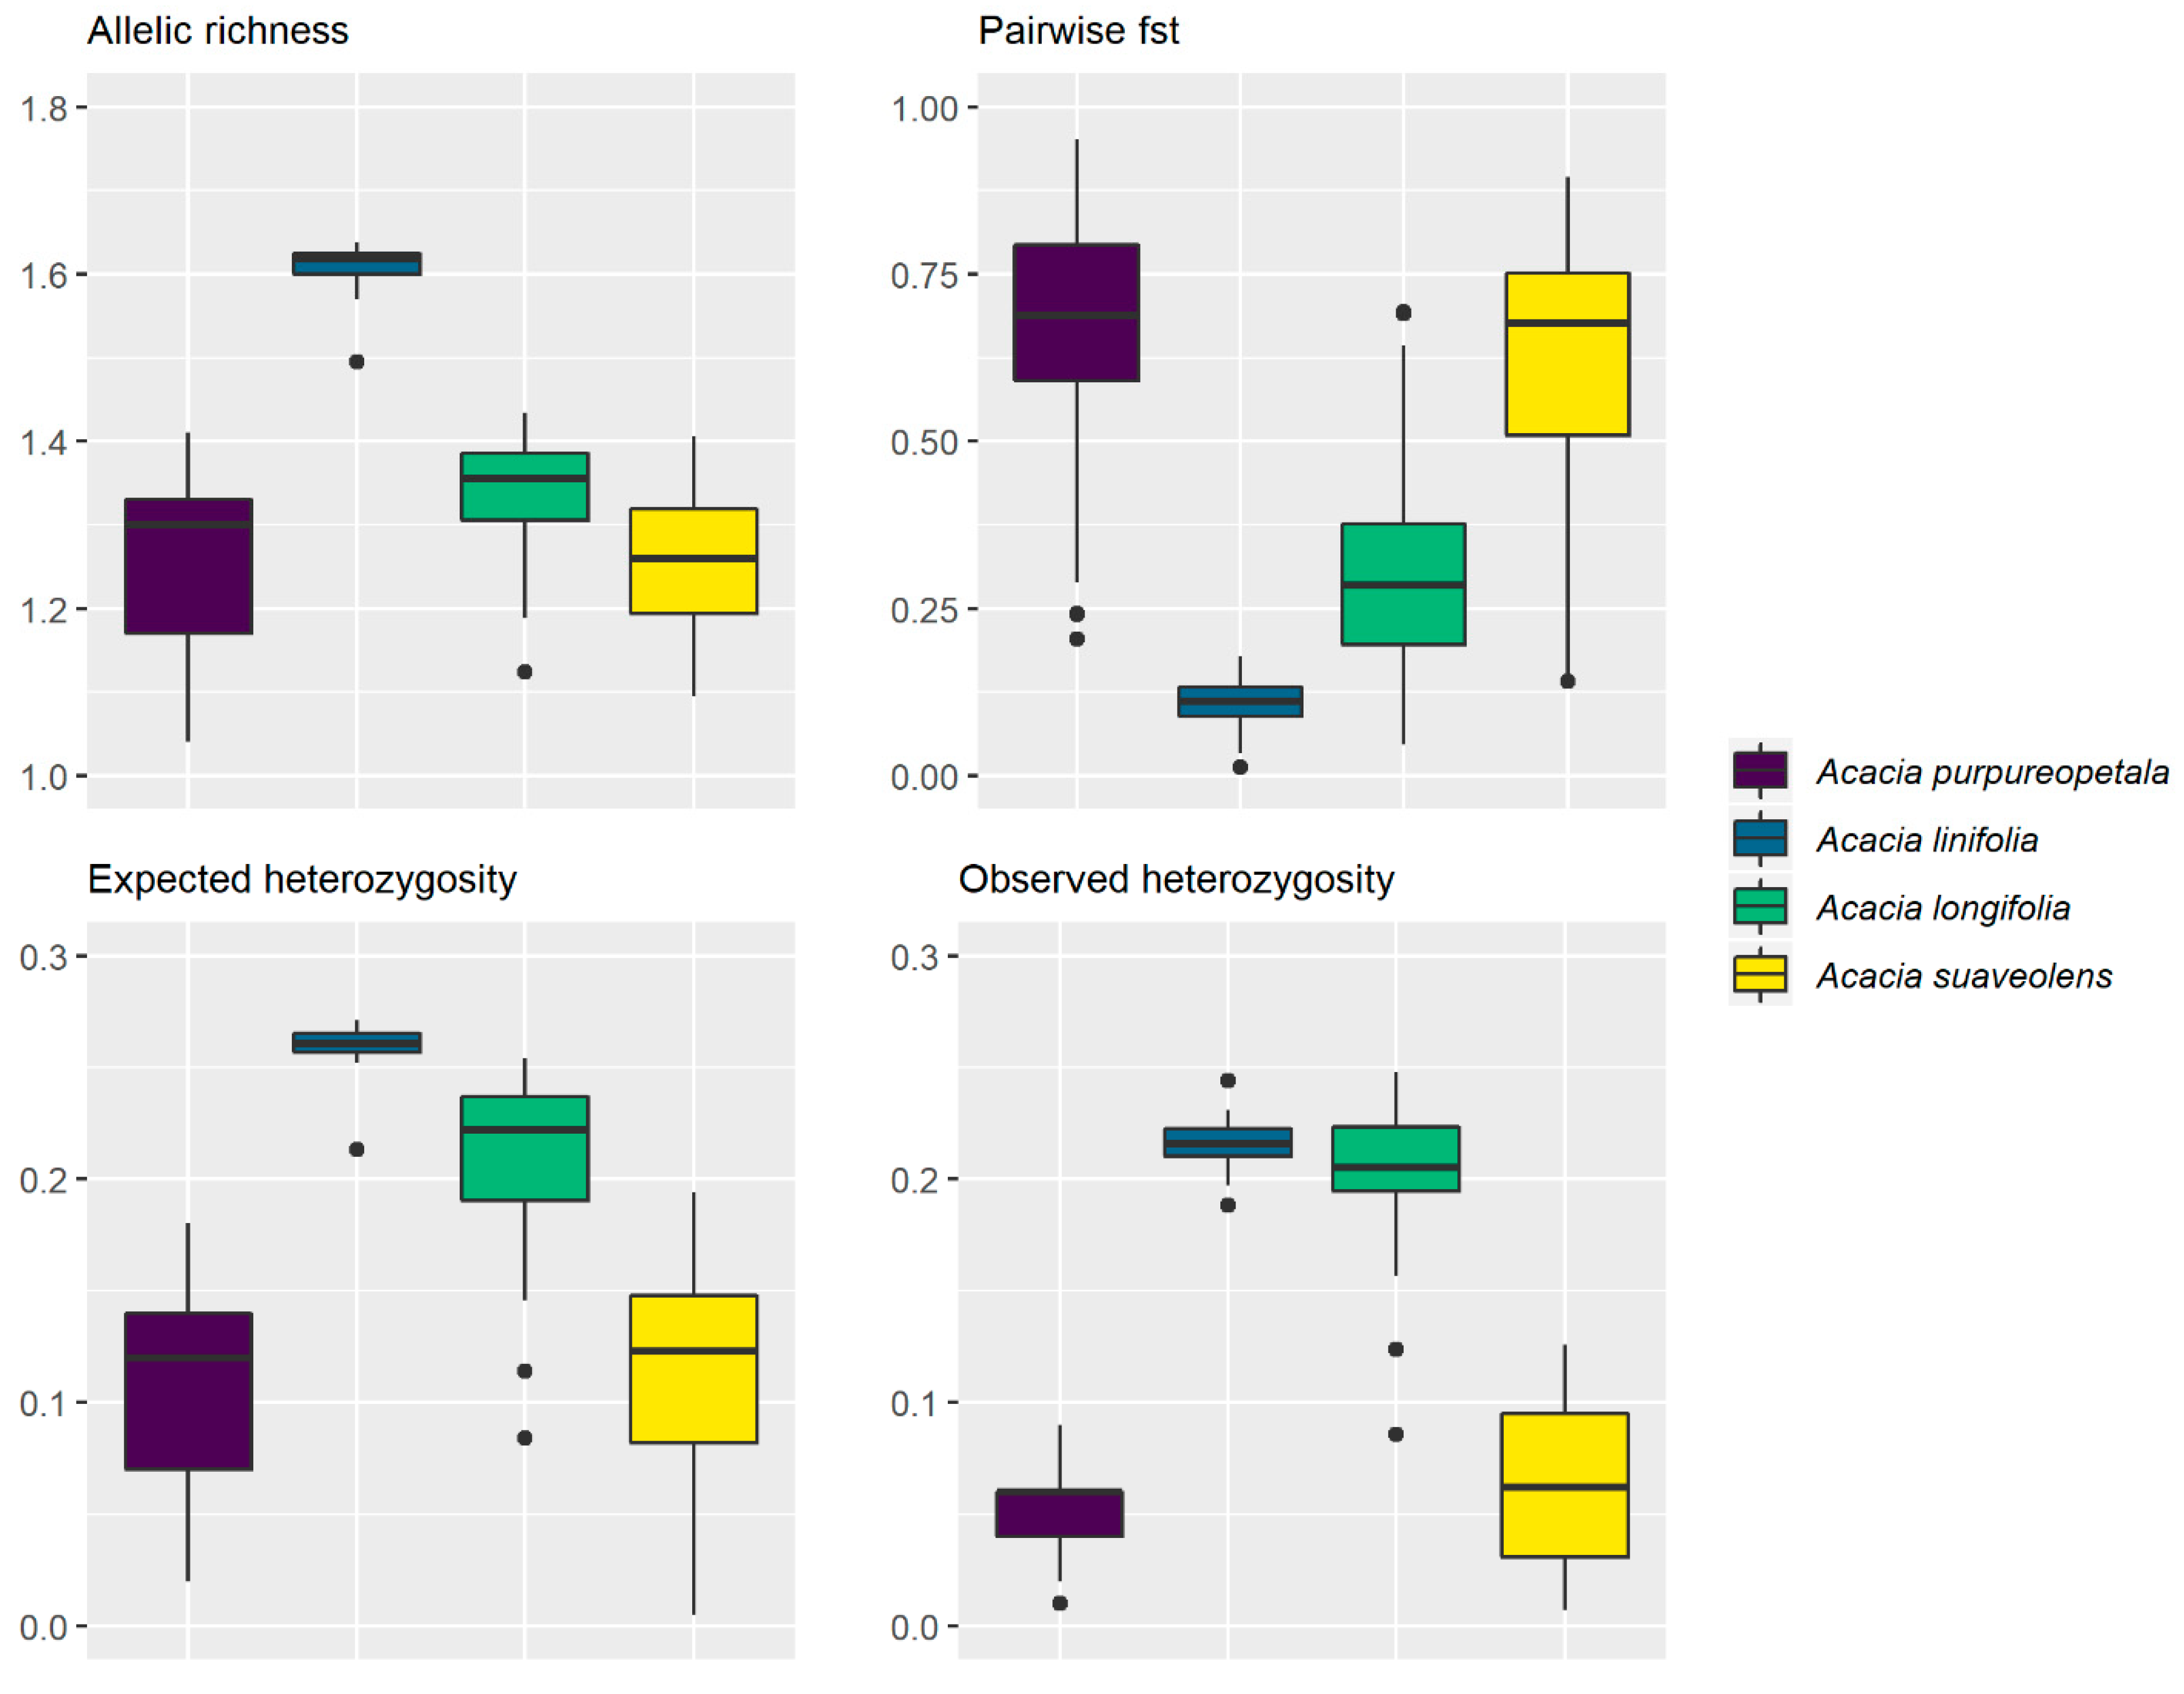
Commonly used population genomic estimates are provided in Table 2 and summarized in Figure A2 along with estimates from three other Acacias for which similar data were available to us through the Restore and Renew project [32]. For A. purpureopetala, overall observed heterozygosity was almost always lower than expected heterozygosity, which contributed to the positive Fis values (ranging between 0.1 for Springmount and 0.69 for Dargo). We found that four of the five sites with lowest allelic richness (Springmount, Baal Gammon, Emuford and Gurrumba) were also the sites most isolated and disjunct from any other known site. Springmount and Emuford both harbored least allelic richness, lowest observed and expected heterozygosity, and highest average kinship (Table S2).
Comparable genomic data for three additional species of Acacia (available to us through the Restore and Renew project [16,32]) allowed us to assess the levels of inferred diversity against other species with similar phylogenetic background. While the three additional species occur across a much bigger area (estimates of Area of Occupancy and Extent of Occurrence provided in Table S1), similar numbers of SNPs were found in three of the four species with the same sequencing depth as provided by Dart Pty Ltd. Striking differences were found between diversity statistics amongst the four species (Figure A2; Table S1) with A. purpureopetala showing the lowest average Ho and He amongst all species and highest Fis. The Ho, He, and ar as well as pairwise Fst estimates amongst field sites (Table S2; 0.2 to 0.9) were most like A. suaveolens, and this species has been found to have a mixed mating system with high levels of selfing within some populations [56]. More details of the three additional species of Acacia species are available [16].

3.3. Relationships between Genomic Data and Ecological Data

We explored linear relationships between genomic diversity estimates and floristic diversity (abundance of A. purpureopetela and species diversity at each field-site; Table S2) but did not find any positive or negative correlations suggesting that neither population at a site nor species diversity of the associated vegetation are indicative of genetic diversity of the study species (results not shown and not explored further).
A GDM approach with spatial distance, environmental variables, and floristic distance as predictors of genetic difference between field sites revealed all three covariate groups contributed significantly to the model. The model quality was found to be good (Figures S4 and S5). The strongest contributor to Fst values between field sites was spatial distance, with a strongly non-linear relationship to Fst (Figure S6). Also making strong contributions to the model were aspect and bioclimatic variables 3 (isothermality), 12 (annual rainfall), and 14 (driest monthly precipitation, and floristic difference.). Weak contributions were provided by several other bioclimatic and topographic variables (Figure S6).

3.4. A Collecting Strategy to Optimise Genetic Diversity

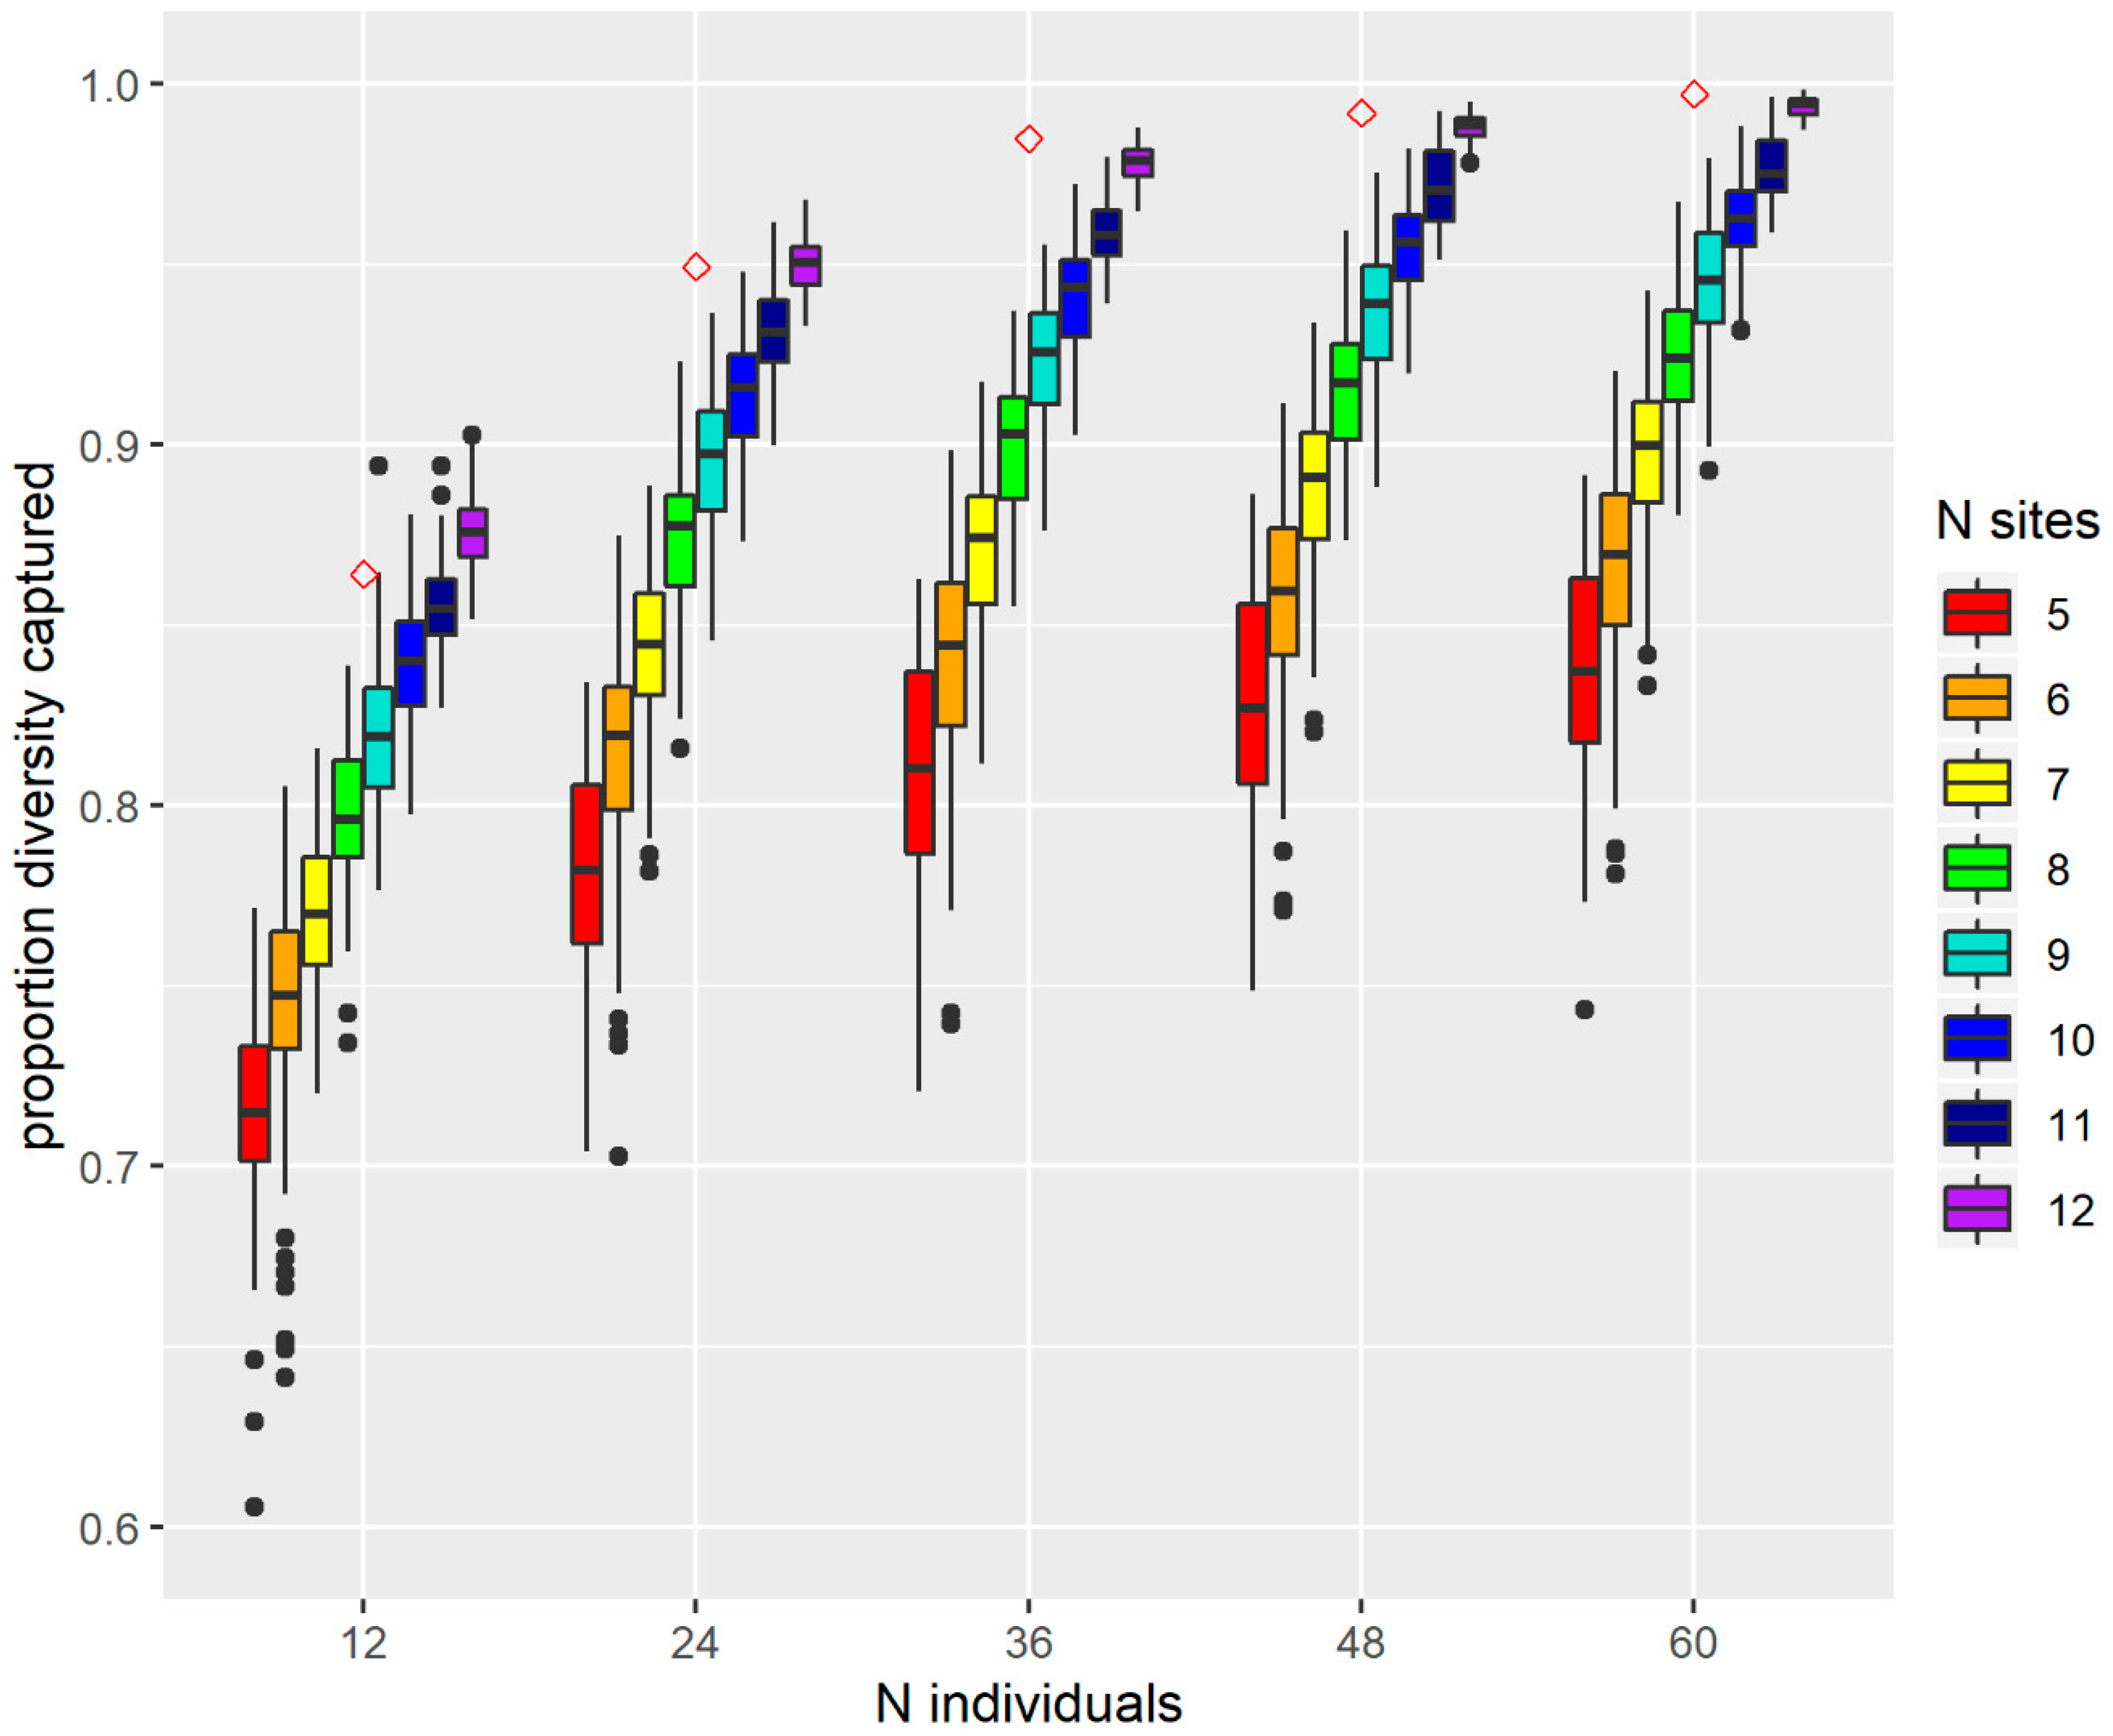
Using OptGenMix [52]. it was found that with very few samples a large amount of the genetic diversity present amongst the genotyped samples can be captured (Figures S2 and S3). In fact, with as few as 24 samples (out of 184), over 90% of the diversity were captured with an optimised sampling strategy (Figure 3 and Figure S3). This is slightly lower to the OptGenMix output for other threatened species used in translocations with the asymptote achieved at higher levels of sampling [57]. Exploring the level of genetic diversity captured through a semi-randomised approach (Figure 3), we found that strategies that include more field sites captured a greater depth of genetic diversity (expressed by genetic distance). By including five randomly selected samples from each site, a maximum diversity was captured. This was always higher than when collecting more individuals from 10 or less sites. As it is most likely that the sampling for the genetic work did not capture all available diversity, these numbers should not be taken literally as an indication of how many samples should be collected at each site.

4. Discussion

Here, using the genome complexity reduction method, DArTseq, we investigated the population genomic structure of the fragmented, geographically-restricted, and threatened species, Acacia purpureopetala. We used environmental, floristic, and spatial information to establish if the genetic patterns can be explained by variation in habitat in order to understand how the outcomes of the genetic data can be explained and should be applied to conservation as understanding demographic processes are crucial for successful conservation [58].
The matrix of polymorphic loci recovered for A. purpureopetala suggests that the available genetic variation residing in this species are very similar to other more widespread Acacias [16]. However, we found very low levels of diversity (Ho, He and ar) at the field sites, suggesting repeated levels of inbreeding through biparental inbreeding and self-fertilisation [59]. Furthermore, the most isolated and disjunct populations are likely experiencing severe bottlenecking as these are most genetically depauperate. The large number of individual plants found at each site does not reflect the severely low levels of inferred genetic diversity, suggesting that inbreeding depression is not (yet) affecting this generation [60] but could be affecting the next generation. Very high levels of divergence between field sites (high Fst values and 60% of the variation between sites) and low heterozygosity such as found here for A. purpureopetala have been associated with organisms with mixed mating systems [61], where in small populations drift can quickly lead to fixation following inbreeding amongst close relatives [22]. Low levels of heterozygosity have not consistently been found in other rare or threatened Acacia species (such as A. sciophanes [17] and A. whibleyana [18]), but we found very similar patterns of genomic diversity indices to that of the widespread A. suaveolens. For this species, genotyping of seedlings and mothers indicated that the low levels of heterozygosity are due to self-fertilisation and biparental inbreeding [56].
Several factors may have contributed towards the inferred pattern of genomic diversity (large divergence amongst populations, low diversity at field sites and high levels of kinship/genetic similarity amongst spatially adjacent individuals) for this species but the absence of long and medium distance pollen and seed dispersal agents is most likely a large contributor [24,62,63]. This species lacks many of the traits associated with seed dispersal, and while speculative, it is likely that the fixed purple flower colour in A. purpureopetala (contrasting with other Acacias with creamy to bright yellow flowers) does not attract the same suite of commonly available pollinators. Thus, the species may have to rely heavily on self-fertilisation and is further subjected to biparental inbreeding as individuals close by are likely to be of close kin due to the lack of seed dispersal.
Clonality can lead to low within-population diversity and high Fst and high estimates of kinship within populations [64], but we did not observe any suckering during extensive field surveys and the species does not resprout after fire. Apomixis could potentially account for the high levels of kinship, however, detailed developmental studies will be needed to confirm this and in general apomixis is often associated with polyploidy.The low levels of heterozygosity suggests that this species is not polyploid. Polyad pollen (clusters of 2–32 pollen grains from one stamen) common in Acacia [65] could also contribute to high levels of kinship within pods, but we do not have data at this fine scale.
The reproductive advantage of a self-compatible system (along with possibility of polyad pollen contributing to multiple ovules fertilised by the same male) may work well for colonisation and range expansion by only one or a few propagules [66], but it leads to an increase of a small number of highly similar genotypes. In the absence of continuous gene flow from source populations, such a strategy will lead to a rapid breakdown of heterozygosity that can lead to genetic erosion and long term this can lead to a lack of adaptability particularly when conditions change [67]. While it is now well-known that increased levels of homozygosity and inbreeding may lead to inbreeding depression (a lack of fitness), at least for now the ability to successfully produce offspring through self or biparental inbreeding provides A. purpureopetala with a mechanism to survive while conditions are suitable to the available genotypes in each population. However, relatively low seed production and germination has been observed in this species and this already raises questions regarding inbreeding depression. With habitat loss listed as one of the major threats to this species [12], populations may become further disconnected allowing for even less gene flow.
While A. purpureopetala occupies only a small area, SNP data indicates strong genetic structure across the landscape with field sites in relatively close proximity not necessarily belonging to the same clusters (Figure 2). These broader clusters may reflect historical patterns of expansion and contraction with divergence between them, which is most likely exacerbated by genetic drift. More detailed experimentation may unravel the relationship between environment and genetic diversity further and will be needed to fully understand the demography of the species [58]. Spatial distance is often an easy variable to visualise and imagine in regard to gene flow and connectivity, but it is often hard (or impossible) to explain genetic breaks that cannot be defined by a measurable attribute. Each field-site is likely to be under different selective forces, however, we highlight that sites with low diversity are also those that are spatially disjunct.s. In the case of Springmount (an environmental and spatial outlier), it is difficult to explore the severe bottlenecking, but it could be due to a small founder event where the selective forces for successful migration are too strong against new arrivals or that selection facilitated rapid genetic purging [68].

Application of Population Genomics to A Conservation Management Plan for the Purple Wattle

As the sampling strategy for this project was aimed at capturing the broad representation of genetic diversity across and within field sites, our results are highly informative for future conservation management of the species. For A. purpureopetala, it is likely that a seed collection will reflect lower levels of diversity than what was found in this dataset because of the chances of the seed generation being subject to further inbreeding through self-fertilisation. In addition, practitioners should take note that sampling numbers in Figure 3 are based on available genotyped samples and should not be seen as the total number of individuals to sample. The amount of genetic diversity in a collection based on vegetative material and seed material will also vary according to factors such as strike rate of cuttings, timing of collecting, conditions at the “ex-situ site”, and seed viability, and these can differ across genotypes and time [69,70], where possible conservation practitioners are urged to monitor collections and augment these where possible and needed. We make the following practical recommendations that can be applied to seed collecting or a collection based on vegetative cuttings based on the genomic results.
1. All populations matter and material for a germplasm conservation collection (seed or living material) should focus on collecting material from all available sites regardless of low heterozygosity or low allelic richness [71,72].
2. By increasing the distance between individuals at each site, likelihood of collecting from half-siblings will decrease. While the seed from one individual will not necessarily increase the genetic diversity of a germplasm collection due to low seed viability observed by other researchers, multiple seeds can be collected, but to maintain maternal lines seed collectors should not pool seeds from either sites or individuals and record the location details carefully aligning with recommendation by [73].
3. To increase genetic diversity at a site outcrossing should be encouraged through assisted gene flow and admixture between field sites [18]. This can be done through hand pollination aimed at cross fertilisation between individuals with different genotypes. Such crosses could include individuals within specific genetic groups such as the green or purple group in Figure 1. However, since we found little correlation between genetic distance and environmental distance, crosses could include samples across a wide array of genetic clusters and this will result in more diversity and new unique genotypes while also diluting the spatial genetic structure of the species. An alternative option would be to produce crosses in controlled glass house conditions. The seed can be used to augment wild populations devoid of heterozygosity and be added to germplasm collections. Short term, this may lead to higher levels of fitness at seed and seedling level and long term will reduce the risk of losing diversity even further through drift. In particular, the disjunct populations that displayed exceptionally low levels of allelic variation and observed heterozygosity should be targets for genetic augmentation. Monitoring will be required to ensure that the introduced genotypes are not swamped by the local inbred populations or the opposite that local adaptive genes are lost [74]. Seed collections can be made prior to introductions to ensure local genotypes are not lost due to swamping.
4. In situ management should conserve genetic connectivity amongst sites by aiming to reduce fragmentation in these areas (field sites with lower pairwise Fst, Table S3).
5. As this species has such unique flowers and an attractive sprawling habit, we cannot resist raising the idea of implementing horticulture as a tool for ex situ conservation and genetic rescue for this species, which has successfully been implemented for cycads [75]. However, unlike traditional horticultural practices where there is often selection for a specific trait, we would encourage active hand crosses and seed harvesting that can augment germplasm collections that originated from in situ field-sites. Commercially available purple wattle may also alleviate the pressure of illegal collecting of this species [12].

5. Conclusions

While current abundance of the individuals of this species at each field site indicates that Acacia purpureopetala is likely to be downlisted from Critically Endangered to Vulnerable under IUCN criteria and is therefore unlikely to get conservation priority, the excessive low levels of heterozygosity inferred from the genomic data ring alarm bells for the long term future of this species. Disjunct populations are valuable for the unique genetic diversity harboured at these sites while the more connected populations are valuable for higher levels of heterozygosity and recombination amongst genotypes. The low germination and seedling survival observed by researchers may well be the early warning signs of inbreeding depression for this species, and implementation of a germplasm collection from seed should happen rapidly to avoid further loss of diversity through drift and inbreeding. Population genomic studies that cover the distribution of a species are highly informative for conservation and are highly recommended to form part of the conservation management toolbox [76].

Supplementary Materials

The following are available online at https://www.mdpi.com/article/10.3390/d13040139/s1. Figure S1: Four images to illustrate the habitat occupied by A. purpureopetala in the Herberton region, Queensland Australia. Figure S2: Simulations of genetic diversity captured for different field sampling sizes (X-axis) of Acacia purpureopetala from total available genetic samples. For each sampling size, individuals were selected by optimising on the basis of gene diversity (genetic distance; red diamond symbol) and by choosing individuals at random (blue round symbol, representing means of 100 replicates). For both approaches, we obtained the SNPs that were ‘common’ in A. purpureopetala (minor allele frequency > 3%) and calculated the proportion of these that were polymorphic for each sampling size (Y-axis). Figure S3: This plot illustrates how the proportion of total diversity captured through increasing sampling from the available sample set in the A. purpureopetala DArTseq data set does not increase beyond a sample size of 60 individuals. We used OptGenMix (Bragg et al. 2020) to estimate the proportion of diversity based on maximising the genetic distance between samples. Figure S4 Plot showing predicted compositional dissimilarity against observed compositional dissimilarity. The close distribution of points around the smooth rising trend curve indicates that the fitted GDM can accurately relate observed genetic dissimilarity to predictor variables. Figure S5: Calibration plot for the fitted GDM. The strongly linear relationship between predicted ecological distance and observed compositional dissimilarity for pairs of sites shows that the model can accurately relate an observed value of Fst between sites to differences in the combined predictor variables. Figure S6: Contributions of predictor variables retained in the final fitted GDM. Table S1: A summary of genomic diversity estimates based on DArTseq data and geographic distribution size of four Acacia species with comparable sample sizes (given below the species name). Table S2: Average distance in meters and between samples of A. purpureopetala (based on latitude and longitude recorded during collecting using a handheld GPS) collected at each field site along with the average genetic distance amongst all the samples at each field site. Average Kinship was estimated from all pairwise estimates across samples in each site. Kinships analysis used a SNP matrix with no missing data. Table S3 Pairwise Fst estimated from a DArTseq SNP matrix across all known field sites. In Supplementary data S2 we provide a .csv file with the SNP calls for each sample as received from DArT Pty. Ltd.

Author Contributions

Conceptualization, M.M.v.d.M. and A.F.; methodology, A.F., M.M.v.d.M., J.-Y.S.Y.; formal analysis, M.M.v.d.M., H.T.M., A.F., P.D.W., J.-Y.S.Y.; data curation, M.M.v.d.M.; Writing—Original Draft Preparation, M.M.v.d.M.; writing—review and editing, M.M.v.d.M., A.F.; visualization, M.M.v.d.M., J.-Y.S.Y. and P.D.W.; funding acquisition, A.F. All authors have read and agreed to the published version of the manuscript.

Funding

Funding for field surveys and genotyping were received by Bush Heritage Australia from the Commonwealth Government’s Threatened Species Recovery Fund.

Institutional Review Board Statement

Not applicable

Informed Consent Statement

Not applicable

Data Availability Statement

The data presented in this study are available in supplementary material S2. This .csv file contain the singlerow SNP data received from DArT Pty Ltd. for Acacia purpureopetala.

Acknowledgments

We wish to thank Jason Bragg (Research Centre for Ecosystem Resilience) for support with modifying Scripts from OptGenMix, Paul Williams and Eleanor Collins for help with field surveys, Bush Heritage Australia for securing funding and coordinating the initial field surveys, and the time and constructive comments from the anonymous reviewers.

Conflicts of Interest

The authors declare no conflict of interest. The funders had no role in the design of the study; in the collection, analyses, or interpretation of data; in the writing of the manuscript, or in the decision to publish the results.

Appendix A

Figure A1. The assignment of ancestry coefficients of each individual sample inferred with snmf (top, K = 2; middle, K = 3 and bottom, K = 4) are illustrated here by site using the pie diagrams on the map on the left hand side and the bar plot on the right hand side. Samples on the bar plot are ordered according to latitude and thus largely align with that of the pie diagrams on the map on the left.
Diversity 13 00139 g0a1
Figure A2. Box whisker plots for genomic diversity measures and pairwise Fst for four Acacia species from SNP data across the known distribution of each species. Details of each measure for A. purpureopetala are provided in Table 2.
Diversity 13 00139 g0a2
Table A1. Species diversity across two substrata (taller shrub layer, S1 and lower shrub layer, S2) and the species count for A. purpureopetala across each transect (Ap Transect) and across the field site (Ap site). Field sites appear in the order of numbering on the map in Figure 1.
Field SiteAltitudeS1S2TotalAp TransectAp Site
Springmount640 m10151935459
Stannary Hill North830 m14182245411
Stannary Hill South830 m81115136551
Baal Gammon1040 m170173567
Jumna835 m8202163398
Dargo795 m13232735310
Emuford750 m8141666561
Ibis Dam950 m7171712468
Gurrumba735 m19193241105
Mount Misery North990 m1992363255
Mount MiseryEast935 m18122316339
Mount Misery Central1030 m191126100168
Mount Misery South960 m1842166204

References

  1. Convention on Biological Diversity. Available online: https://www.cbd.int/aichi-targets/ (accessed on 16 February 2021).
  2. Reed, D.H.; Frankham, R. Correlation between Fitness and Genetic Diversity. Conserv. Biol. 2003, 17, 230–237. [Google Scholar] [CrossRef]
  3. Vandewoestijne, S.; Schtickzelle, N.; Baguette, M. Positive correlation between genetic diversity and fitness in a large, well-connected metapopulation. BMC Biol. 2008, 6, 46. [Google Scholar] [CrossRef] [PubMed]
  4. Oostermeijer, J.; Luijten, S.; Nijs, J.D. Integrating demographic and genetic approaches in plant conservation. Biol. Conserv. 2003, 113, 389–398. [Google Scholar] [CrossRef]
  5. Schäfer, D.; Vincent, H.; Fischer, M.; Kempel, A. The importance of genetic diversity for the translocation of eight threatened plant species into the wild. Glob. Ecol. Conserv. 2020, 24, e01240. [Google Scholar] [CrossRef]
  6. Khan, S.; Nabi, G.; Ullah, M.W.; Yousaf, M.; Manan, S.; Siddique, R.; Hou, H. Overview on the Role of Advance Genomics in Conservation Biology of Endangered Species. Int. J. Genom. 2016, 2016, 3460416. [Google Scholar] [CrossRef]
  7. Supple, M.A.; Shapiro, B. Conservation of biodiversity in the genomics era. Genome Biol. 2018, 19, 131. [Google Scholar] [CrossRef]
  8. Miller, J.T.; Murphy, D.J.; Ho, S.Y.W.; Cantrill, D.J.; Seigler, D. Comparative dating of Acacia: Combining fossils and multiple phylogenies to infer ages of clades with poor fossil records. Aust. J. Bot. 2013, 61, 436–445. [Google Scholar] [CrossRef]
  9. Crisp, M.D.; Cook, L.G. How Was the Australian Flora Assembled Over the Last 65 Million Years? A Molecular Phylogenetic Perspective. Annu. Rev. Ecol. Evol. Syst. 2013, 44, 303–324. [Google Scholar] [CrossRef]
  10. Flora of Australia. Available online: https://profiles.ala.org.au/opus/foa/profile/Acacia (accessed on 16 February 2021).
  11. Species Profile and Threats Database. Available online: http://www.environment.gov.au/cgi-bin/sprat/public/sprat.pl (accessed on 15 March 2021).
  12. Australian Government, Department of Agriculture, Water and the Environment. Available online: https://www.environment.gov.au/biodiversity/threatened/species/30-plants-by-2020/purple-wattle (accessed on 16 February 2021).
  13. Kenrick, J.; Knox, R.B. Quantitative Analysis of Self-Incompatibility in Trees of Seven Species of Acacia. J. Hered. 1989, 80, 240–245. [Google Scholar] [CrossRef]
  14. PlantNET (The NSW Plant Information Network System). Royal Botanic Gardens and Domain Trust, Sydney. Available online: https://plantnet.rbgsyd.nsw.gov.au (accessed on 2 February 2021).
  15. Entwisle, T.J.; Maslin, B.R.; Cowan, R.S.; Court, A.B.  Acacia. In Flora of Victoria; Walsh, N.G., Entwisle, T.J., Eds.; Inkata Press: Melbourne, Australia; Sydney, Australia, 1996; Volume 3, pp. 586–656. [Google Scholar]
  16. Rossetto, M.; Wilson, P.D.; Bragg, J.; Cohen, J.; Fahey, M.; Yap, J.-Y.S.; Van Der Merwe, M. Perceptions of Similarity Can Mislead Provenancing Strategies—An Example from Five Co-Distributed Acacia Species. Diversity 2020, 12, 306. [Google Scholar] [CrossRef]
  17. Coates, D.J.; Tischler, G.; McComb, J.A. Genetic variation and the mating system in the rare Acacia sciophanes compared with its common sister species Acacia anfractuosa (Mimosaceae). Conserv. Genet. 2006, 7, 931–944. [Google Scholar] [CrossRef]
  18. Blyth, C.; Christmas, M.J.; Bickerton, D.C.; Faast, R.; Packer, J.G.; Lowe, A.J.; Breed, M.F. Increased Genetic Diversity via Gene Flow Provides Hope for Acacia whibleyana, an Endangered Wattle Facing Extinction. Diversity 2020, 12, 299. [Google Scholar] [CrossRef]
  19. Gleed, S.J.; Franklin, D.C. Purple-flowered Wattle (Acacia purpureopetala): Observations and surveys of a threatened plant found only in the Herberton-Irvinebank region. N. Qld. Nat. 2018, 48, 57–68. [Google Scholar]
  20. Ford, A.; Williams, P.; Collins, E. 2018 Ecological Assessment of Acacia purpureopetala; CSIRO Report to EPBC; CSIRO: Atherton, CA, USA, 2018.
  21. Maslin, B.R. Acacia purpureopetala. In Flora of Australia Volume 11A, Mimosaceae, Acacia Part 1; Orchard, A.E., Wilson, A.J.G., Eds.; CSIRO Publishing: Melbourne, Australia, 2001; p. 449. [Google Scholar]
  22. Slatkin, M. Gene flow and the geographic structure of natural populations. Science 1987, 236, 787–792. [Google Scholar] [CrossRef]
  23. Gilpin, M. The genetic effective size of a metapopulation. Biol. J. Linn. Soc. 1991, 42, 165–175. [Google Scholar] [CrossRef]
  24. Ouborg, N.J.; Vergeer, P.; Mix, C. The rough edges of the conservation genetics paradigm for plants. J. Ecol. 2006, 94, 1233–1248. [Google Scholar] [CrossRef]
  25. Young, A.; Boyle, T.; Brown, T. The population genetic consequences of habitat fragmentation for plants. Trends Ecol. Evol. 1996, 11, 413–418. [Google Scholar] [CrossRef]
  26. Margules, C.R.; Pressey, R.L. Systematic conservation planning. Nat. Cell Biol. 2000, 405, 243–253. [Google Scholar] [CrossRef]
  27. Whitlock, R.; Hipperson, H.; Thompson, D.; Butlin, R.; Burke, T. Consequences of in-situ strategies for the conservation of plant genetic diversity. Biol. Conserv. 2016, 203, 134–142. [Google Scholar] [CrossRef]
  28. Acacia purpureopetala SPRAT Profile. Available online: http://www.environment.gov.au/cgi-bin/sprat/public/publicspecies.pl?taxon_id=61156pl (accessed on 17 May 2017).
  29. Cheng, J.; Karambelkar, B.; Xie, Y. Leaflet: Create Interactive Web Maps with the JavaScript ‘Leaflet’ Library. R package Version 2.0.2. 2018. Available online: https://CRAN.R-project.org/package=leaflet (accessed on 17 March 2021).
  30. Neldner, V.J.; Wilson, B.A.; Dilleward, H.A.; Ryan, T.S.; Butler, D.W. Methodology for Survey and Mapping of Regional Ecosystems and Vegetation Communities in Queensland; Version 4; Queensland Herbarium, Queensland Department of Science, Information Technology and Innovation: Brisbane, Australia, 2017. Available online: https://publications.qld.gov.au/dataset/redd/resource/6dee78ab-c12c-4692-9842-b7257c2511e4 (accessed on 1 July 2018).
  31. Sansaloni, C.P.; Petroli, C.D.; Carling, J.; Hudson, C.J.; Steane, D.; Myburg, A.; Grattapaglia, D.; Vaillancourt, R.; Kilian, A. A high-density Diversity Arrays Technology (DArT) microarray for genome-wide genotyping in Eucalyptus. Plant Methods 2010, 6, 16. [Google Scholar] [CrossRef]
  32. Rossetto, M.; Bragg, J.; Kilian, A.; McPherson, H.; Van Der Merwe, M.; Wilson, P.D. Restore and Renew: A genomics-era framework for species provenance delimitation. Restor. Ecol. 2019, 27, 538–548. [Google Scholar] [CrossRef]
  33. Smith, A.L.; Hodkinson, T.R.; Villellas, J.; Catford, J.A.; Csergő, A.M.; Blomberg, S.P.; Crone, E.E.; Ehrlén, J.; Garcia, M.B.; Laine, A.-L.; et al. Global gene flow releases invasive plants from environmental constraints on genetic diversity. Proc. Natl. Acad. Sci. USA 2020, 117, 4218–4227. [Google Scholar] [CrossRef]
  34. Rutherford, S.; Van Der Merwe, M.; Wilson, P.G.; Kooyman, R.M.; Rossetto, M. Managing the risk of genetic swamping of a rare and restricted tree. Conserv. Genet. 2019, 20, 1113–1131. [Google Scholar] [CrossRef]
  35. Bragg, J.G.; Cuneo, P.; Sherieff, A.; Rossetto, M. Optimizing the genetic composition of a translocation population: Incorporating constraints and conflicting objectives. Mol. Ecol. Resour. 2020, 20, 54–65. [Google Scholar] [CrossRef] [PubMed]
  36. Jombart, T. Adegenet: A R package for the multivariate analysis of genetic markers. Bioinformatics 2008, 24, 1403–1405. [Google Scholar] [CrossRef] [PubMed]
  37. Frichot, E.; François, O. LEA: An R package for landscape and ecological association studies. Methods Ecol. Evol. 2015, 6, 925–929. [Google Scholar] [CrossRef]
  38. Keenan, K.; McGinnity, P.; Cross, T.F.; Crozier, W.W.; Prodöhl, P.A. Diversity: An R package for the estimation and exploration of population genetics parameters and their associated errors. Methods Ecol. Evol. 2013, 4, 782–788. [Google Scholar] [CrossRef]
  39. Kamvar, Z.N.; Tabima, J.F.; Grünwald, N.J. Poppr: An R package for genetic analysis of populations with clonal, partially clonal, and/or sexual reproduction. PeerJ 2014, 2, e281. [Google Scholar] [CrossRef]
  40. Zheng, X.; Levine, D.; Shen, J.; Gogarten, S.M.; Laurie, C.; Weir, B.S. A high-performance computing toolset for relatedness and principal component analysis of SNP data. Bioinformatics 2012, 28, 3326–3328. [Google Scholar] [CrossRef]
  41. Weir, B.S.; Hill, W.G. Estimating F-Statistics. Annu. Rev. Genet. 2002, 36, 721–750. [Google Scholar] [CrossRef]
  42. Karger, D.N.; Conrad, O.; Böhner, J.; Kawohl, T.; Kreft, H.; Soria-Auza, R.W.; Zimmermann, N.E.; Linder, H.P.; Kessler, M. Climatologies at high resolution for the earth’s land surface areas. Sci. Data 2017, 4, 170122. [Google Scholar] [CrossRef]
  43. Chelsa. Available online: https://chelsa-climate.org (accessed on 12 October 2020).
  44. Booth, T.H.; Nix, H.A.; Busby, J.R.; Hutchinson, M.F. Bioclim: The first species distribution modelling package, its early applications and relevance to most current MaxEnt studies. Diver. Distrib. 2014, 20, 1–9. [Google Scholar] [CrossRef]
  45. CSIRO Data Access Portal. Available online: https://data.csiro.au/dap (accessed on 12 March 2021).
  46. Hijmans, R.J. 2020 Raster: Geographic Data Analysis and Modeling, R Package Version 3.4-5; 2020. Available online: https://rdrr.io/cran/raster/ (accessed on 11 March 2021).
  47. Ferrier, S.; Manion, G.; Elith, J.; Richardson, K. Using generalized dissimilarity modelling to analyse and predict patterns of beta diversity in regional biodiversity assessment. Divers. Distrib. 2007, 13, 252–264. [Google Scholar] [CrossRef]
  48. Pebesma, E.J.; Bivand, R.S. Classes and methods for spatial data in R. R News 2005, 5, 9–13. [Google Scholar]
  49. Oksanen, J.; Blanchet, F.G.; Friendly, M.; Kindt, R.; Legendre, P.; McGlinn, D.; Minchin, P.R.; O’Hara, R.B.; Simpson, G.L.; Solymos, P.; et al. Vegan: Community Ecology Package. R package Version 2.5-5. 2019. Available online: https://rdrr.io/cran/vegan/ (accessed on 5 December 2020).
  50. R Core Team. R: A Language and Environment for Statistical Computing; R Foundation for Statistical Computing: Vienna, Australia, 2018; Available online: https://www.R-project.org (accessed on 10 September 2020).
  51. Fitzpatrick, M.C.; Mokany, K.; Manion, G.; Lisk, M.; Ferrier, S.; Diego Nieto-Lugilde, D. GDM: Generalized Dissimilarity Modeling. R Package Version 1.4.2.1. 2021. Available online: https://CRAN.R-project.org/package=gdm (accessed on 11 March 2021).
  52. Jasonbragg/OptGenMix. Available online: https://github.com/jasongbragg/OptGenMix (accessed on 15 October 2020).
  53. Kirkpatrick, S.; Gelatt, C.D.; Vecchi, M.P. Optimization by Simulated Annealing. Science 1983, 220, 671–680. [Google Scholar] [CrossRef] [PubMed]
  54. Nei, M. Analysis of Gene Diversity in Subdivided Populations. Proc. Natl. Acad. Sci. USA 1973, 70, 3321–3323. [Google Scholar] [CrossRef] [PubMed]
  55. Excoffier, L.; Smouse, P.; Quattro, J.M. Analysis of molecular variance inferred from metric distances among DNA haplotypes: Application to human mitochondrial DNA restriction data. Genetics 1992, 131, 479–491. [Google Scholar] [CrossRef] [PubMed]
  56. Van der Merwe, M.M. Research Centre for Ecosystem Resilience; Royal Botanic Garden Sydney: Sydney, Australia, 2021; unpublished work.
  57. Bragg, J.G.; Yap, J.S.; Wilson, T.; Lee, E.; Rossetto, M. Conserving the genetic diversity of condemned populations: Optimizing collections and translocation. Evol. Appl. 2021. [Google Scholar] [CrossRef]
  58. Lande, R. Genetics and demography in biological conservation. Science 1988, 241, 1455–1460. [Google Scholar] [CrossRef]
  59. Pannell, J.R.; Voillemot, M. Evolution and Ecology of Plant Mating Systems; Wiley: Hoboken, NJ, USA, 2017; pp. 1–9. [Google Scholar] [CrossRef]
  60. Keller, L.F. Inbreeding effects in wild populations. Trends Ecol. Evol. 2002, 17, 230–241. [Google Scholar] [CrossRef]
  61. Whitehead, M.R.; Lanfear, R.; Mitchell, R.J.; Karron, J.D. Plant Mating Systems Often Vary Widely Among Populations. Front. Ecol. Evol. 2018, 6, 38. [Google Scholar] [CrossRef]
  62. Levin, D.A. Dispersal versus Gene Flow in Plants. Ann. Mol. Bot. Gard. 1981, 68, 233. [Google Scholar] [CrossRef]
  63. Doligez, A.; Baril, C.; Joly, H.I. Fine-scale spatial genetic structure with nonuniform distribution of individuals. Genetics 1998, 148, 905–919. [Google Scholar] [CrossRef] [PubMed]
  64. Balloux, F.; Lehmann, L.; De Meeûs, T. The population genetics of clonal and partially clonal diploids. Genetics 2003, 164, 1635–1644. [Google Scholar]
  65. Kenrick, J.; Knox, R.B. Function of the Polyad in Reproduction of Acacia. Ann. Bot. 1982, 50, 721–727. [Google Scholar] [CrossRef]
  66. Baker, H.G. Self-Compatibility and Establishment after ’Long-Distance’ Dispersal. Evolution 1955, 9, 347. [Google Scholar] [CrossRef]
  67. Charlesworth, B.; Charlesworth, D. The genetic basis of inbreeding depression. Genet. Res. 1999, 74, 329–340. [Google Scholar] [CrossRef]
  68. Frankham, R.; Gilligan, D.M.; Morris, D.; Briscoe, D.A. Inbreeding and extinction: Effects of purging. Conserv. Genet. 2001, 2, 279–284. [Google Scholar] [CrossRef]
  69. Griffith, M.P.; Clase, T.; Toribio, P.; Piñeyro, Y.E.; Jimenez, F.; Gratacos, X.; Sanchez, V.; Meerow, A.; Meyer, A.; Kramer, A.; et al. Can a Botanic Garden Metacollection Better Conserve Wild Plant Diversity? A Case Study Comparing Pooled Collections with an Ideal Sampling Model. Int. J. Plant Sci. 2020, 181, 485–496. [Google Scholar] [CrossRef]
  70. Griffith, M.P.; Barber, G.; Tucker Lima, J.; Barros, M.; Calonje, C.; Noblick, L.R.; Calonje, M.; Magellan, T.; Dosmann, M.; Thibault, T.; et al. Plant Collection “Half-life:” Can Botanic Gardens Weather the Climate? Curat. Mus. J. 2017, 60, 395–410. [Google Scholar] [CrossRef]
  71. Krishnan, S.; Ranker, T.A.; Davis, A.P.; Rakotomalala, J.J. The study of genetic diversity patterns of Coffea commersoniana, an endangered coffee species from Madagascar: A model for conservation of other littoral forest species. Tree Genet. Genomes 2013, 9, 179–187. [Google Scholar] [CrossRef]
  72. Griffith, M.P.; Calonje, M.; Meerow, A.W.; Tut, F.; Kramer, A.T.; Hird, A.; Magellan, T.M.; Husby, C.E. Can a Botanic Garden Cycad Collection Capture the Genetic Diversity in a Wild Population? Int. J. Plant Sci. 2015, 176, 1–10. [Google Scholar] [CrossRef]
  73. Wood, J.; Ballou, J.D.; Callicrate, T.; Fant, J.B.; Griffith, M.P.; Kramer, A.T.; Lacy, R.C.; Meyer, A.; Sullivan, S.; Traylor-Holzer, K.; et al. Applying the zoo model to conservation of threatened exceptional plant species. Conserv. Biol. 2020, 34, 1416–1425. [Google Scholar] [CrossRef] [PubMed]
  74. Silva, A.R.; Resende-Moreira, L.C.; Carvalho, C.S.; Lanes, E.C.M.; Ortiz-Vera, M.P.; Viana, P.L.; Jaffé, R. Range-wide neutral and adaptive genetic structure of an endemic herb from Amazonian Savannas. AoB Plants 2020, 12, plaa003. [Google Scholar] [CrossRef] [PubMed]
  75. Kay, J.; Strader, A.A.; Murphy, V.; Nghiem-Phu, L.; Calonje, M.; Griffith, M.P. Palma Corcho: A Case Study in Botanic Garden Conservation Horticulture and Economics. HortTechnology 2011, 21, 474–481. [Google Scholar] [CrossRef]
  76. Rossetto, M.; Yap, J.-Y.S.; Lemmon, J.; Bain, D.; Bragg, J.; Hogbin, P.; Gallagher, R.; Rutherford, S.; Summerell, B.; Wilson, T.C. A conservation genomics workflow to guide practical management actions. Glob. Ecol. Conserv. 2021, 26, e01492. [Google Scholar] [CrossRef]
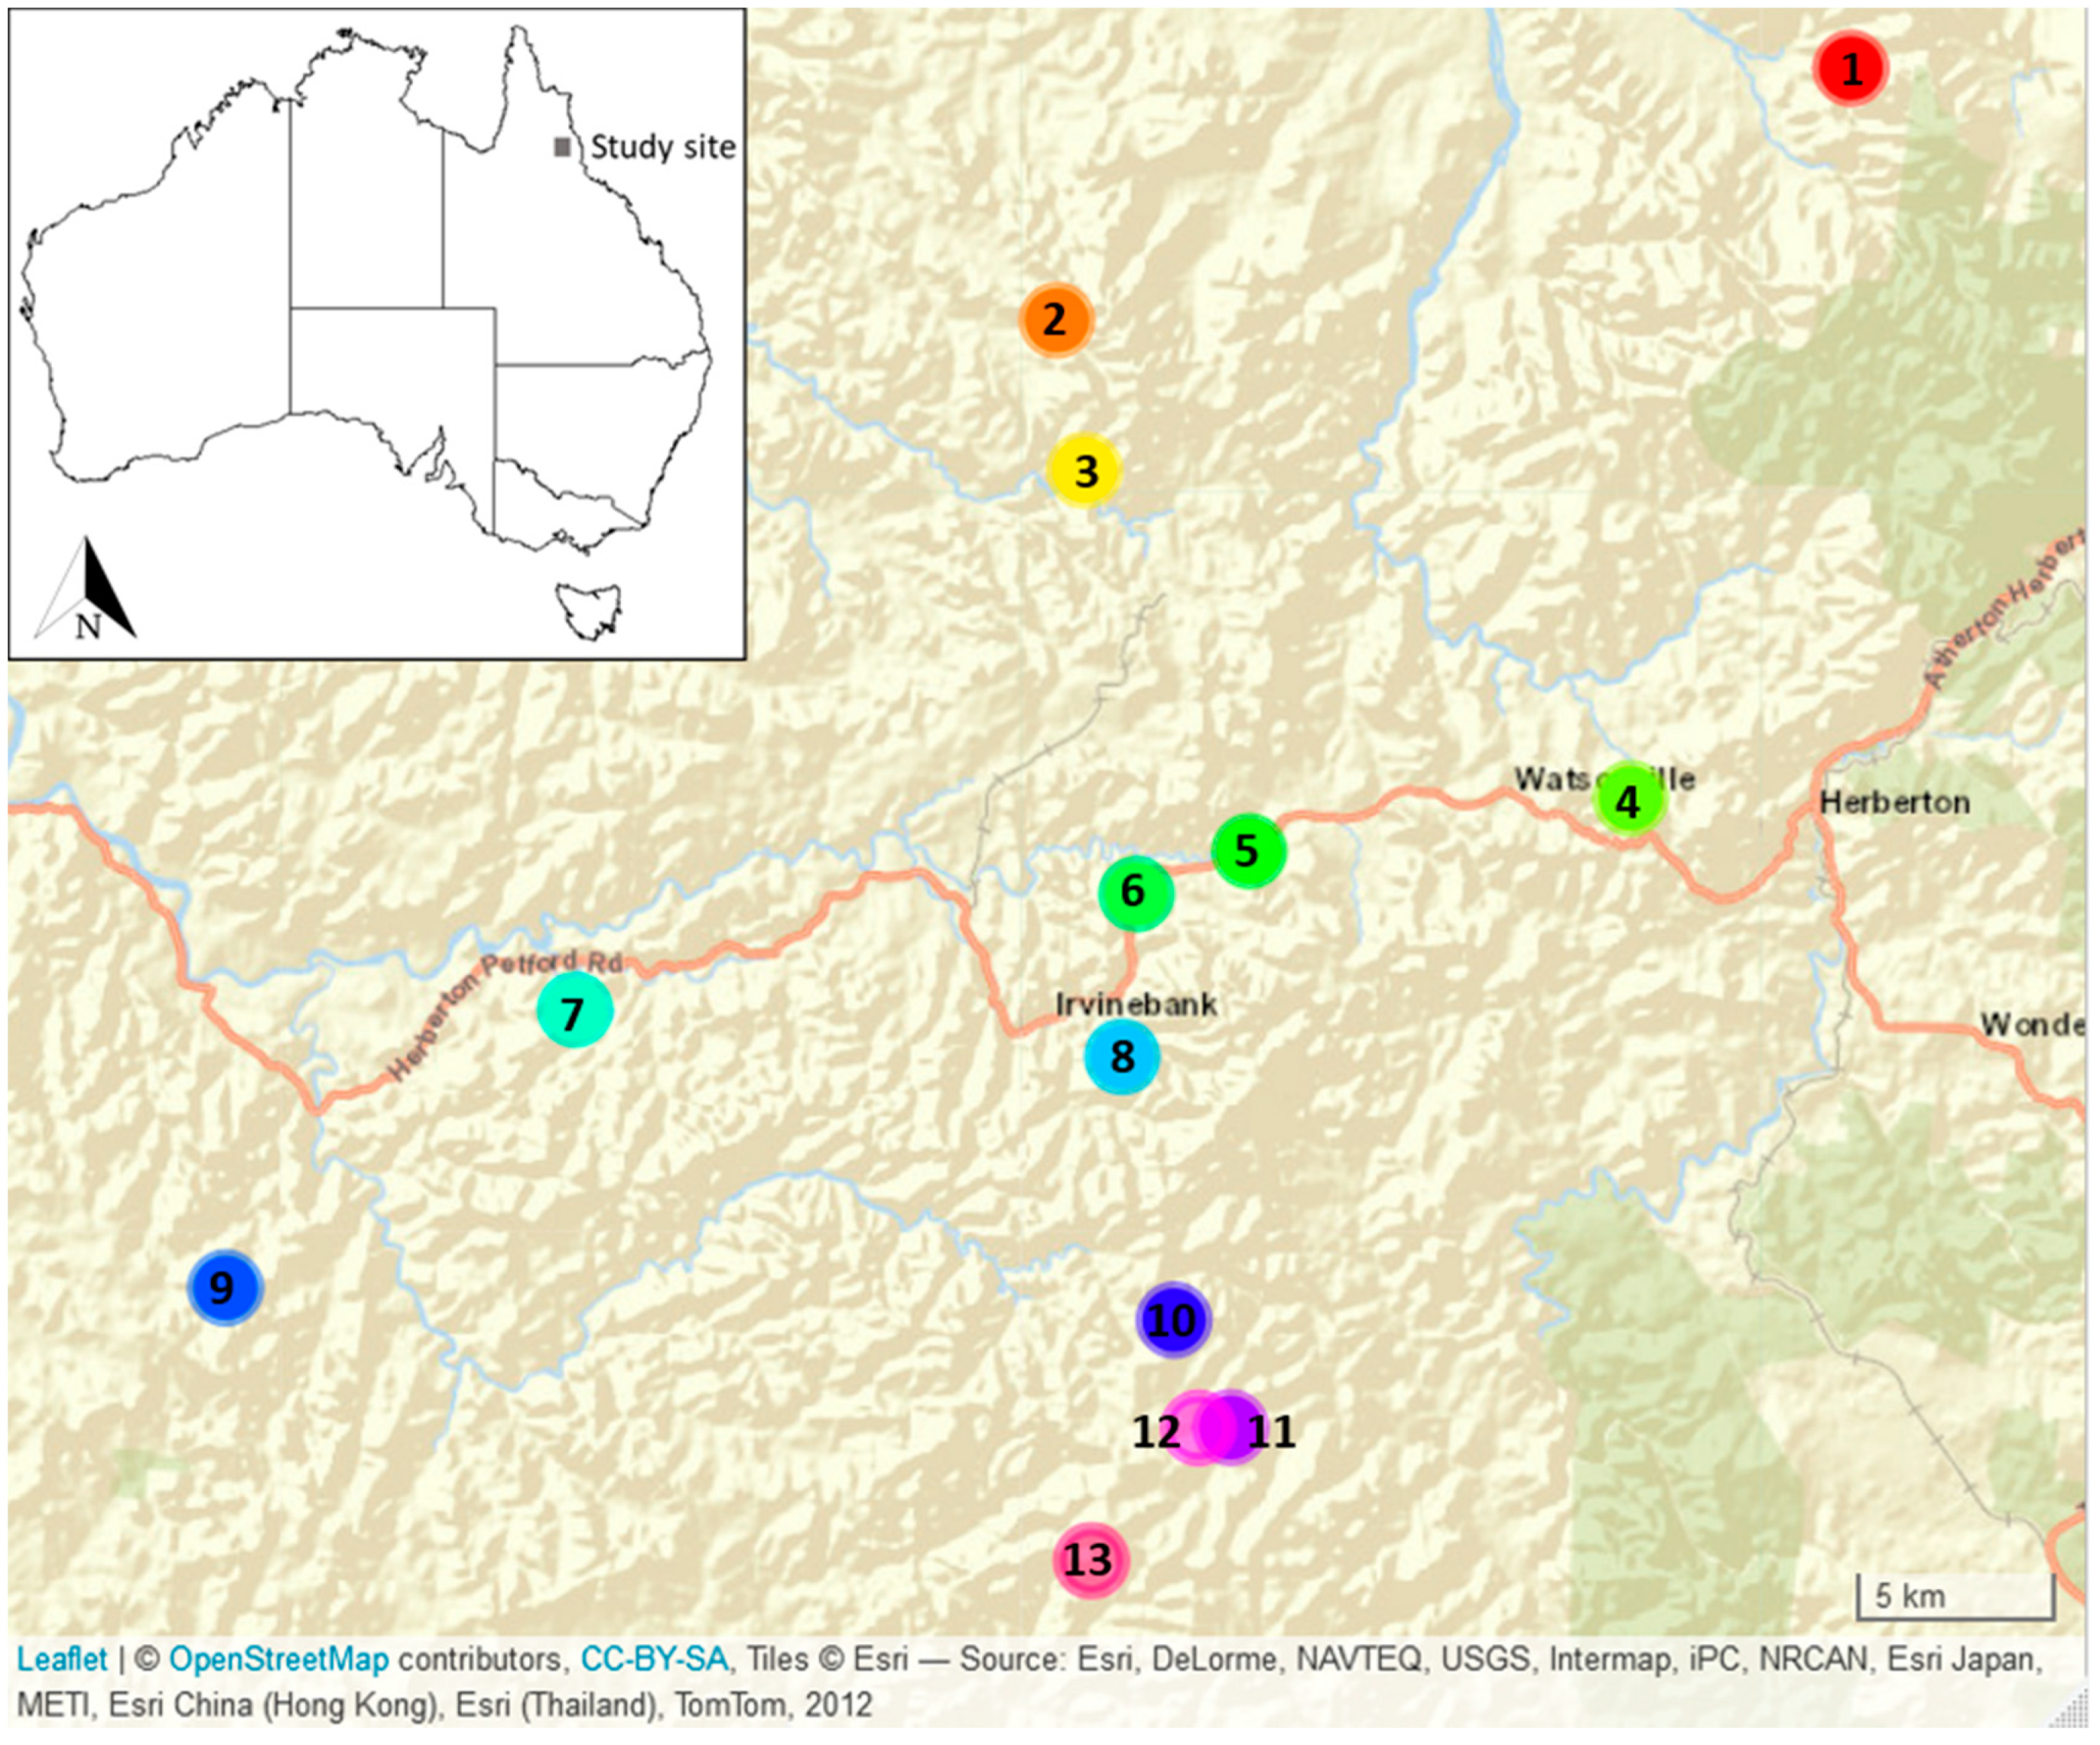
Figure 1. The location of the field sites for Acacia purpureopetala in far North Queensland, Australia. The map was produced in R using Leaflet [29] with an Esri World Street base layer. The numbering of sites following a North to South latitudinal change with site 1 = Springmount, 2 = Stannary Hill North, 3 = Stannary Hill South, 4 = Baal Gammon, 5 = Jumna, 6 = Dargo, 7 = Emuford, 8 = Ibis Dam, 9 = Gurrumba, 10 = Mt Misery North, 11 = Mt Misery East, 12 = Mt Misery Central and 13 = Mt Misery South.
Diversity 13 00139 g001
Figure 2. Three plots illustrating the relationships amongst individuals of Acacia purpureopetala inferred from principal components analysis based on SNP data. PC1 vs PC2 (top), PC1 vs PC3 (bottom left), and PC2 vs PC3 (bottom right). The percentage variation explained by each component is provided along the X and Y axis. PC1 separated two large clusters (indicated with purple and green shapes) while all samples from Emuford separated from these clusters along PC2 (blue arrow). The samples from Stannary Hill South (yellow dots) and North (orange dots) and Springmount (red dots) were further separated into distinct groups along PC 3. Samples from each field site are colour coded in the same colours used in Figure 1 and the relative geographic locations of the field sites are illustrated in the insert (top left corner).
Diversity 13 00139 g002
Figure 3. The proportion of genetic diversity captured, from that available amongst the genotyped samples, through different collecting strategies with different sample sizes (X-axis) and from a different number of randomly selected sites for A. purpureopetala. With a resulting sampling size of 24 individuals, sampling individuals from 12 sites captured significantly more diversity than from five sites (93 to 96% diversity vs 72 to 83%, p < 0.001). Sites were selected randomly from all available sites and individuals selected randomly from available individuals. Each box whisker plot summarises the sampling event across 100 randomisations. The red open diamond represents the “benchmark” of diversity to be captured across the entire dataset with each specified sample size.
Diversity 13 00139 g003
Table 1. Results from the Analysis of Molecular Variance for A. purpuereopetala SNP data. Two hierarchical levels were analysed: at the field site level and among groups (green and purple groups as based on the results from the PCA illustrated in Figure 2). d.f degree of freedom, SS = Sum of squares, Phi-statistics (Φ) according to [55].
Level of HierarchyPartitioningD.FSS% of VariationPhi Φ
Field sitesBetween sites11184,582.2600.599
Within sites172121,641.840
Total183306,224.0100
Among groups
(based on PCA)
Between group168,093.04330.44626
Between sites991,066.82300.627
Within sites159123,423.437
Total169282,583.31000.327
Table 2. Diversity estimates for 13 populations of A. purpuereopetala. Ar = allelic richness; size = average number of individuals genotyped per locus per population Ho = Observed heterozygosity, He = expected heterozygosity, Fis = inbreeding coefficient. Site numbers are as they appear on the map (Figure 1).
Site NumberSite NameSample SizeSizeArHoHeFis
1Springmount1514.751.040.020.020.10
2Stannary Hill North1817.441.320.060.140.50
3Stannary Hill South1312.561.170.030.070.45
4Baal Gammon1211.661.140.040.060.27
5Jumna65.771.290.060.120.42
6Dargo2423.171.410.050.180.69
7Emuford1413.691.050.010.020.23
8Ibis Dam1211.581.300.060.120.45
9Gurrumba1110.671.180.040.080.40
10Mt Misery North1413.591.390.060.160.54
11Mt Misery East109.681.300.070.120.39
12Mt Misery Central1918.381.410.090.160.38
13Mt Misery South1615.371.330.060.140.51
Publisher’s Note: MDPI stays neutral with regard to jurisdictional claims in published maps and institutional affiliations.