Abstract
Recent historical and anthropogenic changes in the landscape causing habitat fragmentation can disrupt the connectivity of wild populations and pose a threat to the genetic diversity of multiple species. This study investigated the effect of habitat fragmentation on the structure and genetic diversity of the Mexican greater funnel-eared bat (Natalus mexicanus) throughout its distribution range in Mexico, whose natural habitat has decreased dramatically in recent years. Genetic structure and diversity were measured using the HVII hypervariable domain of the mitochondrial control region and ten nuclear microsatellite loci, to analyze historical and contemporary information, respectively. The mitochondrial and nuclear results pointed to a differential genetic structuring, derived mainly from philopatry in females. Our results also showed that genetic diversity was historically high and currently moderate; additionally, the contemporary gene flow between the groups observed was null. These findings confirm that the effects of habitat fragmentation have started to be expressed in populations and that forest loss is already building barriers to contemporary gene flow. The concern is that gene flow is a process essential to ensure that the genetic diversity of N. mexicanus populations (and probably of many other forest species) distributed in Mexico is preserved or increased in the long term by maintaining forest connectivity between locations.
1. Introduction
The fragmentation of natural habitats is a key issue for biodiversity and poses a threat to the genetic diversity of multiple species [1,2,3,4]. Fragmentation is a process of the change in the spatial structure from a relatively homogeneous environment to one with a progressively less homogeneous structure that is ultimately transformed into a heterogeneous habitat. This can reduce the total area of a given habitat type, splitting the remaining habitat, and even increasing the isolation of remnants [5,6,7]. Habitat fragmentation disrupts the connectivity among populations of various taxa, reducing population genetic diversity and increasing population structuring [8,9,10,11], due to the genetic drift associated with low gene flow [12].
Bats are among the most abundant and diverse groups of mammals in tropical forests, playing a central role in pollination, regulation of insect populations, and seed dispersal [13,14]. Despite their ability to fly, bats are vulnerable to the loss of genetic variation in response to anthropogenic fragmentation in tropical forests [15,16,17].
The relationships between ecological characteristics (e.g., trophic level, relative load, abundance) and anthropogenic habitat fragmentation have been investigated mainly in phyllostomid bats [18,19,20,21,22]; however, the impacts of fragmentation on equally important flying insectivores remain largely unexplored [23,24].
Globally, between 2000 and 2015, deforestation rates of native forests ranged between 5770 and 10,483 million ha/year, causing losses of 124.8 million ha of native forests [25]. In the Neotropics, increased rates of land-use and land-cover change and a strong deforestation trend in the second half of the twentieth century have caused environmental degradation and biodiversity loss [26]. In Mexico, productive activities have transformed landscapes and led to the degradation and fragmentation of forest ecosystems, affecting their wildlife populations [27,28,29]. Deforestation rate estimates in Mexico range from 100,000 to 1.5 million hectares (ha) per year [30,31]. This rate varies for each type of vegetation. For instance, the low deciduous forest, which accounts for approximately 60% of tropical vegetation in Mexico [32], loses 650 thousand ha annually [33], while 13.69% of primary forests were transformed into secondary vegetation between 2001 and 2013 [34]. In the El Cabo region, Baja California Sur, sarcocaul shrubland is the vegetation type recording the highest average annual loss rate (2059 ha) [35].
A worrying consequence of habitat fragmentation is that its effects are reaching common species previously deemed as nonthreatened [36,37]. In this context, a population genetic study on an insectivorous bat species such as Natalus mexicanus Miller 1902, which is being affected by habitat fragmentation [38,39], will be very helpful to determine the effects of landscape alterations on this type of organism. Natalus mexicanus is a small-sized species with a delicate body weighing from 3.0 to 8.0 g [40]. In Mexico, this species is distributed across two separate narrow strips stretching along the Pacific coast (Sonora to Chiapas) and the Gulf of Mexico (Tamaulipas to Tabasco), which converge in the area from the Balsas depression to the Yucatan peninsula [41], at elevations from sea level to 2540 m [42]. It usually inhabits the interior of forests, showing less mobility in landscapes outside forests [19], and is more abundant in well-conserved forests [43], where it forages insects from surfaces among vegetation, avoiding open spaces [40,44]. The distribution pattern of N. mexicanus is common among tropical Mexican bats [45] and is generally explained by ecological requirements [46]. According to the International Union for Conservation of Nature (IUCN), this species has stable populations, supporting its classification in the Least Concern category [41]; furthermore, it is not listed by the Mexican government under any risk category [47]. It represents an ideal model of study to obtain information about the genetic impact of habitat fragmentation on common and widely distributed insectivorous bats.
The presence of two lineages in Mexico was identified using allozymes [48], one in the North and another in the South, likely related to the wide range of ecological and environmental conditions in which the species was found. Using the mitochondrial DNA cytochrome b gene, a genetic structuring pattern according to geographic distribution was also found [49], consisting of four genetics groups: (i) Central Depression of Chiapas, (ii) Veracruz/Tamaulipas, (iii) Pacific/Baja California Sur, and (iv) Central Valley of Oaxaca. Similar genetic structuring patterns have been reported for other bat species [50,51], where mountain ranges, depressions, and lowlands such as the Isthmus of Tehuantepec have served as important barriers to population dispersal and gene flow.
Considering that Natalus mexicanus is a sedentary, common, and habitat-dependent species, that inhabits the interior region of forests [40], the present study aims to test the hypothesis that the growing fragmentation of Mexican tropical habitats is affecting gene flow among their populations; as a result, populations—even those previously considered abundant and not threatened—are becoming increasingly isolated and more vulnerable to extinction. Our aim was to infer levels of population connectedness in N. mexicanus throughout its distribution range in Mexico, where the natural landscapes have been fragmented as a result of human activities, and to test whether population genetic isolation is occurring due to the lack of dispersion. To this end, we have integrated information from molecular markers with different inheritance modes (mtDNA and microsatellites) that will allow the evaluation of the historical and contemporary genetic structure and diversity of natalid bats in Mexico.
2. Materials and Methods
2.1. Sampling
Between 2004 and 2014, tissue samples were collected from Natalus mexicanus specimens inhabiting 21 locations throughout their geographic range in Mexico (Table S1 and Figure 1). Bats were captured using harp traps and mist nets, and wing membrane biopsies were collected with a 3 mm biopsy punch (Fray Products Corp., Buffalo, NY, USA). Tissue samples were preserved in 70% of ethanol and deposited at −20 °C at the tissue collection of the Laboratorio de Biología y Ecología de Mamíferos de la Universidad Autónoma Metropolitana-Iztapalapa (UAMI), Mexico. The captured bats were released, except for some individuals who were preserved as vouchers and deposited at the Mammal Collection of the UAMI (catalog numbers: RLW300713Nme3–RLW300713Nme10).
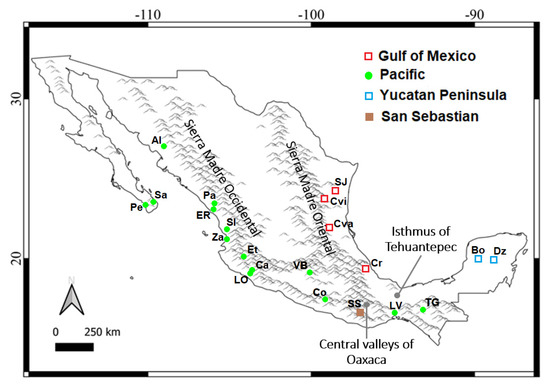
Figure 1.
Map of the localities where samples of Natalus mexicanus were collected. Acronyms are as follows (locality, federal entity): Pe—Pescadero, B.C.S.; Sa—Santiago, B.C.S.; Al—Álamos, Son.; Pa—Pánuco, Sin.; ER—El Rosario, Sin.; SI—Santiago Ixcuintla, Nay.; Za—Zacualpan, Nay.; Et—Etzatlán, Jal.; LO—Los Ortices, Col.; Ca—Cardona, Col.; VB—Valle de Bravo, E. Mex.; Co—Colotipla, Gro.; SS—San Sebastián, Oax.; LV—La Venta, Oax.; TG—Tuxtla Gutiérrez, Chis.; Dz—Dziuché, Q. Roo; Bo—Bolonchén, Cam.; Cr—Carrizal, Ver.; Cva—Ciudad Valles, S.L.P.; Cvi—Ciudad Victoria, Tam.; SJ—Santander Jiménez, Tam. Symbols indicate the groups derived from genealogical analyses; major historical geographic barriers are indicated.
Specimen collection protocols and animal handling followed the Institutional ethical guidelines set by the American Society of Mammalogists [52] and the ethical guidelines of the División de Ciencias Biológicas y de la Salud, Universidad Autónoma Metropolitana-Iztapalapa [53] (Project “Biology and Ecology of bats in Mexico,” approved by the Consejo Divisional de Ciencias Biológicas y de la Salud. Session 17.18. Date 28 November 2018). Collections were carried out under the Mexican government licenses SGPA/DGVS Nos. 05853/13, 09131/14.
2.2. Mitochondrial DNA
Total DNA was extracted from 245 Natalus mexicanus specimens following the protocol of the WizardSV Genomic DNA Purification System (Promega) kit. For these 245 individuals, a 331-bp fragment of the HVII domain of the mtDNA control region was amplified via polymerase chain reaction (PCR), using the primers L16517 and HSC [54] and following the conditions and the modifications of the primer HSC by [50]. Sequencing was performed with the Big Dye Terminator Kit (Perkin-Elmer, Norwalk, Connecticut) on an ABI 3130xl automatic sequencer (Applied Biosystems, Foster City, California). The sequences were edited and aligned with Geneious v. 5.6.4 [55] using the ClustalW algorithm and were subsequently adjusted visually.
2.3. Microsatellite Loci Amplification
Microsatellite loci amplification was made from tissue samples of 171 individuals from 11 localities of Mexico by means of ten dinucleotide microsatellite primers previously developed for the species (Nm1–Nm10—[56]) that were used along with the PCR conditions described above. Fragments were read on an ABI PRISM Genetic Analyzer 3130XLl sequencer, with a LIZ (GeneScan™ 500® LIZ Size Standard) as the allele-size standard. Allele size was estimated using GeneMarker v. 2.4.2 (SoftGenetics, LLC, State College, PA, USA).
2.4. MtDNA Data Analysis
2.4.1. Genealogical Analysis
Genealogical relationships between haplotypes were determined by a network of haplotypes through the median-joining method, with the software Network v. 4.6.1.3 [57]. Loops were resolved according to the criteria of [58]. Genetic distances between the genealogical groups (haplogroups) obtained were calculated with MEGA v. 5.0.5 [59], using the Tamura–Nei model (TrN). Haplotype diversity (h) and nucleotide diversity (π) were estimated for each locality, as well as for the groups obtained, using DnaSP v. 5 [60].
The genetic structure between and within localities was determined with molecular analysis of variance (AMOVA) with the software Arlequin v. 3.5.1.2 [61], run at two levels: Nongrouped and among the four groups obtained through the haplotype network (see Section 3). The program Barrier v. 2.2 was used to highlight likely geographic areas of genetic discontinuity [62].
2.4.2. Demographic Analysis
The historical demographic dynamics was determined through mismatch distributions under an expansion model and the sum of squared deviations (SSD; [63]); we also ran the Harpending’s raggedness index (HRI), which considers shifts in population sizes [64]. Then, neutrality, Tajima’s D [65] and Fu’s F [66], tests were carried out using Arlequin v. 3.5.1.2 [61], which may also indicate population expansion.
The population dynamics was evaluated with an extended Bayesian skyline plot (EBSP) analysis, using mtDNA control region with BEAST v. 1.8.4 [67] on the CIPRES web portal (specialized in phylogeny); the analysis was run twice, each for 30 million generations, using a coalescent Bayesian skyline model, and an uncorrelated lognormal relaxed clock model. The optimal evolutionary model was estimated with jModelTest v. 2.1.6 (Pacific, Gulf of Mexico and Yucatan Peninsula: Tamura Nei 93). A substitution rate ranging from 0.01 to 0.025 substitutions per site per million years (s/s/my) was used following [68]; an Excel graph was produced. All analyses were performed for each genetic haplogroup obtained; the exception was San Sebastián (SS), given the low sample size (see results) and was included in the haplogroup Pacific.
2.4.3. Historical Gene Flow
The relative mutation-scaled migration rates (M) between the four mitochondrial groups obtained in Network and the relative effective population size (θ) were estimated using Markov chain Monte Carlo simulations in Migrate-n v. 3.7.2 [69] under a Bayesian inference model and with a constant mutation rate. A random tree was used as the baseline genealogy. The parameters of the first run were used as baseline values for the subsequent run until a converging result was obtained. The Markov chain length was set as 10,000 steps with 1000-step increments. An adaptive 4-chain heating scheme was set at temperatures of 1.0, 1.5, 3.0, and 1.000. A total of 10,000 trees per chain were discarded.
2.5. Microsatellite Data Analysis
The presence and frequency of null alleles were confirmed by locus and locality with MICROCHECKER v. 2.2.3 [70]. To confirm that the presence of null alleles has no effect on the results, we calculated FST and genetic distance values with and without ENA correction (estimation of null alleles) using the software FREENA [71] and performed a Student’s t-test with NCSS v. 11 [72]. The deviation from the Hardy–Weinberg equilibrium (HWE) and the ligation imbalance between pairs of loci were calculated using GENEPOP v. 4.0 [73] and applying the sequential Bonferroni correction to the significance level of p < 0.05 [74].
2.5.1. Population Structure and Genetic Diversity
The genetic structure was evaluated through a Bayesian clustering analysis with STRUCTURE v. 2.2 [75], under conditions of 1,000,000 burn-in and 500,000 Monte Carlo Markov chain, testing clusters from K = 2 to 11, with 20 replicates per K. The most likely number of genetic clusters (K) was determined by estimating Delta K (∆K) and the logarithmic probability of K, In P (K) = L (K) [76] using the Structure Harvester website [77]. On the other hand, the distribution of genetic variation between and within populations was analyzed using molecular analysis of variance (AMOVA), based on FST and RST with 30,000 permutations using Arlequin v. 3.5.1.2 [61]. Genetic diversity by locality was obtained using GenAlEx v. 6.3 [78], estimating the number of alleles (Na), exclusive alleles (NP), observed heterozygosis (HO), and expected heterozygosis (HE).
2.5.2. Contemporary Migration Rates
Gene flow among the four groups (see Results) identified by STRUCTURE was estimated in BAYESASS v. 3.0.4 [79]. These programs use different models to estimate gene flow rates. BAYESASS uses an assignment method and does not incorporate genealogy; besides, it reflects the gene flow that occurred only in the past 1–3 generations. The BAYESASS analysis was first run with microsatellite data using the default delta values for allelic frequency, migration rate, and inbreeding. Subsequent analyses incorporated different delta values to ensure that the proposed changes between chains at the end of the run were between 40% and 60% of the total chain length [79]. Once the delta values (ΔA = 0.40, Δm = 0.45, and ΔF = 0.60) were within the accepted proportion (ΔA = 0.15, Δm = 0.15, and ΔF = 0.14) for four genetic groups, analyses were run three additional times (10 million iterations, one million burn-in, and a sampling frequency of 5000) with different random seeds. All parameter estimates converged.
3. Results
3.1. Mitochondrial DNA Data Analysis
The 245 sequences of the Natalus mexicanus mtDNA control region had 331 bp with no tandem replicates. They showed a base composition of T: 23.8%, C: 26.6%, A: 32.5%, and G: 17.1%, with 271 conserved sites and 60 variable sites, 44 of which are parsimoniously informative sites.
3.1.1. Genealogical Analysis
A total of 123 haplotypes were identified (GenBank Accession Numbers MW411060–MW411182), of which 90 were unique and 33 were shared by two or more sequences (Appendix A). The genealogical analysis revealed four distinct differentiated main groups: (1) Gulf of Mexico (GM) slope, (2) Mexican Pacific (PM) slope, (3) Yucatan Peninsula (PYUC), and (4) San Sebastian (SS) locality. Only four haplotypes of the PM group were shared within the GM group (Figure 2). Between-group genetic distances were relatively high in SS vs. PAC, SS vs. GM, and PYUC vs. GM (4.5% each); intermediate in PM vs. PYUC (4.2%); low in PYUC vs. SS (3.5%) and PM vs. GM (3.4%).
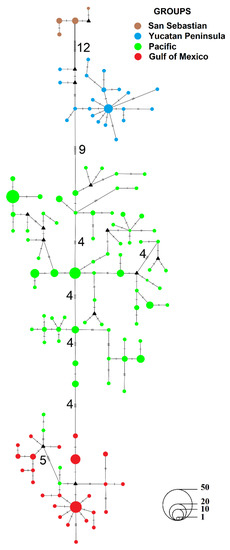
Figure 2.
Median-joining network constructed from sequences from the mtDNA control region of Natalus mexicanus. The small lines connecting haplotypes indicate the mutation steps between them; small black triangles represent hypothetical haplotypes; the size of circles represents the frequency of each haplotype. Colors represent the following groups: Brown—San Sebastian; blue—Yucatan Peninsula; green—Pacific (included Pe locality); red—Gulf of Mexico. The lower right corner shows the scale for haplotype frequency.
3.1.2. Population Structure and Genetic Diversity
When groups were not defined, the AMOVA analysis showed a higher percentage of genetic variation (71%) between localities and a high differentiation (FST = 0.71; p < 0.05); the differentiation values per group were also high and significant (FCT = 0.446, p < 0.05) (Table 1).

Table 1.
Analysis of molecular variance using mtDNA control region; no groups defined and between groups (Pacific, Gulf of Mexico, San Sebastian, and Yucatan Peninsula).
The analysis using pairwise FST distances in the Barrier software detected three geographic barriers separating localities into three groups (GM, PM, and SS). These barriers are located in the Sierra Madre Oriental and in the central valleys of Oaxaca, separating GM and PM, and PM and SS, respectively.
The species haplotype diversity was high (h = 0.982), as was nucleotide diversity (π = 0.0289). The levels of genetic diversity between groups were also high (Table S2), except for the SS group, which showed moderate values (h = 0.742). Nucleotide diversity values were low in the PYUC (π = 0.0077) and SS (π = 0.0035) groups, compared with PM (π = 0.0197) and GM (π = 0.0129).
3.1.3. Demographic Analysis
The mismatch distribution (SSD) and the Harpending’s raggedness index (HRI) of the groups PM-SS (SSD = 0.0011, p = 0.705; r = 0.0042, p = 0.809) and PYUC (SSD = 0.0042, p = 0.727; r = 0.0799, p = 0.472) showed a unimodal distribution; for the GM group, the curve was not strictly unimodal (SSD = 0.0095, p = 0.572; r = 0.0186, p = 0.755) (Figure 3), although it was consistent with recent population growth. In all cases, Fu’s F tests were negative and significant, while Tajima’s D tests were negative but nonsignificant (Table 2).
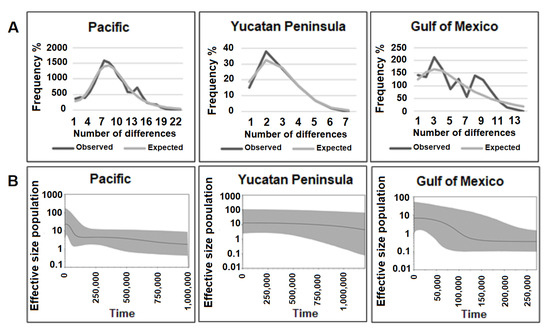
Figure 3.
(A) Mismatch distribution and (B) extended Bayesian skyline plot from Pacific, Yucatan Peninsula and Gulf of Mexico.
Table 2.
Demographic analyses for Natalus mexicanus.
The extended Bayesian skyline plot analyses indicated that groups PM and GM increased their effective population size from 125,000 years ago, while PYUC remained constant through time (Figure 3).
3.1.4. Historical Gene Flow
Bayesian inference indicated moderate to high levels of gene flow among the mitochondrial haplogroups (M = 12.9–305.4, Figure 4). Gene flow was symmetrical in GM vs. PM and PYUC vs. GM, and was asymmetric in PM vs. SS and PYUC vs. SS. The lowest levels of gene flow were observed between GM vs. PM, PM vs. PYUC, and GM vs. PYUC (Figure 4). The female effective population size varied among haplogroups (0.0020–0.0657; Figure 4).
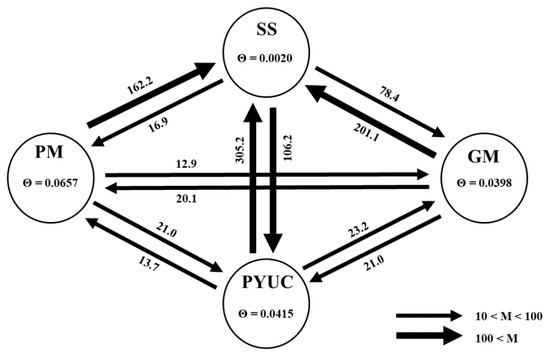
Figure 4.
Estimates of gene flow between haplogroups (PM—Mexican Pacific; GM—Gulf of Mexico; PYUC—Yucatan Peninsula; SS—San Sebastian). Values within circles are the mutation-scaled effective population size (θ) with 95% confidence intervals. Arrows indicate the direction of gene flow between haplogroups. Values on the line represent the relative mutation-scaled migration rates (M) calculated from MIGRATE.
3.2. Microsatellite Data Analysis
There were 198 alleles with ten loci recorded in 171 individuals. Fifty-five unique alleles were found, where the locality Valle de Bravo (VB) showed a higher number of alleles, but with a low frequency (0.031–0.094), while the locality Pe showed a lower number of alleles, but with a higher frequency (0.031–0.188) (Table 3).
Table 3.
Genetic diversity statistics with microsatellites for each locality. Sum and average alleles per locus (Na); unique alleles (Np); observed heterozygosis (HO), expected heterozygosis (HE). Abbreviations in each locality are as in Figure 1.
Null alleles occurred in most loci of individuals from at least two localities; however, as FST and genetic distances (with and without ENA correction) did not differ significantly, no loci were excluded. Eight loci (Nme1–Nme4, Nme6, Nme8–NM10) deviated from the Hardy–Weinberg equilibrium in three or more localities. No disequilibrium in the linkage between loci was detected.
3.2.1. Population Structure and Genetic Diversity
The STRUCTURE analysis identified four genetic groups (K = 4), which differed in composition from those obtained with mtDNA: (1) Pe locality (Baja California Peninsula); (2) localities Pa, Ca, LV, and Cr (Pacific and Gulf of Mexico slopes); (3) localities VB and SS (valleys of Mexico and Oaxaca, respectively); and (4) localities Colotipla (Co), Tuxtla Gutiérrez (TG), Bolonchén (Bo), and Ciudad Valles (Cva) (Pacific and Gulf of Mexico slopes, and Yucatan Peninsula) (Figure 5). Genetic differentiation values between localities were high and significant (FST = 0.147 and RST = 0.486; p < 0.05) (Table 4). HO values ranged from 0.404 to 0.681 and HE from 0.585 to 0.787.
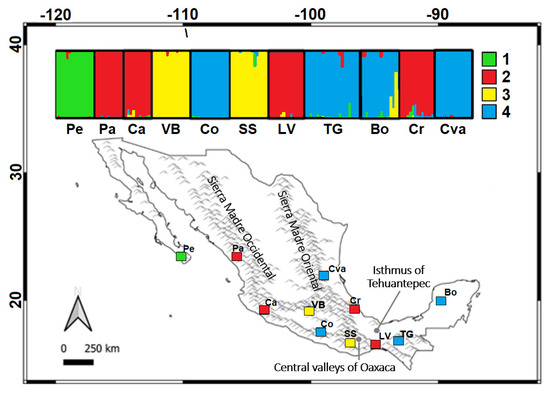
Figure 5.
Results of the STRUCTURE analysis for Natalus mexicanus individuals. Assignment of individuals to genetic groups in K = 4. Acronyms are as follows (locality, federal entity): Pe—Pescadero, B.C.S.; Pa—Pánuco, Sin.; Ca—Cardona, Col.; VB—Valle de Bravo, E. Mex.; Co—Colotipla, Gro.; SS—San Sebastián, Oax.; LV—La Venta, Oax.; TG—Tuxtla Gutiérrez, Q. Roo; Bo—Bolonchén, Cam.; Cr—Carrizal. Ver.; Cva—Ciudad Valles, S.L.P. Major geographic barriers are indicated.
Table 4.
Results of the general molecular variance analysis using microsatellites between locations; FST/RST.
3.2.2. Contemporary Migration Rates
BAYESASS runs yielded low levels of contemporary gene flow among groups (Table 5). The highest migration rates were observed from Group 1 (site Pe: Baja California peninsula) to Group 4 (sites Co, TG, Bo, and Cva: Pacific and Gulf of Mexico). The migration rates from the groups were very low (<5%) and not significantly different from zero. All estimates of migration (m) between groups had 95% confidence intervals that approached zero, indicating little to no recent migration between genetic groups (Table 5).
Table 5.
Estimates of contemporary migration rates (95% confidence intervals) based on microsatellite data among groups of Natalus mexicanus. Group 1: Pe locality: Peninsula de Baja California; group 2: Pa, Ca, LV, Cr localities: Pacific and Gulf of Mexico; group 3: VB and SS localities: Pacific and San Sebastian; and group 4: Co, TG, Bo, and Cva localities: Pacific, Gulf of Mexico and Yucatan Peninsula.
4. Discussion
Our results show that contemporary levels of genetic diversity in N. mexicanus are moderate, and gene flow values between groups are either low or nil, in parallel with high values of population genetic differentiation. These data suggest a reduction in effective population size with isolated populations. A study based on microsatellites showed that, similar to N. mexicanus, the papillose woolly bat (Kerivoula papillosa) currently thriving in a fragmented landscape showed parallel reductions in population density and genetic diversity [16]. Small-sized bats, like N. mexicanus and Kerivoula papillosa, with relatively low mobility, may be more severely affected by landscape alterations regardless of a wide geographic distribution [80].
Our findings also show a differential genetic structure for the mitochondrial control region and nuclear microsatellites, suggesting female philopatry (e.g., [81]). Mating behavior and philopatry affect the population structure in bats [82,83]; besides, bat species with limited long-distance flight capacity demonstrate a greater population structuring relative to species with greater mobility [15]. Although poorly documented, N. mexicanus may display sexual segregation, with females remaining in the cave during the gestation and lactation stages, while most males leave the cave at this time [38,84]. They do not seem to show massive migrations, but they migrate locally in search of the most favorable daytime shelters [85].
The patterns detected using mtDNA and microsatellites showed no genetic differentiation between Natalus mexicanus populations living in northern and southern Mexico [48], neither into two reciprocally monophyletic nor deeply divergent groups, as proposed by [86,87]; conversely, this finding is consistent with the observations previously reported by us [49].
The mitochondrial genealogical analyses identified four lineages (GM, PM, PYUC, and SS), consistent with the geographic structure based on the cytochrome b gene [49]. These lineages respond to historical processes and probably evolved due to the effect of barriers restraining dispersal during the Pleistocene, including mountain ranges, depressions, and lowlands in the Isthmus of Tehuantepec, which were partially revealed by the Barrier software (although it failed to detect the PYUC group).
The intraspecific divergence between groups GM and PM was fostered by mountain ranges such as Sierra Madre Oriental and Sierra Madre Occidental, followed by a subsequent expansion, as evidenced by the mismatch analyses; however, a moderate gene flow between the two groups was recorded. The locality TG (Chiapas, group PM) showed haplotypes shared with group GM (H73, H75, and H77), explained probably by an incomplete lineage sorting or retention of ancestral polymorphisms, similar to the pattern shown by other bat species [88,89,90]. The genetic diversity statistics and demographic testing indicated population expansion in groups PM and GM, i.e., these groups experienced an increasing effective population size from 125,000 years ago, similar to reports for other mammal species [91,92], despite the significant climate changes recorded in this period [93,94]. The SS group is located in the central valleys of Oaxaca, a region with lower altitudinal ranges but surrounded by mountains with altitudes above two thousand meters [95], which would explain the isolation of this population from the group PM; however, high levels of PM-to-SS historical gene flow were observed. In addition, the highest levels of historical gene flow were recorded from PYUC to SS, which could be a reflection of a historical dispersal route through the Isthmus of Tehuantepec, as has been documented in birds [96,97]. The separation between GM/PM and PYUC probably results from the influence of the Isthmus of Tehuantepec, which has functioned as a geographic barrier for flying organisms such as bats [50,51,98] and birds [99,100]; this hypothesis was supported by the moderate gene flow values obtained here. For the group PYUC, signatures of demographic stability over time were observed, a finding also supported by paleontological information; these observations suggest that the general climate of the region did not change drastically from the end of the Pleistocene to the present [101,102].
Our analyses based on microsatellite data revealed a pattern inconsistent with the distribution of groups based on mtDNA. Discrepancies in population structure derived from markers with different inheritance patterns have been observed in several organisms, including bats [103,104,105], birds [106,107], reptiles [108], and amphibians [109,110], among others.
This work detected a marked contemporary genetic structure with four genetic groups, none of which are consistent with the groups observed based on mtDNA (Figure 2 and Figure 5). Group 1 consists of PE (located on the Baja California Peninsula), which unlike the results based on mtDNA, showed a vicariant process and became separated from the continental genetic signature. Similar results have been observed in different vertebrate species [111,112].
Microsatellite group 2 includes localities of mitochondrial groups GM and PM, while group 4 clusters localities of mitochondrial groups GM, PM, and PYUC. In these localities, geographic barriers (e.g., Sierra Madre Oriental, Sierra Madre Occidental, Isthmus of Tehuantepec) do not seem to hamper connections between the Gulf of Mexico and Pacific slopes, as well as with the Yucatan Peninsula; nonetheless, the gene flow is low (Table 5). Natalus mexicanus thrives in the interior of forests, although also being able to prosper in the remnants of tropical forests by using resources in the coastal corridors that stretch across landscapes [7,40]. Thus, we can assume that this species may be migrating locally through the Balsas depression or the Isthmus of Tehuantepec lowlands, both suggested as biological corridors for other bat species [50,113,114,115].
Group 3 includes localities VB and SS, located in the trans-Mexican volcanic belt and the Sierra Madre del Sur physiographic provinces, respectively. It is surprising that these two localities are clustered in the same group despite being more than 400 km apart; both are located in conifer and oak forests within two valleys, one in the State of Mexico and the other in Oaxaca. Isolated populations located within valleys have also been recorded for other mammal species [116,117]. In both localities, mitochondrial and nuclear genetic diversity is relatively low, likely due to genetic drift and inbreeding [15] related to isolation.
The genetic structure based on microsatellites appears to match vegetation types of accord INEGI [118] (Table S1), as reported for birds [119,120]. Accordingly, the group 1 locality in the Baja California peninsula is characterized by sarcocaul shrubland; the localities of groups 2 and 4 have a secondary shrub vegetation of low deciduous forest, and group 3 has pine and oak forests. These results suggest that the genetic differentiation of N. mexicanus in Mexico could be related to the great diversity of habitats where it thrives and are in agreement with those of a previous report [48].
In this context, the high deforestation rate in the habitats of this species is cause for concern; the low deciduous forest alone—the main habitat of the species—loses 650 thousand ha annually [33]. Approximately only 27% of the original cover of seasonally dry forest in México remain as intact forest; if the current trends in deforestation continue, the remaining forest will be heavily reduced and degraded in the near future [32].
Although genetic diversity in areas inhabited by the funnel-ear bat is currently moderate, contemporary gene flow is virtually zero among most groups and low between group 1 (Baja California) and group 4 (GM, PM, and PYUC individuals). This may be a consequence of habitat fragmentation, which should be interpreted as a warning signal, given that the loss of genetic variation and flow can reduce the ability of individuals to adapt to a changing environment, resulting in endogamic depression [121], lower reproduction [122,123], and a higher probability of extinction [124,125]. The information obtained for Natalus mexicanus in this study is also alarming because the current status of most of its populations is unknown [40], and during the development of our field work, we have been able to verify that some populations have either declined or completely disappeared due to human disturbances [126].
5. Conclusions
This work reports the first population genetics analysis of the Mexican greater funnel-eared bat (Natalus mexicanus) using mitochondrial and nuclear markers, with contrasting results in terms of genetic structure between both molecular markers. This analysis advances our understanding of the underlying evolutionary processes, revealing historical isolation events resulting from geographic barriers, although with some degree of gene flow, as well as an almost null contemporary gene flow and local effects of affinity to the habitat. We predict that this is possibly due to local dispersal by males through biological corridors of great conservation value for the species.
As the populations studied are located in the main habitats in which the species currently thrives and that present low levels of genetic diversity, our results also support the hypothesis that the increasing fragmentation and exploitation of Mexican tropical forests is affecting the levels of current diversity and contemporary genetic flow between populations. Tropical forest remnants are used intensively by many insectivorous bats, so our findings also support the thesis that forest remnants have considerable conservation value probably for many forest species; therefore, their conservation should have a high priority to keep isolation levels low and thus maintain or restore the genetic diversity of many species linked to this particular habitat.
Supplementary Materials
The following are available online at https://www.mdpi.com/article/10.3390/d13040140/s1, Table S1: Sampling locations. Sample size (N, sequences/microsatellites); main type of vegetation: Sarcocaul shrubland (MSC), secondary shrub vegetation of low deciduous forest (VSA/SBC), Savannah-like (VSI), secondary shrub vegetation of medium subdeciduous forest (VSA/SMS), pine-oak forest (BPE), low deciduous forest (SBC), medium subdeciduous forest (SMS), submontane shrubland (Msm), Tamaulipecan thorny shrubland (MET), vegetation and soil use map, scale 1:250,000 [123]. Table S2: Genetic diversity indices by groups and localities. Number of haplotypes (k), haplotypic diversity (h), and nucleotide diversity (π).
Author Contributions
Conceptualization, R.L.-W., L.M.G.-C., and J.J.; data curation, R.L.-W. and L.M.G.-C.; formal analysis, A.M.-R. and L.M.G.-C.; funding acquisition, R.L.-W. and L.M.G.-C.; investigation, A.M.-R. and L.M.G.-C.; methodology, A.M.-R., A.S.-D., F.R.-G., and L.M.G.-C.; project administration, R.L.-W. and L.M.G.-C.; resources, R.L.-W., J.J., and L.M.G.-C.; software, A.M.-R., F.R.-G., and L.M.G.-C.; supervision R.L.-W., J.J., A.S.-D., and L.M.G.-C.; validation, R.L.-W. and L.M.G.-C.; visualization, R.L.-W. and L.M.G.-C.; writing—original draft, R.L.-W., A.M.-R., J.J., and L.M.G.-C.; writing—review and editing, R.L.-W., A.M.-R., J.J., A.S.-D., F.R.-G., and L.M.G.-C. All authors have read and agreed to the published version of the manuscript.
Funding
This work was supported by the Consejo Nacional de Ciencia y Tecnología fellowships: R.L.-W. (CB-2009-01/128459) and L.M.G.-C. (CB-2014-01/243138).
Institutional Review Board Statement
Not applicable.
Informed Consent Statement
Not applicable.
Data Availability Statement
The data presented in this study are available in the supplementary material.
Acknowledgments
This work was developed in the Divisional Laboratory of Molecular Biology at the Universidad Autónoma Metropolitana-Iztapalapa and the Laboratory of Molecular Biology in the Estación Biológica de Doñana, Sevilla, España. María Elena Sánchez-Salazar translated the manuscript into English.
Conflicts of Interest
The authors declare no conflict of interest.
Appendix A
List of localities, acronyms, haplotypes of mtDNA control region sequences (number of individuals), and GenBank accession numbers of the samples used in this study.
References
- Gaines, M.S.; Diffendorfer, J.E.; Tamarin, R.H.; Whittam, T.S. The Effects of Habitat Fragmentation on the Genetic Structure of Small Mammal Populations. J. Hered. 1997, 88, 294–304. [Google Scholar] [CrossRef]
- Pereira, H.M.; Leadley, P.W.; Proença, V.; Alkemade, R.; Scharlemann, J.P.W.; Fernandez-Manjarrés, J.F.; Araújo, M.B.; Balvanera, P.; Biggs, R.; Cheung, W.W.L.; et al. Scenarios for Global Biodiversity in the 21st century. Science 2010, 330, 1496–1501. [Google Scholar] [CrossRef]
- Meyer, C.F.J.; Struebig, M.J.; Willig, M.R. Responses of Tropical Bats to Habitat Fragmentation, Logging, and Deforestation. In Bats in the Anthropocene: Conservation of Bats in a Changing World; Metzler, J.B., Ed.; Springer: Berlin/Heidelberg, Germany, 2016; pp. 63–103. [Google Scholar]
- Schlaepfer, D.R.; Braschler, B.; Rusterholz, H.-P.; Baur, B. Genetic Effects of Anthropogenic Habitat Fragmentation on Remnant Animal and Plant Populations: A Meta-analysis. Ecosphere 2018, 9, e02488. [Google Scholar] [CrossRef]
- Fahrig, L. Effects of Habitat Fragmentation on Biodiversity. Annu. Rev. Ecol. Evol. Syst. 2003, 34, 487–515. [Google Scholar] [CrossRef]
- Wilcove, D.S.; McLellan, C.H.; Dobson, A.P. Habitat Fragmentation in the Temperate Zone. In Conservation Biology—The Science of Scarcity and Diversity; Soulé, M.E., Ed.; Sinauer Associates: Sunderland, MA, USA, 1986; pp. 237–256. [Google Scholar]
- Galindo-González, J. Efectos de la Fragmentación del Paisaje Sobre Poblaciones de Mamíferos; el Caso de los Murciélagos de los Tuxtlas, Veracruz. In Tópicos en Sistemática, Biogeografía, Ecología y Conservación de Mamíferos; Sánchez-Rojas, G., Rojas-Martínez, A., Eds.; Universidad Autónoma del Estado de Hidalgo: Pachuca, México, 2007; pp. 97–114. [Google Scholar]
- Dibattista, J.D. Patterns of Genetic Variation in Anthropogenically Impacted Populations. Conserv. Genet. 2007, 9, 141–156. [Google Scholar] [CrossRef]
- Dixo, M.; Metzger, J.P.; Morgante, J.S.; Zamudio, K.R. Habitat Fragmentation Reduces Genetic Diversity and Connectivity Among Toad Populations in the Brazilian Atlantic Coastal Forest. Biol. Conserv. 2009, 142, 1560–1569. [Google Scholar] [CrossRef]
- Jackson, N.D.; Fahrig, L. Habitat Amount, Not Habitat Configuration, Best Predicts Population Genetic Structure in Fragmented Landscapes. Landsc. Ecol. 2016, 31, 951–968. [Google Scholar] [CrossRef]
- Wan, H.Y.; Cushman, S.A.; Ganey, J.L. Habitat Fragmentation Reduces Genetic Diversity and Connectivity of the Mexican Spotted Owl: A Simulation Study Using Empirical Resistance Models. Genes 2018, 9, 403. [Google Scholar] [CrossRef]
- Frankham, R. Relationship of Genetic Variation to Population Size in Wildlife. Conserv. Biol. 1996, 10, 1500–1508. [Google Scholar] [CrossRef]
- Kunz, T.H.; Fenton, M.B. (Eds.) Bat Ecology; University of Chicago Press: Chicago, IL, USA, 2005; p. 779. [Google Scholar]
- Kunz, T.H.; de Torrez, E.B.; Bauer, D.M.; Lobova, T.; Fleming, T.H. Ecosystem Services Provided by Bats. Ann. N. Y. Acad. Sci. 2011, 1223, 1–38. [Google Scholar] [CrossRef]
- Meyer, C.F.J.; Kalko, E.K.V.; Kerth, G. Small-Scale Fragmentation Effects on Local Genetic Diversity in Two Phyllostomid Bats with Different Dispersal Abilities in Panama. Biotropica 2009, 41, 95–102. [Google Scholar] [CrossRef]
- Struebig, M.J.; Kingston, T.; Petit, E.J.; le Comber, S.C.; Zubaid, A.; Mohd-Adnan, A.; Rossiter, S.J. Parallel Declines in Species and Genetic Diversity in Tropical Forest Fragments. Ecol. Lett. 2011, 14, 582–590. [Google Scholar] [CrossRef]
- Silva, S.M.; Ferreira, G.; Pamplona, H.; Carvalho, T.L.; Cordeiro, J.; Trevelin, L.C. Effects of Landscape Heterogeneity on Population Genetic Structure and Demography of Amazonian Phyllostomid Bats. Mammal. Res. 2021, 66, 217–225. [Google Scholar] [CrossRef]
- Galindo-Gonzalez, J.; Sosa, V.J. Frugivorous Bats in Isolated Trees and Riparian Vegetation Associated with Human-Made Pastures in a Fragmented Tropical Landscape. Southwest. Nat. 2003, 48, 579–589. [Google Scholar] [CrossRef]
- Montiel, S.; Estrada, A.; León, P. Bat Assemblages in a Naturally Fragmented Ecosystem in the Yucatan Peninsula, Mexico: Species Richness, Diversity and Spatio-Temporal Dynamics. J. Trop. Ecol. 2006, 22, 267–276. [Google Scholar] [CrossRef]
- Arroyo-Rodríguez, V.; Rojas, C.; Saldaña-Vázquez, R.A.; Stoner, K.E. Landscape Composition is More Important Than Landscape Configuration for Phyllostomid Bat Assemblages in a Fragmented Biodiversity Hotspot. Biol. Conserv. 2016, 198, 84–92. [Google Scholar] [CrossRef]
- García-García, J.L.; Santos-Moreno, A.; Kraker-Castañeda, C. Ecological Traits of Phyllostomid Bats Associated with Sensitivity to Tropical Forest Fragmentation in Los Chimalapas, Mexico. Trop. Conserv. Sci. 2014, 7, 457–474. [Google Scholar] [CrossRef]
- Lucho, I.R.; Coates, R.; González-Christen, A. The Understory Bat Community in a Fragmented Landscape in the Lowlands of the Los Tuxtlas, Veracruz, Mexico. Therya 2017, 8, 99–107. [Google Scholar] [CrossRef]
- Estrada-Villegas, S.; Meyer, C.F.; Kalko, E.K. Effects of Tropical Forest Fragmentation on Aerial Insectivorous Bats in a Land-bridge Island System. Biol. Conserv. 2010, 143, 597–608. [Google Scholar] [CrossRef]
- Treitler, J.T.; Heim, O.; Tschapka, M.; Jung, K. The Effect of Local Land Use and Loss of Forests on Bats and Nocturnal Insects. Ecol. Evol. 2016, 6, 4289–4297. [Google Scholar] [CrossRef]
- Keenan, R.J.; Reams, G.A.; Achard, F.; de Freitas, J.V.; Grainger, A.; Lindquist, E. Dynamics of Global Forest Area: Results from the FAO Global Forest Resources Assessment 2015. For. Ecol. Manag. 2015, 352, 9–20. [Google Scholar] [CrossRef]
- Kolb, M.; Galicia, L. Challenging the Linear Forestation Narrative in the Neotropic: Regional Patterns and Processes of Deforestation and Regeneration in Southern Mexico. Geogr. J. 2012, 178, 147–161. [Google Scholar] [CrossRef]
- Watson, D.M. Long-term Consequences of Habitat Fragmentation—Highland Birds in Oaxaca, Mexico. Biol. Conserv. 2003, 111, 283–303. [Google Scholar] [CrossRef]
- Arroyo-Rodríguez, V.; Aguirre, A.; Benítez-Malvido, J.; Mandujano, S. Impact of Rain Forest Fragmentation on the Population Size of a Structurally Important Palm Species: Astrocaryum mexicanum at Los Tuxtlas, Mexico. Biol. Conserv. 2007, 138, 198–206. [Google Scholar] [CrossRef]
- Cristóbal-Azkarate, J.; Arroyo-Rodríguez, V. Diet and Activity Pattern of Howler Monkeys (Alouatta palliata) in Los Tuxtlas, Mexico: Effects of Habitat Fragmentation and Implications for Conservation. Am. J Primatol. Off. J. Am. Soc. Primatol. 2007, 69, 1013–1029. [Google Scholar] [CrossRef] [PubMed]
- Mas, J.-F.; Velázquez, A.; Díaz-Gallegos, J.R.; Mayorga-Saucedo, R.; Alcántara, C.; Bocco, G.; Castro, R.; Fernández, T.; Pérez-Vega, A. Assessing Land Use/Cover Changes: A Nationwide Multidate Spatial Database for Mexico. Int. J. Appl. Earth Obs. Geoinformation 2004, 5, 249–261. [Google Scholar] [CrossRef]
- Food and Agriculture Organization (FAO). China—Global Forest Resources Assessment 2015—Country Report. In Global Forest Resources Assessment 2015; UN Food and Agriculture Organization: Rome, Italy, 2015. [Google Scholar]
- Trejo, I.; Dirzo, R. Deforestation of Seasonally Dry Tropical Forest: A National and Local Analysis in Mexico. Biol. Conserv. 2000, 94, 133–142. [Google Scholar] [CrossRef]
- Maass, J.M. Conversion of Tropical Dry Forest to Pasture and Agriculture. In Seasonally Dry Forest; Bullock, S.H., Mooney, H.A., Medina, E., Eds.; Cambridge University Press: Cambridge, UK, 1995; pp. 9–32. [Google Scholar]
- Miranda, R.P.; Romero-Sánchez, M.; González-Hernández, A.; Moreno-Sánchez, F.; Acosta-Mireles, M.; Carrillo-Anzures, F. Temporary Analysis of Land Use Changes in Pine and Mixed Forests in Mexico. AGRO Product. 2020, 13, 91–98. [Google Scholar] [CrossRef]
- Arriaga, L. Implicaciones del Cambio de Uso de Suelo en la Biodiversidad de los Matorrales Xerófilos: Un Enfoque Multiescalar. Investig. Ambient. 2009, 1, 6–16. [Google Scholar]
- Webala, P.W.; Mwaura, J.; Mware, J.M.; Ndiritu, G.G.; Patterson, B.D. Effects of Habitat Fragmentation on the Bats of Kakamega Forest, Western Kenya. J. Trop. Ecol. 2019, 35, 260–269. [Google Scholar] [CrossRef]
- Gamboa Alurralde, S.; Díaz, M.M. Assemblage-Level Responses of Neotropical Bats to Forest Loss and Fragmentation. Basic Appl. Ecol. 2021, 50, 57–66. [Google Scholar] [CrossRef]
- Sánchez-Hernández, C.; Romero-Almaraz, M.L.; Gurrola-Hidalgo, M.A. Natalus stramineus saturatus (Dalquest and Hall, 1949). In Historia Natural de Chamela; Noguera, F.A., Vega, J.H., Rivera-García-Aldrete, A.N., Quesada-Avendaño, M., Eds.; Instituto de Biología; Universidad Nacional Autónoma de México: México City, México, 2002; pp. 403–405. [Google Scholar]
- Torres-Flores, J.W. Dinámica Poblacional, Patrón Reproductivo, Dieta, Selección de Condiciones Microclimáticas y Hábitos de Percha de Natalus mexicanus (Chiroptera: Natalidae) en la Parte Central de Colima, México. Ph.D. Thesis, Universidad Autónoma Metropolitana, Ciudad de México, México, 2013. [Google Scholar]
- López-Wilchis, R.; Torres-Flores, J.W.; Arroyo-Cabrales, J. Natalus mexicanus (Chiroptera: Natalidae). Mamm. Species 2020, 52, 27–39. [Google Scholar] [CrossRef]
- Iucn Natalus mexicanus. IUCN Red List of Threatened Species; Solari, S., Ed.; IUCN: Gland, Switzerlnad, 2019. [Google Scholar]
- Reid, F.A. A Field Guide to the Mammals of Central America and Southeast Mexico; Oxford University Press: New York, NY, USA, 2009; p. 346. [Google Scholar]
- Castro-Luna, A.A.; Sosa, V.J.; Castillo-Campos, G. Bat Diversity and Abundance Associated with the Degree of Secondary Succession in a Tropical Forest Mosaic in South-Eastern Mexico. Anim. Conserv. 2007, 10, 219–228. [Google Scholar] [CrossRef]
- Galindo-González, J. Clasificación de los Murciélagos de la Región de Los Tuxtlas, Veracruz, Respecto a su Respuesta a la Fragmentación del Hábitat. Acta Zool. Mex. 2004, 20, 239–243. [Google Scholar]
- Medellín, R.; Arita, H.; Sánchez, O. Identificación de los Murciélagos de México, Clave de Campo; Asociación Mexicana de Mastozoología, A.C.: Distrito Federal, México, 1997. [Google Scholar]
- Hall, E.R. The Mammals of North America; John Wiley & Sons: New York, NY, USA, 1981. [Google Scholar]
- Secretaría de Medio Ambiente y Recursos Naturales (SEMARNAT). Norma Oficial Mexicana NOM-059, Protección Ambiental-Especies Nativas de México de Flora y Fauna Silvestres. Categorías de Riesgo y Especificaciones Para su Inclusión, Exclusión o Cambio, Lista de Especies en Riesgo; Diario oficial de la Federación 2008: Ciudad de México, México, 2010. [Google Scholar]
- Arroyo-Cabrales, J.; van den Bussche, R.A.; Sigler, K.H.; Chesser, R.K.; Baker, R.J. Genic Variation of Mainland and Island Populations of Natalus stramineus (Chiroptera: Natalidae). Occas. Pap. Mus. Texas Tech. Univ. 1997, 171, 1–9. [Google Scholar]
- López-Wilchis, R.; Guevara-Chumacero, L.M.; Ángeles Pérez, N.; Juste, J.; Ibáñez, C.; Barriga-Sosa, I.D.L.A. Taxonomic Status Assessment of the Mexican Populations of Funnel-Eared Bats, Genus Natalus (Chiroptera: Natalidae). Acta Chiropterologica 2012, 14, 305. [Google Scholar] [CrossRef]
- Guevara-Chumacero, L.M.; López-Wilchis, R.; Pedroche, F.F.; Juste, J.; Ibáñez, C.; Barriga-Sosa, I.D.L.A. Molecular Phylogeography of Pteronotus davyi (Chiroptera: Mormoopidae) in Mexico. J. Mammal. 2010, 91, 220–232. [Google Scholar] [CrossRef]
- Zárate-Martínez, D.G.; López-Wilchis, R.; Ruiz-Ortíz, J.D.; Barriga-Sosa, I.D.L.A.; Serrato-Díaz, A.; Ibáñez, C.; Juste, J.; Guevara-Chumacero, L.M. Intraspecific Evolutionary Relationships and Diversification Patterns of the Wagner’s Mustached Bat, Pteronotus personatus (Chiroptera: Mormoopidae). Acta Chiropterologica 2018, 20, 51–58. [Google Scholar] [CrossRef]
- Sikes, R.S. The Animal Care and Use Committee of the American Society of Mammalogists 2016 Guidelines of the American Society of Mammalogists for the Use of Wild Mammals in Research and Education. J. Mammal. 2016, 97, 663–688. [Google Scholar] [CrossRef]
- Anonymous. Lineamientos para la Conducción ética de la Investigación, la Docencia y la Difusión de la División de Ciencias Biológicas y de la Salud; Universidad Autónoma Metropolitana, Iztapalapa: Ciudad de México, México, 2010; p. 39. [Google Scholar]
- Fumagalli, L.; Taberlet, P.; Favre, L.; Hausser, J. Origin and Evolution of Homologous Repeated Sequences in the Mitochondrial DNA Control Region of Shrews. Mol. Biol. Evol. 1996, 13, 31–46. [Google Scholar] [CrossRef]
- Kearse, M.; Moir, R.; Wilson, A.; Stones-Havas, S.; Cheung, M.; Sturrock, S.; Buxton, S.; Cooper, A.; Markowitz, S.; Duran, C.; et al. Geneious Basic: An Integrated and Extendable Desktop Software Platform for the Organization and Analysis of Sequence Data. Bioinformatics 2012, 28, 1647–1649. [Google Scholar] [CrossRef] [PubMed]
- Méndez-Rodríguez, A.; López-Wilchis, R.; Serrato-Díaz, A.; del Río-Portilla, M.A.; Guevara-Chumacero, L.M. Isolation and Characterization of Microsatellite Markers for Funnel-Eared Bats Natalus mexicanus (Chiroptera: Natalidae) and Cross-Amplification Using Next-Generation Sequencing. Biochem. Syst. Ecol. 2015, 62, 69–72. [Google Scholar] [CrossRef]
- Bandelt, H.J.; Forster, P.; Rohl, A. Median-Joining Networks for Inferring Intraspecific Phylogenies. Mol. Biol. Evol. 1999, 16, 37–48. [Google Scholar] [CrossRef]
- Pfenninger, M.; Posada, D. Phylogeographic History of the Land Snail Candidula unifasciata (Helicellinae, Stylommatophora): Fragmentation, Corridor Migration, and Secondary Contact. Evolution 2002, 56, 1776–1788. [Google Scholar] [CrossRef] [PubMed]
- Tamura, K.; Peterson, N.; Stecher, G.; Nei, M.; Kumar, S. MEGA5: Molecular Evolutionary Genetics Analysis Using Maximum Likelihood, Evolutionary Distance, and Maximum Parsimony Methods. Mol. Biol. Evol. 2011, 28, 2731–2739. [Google Scholar] [CrossRef] [PubMed]
- Librado, P.; Rozas, J. DnaSP v5: A Software for Comprehensive Analysis of DNA Polymorphism Data. Bioinformatics 2009, 25, 1451–1452. [Google Scholar] [CrossRef]
- Excoffier, L.; Lischer, H.E.L. Arlequin suite ver 3.5: A New Series of Programs to Perform Population Genetics Analyses Under Linux and Windows. Mol. Ecol. Resour. 2010, 10, 564–567. [Google Scholar] [CrossRef]
- Manni, F.; Guérard, E.; Heyer, E. Geographic Patterns of (Genetic, Morphologic, Linguistic) Variation: How Barriers can be Detected by “Monmonier´s Algorithm”. Hum. Biol. 2004, 76, 173–190. [Google Scholar] [CrossRef]
- Slatkin, M.; Hudson, R.R. Pairwise Comparisons of Mitochondrial DNA Sequences in Stable and Exponentially Growing Populations. Genetics 1991, 129, 555–562. [Google Scholar] [CrossRef] [PubMed]
- Harpending, R.C. Signature of Ancient Population Growth in a Low-Resolution Mitochondrial DNA Mismatch Distribution. Hum. Biol. 1994, 66, 591–600. [Google Scholar]
- Tajima, F. The Effect of Change in Population Size on DNA Polymorphism. Genetics 1989, 123, 597–601. [Google Scholar] [CrossRef] [PubMed]
- Fu, Y.-X. Statistical Tests of Neutrality of Mutations Against Population Growth, Hitchhiking and Background Selection. Genetics 1997, 147, 915–925. [Google Scholar] [CrossRef]
- Drummond, A.J.; Rambaut, A. BEAST: Bayesian Evolutionary Analysis by Sampling Trees. BMC Evol. Biol. 2007, 7, 1–8. [Google Scholar] [CrossRef]
- Clare, E.L.; Adams, A.M.; Maya-Simões, A.Z.; Eger, J.L.; Hebert, P.D.; Fenton, M.B. Diversification and Reproductive Isolation: Cryptic Species in the Only New World High-Duty Cycle Bat, Pteronotus parnellii. BMC Evol. Biol. 2013, 13, 26. [Google Scholar] [CrossRef]
- Beerli, P.; Palczewski, M. Unified Framework to Evaluate Panmixia and Migration Direction Among Multiple Sampling Locations. Genetics 2010, 185, 313–326. [Google Scholar] [CrossRef]
- Van Oosterhout, C.; Hutchinson, W.F.; Wills, D.P.M.; Shipley, P. MICROCHECKER: Software for Identifying and Correcting Genotyping Errors in Microsatellite Data. Mol. Ecol. Notes 2004, 4, 535–538. [Google Scholar] [CrossRef]
- Chapuis, M.-P.; Estoup, A. Microsatellite Null Alleles and Estimation of Population Differentiation. Mol. Biol. Evol. 2006, 24, 621–631. [Google Scholar] [CrossRef]
- Hintze, J. PASS 11; NCSS, LLC.: Kaysville, UT, USA, 2011; Available online: www.ncss.com.
- Raymond, M.; Rousset, F. GENEPOP (Version 1.2): Population Genetics Software for Exact Tests and Ecumenicism. J. Hered. 1995, 86, 248–249. [Google Scholar] [CrossRef]
- Rice, W.R. Analyzing Tables of Statistical Tests. Evolution 1989, 43, 223–225. [Google Scholar] [CrossRef]
- Pritchard, J.K.; Stephens, M.; Donnelly, P. Inference of Population Structure Using Multilocus Genotype Data. Genetics 2000, 155, 945–959. [Google Scholar] [PubMed]
- Evanno, G.; Regnaut, S.; Goudet, J. Detecting the Number of Clusters of Individuals Using the Software Structure: A Simulation Study. Mol. Ecol. 2005, 14, 2611–2620. [Google Scholar] [CrossRef] [PubMed]
- Earl, D.A.; Vonholdt, B.M. STRUCTURE HARVESTER: A Website and Program for Visualizing STRUCTURE Output and Implementing the Evanno Method. Conserv. Genet. Resour. 2011, 4, 359–361. [Google Scholar] [CrossRef]
- Peakall, R.; Smouse, P.E. Genalex 6: Genetic Analysis in Excel. Population Genetic Software for Teaching and Research. Mol. Ecol. Notes 2006, 6, 288–295. [Google Scholar] [CrossRef]
- Wilson, G.A.; Rannala, B. Bayesian Inference of Recent Migration Rates Using Multilocus Genotypes. Genetics 2003, 163, 1177–1191. [Google Scholar] [PubMed]
- Collevatti, R.G.; Vitorino, L.C.; Vieira, T.B.; Oprea, M.; Telles, M.P. Landscape Changes Decrease Genetic Diversity in the Pallas’ Long-Tongued Bat. Perspect. Ecol. Conserv. 2020, 18, 169–177. [Google Scholar] [CrossRef]
- Petit, E.; Balloux, F.; Goudet, J. Sex-Biased Dispersal in a Migratory Bat: A Characterization Using Sex-Specific Demographic Parameters. Evolution 2001, 53, 635–640. [Google Scholar] [CrossRef]
- Moussy, C.; Hosken, D.; Mathews, F.; Smith, G.; Aegerter, J.; Bearhop, S. Migration and Dispersal Patterns of Bats and Their Influence on Genetic Structure. Mammal. Rev. 2012, 43, 183–195. [Google Scholar] [CrossRef]
- Flores, V.; Carter, G.G.; Halczok, T.K.; Kerth, G.; Page, R.A. Social Structure and Relatedness in the Fringe-Lipped Bat (Trachops cirrhosus). R. Soc. Open Sci. 2020, 7, 192256. [Google Scholar] [CrossRef]
- Torres-Flores, J.W.; López-Wilchis, R.; Soto-Castruita, A. Dinámica Poblacional, Selección de Sitios de Percha y Patrones Reproductivos de Algunos Murciélagos Cavernícolas en el Oeste de México. Rev. Biol. Trop. 2012, 60, 1369–1389. [Google Scholar] [CrossRef]
- Mitchell, G.C. Population Study of the Funnel-Eared Bat (Natalus stramineus) in Sonora. Southwest. Nat. 1967, 12, 172. [Google Scholar] [CrossRef]
- Tejedor, A. A New Species of Funnel-Eared Bat (Natalidae: Natalus) from Mexico. J. Mammal. 2005, 86, 1109–1120. [Google Scholar] [CrossRef]
- Tejedor, A. Systematics of Funnel-Eared Bats (Chiroptera: Natalidae). Bull. Am. Mus. Nat. Hist. 2011, 353, 1–140. [Google Scholar] [CrossRef]
- Arstens, B.C.C.; Sullivan, J.; Avalos, L.M.D.; Arsen, P.A.L.; Pedersen, S.C. Exploring Population Genetic Structure in Three Species of Lesser Antillean Bats. Mol. Ecol. 2004, 13, 2557–2566. [Google Scholar] [CrossRef]
- Russell, A.L.; Medellín, R.A.; McCracken, G.F. Genetic Variation and Migration in the Mexican Free-Tailed Bat (Tadarida brasiliensis mexicana). Mol. Ecol. 2005, 14, 2207–2222. [Google Scholar] [CrossRef]
- Dong, J.; Mao, X.; Sun, H.; Irwin, D.M.; Zhang, S.; Hua, P. Introgression of Mitochondrial DNA Promoted by Natural Selection in the Japanese Pipistrelle Bat (Pipistrellus abramus). Genetica 2014, 142, 483–494. [Google Scholar] [CrossRef] [PubMed]
- Arteaga, M.C.; Piñero, D.; Eguiarte, L.E.; Gasca, J.; Medellín, R.A. Genetic Structure and Diversity of the Nine-Banded Armadillo in Mexico. J. Mammal. 2012, 93, 547–559. [Google Scholar] [CrossRef]
- Ruiz, E.A.; Vargas-Miranda, B.; Zúñiga, G. Late-Pleistocene Phylogeography and Demographic History of Two Evolutionary Lineages of Artibeus jamaicensis (Chiroptera: Phyllostomidae) in Mexico. Acta Chiropterologica 2013, 15, 19–33. [Google Scholar] [CrossRef]
- Metcalfe, S.E.; O’Hara, S.L.; Caballero, M.; Davies, S.J. Records of Late Pleistocene–Holocene Climatic Change in Mexico—A Review. Quat. Sci. Rev. 2000, 19, 699–721. [Google Scholar] [CrossRef]
- Hofreiter, M.; Stewart, J. Ecological Change, Range Fluctuations and Population Dynamics During the Pleistocene. Curr. Biol. 2009, 19, R584–R594. [Google Scholar] [CrossRef] [PubMed]
- Rocha-Méndez, A.; Sánchez-González, L.A.; González, C.; Navarro-Sigüenza, A.G. The Geography of Evolutionary Divergence in the Highly Endemic Avifauna from the Sierra Madre del Sur, Mexico. BMC Evol. Biol. 2019, 19, 237. [Google Scholar] [CrossRef] [PubMed]
- Barber, B.R.; Klicka, J. Two Pulses of Diversification Across the Isthmus of Tehuantepec in a Montane Mexican Bird Fauna. Proc. Royal Soc. B Biol. Sci. 2010, 277, 2675–2681. [Google Scholar] [CrossRef]
- Mason, N.A.; Olvera-Vital, A.; Lovette, I.J.; Navarro-Sigüenza, A.G. Hidden Endemism, Deep Polyphyly, and Repeated Dispersal Across the Isthmus of Tehuantepec: Diversification of the White-Collared Seedeater Complex (Thraupidae: Sporophila torqueola). Ecol. Evol. 2018, 8, 1867–1881. [Google Scholar] [CrossRef]
- Guevara-Chumacero, L.M.; López-Wilchis, R.; Juste, J.; Ibáñez, C.; Martínez-Méndez, L.A.; Barriga-Sosa, I.D.L.A. Conservation Units of Pteronotus davyi (Chiroptera: Mormoopidae) in Mexico Based on Phylogeographical Analysis. Acta Chiropterologica 2013, 15, 353–363. [Google Scholar] [CrossRef]
- Hernández-Soto, M.; Licona-Vera, Y.; Lara, C.; Ornelas, J.F. Molecular and Climate Data Reveal Expansion and Genetic Differentiation of Mexican Violet-Ear Colibri thalassinus thalassinus (Aves: Trochilidae) Populations Separated by the Isthmus of Tehuantepec. J. Ornithol. 2018, 159, 687–702. [Google Scholar] [CrossRef]
- Zamudio-Beltrán, L.E.; Licona-Vera, Y.; E Hernández-Baños, B.; Klicka, J.; Ornelas, J.F. Phylogeography of the Widespread White-Eared Hummingbird (Hylocharis leucotis): Pre-glacial Expansion and Genetic Differentiation of Populations Separated by the Isthmus of Tehuantepec. Biol. J. Linn. Soc. 2020, 130, 247–267. [Google Scholar] [CrossRef]
- Arroyo-Cabrales, J.; Álvarez, T. A Preliminary Report of the Late Quaternary Mammal Fauna from Loltún Cave, Yucatán, México. In Ice Age Cave Faunas of North America; Shubert, B.W., Mead, J.I., Graham., R.W., Eds.; Indiana University Press y Denver Museum of Nature and Science: Bloomington, IN, USA, 2003; pp. 262–272. [Google Scholar]
- León-Tapia, M.A. DNA Barcoding and Demographic History of Peromyscus yucatanicus (Rodentia: Cricetidae) Endemic to the Yucatan Peninsula, Mexico. J. Mamm. Evol. 2020, 1–15. [Google Scholar] [CrossRef]
- Castella, V.; Ruedi, M.; Excoffier, L. Contrasted Patterns of Mitochondrial and Nuclear Structure Among Nursery Colonies of the Bat Myotis myotis. J. Evol. Biol. 2008, 14, 708–720. [Google Scholar] [CrossRef]
- Flanders, J.; Jones, G.; Benda, P.; Dietz, C.; Zhang, S.; Li, G.; Sharifi, M.; Rossiter, S.J. Phylogeography of the Greater Horseshoe Bat, Rhinolophus ferrumequinum: Contrasting Results from Mitochondrial and Microsatellite data. Mol. Ecol. 2009, 18, 306–318. [Google Scholar] [CrossRef] [PubMed]
- Naidoo, T.; Schoeman, M.C.; Goodman, S.M.; Taylor, P.J.; Lamb, J.M. Discordance Between Mitochondrial and Nuclear Genetic Structure in the Bat Chaerephon pumilus (Chiroptera: Molossidae) from Southern Africa. Mamm. Biol. 2016, 81, 115–122. [Google Scholar] [CrossRef]
- Brito, P.H. Contrasting Patterns of Mitochondrial and Microsatellite Genetic Structure Among Western European Populations of Tawny Owls (Strix aluco). Mol. Ecol. 2007, 16, 3423–3437. [Google Scholar] [CrossRef]
- Zink, R.M. Microsatellite and Mitochondrial DNA Differentiation in the Fox Sparrow. Condor 2008, 110, 482–492. [Google Scholar] [CrossRef]
- Zarza, E.; Reynoso, V.H.; Emerson, B.C. Discordant Patterns of Geographic Variation Between Mitochondrial and Microsatellite Markers in the Mexican Black Iguana (Ctenosaura pectinata) in a Contact Zone. J. Biogeogr. 2011, 38, 1394–1405. [Google Scholar] [CrossRef]
- Monsen, K.J.; Blouin, M.S. Genetic Structure in a Montane Ranid Frog: Restricted Gene Flow and Nuclear–Mitochondrial Discordance. Mol. Ecol. 2003, 12, 3275–3286. [Google Scholar] [CrossRef]
- Chen, Z.; Li, H.; Zhai, X.; Zhu, Y.; He, Y.; Wang, Q.; Li, Z.; Jiang, J.; Xiong, R.; Chen, X. Phylogeography, Speciation and Demographic History: Contrasting Evidence from Mitochondrial and Nuclear Markers of the Odorrana graminea sensu lato (Anura, Ranidae) in China. Mol. Phylogenetics Evol. 2020, 144, 106701. [Google Scholar] [CrossRef] [PubMed]
- Murphy, R.W.; Murphy, R.W. Paleobiogeography and Genetic Differentiation of the Baja California Herpetofauna. Occas. Papers Calif. Acad. Sci. 1983, 137, 1–48. [Google Scholar]
- Riddle, B.R.; Hafner, D.J.; Alexander, L.F.; Jaeger, J.R. Cryptic Vicariance in the Historical Assembly of a Baja California Peninsular Desert Biota. Proc. Natl. Acad. Sci. USA 2000, 97, 14438–14443. [Google Scholar] [CrossRef]
- López-Wilchis, R.; Flores-Romero, M.; Guevara-Chumacero, L.M.; Serrato-Díaz, A.; Díaz-Larrea, J.; Salgado-Mejia, F.; Ibáñez, C.; Salles, L.O.; Juste, J. Evolutionary Scenarios Associated with the Pteronotus parnellii Cryptic Species-Complex (Chiroptera: Mormoopidae). Acta Chiropterologica 2016, 18, 91–116. [Google Scholar] [CrossRef]
- Hernández-Canchola, G.; León-Paniagua, L. Genetic and Ecological Processes Promoting Early Diversification in the Lowland Mesoamerican Bat Sturnira parvidens (Chiroptera: Phyllostomidae). Mol. Phylogenetics Evol. 2017, 114, 334–345. [Google Scholar] [CrossRef] [PubMed]
- Zárate-Martínez, D.G. Relaciones Filogenéticas y Filogeográficas en el Murciélago Pteronotus personatus (Chiroptera: Mormoopidae). Ph.D. Thesis, Universidad Autónoma Metropolitana, Ciudad de México, México, 2019. [Google Scholar]
- Sullivan, J.; Markert, J.A.; Kilpatrick, C.W. Phylogeography and Molecular Systematics of the Peromyscus aztecus Species Group (Rodentia: Muridae) Inferred Using Parsimony and Likelihood. Syst. Biol. 1997, 46, 426–440. [Google Scholar] [CrossRef] [PubMed]
- Hafner, M.S.; Spradling, T.A.; Light, J.E.; Hafner, D.J.; Demboski, J.R. Systematic Revision of Pocket Gophers of the Cratogeomys gymnurus Species Group. J. Mammal. 2004, 85, 1170–1183. [Google Scholar] [CrossRef]
- Instituto Nacional de Estadística y Geografía (INEGI). Carta de Uso del Suelo y Vegetación, Escala 1:250,000, 2016, serie VI (Continuo Nacional); Instituto Nacional de Estadística y Geografía: Aguascalientes, México, 2016. [Google Scholar]
- Burg, T.M.; Gaston, A.J.; Winker, K.; Friesen, V.L. Rapid Divergence and Postglacial Colonization in Western North American Steller’s Jays (Cyanocitta stelleri). Mol. Ecol. 2005, 14, 3745–3755. [Google Scholar] [CrossRef]
- Adams, R.V.; Burg, T.M. Influence of Ecological and Geological Features on Rangewide Patterns of Genetic Structure in a WideSpread Passerine. Heredity 2015, 114, 143–154. [Google Scholar] [CrossRef] [PubMed]
- Robinson, J.A.; Räikkönen, J.; Vucetich, L.M.; Vucetich, J.A.; Peterson, R.O.; Lohmueller, K.E.; Wayne, R.K. Genomic Signatures of Extensive Inbreeding in Isle Royale Wolves, a Population on the Threshold of Extinction. Sci. Adv. 2019, 5, eaau0757. [Google Scholar] [CrossRef] [PubMed]
- Santymire, R.M.; Lonsdorf, E.V.; Lynch, C.M.; Wildt, D.E.; Marinari, P.E.; Kreeger, J.S.; Howard, J.G. Inbreeding Causes Decreased Seminal Quality Affecting Pregnancy and Litter Size in the Endangered Black-Footed Ferret. Anim. Conserv. 2019, 22, 331–340. [Google Scholar] [CrossRef]
- Hinkson, K.M.; Poo, S. Inbreeding Depression in Sperm Quality in a Critically Endangered Amphibian. Zoo Biol. 2020, 39, 197–204. [Google Scholar] [CrossRef]
- Lawson, L.P.; Fessl, B.; Vargas, F.H.; Farrington, H.L.; Cunninghame, H.F.; Mueller, J.C.; Nemeth, E.; Sevilla, P.C.; Petren, K. Slow Motion Extinction: Inbreeding, Introgression, and Loss in the Critically Endangered Mangrove Finch (Camarhynchus heliobates). Conserv. Genet. 2016, 18, 159–170. [Google Scholar] [CrossRef]
- Gómez-Sánchez, D.; Olalde, I.; Sastre, N.; Enseñat, C.; Carrasco, R.; Marques-Bonet, T.; Lalueza-Fox, C.; Leonard, J.A.; Vilà, C.; Ramírez, O. On the Path to Extinction: Inbreeding and Admixture in a Declining Grey Wolf Population. Mol. Ecol. 2018, 27, 3599–3612. [Google Scholar] [CrossRef]
- Torres-Flores, J.W.; López-Wilchis, R. Condiciones Microclimáticas, Hábitos de Percha y Especies Asociadas a los Refugios de Natalus stramineus en México. Acta Zoológica Mex. 2010, 26, 191–213. [Google Scholar] [CrossRef]


Publisher’s Note: MDPI stays neutral with regard to jurisdictional claims in published maps and institutional affiliations. |
© 2021 by the authors. Licensee MDPI, Basel, Switzerland. This article is an open access article distributed under the terms and conditions of the Creative Commons Attribution (CC BY) license (http://creativecommons.org/licenses/by/4.0/).