
Landscape and Species Traits Co-Drive Roadkills of Bats in a Subtropical Island


1
Southeast Asian Bat Conservation Research Unit, Lubbock, TX 79409, USA
2
Division of Habitats and Ecosystems, Endemic Species Research Institute, 1, Ming-shen East Road, Jiji, Nantou 552, Taiwan
3
Institute of Ecology and Evolutionary Biology, National Taiwan University, 1, Section 4, Roosevelt Road, Taipei 106, Taiwan
4
Division of Zoology, Endemic Species Research Institute, 1, Ming-shen East Road, Jiji, Nantou 552, Taiwan
*
Authors to whom correspondence should be addressed.
†
These authors contribute equally to the work and share the co-first authorship.
Diversity 2021, 13(3), 117; https://doi.org/10.3390/d13030117
Submission received: 20 January 2021
/
Revised: 1 March 2021
/
Accepted: 3 March 2021
/
Published: 10 March 2021
(This article belongs to the Special Issue Diversity Aspects in Bats: Genetics, Morphology, Community Structure)
Abstract
:The expansion of roads has threatened wildlife populations by driving casualties due to vehicle collisions. However, the ecological drivers of wildlife roadkills are not yet fully explored. We investigated the strength of landscape features and ecomorphological traits in determining spatial patterns of bat roadkills in Taiwan. In total, 661 roadkills that belonged to 20 bat species were acquired by citizen scientists between 2011 and 2019. The number and species richness of victim bats declined with increasing elevations with varying species compositions. Elevation and artificial light had significantly negative effects on the occurrence of roadkill, whereas protected area and its interaction with elevation had positive effects. Ordination analyses showed that roadkills were driven by different ecomorphological traits and landscape features. At low elevations, road casualties were associated with an aerial hawking hunting strategy. At higher elevations, roadkills were associated with higher elevational distribution. Roadkills of non-cave bats were associated with brighter environments, suggesting that bats might be exposed to higher risk when hunting insects near artificial light. Our findings suggest that management agencies shall consider both species traits and landscape features when planning impact assessments and mitigation practices of roadkills for bats and probably other wildlife, particularly when long environmental gradients are covered.
1. Introduction
The development of modern transportation is considered one of the major threats to global biodiversity in the Anthropocene. The increased use of automobiles and expansion of roadway infrastructures can impact terrestrial ecosystems via fragmentation and degradation of natural habitat, pollutions (light, noise, and air), disruption of energy flow, nutrient cycles, and water regeneration process, accidental introduction of alien species, as well as wildlife collision mortality [1,2]. Among all these threats, collision with vehicles might be the most immediate road-associated process that drives the direct loss of wildlife individuals, which could lead to declines and degradation of vulnerable populations [3,4,5] and damage efforts of existing conservation works. For example, road mortality of 124 vertebrate species, including 17 IUCN (International Union for Conservation of Nature and Natural Resources) Endangered and four Vulnerable species, is reported from a confined road section (47 km in length) of the Dong Phayayen-Khao Yai World Heritage Site in Thailand [6]. In extreme cases, subsequential loss of key ecosystem functions may occur if collisions suppress the keystone species due to population declines and road avoidance [7]. Therefore, understanding the influences and underlying drivers of wildlife roadkill is critical, especially since the expansion of roadway infrastructure and traffic volume increases continuously every year [8].
With over 1400 species [9], bats are one of the most species-rich and ecologically diverse mammalian orders. Bats are usually considered as good indicators of environmental changes due to their strong associations with habitats and high sensitivity to disturbances [10], including mortality due to vehicle collision [11]. Although bat roadkills are only reported from a few countries [6,12,13,14,15,16], the fact that bats and viceless can be found globally suggests that it is an overlooked threat to global bat populations. Incidence rate and spatial patterns of bat roadkills have been demonstrated to be associated with roadside microhabitats, landscape features, for example, distance to critical resources, and roadway designs [6,14,17,18,19]. Other factors, including volume and speed of traffic [19], sex, age [13,18], and seasonality of reproductive phenology, migration, and hibernation behaviors [6,14,18], have also been found to be related to bat roadkills in certain areas. Interspecific variation in roadkill rate within a bat assemblage is likely to be driven by differences in behavioral responses to road infrastructure, flight mode, and habitat selection mediated by the constraint of species traits. A meta-analysis based on 12 empirical studies by [13] concluded that low-flying bats are more vulnerable than high-flying bats. Other cases show that trophic level [15], abundance [17], and tolerance to human disturbance [19] are also important traits in mediating the roadkill of bats. In addition, evidence shows that bats adjusted their activity patterns near roads based on their sensitivity to adjacent habitat types [20], traffic noses [21], and streetlights [22,23,24]. Although not documented, such behavioral adjustments could directly affect the likelihood that bats collide with vehicles.
In contrast to the success of environment variables and species traits in explaining the spatial patterns of bat roadkills at the local scale, such factors have not been found to explain spatial patterns at the regional and global scale. Vulnerable species and key environmental and trait determinants vary between studies, locations, and geographic regions [11,18]. Studies on Brazilian bats show that frugivores and omnivores (family Phyllostomidae) have more roadkill incidence than insectivore and carnivore species [15,19]. However, a significantly higher road mortality rate of insectivores compared to frugivores (family Pteropodidae) was observed in Thailand, contradicting the findings in the Neotropics. A similar case but less complicated scenario includes examples from Poland. Lesiński (2007) [18] reported bat roadkills were more common for the ground gleaners and rare for the high aerial hawkers. In contrast, Lesiński et al. (2011) [25] found that Nyctalus noctula, a common high aerial hawker in Poland, contributed almost near one-third of the total bat roadkills in the central region of the country, representing the most vulnerable species. The discrepancy in the findings among studies suggests that environmental features or trait diversity alone is not enough to explain the regional variations between areas with distinct bat fauna, which is the case when comparing patterns of bat roadkills between Brazil and Thailand, as mentioned earlier.
Taiwan Island houses a diverse bat fauna that contains 33 species of six families [26]. With more than 200 mountain peaks attaining heights over 3000 m on the island, the terrain, climatic conditions, vegetation diversity, and intensity of anthropogenic disturbances vary significantly along the elevational gradient in Taiwan [27,28,29]. Unsurprisingly, the island’s bat species also show strong distribution patterns across the elevational gradient. Bat fauna of the higher elevation areas is characterized by the presence of some Eurasian taxa, such as genera Plecotus and Barbastella, whereas bat fauna of the lower elevation areas is characterized by the presence of Indochinese taxa, including Pteropodidae, Hipposideridae, Kerivoula, and Scotophilus [30,31]. The densities of road and vehicles in Taiwan were 118 km/km2 and 204 unit/km2 in 2017, respectively, which are considered high compared to global standards [32,33], and hundreds of incidences of bat roadkill have been reported throughout the island [34]. However, the information about roadkill of individual bat species and the ecological causes have not been described and evaluated. The considerable variations in abiotic, biotic factors, and the diverse bat fauna that occur along the elevational gradient present us with a unique opportunity to understand how the spatial patterns of roadkills, environmental variables, and species traits are associated with each other.
In the present study, we revisited the same dataset used by Chyn et al. (2019) [34] with recent updates to assess the associations between bat roadkill, landscape features, and ecomorphological traits in Taiwan. Our objectives were three-fold. First, we investigated the spatial and temporal patterns of bat roadkill incidence. Then, we identified the influences of different landscape features in driving the spatial pattern of bat roadkill occurrence. Lastly, we tested the responses of individual ecomorphological traits to the influential landscape features associated with the occurrence of bat roadkill in space. We predicted the following: (1) the occurrence of bat roadkills would covary with species-specific elevational distributions. More specifically, we expected Indochinese species to have a higher chance of road collisions at lower elevation, whereas Eurasian species will have a higher chance at higher elevation; (2) consequently, assemblage structures of bat roadkill fauna would also show elevational variations. Such variations would be mediated by trait responses that covaried with the elevational variations in environmental features. Specifically, we expected that forest bat species that were usually characterized by a high-pitched echolocation call and clutter foraging strategy would have higher chances of road collisions at higher elevation where forest cover is generally high. On the other hand, species adapted to a disturbed landscape that were usually characterized by low-pitched calls and an open space foraging strategy would have higher chances at lowland where forest cover is low.
2. Materials and Methods
The study area is located on Taiwan Island, which is centered on the Tropic of Cancer in East Asia (21°55′–25°20′ N, 119°30′–122°00′ E). The island is 36,193 km2 in area. In the central and eastern parts of the island, the terrain is mountainous and has an altitude of up to almost 4000 m asl. The western part is typically composed of plains and is hilly, which are usually less than 100 m in elevation. The island has a typical marine subtropical climate with an average annual precipitation of over 2500 mm. Typhoons often visit the island at least twice per year during July to September. Cold monsoon weather originates from the northeast to the island during the winter (November to early March). The temperature on the island exhibits a strong elevational pattern, which decreases significantly from the low to high elevation. The average temperature of the coldest and hottest months ranges from 16 to 20 °C and 28 to 29 °C, respectively, in the lowland, and it ranges from 0 to 6.5 °C and 8 to 15 °C, respectively, at the elevation over 3000 m. During the winter, the mountains peaks are often covered with snow in January and February [35].
In the lowlands and foothills of the mountains, particularly in northern and western Taiwan, the landscape is highly populated and dominated by agricultural lands, secondary forest fragments, and urban habitats, including high density of transportation infrastructure [29,36,37]. The mountainous areas are generally forested, except where the altitude is over 3200 m asl and is dominated by open habitats, such as short bamboo stands and bare land. The forest types vary along the elevational gradient. At low elevations (usually <1400 m asl), the natural forest is typically dominated by evergreen board-leaved trees of Fagaceae, Lauraceae, and Theaceae, and it is often mixed with large bamboo stands. At the mid-elevation level (c. 1400–2600 m asl), the natural vegetation is composed of evergreen and deciduous broad-leaved forest and mixed cloud forest dominated by trees of Fagaceae, Lauraceae, and Theaceae. The major forest type at the higher elevation level of 2500–3400 m is alpine forest dominated by coniferous trees of Cupressaceae and Pinaceae. At elevations above 3200 m, the vegetation is gradually replaced by conifer woodland and scrubland, including Fargesia bamboo stands, with increasing altitude and, hence, a decreasing dominance of canopy trees [28]. Old artificial forest of Japanese Cedar (Cryptomeria japonica), various types of orchards, or tea and vegetable plantations are also common at elevations up to 2600 m.
Bat roadkill data were extracted from the Taiwan Roadkill Observation Network (hereafter TaiRON [38]), which is a database designed by the Endemic Species Research Institute to collect roadkill incidence data of vertebrates and terrestrial crabs since 2011 [34]. For the present study, we restricted the records to those collected by citizen scientists, of which most records were attached to images of animals taken in the field and allowed us to confirm the initial identification by the observers. In some cases, animal corpses in good condition were taken as evidence by the observers and later preserved as specimens at the zoological museum of the Endemic Species Research Institute in Jiji Township, Taiwan. Putative taxa of the bats in photos were first identified by the collectors in the field and then by volunteers online in TaiRON’s Facebook group. The results were further revised by examining both the images and specimens by the first author. Samples were identified to the finest taxonomic level by morphological and craniodental traits following the existing keys in the literature [26,31].
For the species level, we summarized the elevational patterns of the occurrences of roadkills of individual bat species and compared the results with the elevational range of the known distribution for each species. To understand how bat roadkill “assemblages” varied along elevation, samples were assigned to different elevation subregions following a classification suggested by Chang (2015) [30] for bats in Taiwan. The classification subdivides Taiwanese bat fauna into five categories based on species elevation limits, which are 0–100 m, 100–500 m, 500–1500 m, 1500–2500 m, and >2500 m. Due to the small number of sampling grids at high elevation, we combined the highest two subregions in Chang (2015) [30] into one category, >1500 m. The new classification granted a more balanced sampling among the four elevational subregions (10,943, 8954, 9404, and 7670 grids for the subregions I, II, III, and IV, respectively) (also see Supplementary File S1 for the statistical justification). We first calculated the number of grids with bat roadkill detected and species richness of victim bats among elevation subregions. Then, we tested if the proportions of grid numbers and species richness differed from the expectations based on the ratios of the overall roadkill sample grids and known species richness across subregions using a Chi-square test of equality of proportions. The beta diversity of the bat roadkill assemblage between neighboring subregions was estimated to further evaluate the degree of inter-subregion variations in species compositions. We partitioned the overall beta diversity into species turnover (βSIM, replacement of species) and nestedness (βSNE, loss of species without replacement) components to account for the contributions of independent and dependent variables respectively, on richness differences between subregions [39,40].
To assess the associations between bat roadkill and landscape features, we excluded the roadkill data collected prior to the TaiRON citizen science standard procedure officially launched in 2013 to minimize sampling bias. All records were mapped to the grid system by ArcGIS software version 10.6, which subdivided the land area of Taiwan into 40,254 1 km-by-1 km girds according to the georeferenced data attached to the evidence images. Grids without any record of vertebrate roadkill were excluded from the analyses to avoid false absence due to low detectability or lack of survey effort. Due to the difficulty of distinguishing cryptic species of corpses morphologically in most cases, a hybrid of species and morphospecies was used for the analyses of trait responses to landscape features in association with bat roadkills. Two morphospecies are used for the following two species groups, including “Myotis frater complex” for M. frater and M. soror, and “other Pipistrellus” for all known Pipistrellus species, except P. abramus. This grouping arrangement only potentially reduced a small proportion of the victim “species” richness (up to 3) but gave opportunities to increase samples of the rare species in the sample due to the constraints of identification.
Twenty landscape features were used to test the associations between bat roadkills and environmental variables. Three topographic variables were selected, including the mean elevation, the mean slope, and distance to the nearest freshwater body. Ten landcover variables were selected, namely areas of farm field, meadow, forest, farm wetland, bushland, wetland, urban area, waterbody, bare land, and buildings. Habitat heterogeneity, which was estimated as the Shannon’s Diversity Index based on all habitat types, except the area composed of buildings, is included. The area composed of buildings is not included because it is acquired separately from the other habitat categories. Six anthropogenic landscape measures, including night light intensity, total length of roadway, number of human populations, occurrence of protected area, and distance to the nearest protected area and a fragmentation index are used. Due the lack of accessible traffic data, the number and density of the human population were used as approximates of the number and density of vehicles. Data of all variables were acquired from open sources [41,42] except for the following eight variables: habitat heterogeneity, night artificial light intensity, human population size, human population density, occurrence and extent of protected area, distance to the nearest protected area, and the fragmentation index, which were generated in this study. All variables were originally digitalized at the same spatial resolution of 1 km-by-1 km as the roadkill data, or, if not, rescaled to the same grid system by extrapolation and interpolation methods using the weight mean algorithm. Detailed definitions of the landscape variables are given in Appendix A Table A1, and the measurements are provided in the online Supplement Table S1.
Ten ecomorphological traits were selected to test the associations between traits, landscape features, and roadkills, seven of which are quantitative measures, namely forearm length, body mass, wingspan, frequency of maximum energy in echolocation calls, minimum of elevational distribution, maximum elevational distribution, and range of elevational distribution. For the first four quantitative measures, median values were estimated by the maximum and minimum values across literatures, as most available information are given in range or a single value. The remaining three traits are qualitative, namely echolocation call type, roost type use, and hunting mode. For the call type, we primarily followed the classification suggested by Jones and Teeling (2006) [43] but with an additional call type later described from Coelops frithii, which is one of the collision victim species in this study, by Ho et al. (2013) [44]. We followed Denzinger and Schnitzler (2013) [45] to assign species into five different hunting guilds according to foraging strategy, namely open space aerial-hawking, edge and gap aerial hawking, water trawling, and gleaning. Lastly, the use of cave, rock crevice, tree cavity, or foliage roosts is presented as presence–absence separately. Despite diverse roost types described in the literature, roost use category assignment was based on the shared roost attributes, such as physical structure and surface material, regardless of whether they are natural or artificial manmade structures. For example, the use of bat boxes was assigned to the category of tree cavity based on the confined space surrounded by woody materials. Trait data were summarized from existing information in the literature (see detailed citations information in the online Supplementary Table S2), the authors’ unpublished data from empirical studies on wild individuals and museum collections, previous field observations, and elevation data from the present project. To reduce measurement bias by different researchers, e.g., from differences in the minimum units among measurement kits used, all quantitative measures were rounded to the first decimal place. Trait data of each morphospecies were combined with the measurements of all species within each group. Definitions of the selected traits are listed in Table 1.
All statistics were carried out using R version 3.5.3 under RStudio environment (desktop version 1.1.456). Chi-square tests of equality of proportion were deployed using the prop.test function in the default stats package. Occurrence-based beta diversity measures were estimated with the Sorensen Index using the beta.pair function in the betapart package v.1.5.2. [57] for the following three elevation subregion pairs: subregions I vs. II, II vs. III, and III vs. IV. We used generalized linear mixed models (GLMM) with log link to test the significance of the effects of 20 landscape features (fixed factors) on the occurrence of bat roadkills in each grid with controls of the influences of event year (random factor) and month (fixed factor) using glmer function in the lme4 v. 1.1.23 package [58]. Quantitative measures were rescaled to z-score to avoid failure in estimating variances due to extreme values in some variables. We first ran the model with all 20 variables and the subsequential models based on selected variables with statistical significance in the previous model and their interactions. Then, we performed Akaike information criterion (AIC) and Bayesian information criterion (BIC) to choose the best predicted subset among the selected models based on the scores of both fit criteria using Ictab function in the bbmle v. 1.0.20 package [59]. To avoid inaccuracy in parameter estimates due to multicollinearity, only the selected landscape features of the best fitting GLMM model were used in the analyses of trait responses.
RLQ and fourth corner analyses were used to assess trait-based responses to landscape features. Both methods are ordination-based correlations of three tables, namely L matrix (species by grids), R matrix (landscape features by grids), and Q matrix (ecomorphological traits by species). The RLQ analysis measures the overall correlations between the three matrices. The relationship between the traits and landscape features can be tested by a global permutation test. The fourth corner analysis measures the strength of each individual trait–landscape feature relationship and tests the significance using a permutation procedure [60]. The RLQ and fourth corner analyses were performed using the rql and fourthcorner functions, respectively, in ade4 v. 1.7.25 package [61]. The significance of the global structure of RLQ analysis was tested using the randtest function. Permutations tests of the outputs of both methods were run with 14,999 iterations using the model 6 procedure to avoid inflated type I error [62]. In addition, the fdr method was used for estimating the adjusted p-values of the permutation test for the fourth corner model to avoid false discoveries [63]. In the present study, both RLQ and fourth corner analyses were built based on occurrence-based community data.
3. Results
3.1. General Patterns of Bat Roadkill Incidence
A total of 661 bat roadkill incidences were collected by the TaiRON from 2011 to March 2019. Of these, 62.2%, 4.5%, and 15.6% of the samples were identified to species, genus, and family levels, respectively (Table 2). Twenty species belonging to 14 genera of four families were recognized, 12 of which are endemic to the island at either species or subspecies levels. Two species, namely Coelops frithii formosanus and Myotis formosus flavus, were listed as Nationally Vulnerable in Taiwan and Near Threatened by the IUCN Red List. The remaining 18 species were either not considered as threatened both nationally and globally, or lack of sufficient data for further assessment for their conservation status (Table 2). With 98, 75, and 68 records respectively, Pipistrellus arbramus, Miniopterus fuliginosus, and Hipposideors armiger terasensis were the top three roadkill victim species, together contributing 58.2% of the samples with species identified. Scotophilus kuhlii, Murina puta, Rhinolophus monoceros, and Eptesicus pachyomus horikawai were also common in the samples, contributing to 6–10% of the total samples. The remaining 12 species were rare in the samples, which contained less than 10 records of each species and together accounted for only around 9.2% of the total samples with species identified (Table 2).
Bat roadkills (n = 598) also varied between months during the year 2013–2018. June to August, which was the summer season, represented the major peak of bat roadkills in all surveyed years, except in 2013, in which more bat roadkills were reported between August and October. September–October and March–April represent two minor peaks of bat roadkills within a year, and the remaining months had few records (Figure 1). Bat roadkill incidences were found throughout the island in general at a wide elevation range from the lowland to 3152 m (Figure 2). For the 2013–2018 period, samples of bat roadkill contribute to only c. 4.2% (n = 443) of the total sample grids with the records of all vertebrate road casualties (n = 10350).
3.2. Elevational Patterns of Occurrences of Bat Roadkill at Species Level
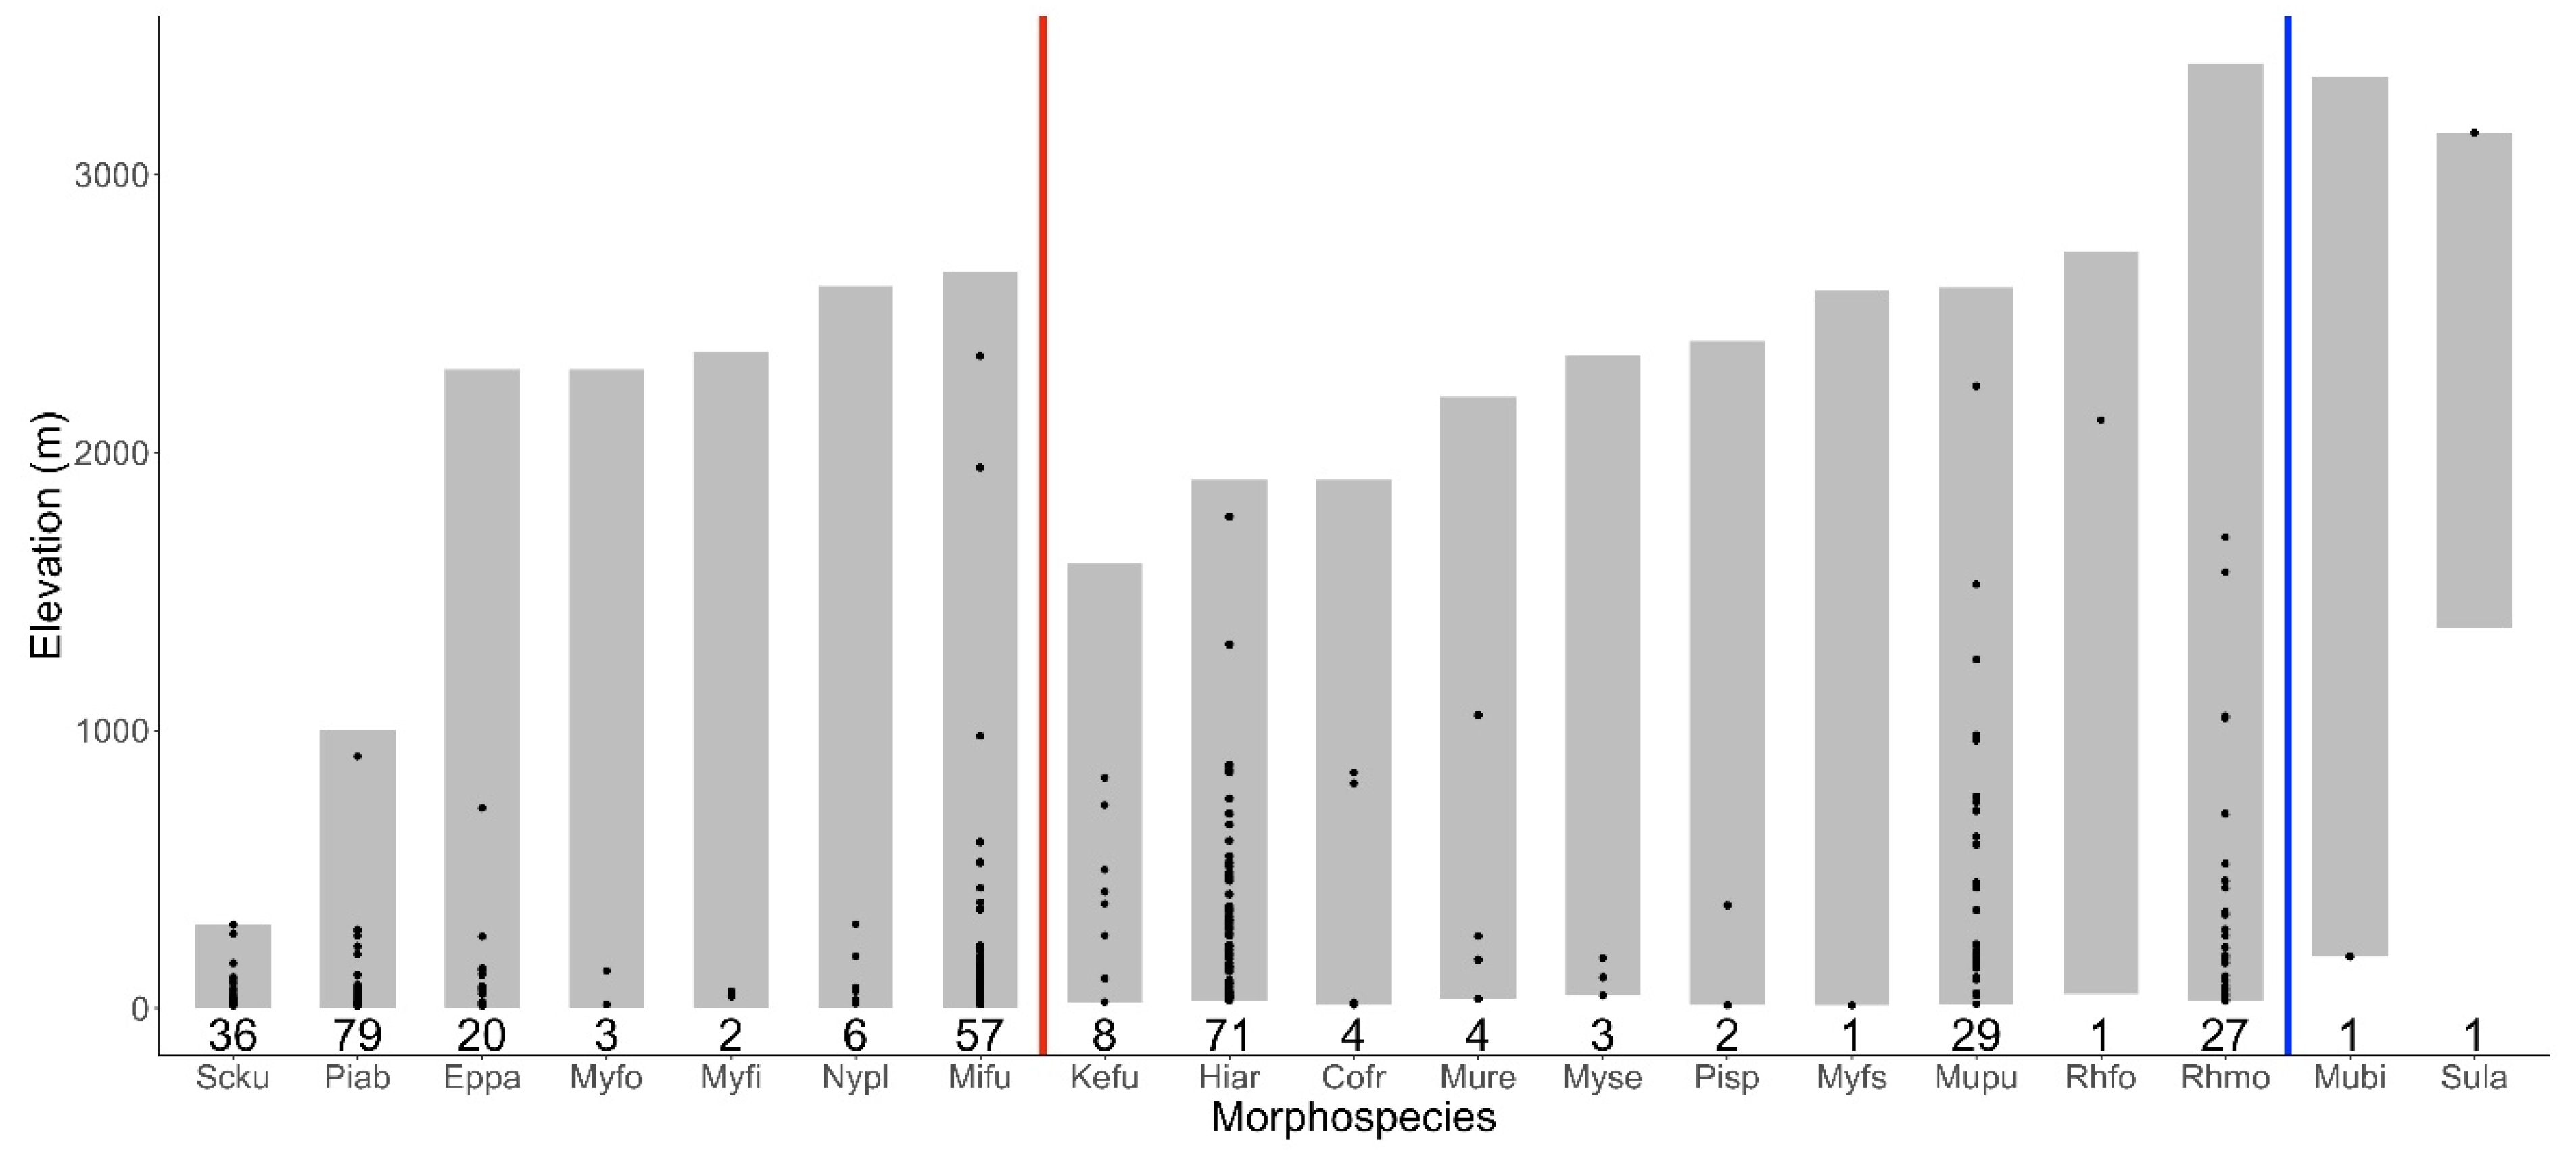
There were seven morphospecies and 17 morphospecies out of the 19 bat morphospecies found with roadkill records at elevations lower than 100 m and 500 m, respectively (Figure 3). Roadkills of seven and four species were recorded at elevations over 1000 m and 2000 m, respectively. Submyotodon latirostris is the only species recorded at over 3000 m and the only species with an elevation lower limit over 1000 m. Four species, namely H. armiger, R. monoceros, M. puta, and M. fuliginosus, showed a wide elevational range of roadkill distribution between 1500 and 2000 m. The remaining 15 species showed narrower elevational ranges (<1000 m) of roadkill distribution, although 13 of these species had a much wider elevational range in the species distribution (1578–3165 m) (Figure 3).
3.3. Elevational Patterns of Bat Roadkill at Assemblage Level
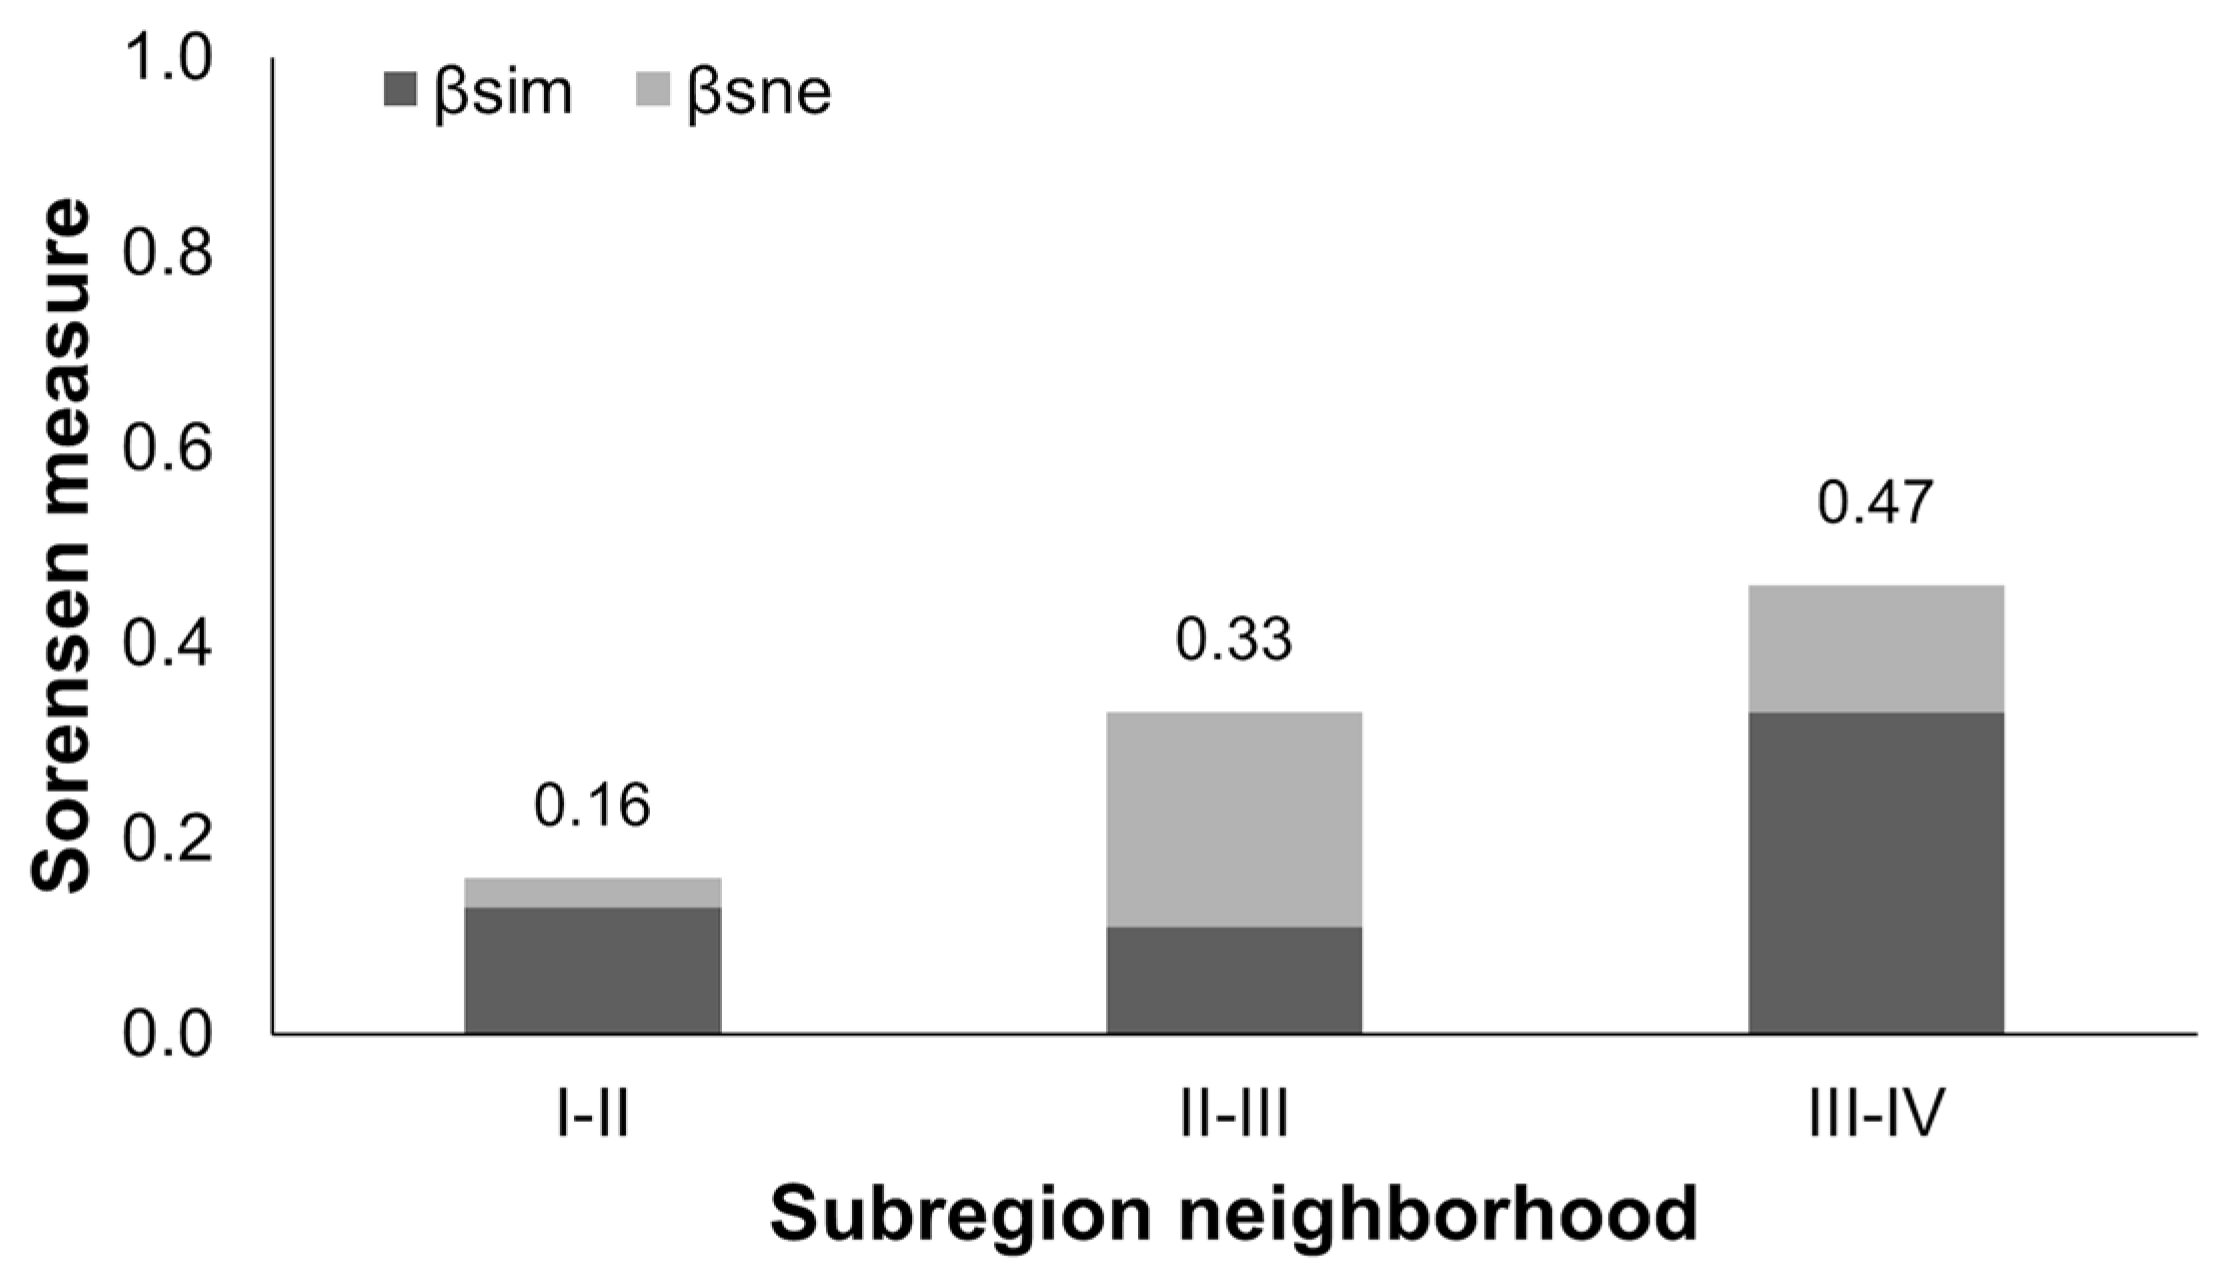
The elevation subregion I had the highest number of grids with bat roadkill recorded (n = 250), following by the subregion II (n = 144), subregion III (n = 39), and subregion IV (n = 9). The proportions of grid number of bat roadkill to the grid number of overall vertebrate roadkills of each elevational subregion differed significantly among the four subregions (X2 = 248.1, d.f. = 3, p < 0.001, test for equality of proportions). With 16 species, the elevation subregion I had the highest species richness of bat roadkill victims. Species richness of the subsequential subregions decreased with increasing elevation. The subregions II, III, and IV had 15, 9, and 6 species recorded. The proportions of victim species richness to the known species richness of each elevational subregion (17, 17, 16, and 17 species for the subregions I, II, III, and IV, respectively) differed significantly among the four subregions (X2 = 18.1, d.f. = 3, p < 0.001, test for equality of proportions). The overall measures of beta diversity increased with increasing elevation (Sorensen measures increased from 0.16 to 0.47 from the subregion pair I vs. II to the pair III vs. IV), suggesting increasing differentiations in species compositions between neighboring subregions at higher elevations (Figure 4). Nestedness contributed higher proportions than species turnover to the beta diversity of the two mid-elevation subregions (βSIM: 33.3%, βSNE: 66.7%). In contrast, species turnover processes contributed higher proportions than nestedness to the beta diversity of the pairs of the subregions I vs. II (βSIM: 81.3%, βSNE: 18.8%) and the subregions III vs. IV βSIM: 70.2%, βSNE: 27.8%).
3.4. Associations between the Occurrence of Bat Roadkills and Landscape Features
Of the 20 landscape features, 12 variables, namely the mean elevation (ELE), artificial light intensity (ALight), presence of protected area (PA), and all types of landcover, except the area of building, were significant in the full GLMM model (Table 3). ELE and ALight had negative effects on the occurrence of bat roadkills, whereas PA and the nine landcover types had a positive effect. A second GLMM model based on the 12 variables suggests that the effects of all landcover variables were not significant. Therefore, they were excluded from the subsequential models. Then, we tested the effects of the remaining three variables and the interactions between variables on bat roadkills. The results of the six models based on subsets were similar. The three selected landscape features had similar effects on bat roadkills to the grand model, and their effects were all significant. The interaction between PA and elevation had a significant positive effect, suggesting that the influence of protected area on bat roadkills increases with increasing elevation or vice versa. The interaction between ALight and PA had a significant negative effect, suggesting that the influence of protected area on bat roadkills decreases with increasing night light intensity or vice versa. No significant effects were found in the interaction between ELE and ALight as well as the interaction among three variables (Table 3). Combining the results of AIC and BIC criteria, the GLMM model contains ELE, ALight, PA, and the interaction between ELE and PA was the best fitting model (Table 3).
3.5. Trait-Based Responses to Landscape Features in Terms of the Occurrence of Bat Roadkill
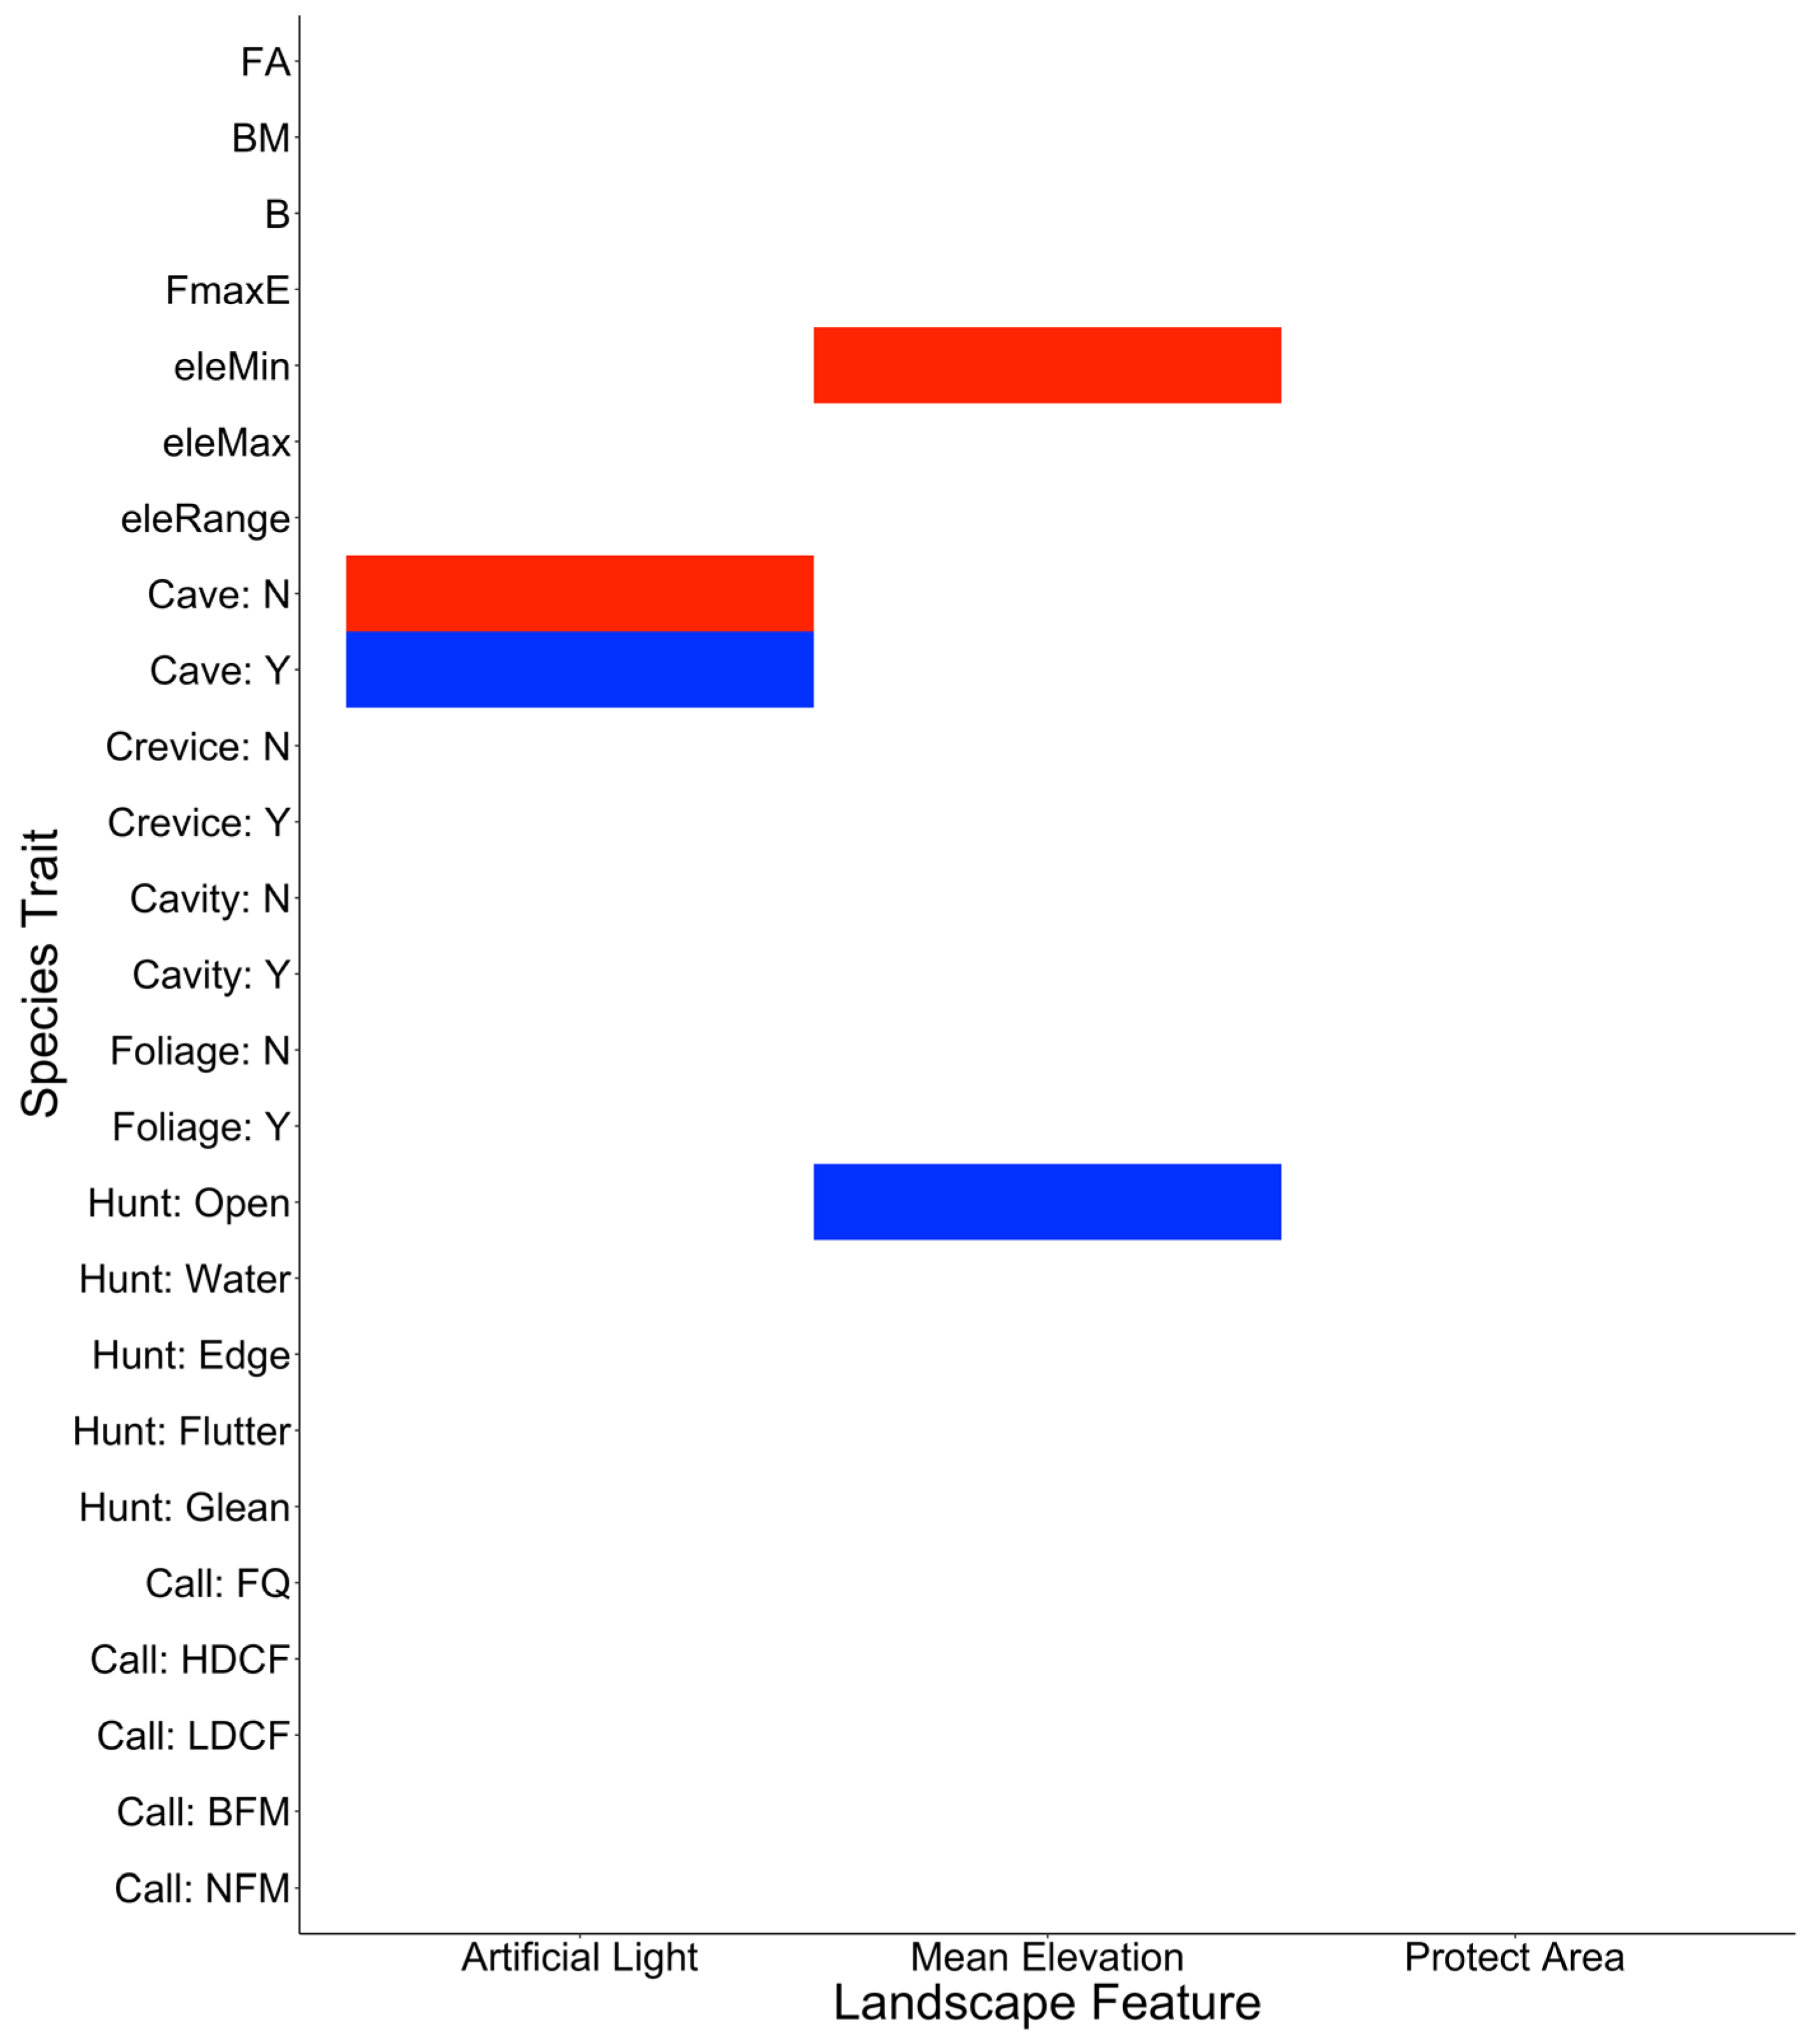
The overall association between the ecomorphological traits and the three GLMM-selected landscape features in the RLQ analysis was significant (permutation test: p = 0.0018). The first two axes of the RLQ analysis explained approximately 92.6% and 6.3% of the overall variation, respectively. Among the 75 possible trait–environment associations, four were significant (Figure 5). Bats that exhibited open space aerial hunting modes were negatively correlated with the mean elevation, whereas the lower limit of elevational distribution is positively correlated with the mean elevation. The use of cave roost was negatively correlated with night light intensity and vice versa (fdr adjusted p < 0.05, permutation test).
4. Discussion
In this study, we found significant elevational variations of bat roadkills from our long-term data in Taiwan. The overall abundance and species richness of collision victims declined significantly from low to high elevations, whereas evenness increased with increasing elevations. On the other hand, the beta diversity increased with the increasing elevation, suggesting increasing changes of species compositions of bat roadkills. The variations in species compositions between the mid-elevation areas with the lowland and high elevation were contributed more by species replacement than nestedness processes, whereas the variations within the mid-elevation areas show reversed patterns. At lower elevations, most of the roadkill victim species are Eurasian genera in the subfamily Vespertilioninae and family Miniopteridae. In contrast, at higher elevation, many of the road victims are species in the Indochinese families Hipposideridae, Rhinolophidae, and two vespertilionid subfamilies Kerivoulinae and Murininae. The results contradict our first prediction even though the elevational variations in incidences of roadkills were partially mediated by the constraints of species distribution—the lower elevation limit in this case rather than the upper limit as we predicted. Nevertheless, our findings support the local-assemblage-structure hypothesis that has been proposed in explaining the geographic variations of bat roadkills in Poland [18]. To our knowledge, this is the first study that demonstrates that elevation can affect spatial patterns of bat roadkills, revealing an overlooked but potentially important element in previous studies on wildlife road ecology.
Past studies have demonstrated the effectiveness of landscape features [6,13,14] and species traits [13,15,18,21] in explaining roadkill patterns of bats, respectively. Our data clearly show trait–environment associations in mediating bat roadkills in Taiwan. Beyond elevation and distribution limit, we also found that open-space bats are more likely killed at lower elevations outside protected areas. These species, which include Pipistrellus abramus, Miniopterus fuliginosus, Scotophilus kuhlii, and Eptesicus pachyomus, are commonly detected in disturbed lowland habitats, such as agricultural land, suburban, or urban habitats during acoustic surveys in the lowland [65], where the density of road and vehicles is generally high. It is noteworthy that all these species are common and widely distributed in East Asia or Southeast Asia [66], but only S. kuhlii had roadkill records reported from Thailand ([6], in the Supplementary File S1). Further investigations of whether these bat species are also roadkilled in other regions, within the species distributional ranges, are needed to have a better understanding of the impacts of vehicle collision to their global populations.
Our second prediction hypothesized that there were roadkill-associated trait-mediated responses to different environmental features along elevation. We found that bat roadkills at higher elevation were associated with the distributional limit of individual species. Common victims include species of vespertilionid subfamilies Murininae, Kerivoulinae, Myotinae, genera Hipposideros, and Rhinolophus. Most of them are common and abundant during trapping sessions in mountain areas [51,67], foraging at understory and ground levels [68], and are seldom recorded from the lowland [30]. The decrease of open space aerial hawkers in the roadkills at higher elevation is likely due to the restriction of the elevational upper limit of species distribution in this case. For example, P. abramus, the most common victim species in this study, is the most abundant bat in highly disturbed landscapes in the lowland and hills [65,69] but is generally less common in the mountain areas (e.g., [67]), despite its distribution up to 1000 m [70]. Other open space bats, e.g., E. pachymous and Nyctalus plancyi, are also reported as common during acoustic surveys in mountain areas with elevations over 2000 m [51]. In contrast, these two species are rarely recorded during understory-level trappings in mountain areas (e.g., [51]). It is possible that these bats fly higher in mountain areas to avoid difficult terrains [71] or to follow insects at a higher elevation in the sky [72,73] as observed in other open space species.
We found a positive effect of protected area on the occurrence of bat roadkills, and the influence increased with increasing elevation. Although not significant, two traits, namely frequency of maximum energy and open-space hunting strategy, showed trends in associating bat roadkills with the presence of protected area (0.05 < fdr adjusted p < 0.01, permutation tests, this study). The effects of protected area and its interaction with elevation have general associations with non-open space bats using constant frequency (Rhinolophus and Hipposideros) or broadband echolocation calls with high frequency (Murininae and Kerivoula). The higher casualty occurrence rate in the protected areas might be associated with the higher-quality habitats within, e.g., old-growth forest. Unexpectedly, we did not find any significant associations between bat roadkills and habitat types. The lack of bat roadkill–habitat relationship in this study might be a result of failing to test habitat effects at appropriated spatial scales. Few studies show that the effects of environment variables on wildlife roadkills are scale dependent [6,21]. The effects of protected area on bat roadkills could be explained by tourist traffic as many of the protected areas in Taiwan are popular tourism sites and connected with some major roadways in the country [74]. Therefore, higher wildlife roadkills at areas with high visitation rates and traffic volumes are expected. In the present study, we use the number and density of human population as approximate measures of traffic, which are unlikely representative for tourism activity. Unfortunately, there are no open-source data of traffic at the national scale available for further analyses.
Artificial light is identified as an emerging anthropogenic impact on bats [75] and could be associated with bat roadkills in several ways. Bats with negative phototactic behavior may avoid areas with strong artificial light during the night [24,76], including bat-friendly underpasses, overpasses, and gantries [11,22]. The light avoidance behavior can force bats to fly across roads in darker areas to reach critical resources [77,78], which may increase the risk of bat–vehicle collision. This might explain why bat roadkills show a negative correlation between the cave roosting behavior and night light. Cave specialists, e.g., Rhinolophus bats, are known to be sensitive to light conditions near roost entrances [79]. Coelops frithii and Myotis formosus, the two most vulnerable species in our study, are known to roost in caves and show light-avoidance behaviors near the roost entrance and during foraging [80,81]. The anti-phototactic behavior may bring these bats closer to potential risks of collision with vehicles when they forage in areas or roost in caves close to roads in dark environments. On the other hand, bats that exhibit positive phototaxis might be attracted by swarming insects surrounding lights [82,83]. For example, P. arbramus, a non-cave roosting bat and the most frequently recorded victim species in this study, is often observed hunting insects near streetlights (JCCH personal observation). The food resource-related positive phototaxis could also bring this non-cave bat closer to greater risks of collision with vehicles, which may explain why we detected a correlation between nonuse of cave and night lights. Future studies shall focus on the elucidations of how taxa-specific responses of collision victim bats, particularly species with distinct trait–environment–roadkill relationships, to different models and settings of artificial light. Such knowledge is critical to the implantation of bat-friendly light into future road designs to minimize the impact of roadkills to bat populations and their associated ecosystem functions [76,77,82].
There are several limits of the present study. First, the roadkill data presented in this study were collected occasionally by volunteers and citizen scientists. The unknown sampling efforts, lack of a standard survey protocol, and unbalanced sampling constrain the usage of the incidence data and the interpretation of the spatial variation of bat roadkill patterns. Lack of unbiased estimation of roadkill incidence would also lead to the missed opportunity to evaluate how road mortality may impact populations of different bat species, particularly for those with high conservation concerns. It is also suggested that analyses based on different spatial scales could lead to different results when interpreting the influences of environmental features to roadkill patterns (e.g., [6]). Further investigation into the associations between bat roadkills and landscape features at different spatial scales at the hotspot identified in this study is recommended. Moreover, several important determinants of wildlife roadkill mortality, i.e., road designs [6,14,17,18,19], vehicle speed and volume [19], and species traits, including abundance [18] and wing morphology measures [15,84], are not included due to lack of accessible data. Such information would be useful for a more comprehensive understanding of the potential underlying processes of bat roadkill on the island. It is noteworthy that information of important traits identified in this study, i.e., echolocation call features, foraging mode, roost ecology, and elevational distribution, for bats are generally deficient in the global mammal trait databases [85,86]. Therefore, filling the knowledge gaps of trait data is crucial for a better understanding of the impacts of roadkill and other road-related disturbances to global bat conservation.
5. Conclusions
In summary, the present study demonstrates that combinations of species traits and environmental variables can effectively explain the spatial patterns of bat roadkills along the elevational gradient in Taiwan. As conservation biologists and management agencies have started to pay more attention to the impacts of development of road systems to biodiversity in the recent years, it is reasonable to expect that data on wildlife roadkills would be generated quickly from different areas in the near future. The needs of the “fourth corner”, the trait–environment associations, in understanding causes and processes of bat roadkills might be more relevant when elucidating data collected from large spatial extents, along long environmental gradients, or more functionally diverse taxa. The large-scaled sampling designs may produce results of mixed effects from divergent trait–environment relationships by including mega-species diversity. Caution shall be taken to avoid potential false conclusions of assemblage-level reactions if cause–effect analyses are drawn based on either the environment or the trait dimension only. We recommend that management and conservation agencies shall consider both species traits and environmental factors when planning impact assessments of vehicle collisions for wildlife populations and designing mitigation practices, i.e., bat-friendly infrastructures, especially when long environmental gradients are covered.
Supplementary Materials
The following will be available online at https://www.mdpi.com/1424-2818/13/3/117/s1, File S1: Comparisons of roadkill samples of bats and non-bat vertebrates across elevational subregions in Taiwan from 2013 to 2018; Table S1: Measurements of 20 landscape features in 1 km-by-1 km resolution of Taiwan; Table S2: Measurements of ten species traits of 19 bat morphospecies of the roadkill victims in Taiwan.
Author Contributions
Conceptualization, J.C.-C.H., W.-J.C. and T.-E.L.; methodology, J.C.-C.H. and W.-J.C.; validation, J.C.-C.H., W.-J.C. and T.-E.L.; formal analysis, J.C.-C.H.; investigation, T.-E.L.; data curation, W.-J.C. and T.-E.L.; writing—original draft preparation, J.C.-C.H.; writing—review and editing, J.C.-C.H., W.-J.C. and T.-E.L.; visualization, J.C.-C.H. and W.-J.C.; supervision, T.-E.L.; project administration, W.-J.C.; funding acquisition, T.-E.L. All authors have read and agreed to the published version of the manuscript.
Funding
The operation of Taiwan Roadkill Observation Network was funded by the Environmental Protection Administration Executive Yuan, Taiwan, to T.-E.L., grant numbers 103AS-7.4.1-EI-W1, 104AS-7.4.1-EI-W1, 105AS-7.5.1-EI-W1, 106AS-7.3.1-EI-W1, 107AS-6.2.1-EI-W1, 108AS-6.2.1-EI-W1, and 109AS-6.2.1-EI-W1.
Institutional Review Board Statement
Not applicable.
Data Availability Statement
The vertebrate roadkill data in this study is archived in Taiwan Roadkill Observation Network (https://roadkill.tw/en (accessed on 19 January 2021)) and are available on request from the corresponding author. The data are not publicly available because it is in a preparation for a dataset publication to Global Biodiversity Information Facility (https://www.gbif.org/ (accessed on 19 January 2021)). The environment data are available in the Supplement Table S1 and https://data.depositar.io/en/dataset/taiwan_environmental_dataset (accessed on 19 January 2021). The trait data are available in the Supplement Table S2.
Acknowledgments
The authors would like to thank Tuanjit Srithongchuay and Guo-Jing Weng for the statistics support, Ying-Yi Ho for sharing call recordings of Murina bicolor, National Museum of Natural Science and the Mammal Division of the Endemic Species Research Institute for the permissions to access their collections of bats.
Conflicts of Interest
The authors declare no conflict of interest. The funders had no role in the design of the study; in the collection, analyses, or interpretation of data; in the writing of the manuscript, or in the decision to publish the results.
Appendix A

Table A1.
Twenty landscape features used in the present study.
| Variable | Data Type | Unit | Description | Data Source |
|---|---|---|---|---|
| TOPOGRAPHY | ||||
| Mean of Elevation, ELE | Continuous | meter | Algorithm average of the original elevation measures at a resolution of 30 by 30 m2 | [41] |
| Slope | Continuous | degree | The mean inclination of the terrain surface | [41] |
| Nearest distance to fresh water, DFW | Continuous | meter | Distance to the nearest freshwater body | [41] |
| LAND COVER | [41] | |||
| Farm field, FF | Continuous | m2 | Area of rainfed cropland | [41] |
| Meadow, MD | Continuous | m2 | Area of herbaceous cover | [41] |
| Forest, FO | Continuous | m2 | Area of forested land | [41] |
| Farm wetland, FW | Continuous | m2 | Area of irrigated and post-flooding farmlands | [41] |
| Bushland, BU | Continuous | m2 | Area of shrubland | [41] |
| Wetland, WL | Continuous | m2 | Area of flooded land with fresh, saline, and brackish water | [41] |
| Urban Area, UB | Continuous | m2 | Area of artificial surfaces | [41] |
| Waterbody, WB | Continuous | m2 | Area of freshwater and saltwater bodies | [41] |
| Bare Land, BL | Continuous | m2 | Area of land without any landcover | [41] |
| Building, BD | Continuous | m2 | Area of buildings regardless usage | [42] |
| Habitat heterogeneity, HHabitat | Index | value | Heterogeneity of land cover composition estimated as Shannon’s Diversity Index. BD is not included in the estimation due its alternative source from other land cover variables. | This study |
| ANTHROPOGENIC | ||||
| Artificial Light intensity, ALight | total lighting electricity usage (TLEU) | Estimation of night light pollution, downloaded the Earth of Night image in 2016 from NASA Earth Observatory [87,88] and converted the color model of the image from either the red, green, and blue (RGB) to hue, saturation, and value (HSV) by ArcGIS 10.6 to get the percentage of night light | This study | |
| Road Length, LROAD | Continuous | meter | The total length of all provincial highway, county highway, country road, industrial road, and old logging road systems that currently may not use for public transportation. | [41] |
| Population, Pop | Count | people | Number of residences registered in Department of Household Registration, Ministry of the Interior [89]. The original data are people per neighborhood and rescaled to the spatial scale of 1km by 1km weighted by the proportion of the area of each neighborhood within a grid. | This study |
| Protected Area, PA | Category | - | Whether a grid is overlapped with any existing protected area in Taiwan. The boundary data of protected areas are based on the definitions by the Council of Agriculture, Executive Yuan, of Taiwan [90]. | This study |
| Distance to the nearest protected area, NEAR_DIST | Continuous | meter | The shortest distance from a grid to the boundary of the nearest protected area. | This study |
| Fragmentation, seff | Index | value | Effective mesh density (seff)—a measure of to which movement within a landscape is interrupted by transportation infrastructure and geographic barriers. See more details in [91] | This study |
References
- Coffin, A.W. From roadkill to road ecology: A review of the ecological effects of roads. J. Transp. Geogr. 2007, 15, 396–406. [Google Scholar] [CrossRef]
- Goosem, M. Fragmentation impacts caused by roads through rainforests. Curr. Sci. 2007, 93, 1587–1595. [Google Scholar]
- Gibbs, J.P.; Shriver, W.G. Estimating the effects of road mortality on turtle populations. Conserv. Biol. 2002, 16, 1647–1652. [Google Scholar] [CrossRef]
- Hobday, A.J.; Minstrell, M.L. Distribution and abundance of roadkill on Tasmanian highways: Human management options. Wildl. Res. 2008, 35, 712–726. [Google Scholar] [CrossRef]
- Jackson, N.D.; Fahrig, L. Relative effects of road mortality and decreased connectivity on population genetic diversity. Biol. Conserv. 2011, 144, 3143–3148. [Google Scholar] [CrossRef]
- Silva, I.; Crane, M.; Savini, T. High roadkill rates in the Dong Phayayen-Khao Yai World Heritage Site: Conservation implications of a rising threat to wildlife. Anim. Conserv. 2020, 23, 466–478. [Google Scholar] [CrossRef]
- Jaeger, J.A.G.; Bowman, J.; Brennan, J.; Fahrig, L.; Bert, D.; Bouchard, J.; Charbonneau, N.; Frank, K.; Gruber, B.; Von Toschanowitz, K.T. Predicting when animal populations are at risk from roads: An interactive model of road avoidance behavior. Ecol. Model. 2005, 185, 329–348. [Google Scholar] [CrossRef]
- Dulac, J.; Cuenot, F. Global Travel Growth, Estimated Future Needs for Road Infrastructure and Impacts on Energy Demands and Carbon Emissions: An Analysis; World Road Association (PIARC): Paris, France, 2013; pp. 26–33. [Google Scholar]
- Bats of the World: A Taxonomic and Geographic Database. Available online: https://batnames.org/ (accessed on 23 December 2020).
- Jones, G.; Jacobs, D.S.; Kunz, T.H.; Wilig, M.R.; Racey, P.A. Carpe noctem: The importance of bats as bioindicators. Endanger. Species Res. 2009, 8, 93–115. [Google Scholar] [CrossRef] [Green Version]
- Altringham, J.; Kerth, G. Bats and roads. In Bats of the Anthropocene: Conservation of Bats in a Changing World; Voigt, C.C., Kingston, T., Eds.; Springer: Berlin, Germany, 2015; pp. 35–62. [Google Scholar]
- Collinson, W.J. A Standardised Protocol for Roadkill Detection and the Determinants of Roadkill in the Greater Mapungubwe Transfrontier Conservation Area, Limpopo Province, South Africa. Ph.D. Thesis, Rhodes University, Grahamstown, South Africa, 2013. [Google Scholar]
- Fensome, A.G.; Mathews, F. Roads and bats: A meta-analysis and review of the evidence on vehicle collisions and barrier effects. Mamm. Rev. 2016, 46, 311–323. [Google Scholar] [CrossRef] [Green Version]
- Medinas, D.; Marques, J.T.; Mira, A. Assessing road effects on bats: The role of landscape, road features, and bat activity on road-kills. Ecol. Res. 2013, 28, 227–237. [Google Scholar] [CrossRef] [Green Version]
- Novaes, R.L.M.; Laurindo, R.S.; Dornas, R.A.P.; Esbérard, C.E.L.; Bueno, C. On a collision course: The vulnerability of bats to roadkills in Brazil. Mastozool. Neotrop. 2018, 25, 115–128. [Google Scholar] [CrossRef]
- Jones, C.; Borkin, K.; Smith, D. Roads and wildlife: The need for evidence-based decisions; New Zealand bats as a case study. N. Z. J. Ecol. 2019, 43, 1–18. [Google Scholar] [CrossRef]
- Berthinussen, A.; Altringham, J. Do bat gantries and underpasses help bats cross roads safely? PLoS ONE 2012, 7, e38775. [Google Scholar] [CrossRef] [PubMed] [Green Version]
- Lesiński, G. Bat road casualties and factors determining their number. Mammalia 2007, 71, 138–142. [Google Scholar] [CrossRef]
- Secco, H.; Gomes, L.A.; Lemos, H.; Mayer, F.; Machado, T.; Guerreiro, M.; Gregorin, R. Road and landscape features that affect bat roadkills in southeastern Brazil. Oecologia Aust. 2017, 21, 323–336. [Google Scholar] [CrossRef]
- Medinas, D.; Ribeiro, V.; Marques, J.T.; Silva, B.; Barbosa, A.M.; Rebelo, H.; Mira, A. Road effects on bat activity depend on surrounding habitat type. Sci. Total Environ. 2019, 660, 340–347. [Google Scholar] [CrossRef]
- Schaub, A.; Ostwald, J.; Siemers, B.M. Foraging bats avoid noise. J. Exp. Biol. 2008, 211, 3174–3180. [Google Scholar] [CrossRef] [Green Version]
- Bhardwaj, M.; Soanes, K.; Lahoz-Monfort, J.J.; Lumsden, L.F.; van der Ree, R. Artificial lighting reduces the effectiveness of wildlife-crossing structures for insectivorous bats. J. Environ. Manag. 2020, 262, 11013. [Google Scholar] [CrossRef] [PubMed]
- Azam, C.; Le Viol, I.; Yves, B.; Zissis, G.; Vernet, A.; Julien, J.-F.; Kerbiriou, C. Evidence for distance and illuminance thresholds in the effects of artificial lighting on bat activity. Landsc. Urban Plan. 2018, 175, 123–135. [Google Scholar] [CrossRef]
- Stone, E.L.; Jones, G.; Harris, S. Street Lighting Disturbs Commuting Bats. Curr. Biol. 2009, 19, 1123–1127. [Google Scholar] [CrossRef] [Green Version]
- Lesiński, G.; Sikora, A.; Olszewski, A. Bat casualties on a road crossing a mosaic landscape. Eur. J. Wildl. Res. 2011, 57, 217–223. [Google Scholar] [CrossRef] [Green Version]
- Huang, J.C.C.; Ho, Y.Y.; Kuo, H.C. Illustrated field keys to the bats (Mammalia: Chiroptera) of Taiwan. J. Threat. Taxa 2020, 12, 15675–15710. [Google Scholar] [CrossRef]
- Ding, T.S.; Yuan, H.W.; Geng, S.; Lin, Y.S.; Lee, P.F. Energy flux, body size and density in relation to bird species richness along an elevational gradient in Taiwan. Glob. Ecol. Biogeogr. 2005, 14, 299–306. [Google Scholar] [CrossRef]
- Li, C.F.; Chytrý, M.; Zelený, D.; Chen, M.Y.; Chen, T.Y.; Chiou, C.R.; Hsia, Y.J.; Liu, H.Y.; Yang, S.Z.; Yeh, C.L.; et al. Classification of Taiwan forest vegetation. Appl. Veg. Sci. 2013, 16, 698–719. [Google Scholar] [CrossRef]
- Koh, C.N.; Lee, P.F.; Lin, R.S. Bird species richness patterns of northern Taiwan: Primary productivity, human population density, and habitat heterogeneity. Divers. Distrib. 2006, 12, 546–554. [Google Scholar] [CrossRef]
- Chang, C.W. Bat Species and Fauna in Relation to Habitat Types and Environment Factors in Central-Southern Taiwan. Master’s Thesis, National Chiayi University, Chiayi City, Taiwan, 2015. [Google Scholar]
- Cheng, H.C.; Fang, Y.P.; Chou, C.H. A Photographic Guide to the Bats of Taiwan, 3rd ed.; Endemic Species Research Institute: Jiji Township, Taiwan, 2017; p. 151. [Google Scholar]
- Macro ECOnomy Meter. Available online: http://mecometer.com (accessed on 31 July 2019).
- NationMaster: Global Industry Market Sizing. Available online: https://www.nationmaster.com/ (accessed on 31 July 2019).
- Chyn, K.; Lin, T.E.; Chen, Y.K.; Chen, C.Y.; Fitzgerald, L.A. The magnitude of roadkill in Taiwan: Patterns and consequences revealed by citizen science. Biol. Conserv. 2019, 237, 317–326. [Google Scholar] [CrossRef]
- Central Weather Bureau. Climate of Taiwan. Available online: https://www.cwb.gov.tw/V8/C/C/Taiwan/index.html (accessed on 23 December 2020).
- Lin, Y.C.; Huang, S.L.; Budd, W.W. Assessing the environmental impacts of high-altitude agriculture in Taiwan: A Driver-Pressure-State-Impact-Response (DPSIR) framework and spatial emergy synthesis. Ecol. Indic. 2013, 32, 42–50. [Google Scholar] [CrossRef]
- Lee, P.F.; Ding, T.S.; Hsu, F.H.; Geng, S. Breeding bird species richness in Taiwan: Distribution on gradients of elevation, primary productivity and urbanization. J. Biogeogr. 2004, 31, 307–314. [Google Scholar] [CrossRef] [Green Version]
- Taiwan Roadkill Observation Network. Available online: https://roadkill.tw/en (accessed on 12 April 2019).
- Baselga, A. Partitioning the turnover and nestedness components of beta diversity. Glob. Ecol. Biogeogr. 2010, 19, 134–143. [Google Scholar] [CrossRef]
- Baselga, A.; Leprieur, F. Comparing methods to separate components of beta diversity. Methods Ecol. Evol. 2015, 6, 1069–1079. [Google Scholar] [CrossRef]
- Chen, W.J.; Lo, C.C.; Tsai, F.A.; Chang, A.Y. Using open data to establish a multi-temporal and terrestrial environmental dataset of Taiwan. Taiwan J. Biodivers 2020, 22, 13–44. [Google Scholar]
- Shiu, H.J. A GIS-Based Environmental Database of Taiwan and Penghu Islands. Available online: http://mountain-ecology.blogspot.tw/2016/06/gis.html (accessed on 7 April 2016).
- Jones, G.; Teeling, E.C. The evolution of echolocation in bats. Trends Ecol. Evol. 2006, 21, 148–156. [Google Scholar] [CrossRef]
- Ho, Y.Y.; Fang, Y.P.; Chou, C.H.; Cheng, H.C.; Chang, H.W. High duty cycle to low duty cycle: Echolocation behaviour of the hipposiderid bat Coelops frithii. PLoS ONE 2013, 8, e62938. [Google Scholar] [CrossRef] [PubMed]
- Denzinger, A.; Schnitzler, H.U. Bat guilds, a concept to classify the highly diverse foraging and echolocation behaviors of microchiropteran bats. Front. Physiol. 2013, 4, 1–15. [Google Scholar] [CrossRef] [PubMed] [Green Version]
- Lie, C.C. Wing Morphology of Insectivorous Bats in Taiwan. Master’s Thesis, Tunghai University, Taichung, Taiwan, 2000. [Google Scholar]
- Masuda, R.; Ohdachi, S.D.; Ishibashi, Y.; Iwasa, M.A.; Saitoh, T. The Wild Mammals of Japan, 2nd ed.; Shoukadoh Book Sellers: Kyoto, Japan, 2015; p. 506. [Google Scholar]
- Yoon, K.B.; Rahman, M.M.; Park, Y.C. Acoustic Species identification of Korean Myotis bats (Chiroptera: Vespertilionidae). J. For. Environ. Sci. 2016, 32, 68–73. [Google Scholar] [CrossRef] [Green Version]
- Min, C.; Jiang, F.; Zhenxin, L.; Huihua, Z.; Jiang, Z.; Shuyi, Z. Relationship between the echolocation frequency and body size in six species (Chiroptera: Vespertilionidae). J. Nor. Nor. Univ. 2002, 34, 64–69. [Google Scholar]
- Bats in China. Available online: http://www.bio.bris.ac.uk/research/bats/China%20bats/index.htm (accessed on 3 January 2021).
- Kuo, H.C.; Tuanmu, M.-N.; Huang, C.C.; Tsi, W.Y.; Chang, P.S.; Chen, K.Y. Monitoring of Bat Population Dynamics in the Taroko National Park(2/2); Taroko National Park: Xiulin Township, Taiwan, 2017; p. 72. [Google Scholar]
- Hsieh, B.J.; Chen, H.C. Monitoring of Bat Population Dynamics in the Taroko National Park; Taroko National Park: Xiulin Township, Taiwan, 2016; p. 80. [Google Scholar]
- Cheng, H.C. Handbook of the Biological Resources in Hushan-Mammals, 3rd ed.; Endemic Species Research Institute: Jiji Township, Taiwan, 2014; p. 111. [Google Scholar]
- Lin, L.K.; Lee, L.L.; Cheng, C.C. Bats of Taiwan; National Museum of Natural Science: Taichung, Taiwan, 1997; p. 177. [Google Scholar]
- Chen, C.H. A Study of Roost Selection of Plecotus Taivanus and Monitoring of Bat Boxes in Syuejian Area; Shei-Pa National Park: Dahu Township, Taiwan, 2011; p. 61. [Google Scholar]
- Bat Study and Conservation Group of Japan. A Field Guide to Bats of Japan, Rev. ed.; Sano, A., Fukui, D., Eds.; Bun-ich Co.: Tokyo, Japan, 2011; p. 68. [Google Scholar]
- Baselga, A.; Orme, D.; Villeger, S.; De Bortoli, J.; Leprieur, F.; Logez, M. Betapart: Partitioning Beta Diversity into Turnover and Nestedness Components. 2020. Available online: https://cran.r-project.org/web/packages/betapart/index.html (accessed on 19 January 2021).
- Bates, D.; Mächler, M.; Bolker, B.M.; Walker, S.C. Fitting linear mixed-effects models using lme4. J. Stat. Softw. 2015, 67, 1–48. [Google Scholar] [CrossRef]
- Bolker, B.; Team, R.D.C. Bbmle: Tools for General Maximum Likelihood Estimation; 2017. Available online: https://cran.r-project.org/web/packages/bbmle/index.html (accessed on 19 January 2021).
- Dray, S.; Choler, P.; Dolédec, S.; Peres-Neto, P.R.; Thuiller, W.; Pavoine, S.; Ter Braak, C.J.F. Combining the fourth-corner and the RLQ methods for assessing trait responses to environmental variation. Ecology 2014, 95, 14–21. [Google Scholar] [CrossRef] [Green Version]
- Dray, S.; Dufour, A.; Chessel, D. The ade4 Package-II: Two-Table and K-Table Methods. R News 2007, 7, 47–52. [Google Scholar]
- Ter Braak, C.J.; Cormont, A.; Dray, S. Improved testing of species traits–environment relationships in the fourth-corner problem. Ecology 2012, 93, 1525–1526. [Google Scholar] [CrossRef] [PubMed]
- Benjamini, Y.; Hochberg, Y. Controlling the false discovery rate: A practical and powerful approach to multiple testing. J. R. Stat. Soc. Ser. B Stat. Methodol. 1995, 57, 289–300. [Google Scholar] [CrossRef]
- Cheng, H.C.; Changchien, L.W.; Lin, R.S.; Yang, C.H.; Chang, S.W. The Red List of Terrestrial Mammals of Taiwan, 2017; Endemic Species Research Institute: Jiji Township, Taiwan, 2017; p. 35. [Google Scholar]
- Huang, C.C.; Chang, H.C. Bat Fauna of Shuilin Township, Yunlin County; Formosan Golden Bat’s Home: Sheuilin Township, Taiwan, 2020; p. 31. [Google Scholar]
- Burgin, C.J.; Wilson, D.E.; Mittermeier, R.A.; Rylands, A.B.; Lacher, T.E.; Sechrest, W. (Eds.) Illustrated Checklist of the Mammals of the World; Lynx Edicions: Barcelona, Spain, 2020; p. 1166. [Google Scholar]
- Lee, Y.F.; Kuo, Y.M.; Chu, W.C.; Lin, Y.H. Chiropteran Diversity in Different Settings of the Uplifted Coral Reef Tropical Forest of Taiwan. J. Mammal. 2007, 88, 1239–1247. [Google Scholar] [CrossRef] [Green Version]
- Senawi, J.; Kingston, T. Clutter negotiating ability in an ensemble of forest interior bats is driven by body mass. J. Exp. Biol. 2019, 22, 1–12. [Google Scholar] [CrossRef] [PubMed]
- Huang, C.C. Bat Surveys in Neiweipi Cultural Park; Kaohsiung Museum of Fine Arts: Taichung City, Taiwan, 2020; p. 37. [Google Scholar]
- Wu, J.T. Taxonomic Study of the Genus Pipistrellus (Chiroptera: Vespertilionidae) in Taiwan. Mater’s Thesis, National Chiayi University, Chiayi City, Taiwan, 2007; p. 59. [Google Scholar]
- Roeleke, M.; Bumrungsri, S.; Voigt, C.C. Bats probe the aerosphere during landscape-guided altitudinal flights. Mammal Rev. 2018, 48, 7–11. [Google Scholar] [CrossRef]
- McCracken, G.F.; Gillam, E.H.; Westbrook, J.K.; Lee, Y.F.; Jensen, M.L.; Balsley, B.B. Brazilian free-tailed bats (Tadarida brasiliensis: Molossidae, Chiroptera) at high altitude: Links to migratory insect populations. Integr. Comp. Biol. 2008, 48, 107–118. [Google Scholar] [CrossRef] [Green Version]
- Nguyen, T.N.; Ruangwiset, A.; Bumrungsri, S. Vertical stratification in foraging activity of Chaerephon plicatus (Molossidae, Chiroptera) in Central Thailand. Mamm. Biol. 2019, 96, 1–6. [Google Scholar] [CrossRef]
- National Parks of Taiwan. Available online: https://np.cpami.gov.tw/home-en.html (accessed on 14 January 2021).
- Stone, E.L.; Harris, S.; Jones, G. Impacts of artificial lighting on bats: A review of challenges and solutions. Mamm. Biol. 2015, 80, 213–219. [Google Scholar] [CrossRef]
- Threlfall, C.G.; Law, B.; Banks, P.B. The urban matrix and artificial light restricts the nightly ranging behaviour of Gould’s long-eared bat (Nyctophilus gouldi). Austral Ecol. 2013, 38, 921–930. [Google Scholar] [CrossRef]
- Lewanzik, D.; Voigt, C.C. Artificial light puts ecosystem services of frugivorous bats at risk. J. Appl. Ecol. 2014, 51, 388–394. [Google Scholar] [CrossRef]
- Russo, D.; Cistrone, L.; Libralato, N.; Korine, C.; Jones, G.; Ancillotto, L. Adverse effects of artificial illumination on bat drinking activity. Anim. Conserv. 2017, 20, 492–501. [Google Scholar] [CrossRef] [Green Version]
- Straka, T.M.; Greif, S.; Schultz, S.; Goerlitz, H.R.; Voigt, C.C. The effect of cave illumination on bats. Glob. Ecol. Conserv. 2020, 21, e00808. [Google Scholar] [CrossRef]
- Coelops Frithii. The IUCN Red List of Threatened Species. 2019. Available online: https://www.iucnredlist.org/species/5074/22030377 (accessed on 3 January 2021).
- Myotis Formosus. The IUCN Red List of Threatened Species. 2020. Available online: https://www.iucnredlist.org/species/85736120/95642290 (accessed on 3 January 2021).
- Russo, D.; Cosentino, F.; Festa, F.; De Benedetta, F.; Pejic, B.; Cerretti, P.; Ancillotto, L. Artificial illumination near rivers may alter bat-insect trophic interactions. Environ. Pollut. 2019, 252, 1671–1677. [Google Scholar] [CrossRef] [PubMed]
- Rydell, J. Bats and their insect prey at streetlights. In Ecological Consequences of Artificial Night Lighting; Rich, C., Longcore, T., Eds.; Island Press: Washington, DC, USA, 2006; pp. 43–60. [Google Scholar]
- Brown, C.R.; Brown, M.B. Where has all the road kill gone? Curr. Biol. 2013, 23, R233–R234. [Google Scholar] [CrossRef] [Green Version]
- Jones, K.E.; Bielby, J.; Cardillo, M.; Fritz, S.A.; O’Dell, J.; Orme, C.D.L.; Safi, K.; Sechrest, W.; Boakes, E.H.; Carbone, C.; et al. PanTHERIA: A species-level database of life history, ecology, and geography of extant and recently extinct mammals. Ecology 2009, 90, 2648. [Google Scholar] [CrossRef] [Green Version]
- Wilman, H.; Belmaker, J.; Simpson, J.; de la Rosa, C.; Rivadeneira, M.M.; Jetz, W. EltonTraits 1.0: Species-level foraging attributes of the world’s birds and mammals. Ecology 2014, 95, 2027. [Google Scholar] [CrossRef] [Green Version]
- NASA Earth Observatory. Available online: https://earthobservatory.nasa.gov/features/NightLights (accessed on 12 February 2019).
- Román, M.O.; Stokes, E.C. Holidays in lights: Tracking cultural patterns in demand for energy services. Earth’s Future 2015, 3, 182–205. [Google Scholar] [CrossRef]
- Department of Household Registration, Ministry of the Interior. Available online: https://www.ris.gov.tw/app/portal/346 (accessed on 9 September 2019).
- Council of Agriculture, Executive Yuan, of Taiwan. Available online: https://data.coa.gov.tw/ (accessed on 9 September 2019).
- European Environmental Agency. Landscape Fragmentation Indicator Effective Mesh Density (seff)—Major and Medium Anthrophogenic Fragmentation (FGA2_S_2016). Available online: https://www.eea.europa.eu/data-and-maps/data/landscape-fragmentation-indicator-effective-mesh/ (accessed on 18 November 2016).
Figure 1.
Monthly variations in number of bat roadkills in Taiwan from 2013 to 2018.
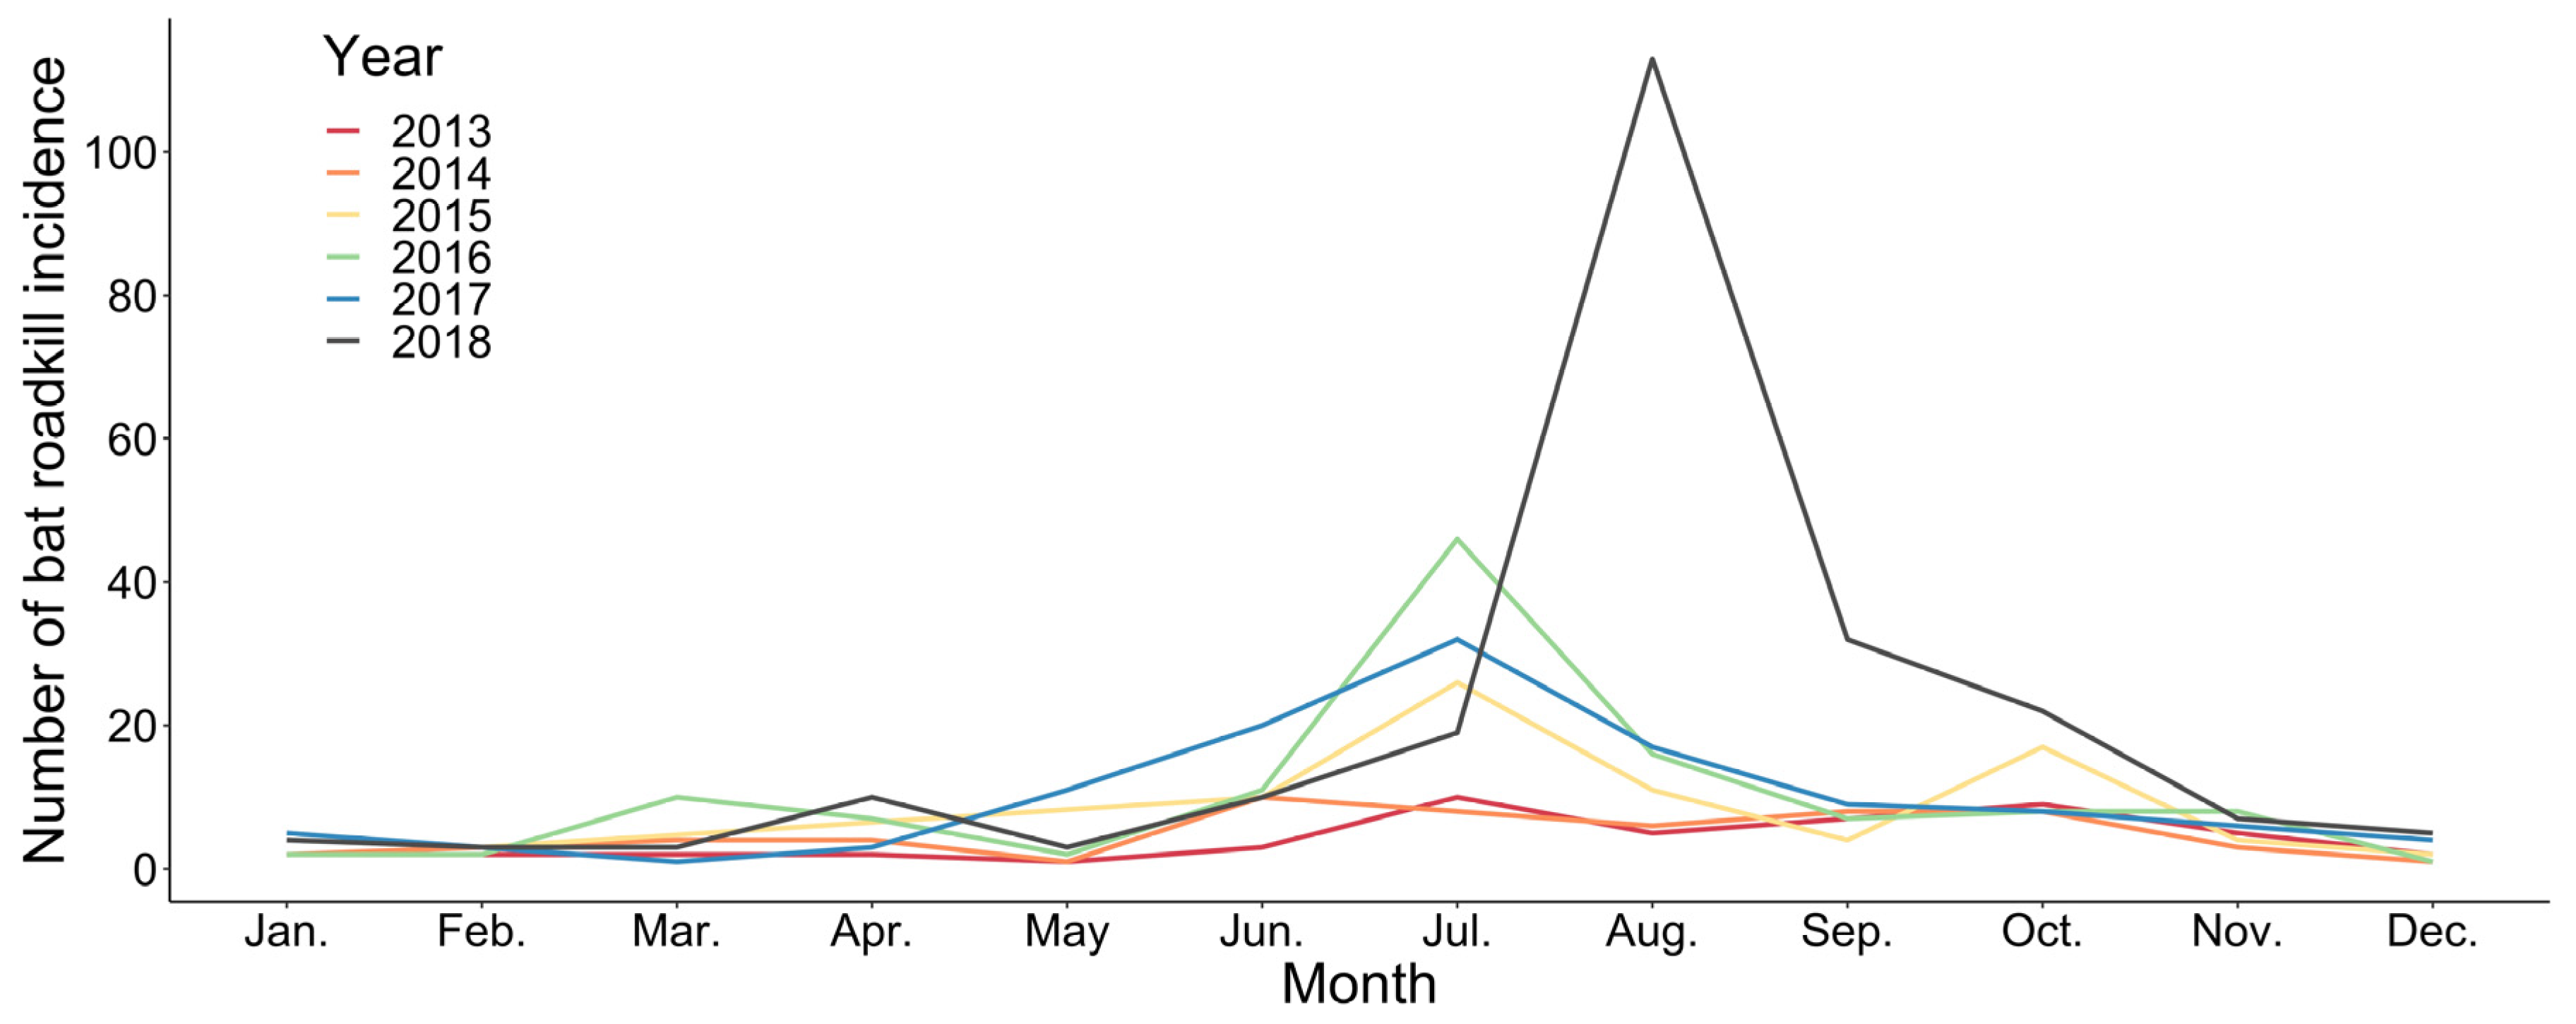
Figure 2.
(a) Geographic and (b) elevational distributions of roadkill events of bats (red dot, 442 grids) and non-bat vertebrates (dark gray dot, 9927 grids) in Taiwan collected by TaiRON from 2013 to 2018. Note some dots might be overlapped and not shown.
Figure 2.
(a) Geographic and (b) elevational distributions of roadkill events of bats (red dot, 442 grids) and non-bat vertebrates (dark gray dot, 9927 grids) in Taiwan collected by TaiRON from 2013 to 2018. Note some dots might be overlapped and not shown.
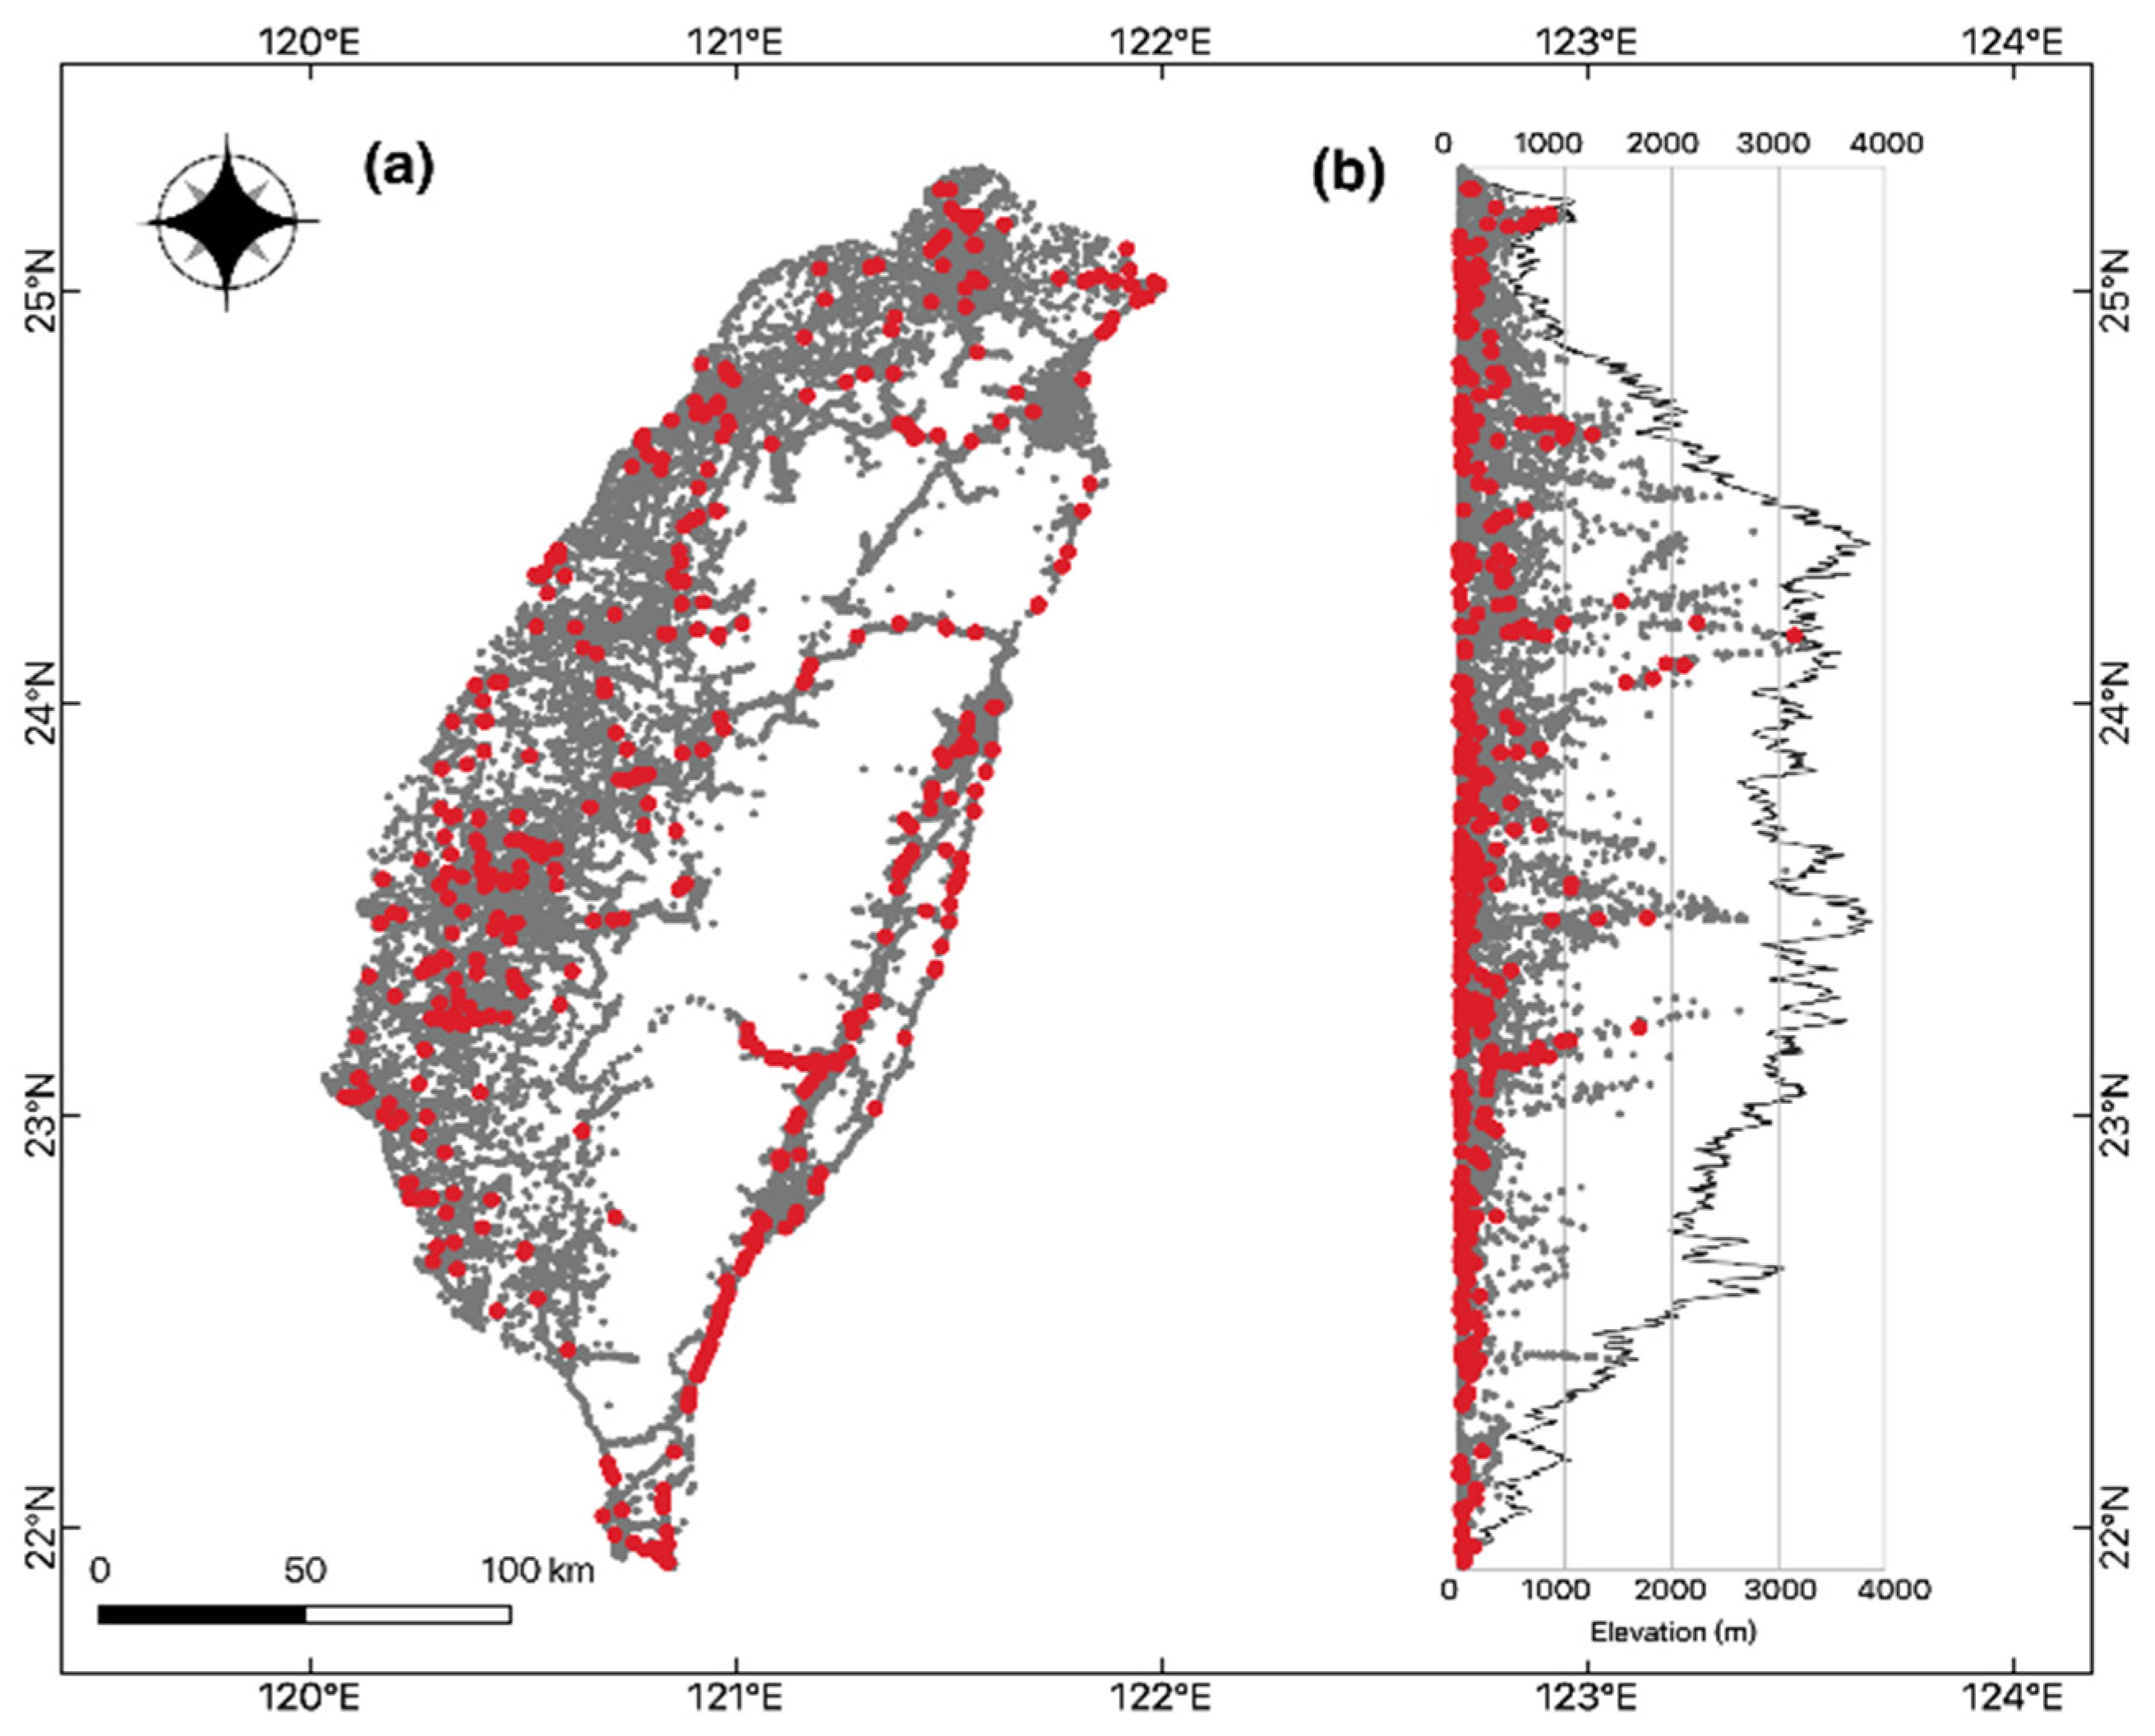
Figure 3.
Elevational distribution of sample grids with roadkills (black solid circles) and elevational range of known species distribution (light gray bars) of each of the 19 victimized bat morphospecies in Taiwan. Red and blue vertical lines denote the lower limits of 0 m and 100 m in elevational distribution, respectively. Numbers underneath the gray bars denote number of grid samples for each morphospecies. Morphospecies abbreviations: Scku—Scotophilus kuhlii, Piab—Pipistrellus abramus, Eppa—Eptesicus pachyomus, Myfo—Myotis formosus, Myfi—Myotis fimbriatus, Nypl—Nyctalus plancyi, Mifu—Miniopterus fuliginosus, Kefu—Kerivoula furva, Hiar—Hipposideros armiger, Cofr—Coelops frithii, Mure—Murina recondita, Myse—Myotis secundus, Pisp—Pipistrellus spp., Myfs—Myotis frater/soror, Mupu—Murina puta, Rhfo—Rhinolophus formosae, Rhmo—Rhinolophus monoceros, Mubi—Murina bicolor, Sula—Submyotodon latirostris.

Figure 4.
Pairwise comparisons of incidence-based measures of two beta diversity components, species turnover (βSIM) and nestedness (βSNE), of bat roadkills between neighbors of five elevation subregions: (I) 0–100 m, (II) 100–500 m, (III) 500–1500 m, and (IV) >1500 m, in Taiwan from 2013 to 2018. Numbers above bar denote the overall beta diversity measure of each subregion pair.

Figure 5.
Results of the fourth corner analysis for bat roadkill. Colorful rectangles represent significant trait–landscape feature associations. Red rectangles indicate positive correlations, whereas blue rectangles indicate negative correlations. Trait abbreviations: FA—forearm length, BM—body mass, B—wingspan, FmaxE—call frequency of maximum energy, eleMin—minimum elevation, eleMax—maximum elevation, eleRange—elevational range; for roost use, Y and N stand for use and not use of the roost type prior to the semi-comma, e.g., Cave: Y denotes use of cave roost; for hunting mode (Hunt), Open—open space aerial-hawking, Water—water trawling, Edge—edge and gap aerial-hawking, Flutter—fluttering detection, Glean—gleaning; for echolocation call type (Call), FQ—frequency modulated component with narrow-band tail, HDCF—high duty-cycle constant frequency, LDCF—low duty-cycle constant frequency, BFM—broadband frequency modulated, NFM—nonfundamental frequency modulated.

Table 1.
Ten ecomorphological traits used in the present study.
| Trait | Type | Definition | Data Source |
|---|---|---|---|
| Forearm length, FA | Quantitative: continuous | The length of forearm, in mm | [31] |
| Body mass, BM | Quantitative: continuous | The weight of alive volant individual, in grams | [31] |
| Wingspan, B | Quantitative: continuous | The distance between two wing tips when wings fully expand, in mm | [31,46] |
| Frequency of maximum energy, FmaxE | Quantitative: continuous | The dominant frequency of orientating echolocation calls | [31,44,47,48,49,50], |
| Echolocation call type, CALL | Qualitative: category | Four categories: high duty-cycle constant frequency (HDCF), low duty-cycle constant frequency (LDCF), broadband frequency-modulated (BFM), narrow-tailed frequency modulated (NFM) | [31,44,51] |
| Minimum elevation, eleMin | Qualitative: continuous | Known lowest elevation in records, in meters | [30,52,53] |
| Maximum elevation, eleMax | Qualitative: continuous | Known lowest elevation in records. In meters | [30,54,55], this study |
| Elevation range, eleRange | Qualitative: continuous | Elevation range based on the minimum and maximum elevation, in meters | This study |
| Roost type use | Qualitative: binary | Use of cave, crevice, cavity, and foliage. Data are presented separately for individual type of roost. The definition of each roost type is as: Cave: large chambers in nature cave, abandon and in-used car tunnels, mining tunnel, bunker Crevice: narrow space in rock, cement, and gaps inside buildings Cavity: small cambers inside living tree trunk, log, space under tree bark, woody bat box and woody part of building Foliage: live and dead leaves | [31,47,55,56], empirical data |
| Hunting mode, HUNT | Qualitative: category | How and where a bat species detects and captures prey. Five categories: Open space aerial hawking, edge and gap aerial hawking, water trawling, active gleaning, and fluttering detection | [31,44] |
Table 2.
Number of roadkill incidences, endemism, conservation status, and global population trend of 20 bat species reported to the TaiRON (https://roadkill.tw/en (accessed on 19 January 2021)) from Taiwan in 2011–2019.
Table 2.
Number of roadkill incidences, endemism, conservation status, and global population trend of 20 bat species reported to the TaiRON (https://roadkill.tw/en (accessed on 19 January 2021)) from Taiwan in 2011–2019.
| Taxa 1 | Roadkill Records | Endemism | National Status 2 | IUCN Status | IUCN Population Trend |
|---|---|---|---|---|---|
| Hipposideridae | |||||
| Hipposideros armiger terasensis, Hiar | 68 | ESS | LC | Unknown | |
| Coelops frithii formosanus, Cofr | 4 | ESS | NVU | NT | Decreasing |
| Hipposideridae gen. sp. | 1 | ||||
| Rhinolophidae | |||||
| Rhinolophus formosae, Rhfo | 1 | ES | LC | Decreasing | |
| Rhinolophus monoceros, Rhmo | 30 | ES | n.a. | n.a. | |
| Miniopteridae | |||||
| Miniopterus fuliginosus, Mifu | 75 | n.a. | n.a. | ||
| Vespertilionidae | |||||
| KERIVOLINAE | |||||
| Kerivoula furva, Kefu | 8 | n.a. | n.a. | ||
| MURININAE | |||||
| Harpiocephalus harpia, Haha | 1 | LC | Decreasing | ||
| Murina bicolor, Mubi | 1 | ES | LC | Unknown | |
| Murina puta, Mupu | 36 | ES | LC | Stable | |
| Murina recondita, Mure | 5 | ES | LC | Unknown | |
| Murina spp. | 9 | ||||
| MYOTINAE | |||||
| Myotis fimbriatus taiwanensis, Myfi | 2 | ESS | LC | Unknown | |
| Myotis formosus flavus, Myfo | 3 | ESS | NVU | NT | Decreasing |
| Myotis frater, Myfr | 1 | DD # | Unknown | ||
| Myotis secundus, Myse | 4 | ES | LC | Stable | |
| Submyotodon latirostris, Sula | 1 | ES | LC | Unknown | |
| Myotinae gen. sp. | 1 | ||||
| VESPERTILIONINAE | |||||
| Eptesicus pachyomus horikawai, Eppa | 25 | ESS | LC | Unknown | |
| Nyctalus plancyi velutinus, Nypl | 6 | LC | Unknown | ||
| Pipistrellus abramus, Piab | 98 | LC | Stable | ||
| Pipistrellus sp. group2, Pisp | 2 | ||||
| Pipistrellus spp. | 20 | ||||
| Scotophilus kuhlii, Scku | 43 | LC | Stable | ||
| Vespertilionidae gen. sp. | 102 | ||||
| Unidentified bat | 114 |
1 Taxa appreciations are only listed for categories in species level. 2 According to [64]. ES—endemic species, ESS—endemic subspecies. NVU—National Vulnerable. In the IUCN Red List status, NT—Near Threatened, DD—Data Deficient, LC—Least Concern, n.a.—data not available. # Denotes that data were not available in the IUCN Red List in the latest review on 24 December 2020. Instead, status and population trends were based on the 2008 assessments if available.
Table 3.
Evaluation results of seven generalized linear mixed models (GLMM) models with selected landscape features using Akaike information criterion (AIC) and Bayesian information criterion (BIC) criteria. In model formula, a cross sign denotes that an interaction of the prior and posterior variables is considered, whereas a plus sign denotes that interaction is not considered. Variable abbreviations—ELE, ALight, PA, BU, and BL stand for the mean elevation, artificial light intensity, presence of protected area, bushland, and bare land. In AIC and BIC scores, numbers in bold indicate the two smallest values among all results in either criterion.
| Model 1 | Significant Variables 2 | Estimate ± SE | p-Value | AIC Score | BIC Score |
|---|---|---|---|---|---|
| All variables (no interaction) | Intercept | 89,850.0 ± 5.454 | <0.001 | 3120.1 | 3357.4 |
| ELE | −2.720 ± 0.805 | <0.001 | |||
| ALight | −1.185 ± 0.242 | <0.001 | |||
| PA | 0.642 ± 0.175 | <0.001 | |||
| BU | 89,850.0 ± 5.454 | <0.001 | |||
| BL | 89,850.0 ± 5.454 | <0.001 | |||
| Each of the other 7 landcovers 3 | 35,650.0 ± 2.536 | <0.001 | |||
| ELE + ALight + PA+ 9 landcover types | ELE | −2.433 ± 0.789 | <0.001 | 3107.9 | 3287.7 |
| ALight | −1.263 ± 0.228 | <0.001 | |||
| PA | 0.563 ± 0.158 | <0.001 | |||
| ELE + ALight + PA | Intercept | −3.415 ± 0.411 | <0.001 | 3103.5 | 3218.6 |
| ELE | −3.321 ± 0.686 | <0.001 | |||
| ALight | −0.864 ± 0.163 | <0.001 | |||
| PA | 0.641 ± 0.149 | <0.001 | |||
| ELE × ALight + PA | Intercept | −3.421 ± 0.409 | <0.001 | 3104.7 | 3226.9 |
| ELE | −3.043 ± 0.731 | <0.001 | |||
| ALight | −0.803 ± 0.175 | <0.001 | |||
| PA | 0.623 ± 0.150 | <0.001 | |||
| ELE × PA + ALight | Intercept | −3.274 ± 0.415 | <0.001 | 3099.6 | 3221.8 |
| ELE | −4.828 ± 0.975 | <0.001 | |||
| ALight | −0.957 ± 0.167 | 0.023 | |||
| PA | 0.406 ± 0.178 | <0.001 | |||
| ELE × PA | 2.857 ± 1.158 | 0.014 | |||
| ELE + ALight × PA | Intercept | −3.460 ± 0.413 | <0.001 | 3100.0 | 3222.3 |
| ELE | −3.564 ± 0.687 | <0.001 | |||
| ALight | −0.758 ± 0.169 | <0.001 | |||
| PA | 1.072 ± 0.230 | <0.001 | |||
| PA × ALight | −0.921 ± 0.399 | 0.0209 | |||
| ELE × ALight × PA | Intercept | −3.357 ± 0.420 | <0.001 | 3103.6 | 3247.4 |
| ELE | −4.255 ± 1.117 | <0.001 | |||
| ALight | −0.819 ± 0.202 | <0.001 | |||
| PA | 0.768 ± 0.318 | 0.016 |
1 The temporal variables (year and month) and the dependent variable (occurrence of bat roadkill) are not presented. The general formula for all models is Bat roadkill occurrence = ”selected landscape features” + Month + (1|Year). 2 The results of the two temporal variables and variables with no significance detected are not shown. 3 The seven landcover types include farm field (FF), meadow (MD), forest (FO), farm wetland (FW), bushland (BU), wetland (WT), urban area (UB), waterbody (WB), and bare land (BL).
Publisher’s Note: MDPI stays neutral with regard to jurisdictional claims in published maps and institutional affiliations. |
© 2021 by the authors. Licensee MDPI, Basel, Switzerland. This article is an open access article distributed under the terms and conditions of the Creative Commons Attribution (CC BY) license (http://creativecommons.org/licenses/by/4.0/).
Share and Cite
MDPI and ACS Style
Huang, J.C.-C.; Chen, W.-J.; Lin, T.-E. Landscape and Species Traits Co-Drive Roadkills of Bats in a Subtropical Island. Diversity 2021, 13, 117. https://doi.org/10.3390/d13030117
AMA Style
Huang JC-C, Chen W-J, Lin T-E. Landscape and Species Traits Co-Drive Roadkills of Bats in a Subtropical Island. Diversity. 2021; 13(3):117. https://doi.org/10.3390/d13030117
Chicago/Turabian StyleHuang, Joe Chun-Chia, Wan-Jyun Chen, and Te-En Lin. 2021. "Landscape and Species Traits Co-Drive Roadkills of Bats in a Subtropical Island" Diversity 13, no. 3: 117. https://doi.org/10.3390/d13030117
Note that from the first issue of 2016, this journal uses article numbers instead of page numbers. See further details here.