Article

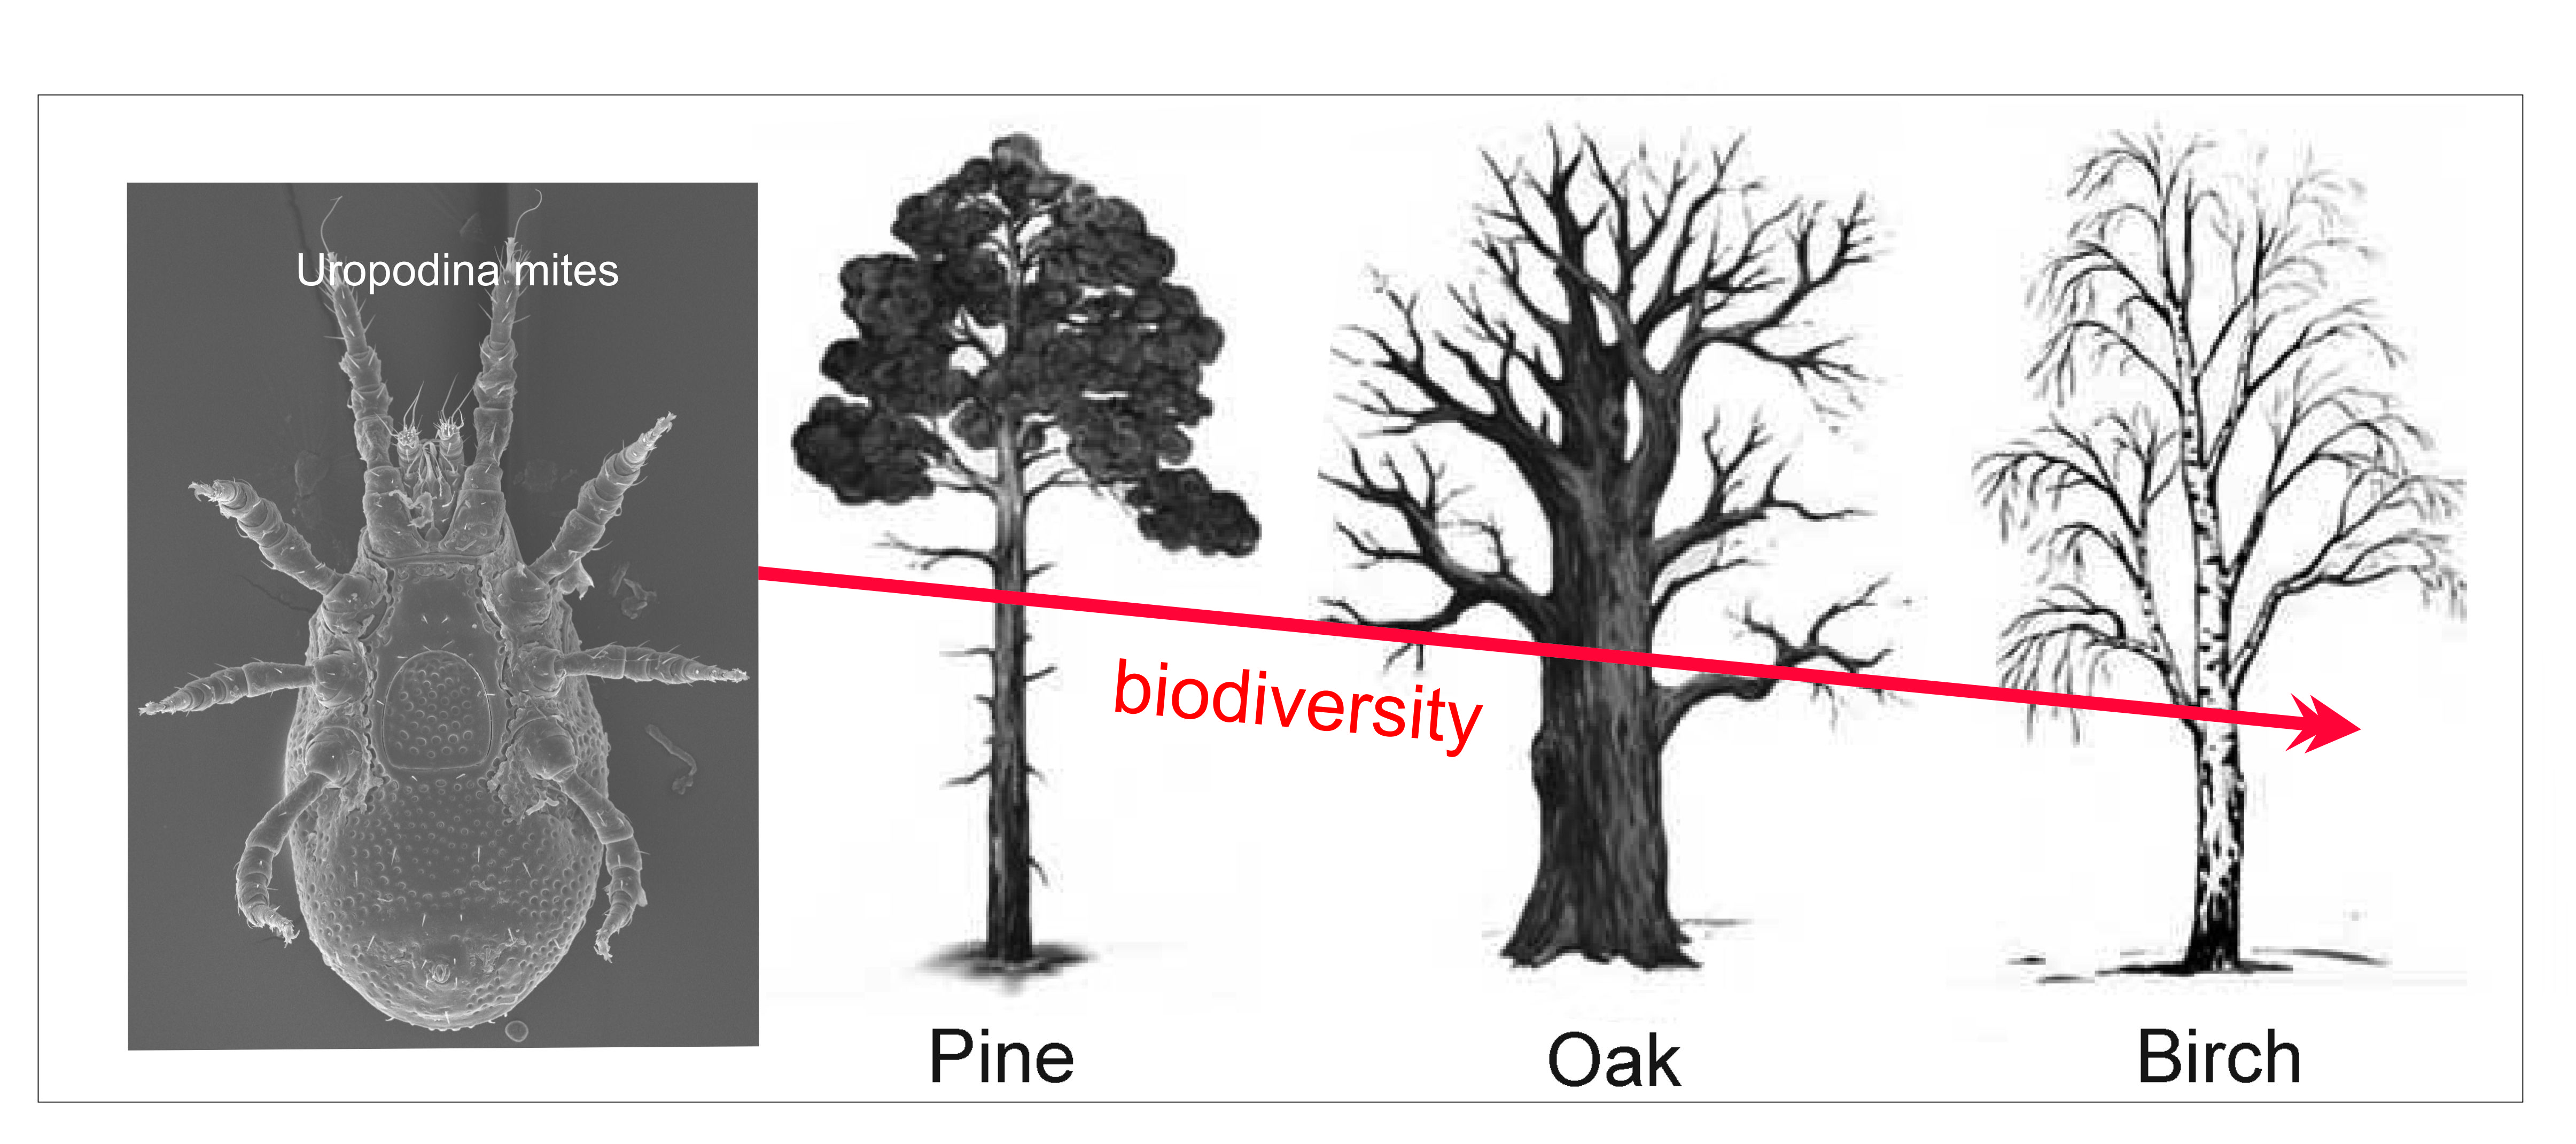
Is Biodiversity of Uropodina Mites (Acari: Parasitiformes) Inhabiting Dead Wood Dependent on the Tree Species?

by
Michał Zacharyasiewicz
1,
Agnieszka Napierała
1,*,
Przemysław Kurek
2,
Kamila Grossmann
1 and
Jerzy Błoszyk
1,3
1
Department of General Zoology, Faculty of Biology, Adam Mickiewicz University, Uniwersytetu Poznańskiego 6, 61-614 Poznań, Poland
2
Department of Plant Ecology and Environmental Protection, Faculty of Biology, Adam Mickiewicz University, Uniwersytetu Poznańskiego 6, 61-614 Poznań, Poland
3
Natural History Collections, Faculty of Biology, Adam Mickiewicz University, Uniwersytetu Poznańskiego 6, 61-614 Poznań, Poland
*
Author to whom correspondence should be addressed.
Diversity 2021, 13(12), 609; https://doi.org/10.3390/d13120609
Submission received: 7 October 2021 / Revised: 17 November 2021 / Accepted: 21 November 2021 / Published: 24 November 2021
(This article belongs to the Special Issue Arthropods Associated with Forest Soil and Wood)

Abstract

:
The article presented here is the continuation of a study on the importance of dead wood for the biodiversity of the Uropodina (Acari: Parasitiformes) communities inhabiting dead wood. The major aim of this study is to check whether the species of tree can have any impact on the species composition and abundance of uropodine mite communities inhabiting dead wood. The next aim of the study is to test the following hypotheses: (1) Uropodina exhibit preferences for certain tree species; and (2) communities differ depending on the region and time of the samples collection. The material for the analysis consists of samples from different types of dead wood merocenoses and 37 species of trees, and were collected across the whole area of Poland. More Uropodina species were collected from the dead wood of broadleaved species than from coniferous species. The tree species in which communities of the studied mites were the richest were beech, oak, pine, spruce, linden, and hornbeam. The analysis of habitat preferences of Uropodina mites for particular tree species has revealed that none of the analyzed mite species did not occur in the dead wood samples from all tree species. Another important result is that the mite communities found in the samples from the same tree species remained similar in each decade of the research. The results also show that the communities of Uropodina inhabiting dead wood of the same tree species in different regions of Poland had different species composition, which stems from differences in the range of occurrence of these mites species.

Graphical Abstract

1. Introduction

Biodiversity is currently one of the most widely used terms in biological studies, and the loss of biodiversity on a global scale, including mites, has already become a serious problem [1,2]. In this context, the impact of dead wood merocenoses in forest ecosystems on species diversity and the abundance of mite communities (Acari) is particularly important. The presence of such microhabitats not only increases the overall biodiversity of forest ecosystems, but they are also important reservoirs for rare and stenotopic species [3]. The importance of dead wood is often discussed in studies focused on different groups of invertebrates, including mites [3,4,5,6,7]. However, very few studies focus on the impact of the conditions which are associated with the presence of dead wood, such as the type of merocenosis, extent of wood decay, humidity, or tree species from which the dead wood samples have been collected. Besides this, those few studies [5,8] discuss only groups from the higher taxonomic rank (i.e., Oribatida, Mesostigmata), and there are no studies which focus on the lower taxonomic ranks, including mites from the suborder Uropodina (Acari: Parasitiformes).
The differences in species composition and community structure of Uropodina communities inhabiting dead wood and tree hollows of various tree species were noticed for the first time by Błoszyk [9]. Out of the 14 tree species examined, he recorded the highest number of Uropodina species in the dead wood of linden, and the lowest number in the dead wood of spruce. The authors of this study want to make an attempt to provide a characteristic of the species composition of Uropodina species in relation to tree species on the basis of more extensive research material. Thus, the major aim of this study is to check whether the species of tree can have any impact on the species composition and abundance of Uropodina mites inhabiting dead wood merocenoses. Furthermore, the study tests the hypothesis that Uropodina species exhibit specific preferences for certain tree species and that Uropodina communities differ depending on the region and time period in which dead wood samples are collected.

2. Material and Methods

The material for the analysis contained samples from dead wood which were collected across the whole area of Poland by different researchers in the period 1956–2020. In the case of 1622 samples it was possible to identify the tree species of the rotten wood. The samples come from different types of dead wood merocenoses (i.e., lying logs, tree hollows, rootstocks, windthrows, stumps of cut-down trees, broken trunks) and 37 species of trees (Table A1). The samples contained unsieved rotten wood of the volume between 0.5 and 0.8 L. The mites were extracted from the samples for 36–48 h (depending on the humidity) with Tullgren funnels, and were then preserved in 75% ethyl alcohol. The mites were sorted out from the samples with a stereoscopic microscope, after which they were cleared in 80% lactic acid, and then identified by means of an Olympus BX51. The identification of the species was carried out by the last author. The analyzed material has been deposited in the Natural History Collections at the Faculty of Biology at AMU in Poznań. The obtained data are now stored in a computer database called AMUNATCOLL.
The tree species were often represented by a low number of samples, and hence this study should be partly regarded as preliminary. In the overall analysis, the tree species represented by a single sample were analyzed as a genus together with other species of this genus (e.g., elm, willow, maple), and all fruit trees were analyzed as a separate group. For this reason the general statistics, such as the number of mite species and number of specimens, are given for all tree species included in the studies (Table A1), whereas the more detailed statistical analyses rest upon the material that comes from the five most frequent species of trees (oak, beech, pine, hornbeam, spruce), for which the total number of the collected samples was n > 50. The tree species analyzed in this study are the major components of forests in the whole array of different habitats—ranging from poor coniferous Vaccinio-Piceetea forests to eutrophic and mesotrophic deciduous Querco-Fagetea forests. The selected variables (number of species, number of specimens) were analyzed in relation to the observation period (decade) and tree species. Due to the high variance of the collected data and low number of representative specimens, the analysis does not include the data collected during the 1960s. The years of observation have been arranged according to the decades, and in the analysis they were used as categorical variables.
The structure of the analyzed mite communities is illustrated with a scale of dominance (D) and the frequency of occurrence (F) [10]. The relative abundance was used for the analysis of biodiversity and abundance of Uropodina communities [11]. The community similarity of the species composition for Uropodina mites inhabiting such merocenoses was calculated by means of the Marczewski–Steinhaus species similarity index: S = c/(a + b − c), where c is the number of species present in both compared communities, and a and b stand for the total numbers of species in each community. The full joining analysis, which uses the most distant neighbors, was used to prepare the dendrogram [11]. The differences between the average number of Uropodina in the dead wood samples of deciduous and coniferous trees were calculated with the Cochran-Cox t-test, whereas the differences in the average number of O. ovalis in the dead wood samples of the examined tree species were calculated by means of the (ANOVA) Kruskal-Wallis rank test. The analyses were performed with AnalizaTor 2.0 software.
The data were analyzed with the function ANOVA in generalized linear models (GLMs) for gamma distribution of dependent variables (number of species, number of individuals). The post-hoc analyses were performed with the function glht from the multcomp package [12]. We predicted that the tree species from which the material was collected and year of observation (pooled in decades) had an impact on the diversity of Uropodina species and the number of individuals. There was no collinearity between the explanatory variables (max GVIF < 3). The residuals versus the expected values and overdispersion were checked with the DHARMa package [13].
We used the five most numerous Uropodina species, the total number of which was over 100 individuals (i.e., P. pulchella, O. minima, O. ovalis, T. aegrota, and U. tecta), to show their preferences for a given tree species (oak, beech, Scots pine, hornbeam, spruce). We also used the chi-square test goodness of fit (χ2) in the analysis of utilization-availability data. It was assumed that under a random distribution the total number of occurrences of Uropodina species on a tree species is proportional to its abundance in all of the examined plots. The total number of all trees of a given taxon was used as a proxy for its abundance. The strength of the influence of a single tree species on the chi-square test result was expressed using Pearson’s residuals. The analyses were performed with RStudio [14].
For the analysis of the Uropodina mites’ dependency on the tree species and sampling region for the four tree species (oak, beech, Scots pine, spruce), the data from all seasons were pooled and subjected to canonical correspondence analysis (CCA) which was performed with CANOCO v.5 software [15]. The Uropodina specimens that could not be identified at the species level were classified as unverified records, and they were excluded from any further CCA analysis.
Explanations of abbreviations of species names used in the CCA scatterplot are as follows: A.in—Apionoseius infirmus; C.ca—Cilliba cassideasimilis; C.er—Cilliba erlangensis; C.ra—Cilliba rafalskii; D.co—Dinychura cordieri; D.ar—Dinychus arcuatus; D.ca—Dinychus carinatus; D.in—Dinychus inermis; D.pe—Dinychus perforatus; D.wo—Dinychus woelkei; D.ba—Discourella (?) baloghi; D.mo—Discourella modesta; I.pe—Iphiduropoda penicillata; J.pu—Pulchellaobovella pulchella; J.py—Uroobovella pyriformis; L.or—Leiodinychus orbicularis; M.ca—Metagynella carpatica; N.br—Nenteria breviunguiculata; N.st—Nenteria stylifera; N.sp—Neodiscopoma spelndida; O.ka—Olodiscus kargi; O.mi—Olodiscus minima; O.mis—Olodiscus misella; O.kar—Oodinychus karawaiewi; O.ob—Oodinychus obscurasimilis; O.ov—Oodinychus ovalis; O.sp—Oodinychus spatulifera; O.al—Oplitis alophora; P.ra—Phaulodiaspis rackei; P.cy—Polyaspinus cylindricus; P.sc—Polyaspinus schweizeri; P.pa—Polyaspis patavinus; P.sn—Polyaspis sansonei; P.ca—Pseudouropoda calcarata; P.tu—Pseudouropoda tuberosa; T.ae—Trachytes aegrota; T.ir—Trachytes ireane; T.la—Trachytes lamda; T.mi—Trachytes minima; T.mo—Trachytes montana; T.pa—Trachytes pauperior; T.co—Trachyuropoda coccinea; T.el—Trematurella elegans; U.pa—Urodiaspis pannonica; U.te—Urodiaspis tecta; U.ma—Uroobovella marginata; U.ob—Uroobovella obovata; U.par—Uroplitella paradoxa; and U.or—Uropoda orbicularis.

3. Results

3.1. Species Composition and Community Structure of Uropodina Mite Communities in Dead Wood of Different Tree Species

The analyzed material comes from 37 species of trees, 16 of which were represented by very few samples (between one and four), which means that in such cases the obtained results are only preliminary and should be taken into consideration with great caution. In the case of five species of trees (plane-tree, mountain ash, wild serviceberry, bullace, black poplar), no specimens of Uropodina mites were found in the dead wood samples. The dead wood samples from the other tree species contained 29,931 specimens of Uropodina mites, which represented 54 taxa, 50 of which were designated at the species level. The other specimens were identified at the level of the genus (Table A1).
The frequency of Uropodina mites in the dead wood differed between tree species (Figure 1). In the case of four tree species (hawthorn, pear-tree, bird cherry and blackthorn), in which the frequency was 100%, the obtained results cannot be regarded as reliable due to the low number of samples. In most cases the frequency of Uropodina mites in the analyzed samples fluctuated between 60% and 88%. The lowest frequency that was recorded for the dead wood samples was from the poplar and yew.
The highest number of Uropodina species was recorded in the dead wood samples from the beech. The lowest number of Uropodina species was recorded in the dead wood samples from the mountain elm and goat willow. No specimens of Uropodina mites have been found in the dead wood samples of the following tree species: plane-tree, mountain ash, wild serviceberry, bullace and black poplar (Table A1).
Figure 2 shows that there is no correlation between the number of collected samples, the number of Uropodina species found in the dead wood samples and the number of specimens of mites.

3.2. Species Similarity of Uropodina Communities Inhabiting Dead Wood of Different Tree Species

The species similarity of the Uropodina communities inhabiting dead wood of the examined tree species varies (Figure 3). The highest species similarity has been observed in the communities found in the dead wood samples from maples and oaks, and also in the communities in spruce and sycamore (74%). Moreover, the communities found in the dead wood of maples and oaks were very similar to those in black alder. All of the tree species mentioned above were characterized by a high number of Uropodina species, which formed the communities and a large number of collected samples. A very high similarity index—over 60%—was obtained for the communities in the dead wood of pine and birch, and in larch and aspen. A similarity index of over 50% was also recorded for communities found in linden and beech. The dead wood of these two species contained the highest number of Uropodina species (Table A1). The communities of Uropodina mites in the dead wood from the other tree species exhibited a much lower species similarity (<50%).

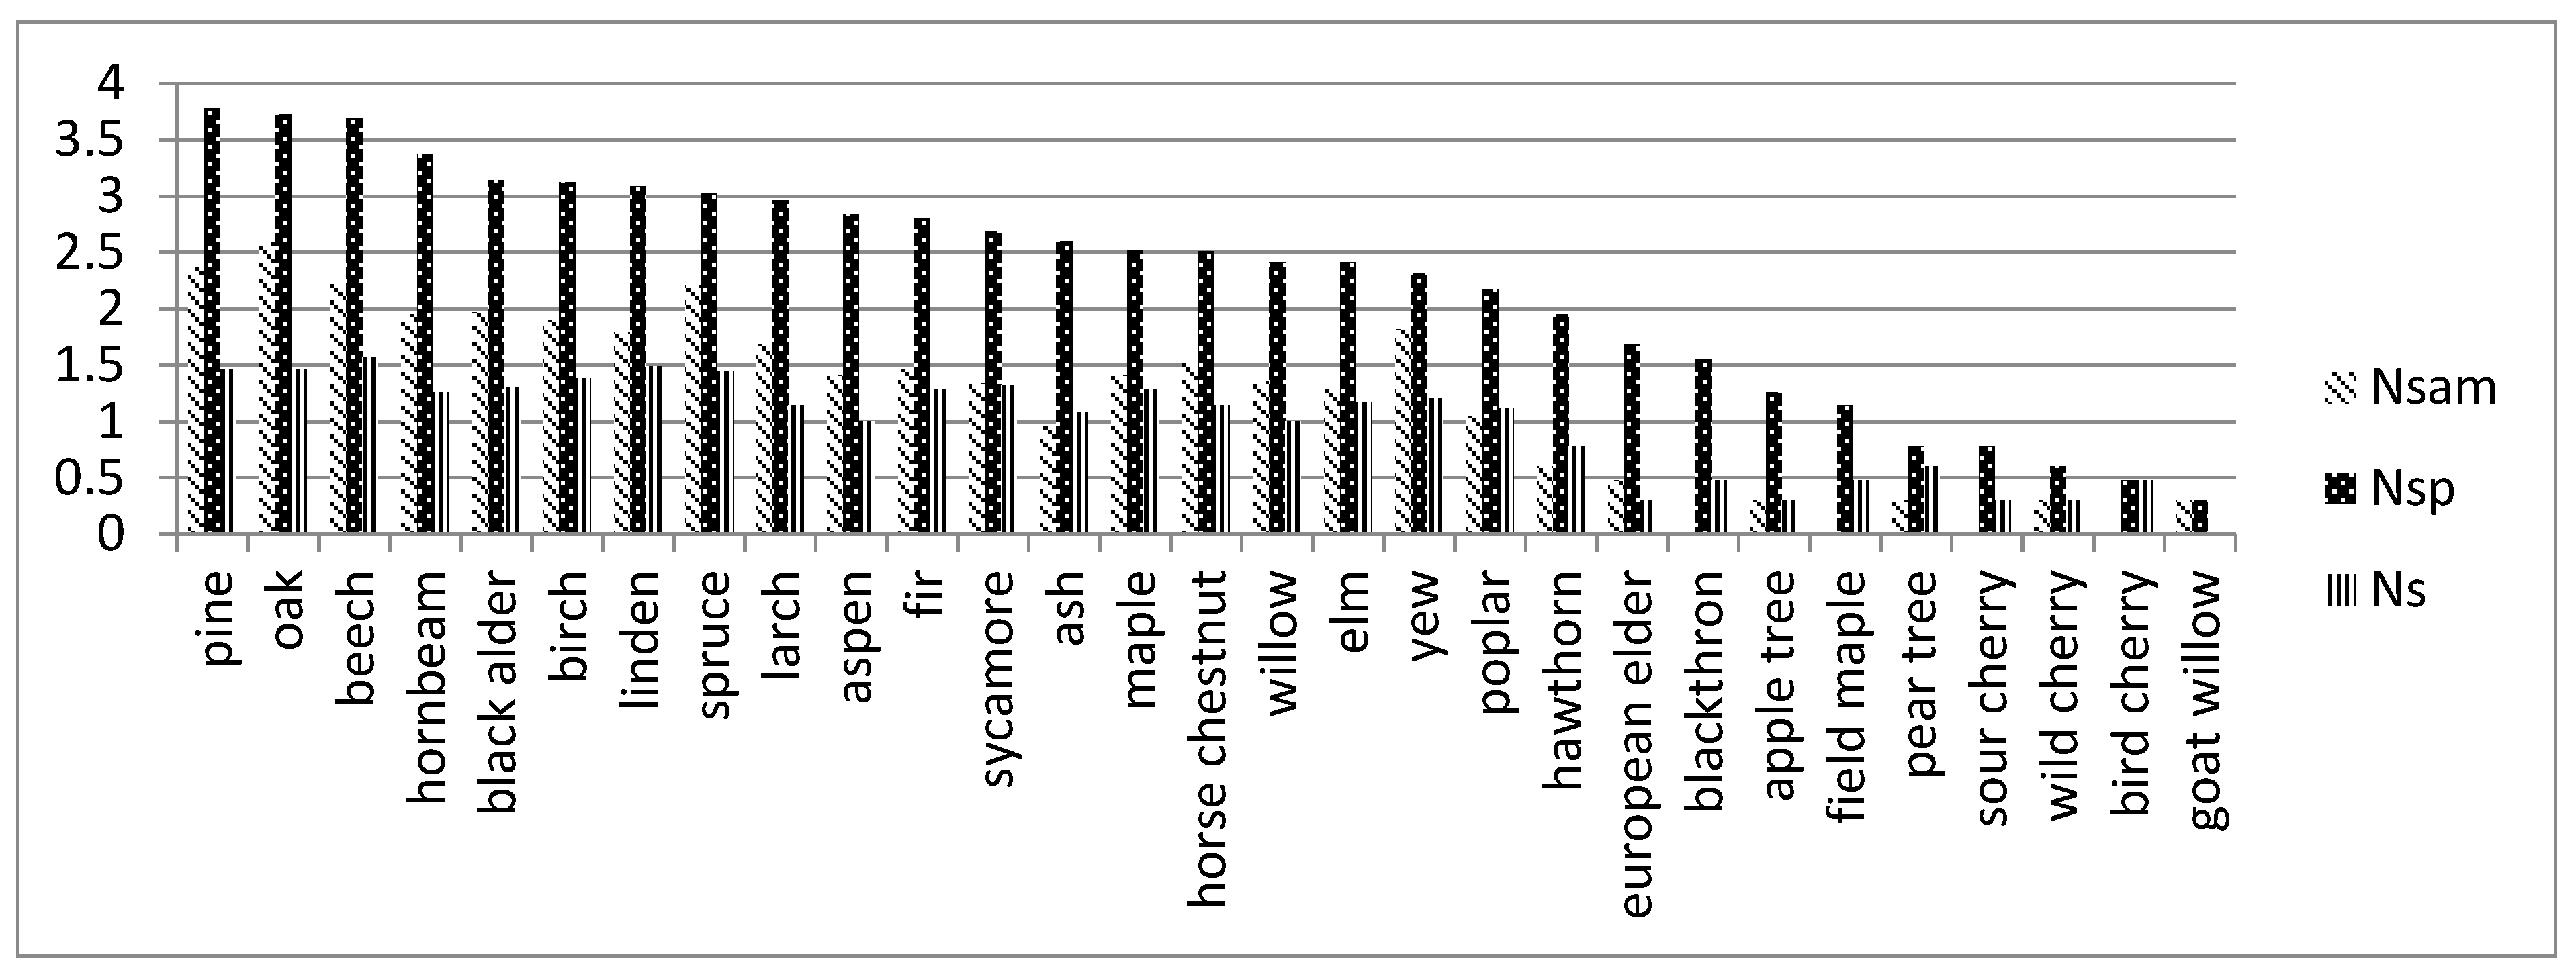
3.3. Impact of Dead Wood of Different Tree Species in Forest Ecosystems on Biodiversity and Abundance of Uropodina Mites

The index of relative abundance has the highest value (>100 specimens) in the case of such tree species as pine, oak, beech, horn-beam and larch (Figure 4). This communities are dominated by two or three common and numerous species, such as O. ovalis, P. pulchella, and U. pyriformis (Table A1). A lower index of relative abundance (63–70 specimens) was recorded for black alder, birch and aspen (Figure 4) despite the apparently high number of species. The lowest value of this index was obtained in the case of bird cherry and mountain elm. The analysis presented above shows that in the case of most of the examined tree species the number of found Uropodina specimens was low.

3.4. A Characteristic of Uropodina Communities in Dead Wood of Broadleaved and Coniferous Trees

The deciduous trees in which Uropodina mites were found were represented by 25 species, while the coniferous trees only by five species. The Uropodina community in the dead wood from the deciduous trees consisted of 53 species, and the samples from the coniferous trees contained 43 species (Table 1). However, in both cases the mites occurred with a similar frequency (64–65%) and the average number of specimens in a positive sample was also similar (in the samples from deciduous trees the number was slightly higher), though the number of specimens in the dead wood samples from deciduous trees was twice higher. Out of all 55 species of Uropodina mites found in the analyzed material, ten species occurred only in the dead wood samples from deciduous trees (18.18%) and two species occurred only in the samples from coniferous trees (3.64%).
The difference in the average number of Uropodina mites in the dead wood samples from deciduous and coniferous trees was not statistically significant (Cochran-Cox t-test = 0.44; p > 0.05).

3.5. A Thorough Analysis of Uropodina Mite Communities in Dead Wood Samples of Five Selected Tree Species over Decades

The ANOVA analysis of the communities from the dead wood samples of five tree species rests on the data obtained from 676 samples. The highest number of Uropodina species was recorded for the dead wood samples from beech (31), oak (29), pine (29), spruce (28), and hornbeam (18). The average number of species was significantly different depending on the tree species (F4, 668 = 8.72, p < 0.001), and there was no difference in the average number of species in regard to the research periods (F1, 668 = 0.10, p = 0.754, Figure 5A). The highest average number of Uropodina species was recorded in the dead wood samples from the examined beech trees (2.9, n = 114) (Figure 5B), whereas the lowest number was recorded for the samples from the spruce trees (1.9, n = 83).
Similar results were obtained for the average number of Uropodina individuals, which also considerably differed depending on the tree species (F4, 668 = 4.51, p = 0.001), but there were no significant differences in regard to the research period when the samples were collected (F1, 668 = 0.01, p = 0.919, Figure 6A). The highest average number of Uropodina individuals was recorded for the dead wood samples from the examined beech trees (43.5, n = 114) (Figure 6B), whereas the lowest number was recorded for the dead wood samples from the spruce trees (13.2, n = 83).

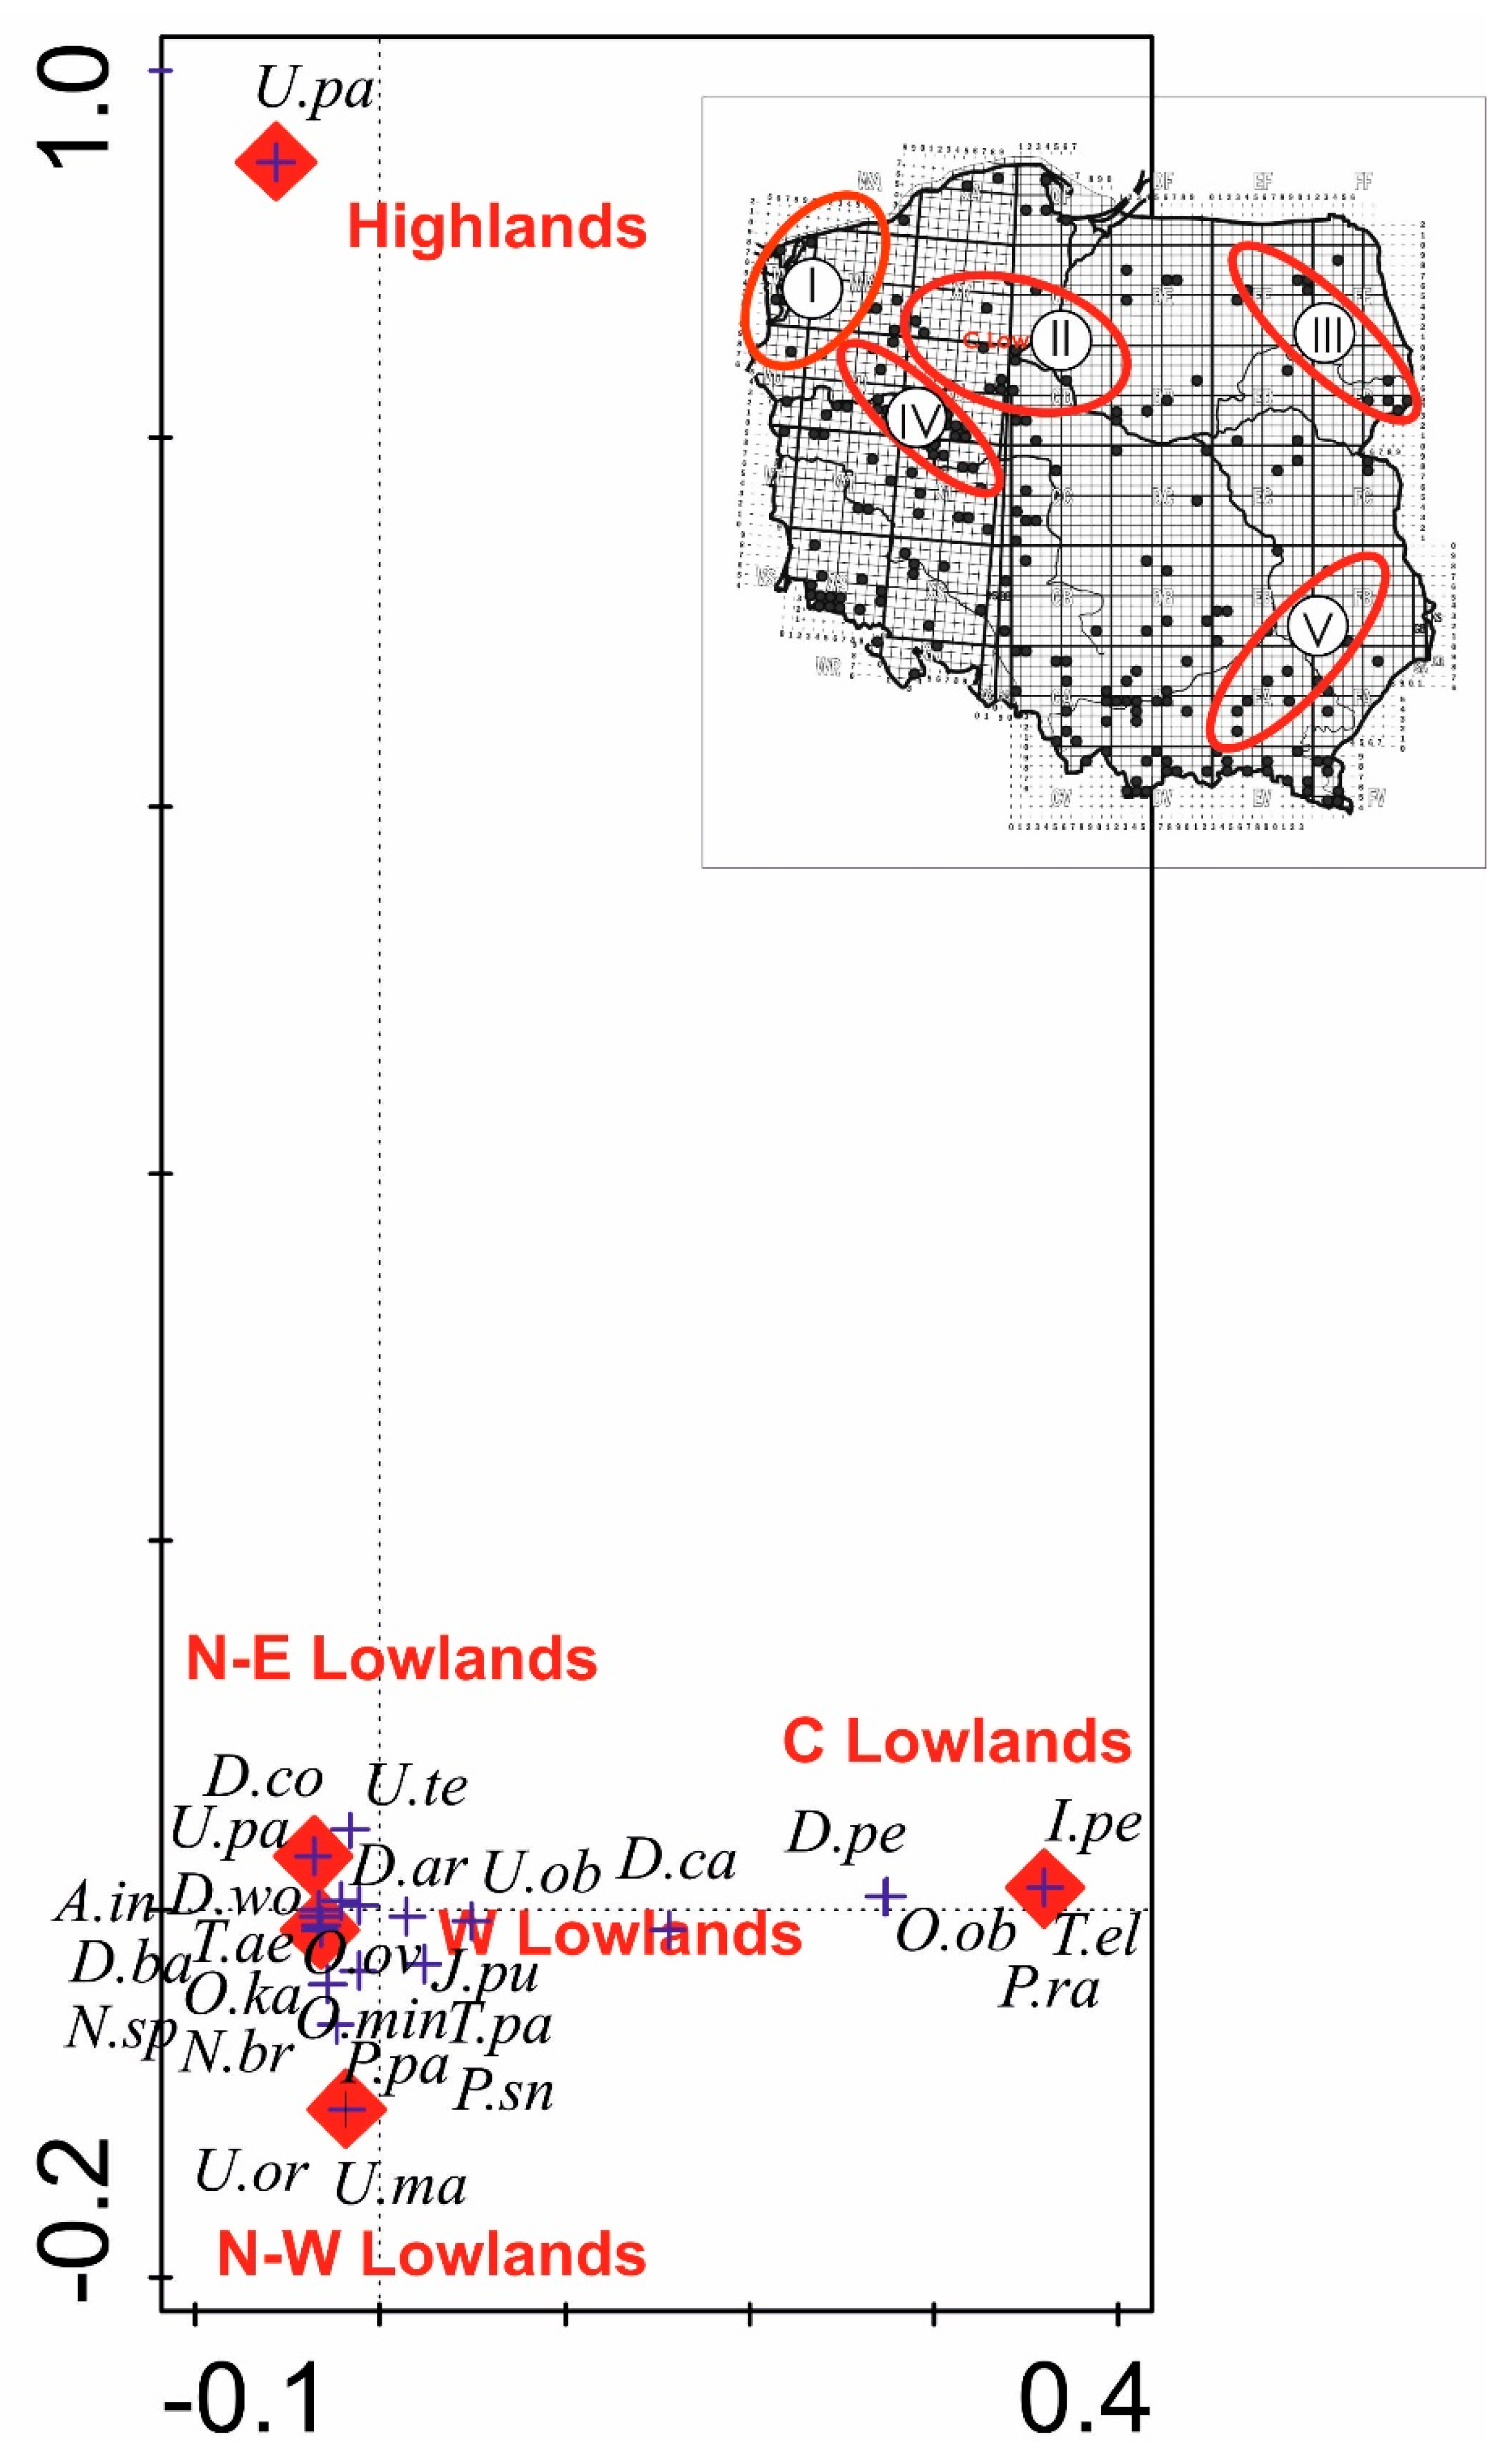
3.6. Multivariate Analysis for Uropodina Communities for Five Tree Species and Sampling Regions

The results of the Canonical Correspondence Analysis (CCA) (pseudo-F = 4.4, p = 0.002, Figure 7) show the differences in the Uropodina communities found in the dead wood samples from five tree species (oak, beech, pine, spruce). The examined trees were in most cases located in different areas; spruce (mainly from areas of upper subalpine forests), beech (mainly from areas of the lower subalpine forests of the Carpathian Mountains and uplands), oak and hornbeam (from hornbeam forests), and pine (from commercial forests planted by humans).
The zoogeographical differences in Uropodina communities found in dead wood samples of spruce, beech, and oak are presented in Figure A1 and Figure A2. There are two areas which are quite distinctive in this respect, namely, the Sudetes and Pogórze, where the spruce is very common despite the specific climate conditions in this area.
In the case of the dead wood samples from the examined beech trees (Figure A2), the region of the Highlands is particularly distinctive due to the beech forests in the area of Roztocze.
In the case of oak, the south-eastern part of Poland (Beskid Niski and Bieszczady Mountains) is particularly characteristic (Figure A3).
As for the dead wood samples from the examined Scots pine trees (Figure A4), the Highlands (Roztocze) and in Central Lowlands (Małopolska) are quite distinctive in this respect.

3.7. Habitat Preferences of Uropodina Mite Species for Particular Tree Species

None of the found Uropodina species occurred in the dead wood samples of all examined tree species (Table A1). The two most common mite species, which occurred in at least 60% of all examined tree species, were O. ovalis and P. pulchella. However, these two mite species were not found in the dead wood samples of the tree species from which the samples were collected only once.
It is also noteworthy that the statistically significant differences in the abundance of O. ovalis between the average values calculated for the examined tree species were observed only in the case of fir and ash (ANOVA Kruskal-Wallis rank test H (17, n = 746) = 47,58; p < 0.001).
Out of the five Uropodina species analyzed here, only three species (i.e., P. pulchella, O. minima and O. ovalis) had statistically significant values showing their habitat preferences for certain tree species (Table 2). In the case of two species (T. aegrota and U. tecta), the obtained results revealed no evidence indicating clear habitat preferences for any of the tree species. P. pulchella and O. minima exhibited the strongest habitat preferences for dead wood of pine trees (rPearson 5.25 and 4.11). Pine and hornbeam were, in fact, the two tree species that the analyzed Uropodina mites inhabited most frequently. The dead wood samples from spruce did not contain many specimens of these mite species, though in the case of beech this is not so evident. As for birch and oak, there is a clear difference in the habitat preference depending on the Uropodina species.

4. Discussion

The article presented here is therefore a continuation of the discussion about the importance of dead wood for biodiversity of Uropodina communities inhabiting dead wood merocenoses. The role of dead wood as an element which enriches the biodiversity of Uropodina in forest ecosystems, and the impact of this microhabitat on the biology and ecology of Uropodina communities inhabiting a this type of habitat are discussed in Błoszyk et al. [3]. The results obtained from the analysis show that the tree species from which the analyzed dead wood samples were collected is an important factor, determining both the species composition and abundance of Uropodina communities inhabiting this type of microhabitat. The analyses carried out in this study show that the dead wood samples collected from deciduous tree species contained much more Uropodina species than those from the coniferous species, though the frequency of the found mites was similar in both cases, and the higher number of species in the samples from the deciduous species may also stem from the fact that the overall number of the collected samples from these trees was twice higher than from the coniferous species (1061:578). The tree species which have the strongest impact on the alpha-biodiversity of Uropodina mites in forest ecosystems are beech, oak, pine, spruce, linden, and hornbeam. These results confirm the earlier observations published by Błoszyk [9], who claims that the highest number of Uropodina species had communities inhabiting the dead wood of linden, beech, maple, and oak. It is noteworthy that Błoszyk’s [9] study rests mainly on dead wood samples from linden, whereas in this study the number of samples from this tree species was almost four times fewer than the other species mentioned above. Thus, the results obtained in this study show that the dead wood of linden, similarly to oak, beech, and pine, creates very favorable habitat conditions for mites from the suborder Uropodina. However, in the case of the communities inhabiting the analyzed dead wood from linden, the abundance of the Uropodina communities was lower than in the other tree species despite the high species diversity. On the other hand, the lowest number of Uropodina species and lower abundance were recorded in the communities found in the dead wood samples of yew, poplar, and willow, probably due to the specific quality of the dead wood of these tree species, which is dry and dusty. It should be noted that the results for spruce presented here are different from those published by Błoszyk [9]. In the earlier studies, dead wood from this tree species contained very few Uropodina species, while the results of the analyses presented in this study show that spruce is one of the tree species that has the largest number of Uropodina species. This discrepancy stems from the fact that Błoszyk [9], in his study, analyzed only nine samples from the dead wood of spruce. Moreover, the obtained results also show that the dead wood of beech, pine, and spruce contained the highest abundance of these mites, which proves the favorable impact of these tree species on both the abundance and species diversity of Uropodina communities. The conducted analyses have also revealed that the structure of the examined Uropodina communities differed depending on the tree species, but they were not considerably different over the decades during which the research was conducted. This, in turn, means that the species composition of Uropodina communities inhabiting the dead wood of these tree species is rather stable in long periods of time, although this problem needs further research, which will be conducted in the future.
The adduced evidence suggests that the index of relative abundance in the examined Uropodina communities in general was reversely proportional to the alpha diversity. This means that the communities with a large number of species were often dominated by a few species, which in turn means that diversity in these was relatively lower. This is one of the characteristics of unstable microhabitats (merocenoses) [16]. In the case of the tree species in which the number of Uropodina species was lower, the observed abundance in the examined communities was more uniform. There is no doubt that there is a number of different factors, such as the type of merocenosis, the extent of wood decay and its humidity, which can have bearing on the abundance. The impact of these factors will be a topic of our subsequent studies in this series of publications.
The analysis of habitat preferences of Uropodina mites for certain tree species has revealed that none of the Uropodina species mentioned above did not occur in the dead wood samples of all tree species examined for the purpose of this study (Table A1). This fact supports the hypothesis that among Uropodina mites there are no ubiquitous species. This observation conforms to the results obtained by Huhta et al. [5], which show that the communities of Mesostigmata inhabiting tree stumps and trunks were considerably different depending on the tree species. Such differences were not found in the case of Oribatida [5].
The results presented in the current study also show that Uropodina communities inhabiting dead wood of certain tree species in different geographical regions of Poland were different in relation to their species diversity (see Appendix A, Figure A1, Figure A2, Figure A3 and Figure A4). This also supports the earlier observations regarding the geographical range of occurrence of Uropodina mites in the area of Poland [9,17], and it means that at the “macro” level, not only the tree species, but also the geographical factor, has a considerable impact on the biodiversity of Uropodina communities inhabiting dead wood.

5. Conclusions

Such tree species as oak, beech, and spruce, from which the dead wood samples contained the largest number of Uropodina species, are the major species that form the tree stand of forests in Poland. This means that there is sufficient potential for preserving the biodiversity of these mites and other invertebrates inhabiting dead wood. However, dead wood left in forests will increase the overall biodiversity of Uropodina communities only when the biological diversity of forest tree stands is preserved, which means growing less monoculture plantations and limiting human interference in forests. That old and similar to natural tree stands are particularly important for preserving the biodiversity of Uropodina mites has already been proved by the results of the research conducted for the Białowieża Primeval Forest and Cisy Staropolskie Nature Reserve [3,18], which clearly shows the unique biodiversity of the Uropodina communities inhabiting dead wood in these forests. To recapitulate, the positive impact of dead wood left in forests on preserving biodiversity will be higher, the more tree species are preserved in forests until their natural death, and they remain untouched as dead wood in the ecosystem.

Author Contributions

Conceptualization, J.B., A.N.; Methodology, A.N., J.B., P.K.; Software, J.B., P.K.; Validation, J.B., A.N., M.Z.; Formal Analysis, J.B., A.N., P.K., M.Z., K.G.; Investigation, J.B., A.N., M.Z.; Resources, J.B., A.N., M.Z.; Data Curation, J.B., M.Z.; Writing—Original Draft Preparation, J.B., A.N., P.K., M.Z.; Writing—Review & Editing, A.N., M.Z.; Visualization, J.B., A.N., P.K.; Supervision, A.N.; Project Administration, J.B., M.Z.; Funding Acquisition, J.B., A.N. All authors have read and agreed to the published version of the manuscript.

Funding

This work was possible due to financial support from the Department of General Zoology received for a Ph.D. project carried out by Michał Zacharyasiewicz, M.A.

Institutional Review Board Statement

Not applicable.

Data Availability Statement

The data presented in this study stored in a computer database called AMUNATCOLL and openly available at: https://amunatcoll.pl/ (accessed on 22 November 2021).

Acknowledgments

The authors of the study are grateful to all who collected dead wood samples which are now stored in the AMU Nature Collections of the Faculty of Biology in Poznań, especially Monika Markowicz, Bartosz Labijak, and Tomasz Rutkowski.

Conflicts of Interest

The authors declare no conflict of interest.

Appendix A

Table A1. Species composition of Uropodina mites in dead wood samples of examined tree species (deciduous vs. coniferous): 1—Fagus L. (beech); 2—Tilia L. (linden); 3—Quercus L. (oak); 4—Pinus L. (pine); 5—Picea A. Dietrich (spruce); 6—Betula L. (birch); 7—Acer pseudoplatanus L. (sycamore); 8—Alnus glutinosa (L.) Gaertn. (black alder); 9—Acer L. (maple); 10—Abies Mill. (fir); 11—Carpinus L. (hornbeam); 12—Taxus L. (yew); 13—Ulmus L. (elm); 14—Aesculus L. (horse-chestnut); 15—Larix Mill. (larch); 16—Populus L. (poplar); 17—Robinia L. (black Locust); 18—Fraxinus L. (ash); 19—Populus tremula L. (aspen); 20—Salix L. (willow); 21—Crataegus L. (hawthorn); 22—Pyrus L. (pear tree); 23—Padus Mill. (bird cherry); 24—Acer campestre L. (field maple); 25—Prunus spinosa L. (blackthron); 26—Sambucus nigra L. (European elder); 27—Prunus avium L. (wild cherry); 28—Cerasus Mill. (sour cherry); 29—Malus Mill. (apple tree); 30—Ulmus glabra Huds. (mountain elm); 31—Salix caprea L. (goat willow).
Number of Tree Species12345678910111213141516171819202122232425262728293031
Number of samples164623842331617922922629906519334912129262342111321212
Number of specimens4857120653775995109013324851383334645235520525932515301494073956912759063143649461812
Number of species343129292821212019191816151414131312101064333222211
Species
Oodinychus ovalis (Koch, 1839)96731131223370447800294731144811764704729112965328319199226603 30481361
Pulchellaobovella pulchella (Berlese, 1904)8049224189526200537633802751117128 5219221 1 3312 2
Olodiscus minima (Kramer, 1882)191811730342261214 514133324151 811 1
Trachytes aegrota (C. L. Koch, 1841)18951156154295541212921601221811315 12113 5
Dinychus carinatus Berlese, 19037882716514723104919418 5 173 33820
Dinychus woelkiei (Hirschmann et Zirngiebl-Nicol, 1969)8643176582141052438 3946 8 1
Discourella (?) baloghi (Hirschmann et Z.-Nicol, 1969)517214251161068355742 7714 2 3 2
Uroobovella pyriformis (Berlese, 1920)866336439 1 326136 1022113 5323
Dinychus perforatus Kramer, 1882813962 51013226452411
Trematurella elegans (Kramer, 1882)4152831102235179384211 3
Urodiaspis tecta (Kramer, 1876)9211932650221259 511471614 5 215
Oodinychus karawaiewi (Berlese, 1903)193113 33731 51 46 3 5
Dinychus arcuatus (Trägårdh, 1922)107 3868134256167 2 5
Pseudouropoda sp.5 791821 1 1 1 16 1 3
Iphiduropoda penicillata (Hirschmann et Z.-Nicol, 1961)248612223 1 11 2
Polyaspis patavinus (Berlese, 1881)223085 37 1 51921 1 8
Trachytes pauperior (Berlese, 1914)152388172 4 4 1320 1
Uroobovella obovata (Canestrini et Berlese, 1884)1151314281511 3
Uroobovella sp.857125 11 3
Polyaspis sansonei (Berlese, 1916) 219337 1 44 1 1
Apionoseius infirmus (Berlese, 1887)57563944 1 1 1
Oodinychus obscurasimilis (Hirschmann et Z.-Nicol, 1961) 19 32 13 1
Oodinychus spatulifera (Moniez, 1892)637 12 1 72
Oplitis sp.1 1112 5
Dinychus inermis (C. L. Koch, 1841) 13 7 2
Leiodinychus orbicularis (C. L. Koch, 1839)231552 1 39 6 1
Neodiscopoma splendida (Kramer, 1882)727 11 91
Cilliba cassideasimilis (Błoszyk, Stachowiak et Halliday, 2008)2 5 42
Phaulodiaspis rackei (Oudemans, 1912) 1 1 1 2
Trachytes irenae (Pecina, 1970)2 28 1 3
Urodiaspis pannonica (Willmann, 1952)8 1 17
Discourella modesta (Leonardi, 1889) 4 21 1
Olodiscus misella (Berlese, 1916)9 1 2
Oplitis alophora (Berlese, 1903) 8 1
Trachytes lamda Berlese, 190311 7
Trachytes minima (Trägårdh, 1910)3 1
Uroplitella paradoxa (Canestrini et Berlese, 1884) 1 1 1
Uropoda sp.1 16 8
Cilliba rafalskii sp.n 3 3
Dinychura cordieri (Berlese, 1916) 1 7
Nenteria stylifera (Berlese, 1904) 2 15 3
Nenteria breviunguiculata (Willmann, 1949) 1 2
Pseudouropoda calcarata (Hirschmann et Z.-Nicol, 1961)1 2
Pseudouropoda tuberosa (Hirschmann et Z.-Nicol, 1961) 1 5
Uroobovella marginata (C. L. Koch, 1829) 221
Uropoda orbicularis ((Müller, 1776) 1
Allodinychus flagelliger (Berlese, 1910) 1
Cilliba erlangensis (Hirschmann et Z.-Nicol, 1969) 1
Metagynella carpatica (Balogh, 1943)168
Olodiscus kargi (Hirschamann et Z.-Nicol, 1969)4
Polyaspinus schweizeri (Huţu, 1976) 1
Trachytes montana (Willmann, 1953) 1
Trachyuropoda coccinea (Michael, 1891) 6
Urodiaspis stammeri (Hirschmann et Z.-Nicol, 1969) 1
Figure A1. Canonical Correspondence Analysis (CCA) scatterplot showing the relationships between examined Uropodina mite communities from spruce from different regions of Poland from 53 samples from the Sudetes (III), 22 from Carpathians foothills (IV), 67 from north-eastern Poland (II) and 19 from central-western lowlands (I) on the first two axes. First and second axis explained 6.54% of variation (pseudo-F = 2.1, p = 0.020). Abbreviations of species are included in Section 2.
Diversity 13 00609 g0a1
Figure A2. Canonical Correspondence Analysis (CCA) scatterplot showing the relationships between examined Uropodina mite communities from beech from different regions of Poland from 3 samples from the Sudetes (III), 17 from Carpathians foothills (IV), 27 from highlands (II) and 62 from lowlands (I) on the first two axes. First and second axis explained 3.67% of variation (pseudo-F = 1.6, p = 0.072). Abbreviations of species are included in Section 2.
Diversity 13 00609 g0a2
Figure A3. Canonical Correspondence Analysis (CCA) scatterplot showing the relationships between examined Uropodina mite communities from oaks (Queracus robur and Q. petrea) from different lowland regions of Poland from 4 samples from south-western lowlands (Lower Silesia) (IV), 8 from central lowlands (Kuyavia) (I), 44 from north-eastern lowlands (Podlachia and Warmia) (II), 5 from south-east of Poland (V) and 177 from western lowlands (Greater Poland) (III) on the first two axes. First and second axis explained 3.72% of variation (pseudo-F = 2.8, p = 0.014). Abbreviations of species are included in Section 2.
Diversity 13 00609 g0a3
Figure A4. Canonical Correspondence Analysis (CCA) scatterplot showing the relationships between examined Uropodina mite communities from Scots pine from different regions of Poland from 17 samples from NE lowlands (Podlachia+Warmia) (III), 16 from central lowlands (Kuyavia) (II), 7 from north-western lowlands (I) and 4 from highlands (V) and 132 from western lowlands (Greater Poland) (IV) on the first two axes. First and second axis explained 3.63% of variation (pseudo-F = 2.2, p = 0.028). Abbreviations of species are included in Section 2.
Diversity 13 00609 g0a4

References

  1. Sullivan, G.T.; Ozman-Sullivan, S.K. Alarming evidence of widespread mite extinctions in the shadows of plant, insect and vertebrate extinctions. Austral Ecol. 2021, 46, 163–176. [Google Scholar] [CrossRef]
  2. Ozman-Sullivan, S.K.; Sullivan, G.T. The newly formed Mite Specialist Group of the IUCN’s Species Survival Commission and the conservation of global mite diversity. Acaraological Stud. 2021, 3, 51–55. [Google Scholar] [CrossRef]
  3. Błoszyk, J.; Rutkowski, T.; Napierała, A.; Konwerski, S.; Zacharyasiewicz, M. Dead Wood as an Element Enriching Biodiversity of Forest Ecosystems: A Case Study Based on Mites from the Suborder Uropodina (Acari: Parasitiformes). Diversity 2021, 13, 476. [Google Scholar] [CrossRef]
  4. Gutowski, J.M.; Bobiec, A.; Pawlaczyk, P.; Zub, K. Drugie Życie Drzewa; WWF: Warszawa, Poland, 2004; 245p. [Google Scholar]
  5. Huhta, V.; Siira-Pietikäinen, A.; Penttinen, R. Importance of dead wood for soil mite (Acarina) communities in boreal old-growth forests. Soil Org. 2012, 84, 499–512. [Google Scholar]
  6. Siitonen, J. Microhabitats. In Biodiversity in Dead Wood, 1st ed.; Stokland, J.N., Siitonen, J., Jonsson, B.G., Eds.; Cambridge University Press: Cambridge, UK, 2012; pp. 150–182. [Google Scholar]
  7. Stokland, J.N.; Siitonen, J.; Bengt, G.J. Dead wood in natural forest. In Biodiversity in Dead Wood, 1st ed.; Cambridge University Press: Cambridge, UK, 2012; 301p. [Google Scholar]
  8. Skubała, P.; Duras, M. Do decaying logs represent habitat islands? Oribatid mite communities in dead wood. Ann. Zool. 2008, 58, 453–466. [Google Scholar] [CrossRef]
  9. Błoszyk, J. Fauna Uropodina (Acari: Mesostigmata) spróchniałych pni drzew i dziupli w Polsce. Zesz. Probl. Post. Nauk Roln. 1990, 373, 217–235. [Google Scholar]
  10. Błoszyk, J. Geograficzne i Ekologiczne Zróżnicowanie Zgrupowań Roztoczy z Kohoryty Uropodina (Acari: Mesostigmata) w Polsce: Uropodina Lasów Grądowych (Carpinion betuli); Kontekst: Poznań, Poland, 1999; 245p. [Google Scholar]
  11. Magurran, A.E. Measuring Biological Diversity; Blackwell Publishing: Oxford, UK, 2004; 256p. [Google Scholar]
  12. Hothorn, T.; Bretz, F.; Westfall, P. Simultaneous Inference in General Parametric Models. Biom. J. 2008, 50, 346–363. [Google Scholar] [CrossRef] [PubMed] [Green Version]
  13. Hartig, F. DHARMa: Residual Diagnostics for Hierachical (Multi-Level/Mixed) Regression Models. R Package Version 0.3.3.0. 2020. Available online: https://CRAN.R-project.org/package=DHARMa (accessed on 22 November 2021).
  14. RStudio Team. RStudio: Integrated Development Environment for R. RStudio, PBC, Boston, MA, USA. 2021. Available online: http://www.rstudio.com/ (accessed on 22 November 2021).
  15. Šmilauer, P.; Lepš, J. Multivariate Analysis of Ecological Data Using CANOCO 5, 2nd ed.; Cambridge University Press: Cambridge, UK, 2014. [Google Scholar] [CrossRef] [Green Version]
  16. Napierała, A.; Błoszyk, J. Unstable microhabitats (merocenoses) as specific habitats of Uropodina mites (Acari: Mesostigmata). Exp. Appl. Acarol. 2013, 60, 163–180. [Google Scholar] [CrossRef] [PubMed] [Green Version]
  17. Błoszyk, J.; Napierała, A. Zróżnicowane granice zasięgów roztoczy z podrzędu Uropodina (Acari: Mesostigmata) w Polsce. In Proceedings of the Ogólnopolska Konferencja Zoologiczna, Zoologia dziś: Trendy, wyzwania, kierunki na przyszłość, Rzeszów, Poland, 7–8 September 2021. [Google Scholar]
  18. Napierała, A.; Konwerski, S.; Gutowski, J.M.; Błoszyk, J. Species diversity of Uropodina communities (Acari: Parasitiformes) in soil and selected microhabitats in the Białowieza Primeval Forest. In Mites (Acari) of the Białowieza Primeval Forest, 1st ed.; Błoszyk, J., Napierała, A., Eds.; Kontekst: Poznań, Poland, 2020; pp. 11–60. [Google Scholar]
Figure 1. Frequency of Uropodina mites in dead wood samples of examined tree species. The first four tree species with 100% frequency had very low number of samples.
Diversity 13 00609 g001
Figure 2. Number of samples (Nsam), number of specimens (Nsp) and number of Uropodina species (Ns) (logarithmic scale) for examined tree species (according to the number of specimens).
Diversity 13 00609 g002
Figure 3. Species similarity of Uropodina communities inhabiting dead wood of different tree species: 1—maple, 2—oak, 3—black alder, 4—spruce, 5—sycamore, 6—pine, 7—birch, 8—linden, 9—beech, 10—horse-chestnut, 11—elm, 12—hornbeam, 13—larch, 14—aspen, 15—fir, 16—yew, 17—poplar, 18—willow, 19—ash. Dotted line—50% similarity.
Diversity 13 00609 g003
Figure 4. Relative abundance for examined tree species allow to discern six groups with different impact on abundance of Uropodina mites in forest eco-systems: 1—pine, 2—oak, 3—beech, 4—hornbeam, 5—larch, 6—black alder, 7—aspen, 8—birch, 9—spruce, 10—linden, 11—fir, 12—ash, 13—black Locust, 14—willow, 15—European elder, 16—horse-chestnut, 17—sycamore, 18—maple, 19—elm, 20—hawthorn, 21—yew, 22—blackthorn, 23—poplar, 24—apple tree, 25—field maple, 26—sour cherry, 27—wild cherry, 28—goat willow, 29—pear tree, 30—bird cherry, 31—mountain elm.
Diversity 13 00609 g004
Figure 5. Average number of Uropodina species: (A) in relation to research period, and (B) in relation to tree species, box—standard error, whiskers—standard deviation. Letters a, b, c—statistically significant differences between species at the level of p < 0.05.
Diversity 13 00609 g005
Figure 6. Average number of Uropodina specimens: (A) in relation to research period, and (B) in relation to tree species, box—standard error, whiskers—standard deviation. Letters a, b—statistically significant differences between species at the level of p < 0.05.
Diversity 13 00609 g006
Figure 7. Canonical Correspondence Analysis (CCA) scatterplot showing the relationships between examined Uropodina mite communities from 114 beeches, 243 oaks, 69 hornbeams, 182 Scots pines, and 83 spruces on the first two axes. First and second axis explained 2.05% of variation. Abbreviations of species—in Section 2.
Diversity 13 00609 g007
Table 1. Community structure of Uropodina mites in dead wood of deciduous and coniferous trees. n—number of specimens, D—dominance, F—frequency, X ± SD–average ± Standard Deviation.
Type of TreesDeciduousConiferous
Number of Samples1061578
H’ IndexH’ = 1.706H’ = 1.454
SpeciesnD%F%X ± SDnD%F%X ± SD
O. ovalis933847.4546.848.842 ± 25.077509753.8645.509.005 ± 22.627
U. pyriformis199310.135.181.878 ± 24.181380.401.040.066 ± 1.076
P. pulchella19269.7913.951.815 ± 11.500243025.6819.384.204 ± 19.878
D. carinatus14577.4011.591.373 ± 9.548420.443.110.073 ± 0.557
D. baloghi12576.394.341.19 ± 15.712910.961.040.161 ± 2.861
T. aegrota5963.0314.700.564 ± 2.8755956.2921.801.051 ± 6.747
D. woelkiei5732.915.750.540 ± 5.222770.812.770.133 ± 2.027
U. tecta3451.758.950.327 ± 1.8051041.108.820.184 ± 0.889
P. patavinus3011.531.410.285 ± 4.61960.060.520.011 ± 0.178
O. minima2901.479.050.275 ± 1.3353443.6413.150.608 ± 2.664
D. arcuatus1991.013.390.188 ± 1.7141051.112.940.182 ± 1.382
T. elegans1850.943.200.175 ± 2.734810.862.600.143 ± 1.777
D. perforatus1680.852.540.159 ± 1.937410.431.730.072 ± 1.079
M. carpatica1680.850.280.159 ± 5.017
A. infirmus1550.791.700.147 ± 1.93280.080.350.014 ± 0.238
L. orbicularis1310.671.890.124 ± 1.66160.060.350.011 ± 0.214
O. karawaiewi960.492.070.091 ± 1.15230.241.040.041 ± 0.469
T. pauperior690.353.020.065 ± 0.596450.483.980.08 ± 0.471
U. obovata570.291.890.054 ± 0.54160.170.690.028 ± 0.551
O. spatulifera530.270.660.050 ± 0.863120.130.350.021 ± 0.399
I. penicillata450.231.320.042 ± 0.7480.080.690.014 ± 0.195
N. splendida350.180.660.033 ± 0.837110.120.520.019 ± 0.383
Pseudouropoda sp.350.181.320.033 ± 0.524300.321.900.053 ± 0.491
Uroobovella sp.300.151.410.028 ± 0.29130.030.520.005 ± 0.073
U. marginata220.110.280.021 ± 0.563
N. stylifera200.100.280.019 ± 0.475
Uropoda sp.170.090.190.016 ± 0.49380.080.170.014 ± 0.336
P. sansonei130.070.570.012 ± 0.2321401.481.900.247 ± 2.797
D. inermis120.060.380.011 ± 0.19910.010.170.002 ± 0.042
C. cassideasimilis110.060.380.010 ± 0.20220.020.170.004 ± 0.084
O. misella110.060.380.010 ± 0.20610.010.170.002 ± 0.042
Oplitis sp.90.050.380.009 ± 0.17120.020.350.004 ± 0.059
U. pannonica90.050.570.009 ± 0.14180.080.690.014 ± 0.222
D. modesta80.040.470.008 ± 0.115
O. obscurasimilis70.040.570.007 ± 0.092220.231.040.039 ± 0.645
P. tuberosa60.030.190.006 ± 0.157
T. coccinea60.030.190.006 ± 0.138
O. kargi40.020.190.004 ± 0.097
P. rackei40.020.280.004 ± 0.07510.010.170.002 ± 0.042
C. rafalskii30.020.190.003 ± 0.06930.030.170.005 ± 0.126
T. irenae30.020.190.003 ± 0.069310.330.870.055 ± 0.793
T. minima30.020.090.003 ± 0.09210.010.170.002 ± 0.042
N. breviunguiculata20.010.190.002 ± 0.04320.020.350.004 ± 0.059
T. lamda20.010.190.002 ± 0.04370.070.170.012 ± 0.294
A. flagelliger10.010.090.001 ± 0.031
C. erlangensis10.010.090.001 ± 0.031
D. cordieri10.010.090.001 ± 0.03170.070.350.012 ± 0.256
O. alophora10.010.090.001 ± 0.03180.080.520.014 ± 0.23
P. calcarata10.010.090.001 ± 0.03120.020.170.004 ± 0.084
U. stammeri10.010.090.001 ± 0.031
U. paradoxa10.010.090.001 ± 0.03120.020.350.004 ± 0.059
P. schweizeri 10.010.170.002 ± 0.042
T. montana 10.010.170.002 ± 0.042
Total19,681100.0064.1818.549 ± 52.2629463100.0064.7116.372 ± 36.067
Table 2. Habitat preferences of five Uropodina species for certain tree species (statistically significant preferences in bold).
SpeciesBeechBirchOakHornbeamPineSprucePearson Χ2 Statisticp-Value
P. pulchella−0.4011.118−3.4180.3585.259−2.84558.9086<0.001
O. minima−1.995−0.327−1.1121.7544.114−3.26297.1116<0.001
O. ovalis−0.268−0.5520.8060.7470.929−2.68513.3092<0.025
T. aegrota0.113−0.079−1.286−0.3210.2891.9964.9874>0.05
U. tecta−0.1130.737−0.175−0.149−1.6022.3637.5201>0.05
Publisher’s Note: MDPI stays neutral with regard to jurisdictional claims in published maps and institutional affiliations.

