Article

Highly Productive Tropical Seagrass Beds Support Diverse Consumers and a Large Organic Carbon Pool in the Sediments

1
Innovation and Development Center of Sustainable Agriculture, Department of Life Sciences, National Chung Hsing University, Taichung 402, Taiwan
2
Graduate Institute of Marine Biology, National Dong Hwa University, Pingtung 944, Taiwan
3
Institute of Marine Biology, National Taiwan Ocean University, Keelung 202, Taiwan
*
Author to whom correspondence should be addressed.
Diversity 2021, 13(11), 544; https://doi.org/10.3390/d13110544
Submission received: 22 September 2021 / Revised: 26 October 2021 / Accepted: 27 October 2021 / Published: 28 October 2021
(This article belongs to the Collection Feature Papers in Animal Diversity)

Abstract

:
Tropical seagrass beds are productive coastal ecosystems that are important blue carbon sinks and crucial habitats and feeding grounds for consumers at high trophic levels. To understand how energy sustains the ecosystem from seagrass production, we constructed an Ecopath trophic model to reveal the possible pathways of energy flow in the tropical seagrass beds around Dongsha Island, South China Sea. The model indicates that Dongsha seagrass beds were developing but well-structured ecosystems. The productive seagrasses were rarely directly consumed by herbivores and, ultimately, flowed into detrital pools. Detritus was the main food source used to support diverse consumers in the food web. Nevertheless, the low cycling rate (2.74%) suggests that most detritus was not reused or exported and was stored as a large organic carbon pool in the sediments. The detritus-feeding invertebrates are keystone groups in the Dongsha seagrass beds, as they recycle energy from detritus and transfer to top predators such as sharks. The predation of top predators affected the biomasses of other compartments, leading to strong top-down control via a trophic cascade effect.

Graphical Abstract

1. Introduction

Tropical seagrass beds may serve many ecological functions. High primary production can fix a large amount of CO2 into their biomass [1,2]. They can provide a major source of organic matter in coastal areas after littering [3,4]. They are also recognized as crucial habitats or nursery grounds for marine animals [5,6]. Tropical seagrass beds can also support abundant and diverse resources for coastal fisheries [5,7]. However, the structure and functioning of tropical seagrass beds remain unclear.
Seagrass beds generally harbor abundant and diverse fauna, from benthic invertebrates to large animals such as sea turtles, dugongs, and sharks. Nevertheless, few seagrass tissues are directly consumed by herbivores [8,9]. Most seagrass production becomes detritus [10,11]. Detrital decomposition is often affected by environmental factors, canopy structure, and decomposers [12]. As a result, the consumption and recycling rates of seagrass production are highly variable in different seagrass beds.
Large areas of seagrass beds are the main seascape at the Dongsha Island, South China Sea. Because of isolation and military restriction, low human impact and less fishery pressure, Dongsha Island still has rather pristine seagrass beds and coral reefs. Coral reefs and seagrass beds are often mixed in the shallow waters around Dongsha Island, forming highly complex habitats [13]. Previous studies indicated high primary production as well as high biodiversity in the seagrass beds of Dongsha Island [13,14,15,16]. However, the energy flows of seagrass production within this tropical atoll remain unclear. How does massive seagrass production lead to high faunal diversity within the food web around Dongsha Island? Because of the complex pathways of energy flow within the seagrass beds, it is necessary to view the whole seagrass beds with a holistic scale when conferring ecosystem structure and functioning.
Modeling is a useful tool for understanding the structure and function, representing the knowledge gap, and testing hypotheses within the ecosystem [17]. Modeling can also characterize ecosystem structure and function by comparison with other ecosystem models [18,19]. Understanding this information is helpful for resource management, conservation, and restoration. The pristine condition of Dongsha Island is suitable for a reference or baseline goal of tropical seagrass beds. In this study, we aim to understand the trophic structure and function of Dongsha seagrass beds by constructing an Ecopath trophic model. The purposes are: (1) to understand the trophic structure and energy flows in Dongsha seagrass beds, (2) to determine the keystone groups, and (3) to determine the trophic role of each functional group within the seagrass ecosystems.

2. Material and Methods

2.1. Study Site

Dongsha Island, also called Pratas Island (20°43′ N; 116°42′ E), is situated on the western side of a coral atoll in the South China Sea (Figure 1). The area of this coral island is approximately 1.74 km2. There is little freshwater flow into the sea from the island. A semienclosed lagoon (0.64 km2) occupies the central part of the island. An open inlet located on the western side of the island is the only channel that permits seawater exchange between the lagoon and the open ocean, and the rate of water exchange is dependent upon the tidal cycle (tidal ranges: 0.85 ± 0.21 m). The modeling area covers 11.85 km2, mainly seagrass beds around Dongsha Island (including the lagoon). The water depth is mostly shallower than 8 m. Seagrass beds extend from the intertidal to the subtidal zones around the entire island. There are seven seagrass species at Dongsha Island [20], including Thalassia hemprichii, Halophila ovalis, Cymodocea rotundata, C. serrulata, Halodule uninervis, Syringodium isoetifolium, and Thalassodentron ciliatum. The coverage of seagrass beds was mostly >75% around the island. There were approximately 20 coral species around Dongsha, mostly reef-building corals. Some massive Porites corals are associated with merulinid and Acropora corals mixed in the seascape. Although Dongsha Island is dominated by a tropical climate and water temperatures around the island average 27.6 °C, the intense northeast monsoons from October to early March can markedly reduce the water temperature to 19 °C.

2.2. Ecopath Modeling

The Ecopath trophic model of seagrass beds around Dongsha Island was constructed by the Ecopath with Ecosim 6.3 (EwE) software system [21,22] to quantify organic matter flows within the food web. The basic concept of the Ecopath model is mass balancing within the system. The parameterization of the Ecopath model is based on the two main equations. First, for each compartment (i), a mass-balanced budget can be expressed as (1):
Production = catch + predation + net migration + biomass accumulation + other mortality
Pi − Bi × M2i − Pi (1 − EEi) − EXi − ACi = 0
where Pi is the production of i, B i is the biomass of i, M2i is the predation mortality of i, EEi is the ecotrophic efficiency (EE) of i (i.e., the part of the production that passes up the trophic level, used for biomass accumulation or export), 1 − EE i is ‘‘other mortality”, EXi is the portion of i exported to other systems through sedimentation or fishery activities, and ACi is the accumulation of i during the study period. EE value ranges from 0 to 1. The higher value indicates that this trophic group was highly consumed by other consumers within the system.
Second, the consumption of a predator compartment (j) can be expressed as Equation (2):
Consumption = production + respiration + unassimilated food
Σj Bj × (Qj/Bj) = Pj + Rj + UNj
where j is a consumer species, (Qj/Bj) is the consumption:biomass ratio of consumer j, Pj is the production of j, Rj is the respiration of j, and UNj is the unused consumption of j.
Finally, the main equation of the Ecopath model can be integrated as (3) [22]:
Bi × (Pi/Bi) × EEi − ΣjBj × (Qj/Bj) × DCji − EXi − ACi = 0
where Pi/Bi is the production:biomass ratio of i, Qj/Bj is the consumption:biomass ratio of predator j, and DCji is the fraction of prey i in the average diet of predator j. The diet composition was assumed to remain stable, with nonsignificant biomass accumulation during the study period.
In the Ecopath model, some of the parameters do not have to be entered since the Ecopath model links the production of each compartment with the consumption of all the other compartments and uses the linkages to estimate missing parameters. DC and EX must always be entered, while the entry of one of any of the other four parameters (B, P/B, Q/B, and EE) is optional [21,22].

2.3. Model Compartment Sampling

Data for the Ecopath model were obtained from various research studies around Dongsha Island from 2009 to 2012 [14,15]. Five study sites were established for long-term monitoring stations during the study period. Three of the five sites were located along the gradient of seawater exchange from the inner to the inlet of the lagoon. The other two sites were located on the northern and southern coast of Dongsha Island. Most organisms collected from seagrass beds were quantified and classified into 24 functional compartments by their trophic or habitat characteristics in the Ecopath model (Table 1 and Table 2).

2.3.1. Fish (Compartments 1–10)

Fish were surveyed bimonthly during the daytime by underwater visual censuses at each station. Our surveys were carried out among different habitats and tidal periods within each station to understand the dynamics of fish assemblages. Fish species, individual numbers, and body lengths (TL) were recorded. All fish species were identified and classified into 10 fish compartments according to previous studies [13,15,16] or information from Fishbase [23]. The fish species are pelagic shark (Galeocerdo cuvier and Carcharhinus limbatus), lemon shark (Negaprion acutidens), ray (Aetobatus ocellatus, Pateobatis fai, and Taeniurops meyeni), apex-piscivore fish (25 species, including carangids, epinephelinaes, and sphyraenids), large carnivore fish (52 species, including lethrinids, lutjanids, and haemulids), small carnivorous fish (89 species), omnivorous fish (53 species), detritivorous fish (5 species, mostly mugilids and Chanos chanos), seagrass herbivorous fish (3 species: mostly Leptoscarus vaigiensis and Hemiramphus far) and algae herbivorous fish (17 species, including acanthurids, scarids, and siganids). Fish biomass in terms of wet weight (WW) was calculated by length-weight empirical equations. P/B and Q/B values of fish were estimated using the empirical equations of [24] and [25,26], respectively.
The diet of each fish compartment was derived from the weighted average of the diet composition of different species within each compartment. Most diet composition was based on stomach content analysis in Dongsha seagrass beds [14,15,16]. Some fish species without local diet information were referred from Fishbase [23]. Many subadult lemon sharks and stingrays had traumatic bite scars of other sharks on their bodies, so we set parts of sharks and rays as the food sources of lemon sharks and pelagic sharks.

2.3.2. Sea Turtle (Compartments 11–12)

Green turtles (Chelonia mydas) and hawksbill turtles (Eretmochelys imbricata) are the only two sea turtle species at Dongsha. Their densities were relatively low according to reef surveys around the island. Biomass data were recorded from the wildlife medical station of Dongsha Marine National Park Headquarters. Other parameters, such as P/B, Q/B and diet, were referred from previous studies [27,28,29,30,31]. Seagrass is the main food item for the green turtle. However, we observed green turtles feeding on Cassiopea Andromeda in the seagrass beds, so we set Cnidarians as a small part of their diet composition.

2.3.3. Macroinvertebrates (Compartments 13–18)

Macroinvertebrates (e.g., decapods, mollusks, and echinideas) were recorded by the same underwater visual censuses as fish bimonthly. For collecting infauna and smaller invertebrates (e.g., polychaetes, amphipods, and Tanaidaceas), we used a stainless-steel corer (diameter = 7.5 cm) at a depth of 10 cm of the sediments randomly for 15 replicates within each site. All samples were sorted, narcotized using magnesium chloride or menthol, and fixed in 5% formalin for identification, weighing and recording. We classified all macroinvertebrates into eight functional compartments according to their trophic functions: large crustaceans, small crustaceans, cephalopods, urchins, carnivorous invertebrates, omnivorous invertebrates, filter invertebrates, and herbivorous invertebrates.
The production of invertebrates was calculated from biomass and abundance data by equations [32,33] except the production of cephalopods (mostly Sepioteuthis lessoniana) which referred to [34]. The total P/B of each invertebrate compartment was calculated by the weighted average of the relative abundance of species within each compartment. The Q/B value of invertebrate compartments was estimated on the basis of gross alimentary conversion efficiency (P/Q) as 0.2 [35].
The diets of decapods, cephalopods, and urchins were analyzed during the study period. The cephalopods fed on many pelagic invertebrates that were not found around our study sites. Hence, we set some of their food sources from imports from outside ecosystems. The diets of other invertebrates referred to other inshore reef Ecopath models [19,36].

2.3.4. Cnidarians (Compartment 19)

The most common cnidarians were upside down jellyfish (Cassiopea andromeda) and swimming sea anemones (Boloceroides mcmurrichi) in the seagrass beds. Their biomass and P/B values were estimated to be similar to those values of invertebrate compartments as described above. In terms of corals, the biomass of the main species (Acropora spp. and Porites spp.) was recorded as the tissue extraction method following [19]. The total P/B value of cnidarians was calculated by the weighted average of the corals as 1.09, referring to the jellyfish and sea anemones of the Caribbean coral reef model [36]. The Q/B value of cnidarians was estimated following the method of invertebrate compartments.
Most cnidarians in shallow waters are both primary producers and consumers. We assumed that 60% of the energy of cnidarians was from zooxanthellae or imported from outside, and the other 33% and 6% were from detritus and feeding invertebrates, respectively [19].

2.3.5. Zooplankton (Compartment 20)

Zooplankton samples were collected by towing double Bongo nets (45 cm in diameter with mesh size 330 μm) below the seawater surface bimonthly. Samples were identified, and the density was counted. The dry biomass of zooplankton was estimated by the length-weight relationship of dominant species using the empirical equation of [37]. The P/B and Q/B values of zooplankton were derived from the values in the South China Sea model [38]. The diet of zooplankton was mostly imported from outside since the concentrations of dissolved organic matter (DOM), particulate organic matter (POM), and phytoplankton were relatively low in our Ecopath model.

2.3.6. Primary Producers (Compartments 21–23)

Seagrass and macroalgae were sampled from the surveys of three permanent 50 m transects at each station bimonthly. All transects were parallel and separated from each other by at least 5 m. Five replicate 10 cm × 10 cm quadrats were randomly deployed along each transect to collect seagrass or macroalgal biomass. Seagrass leaf production was quantified bimonthly by the leaf marking method [39]. The production of macroalgae was recorded by the changes in dissolved O2 concentrations in the BOD incubations of dominant species. The detrital export of seagrass and macroalgae was set as 10% according to previous studies [12].
The biomass of microalgae and phytoplankton was estimated by measuring chlorophyll a concentration [40]. Water samples in triplicate from each station were filtered through Whatman GF/F filters in the field. The filters were then extracted in 90% acetone for 24 h at 4 °C in the dark. Phytoplankton production referred to [41] by the in situ 14C assimilation method. The benthic microalgae were collected randomly from the sediments and seagrass leaves at each station. The production of benthic microalgae was measured seasonally by the closed-chamber CO2 flux method [42,43].

2.3.7. Detritus (Compartment 24)

Detritus comprises the organic matter in the water column and sediments. Dissolved and particulate organic matter was analyzed by the methods of [44,45] bimonthly. Phytoplankton biomass was subtracted from the detrital mass by calculating the sum of chlorophyll a and pheophytin in the water column assuming a carbon:pigment ratio of 35:1 [46]. Detritus in the sediments was collected by using a 7.5-cm diameter core tube in three replicates at a depth of 10 cm at each station. Samples were dried in an oven at 60 °C for 24 h and then ground to a powder for organic matter analysis. The export of detritus was set as 10%, according to previous studies [12].

2.4. Model Balancing and Verification

The first step was to check whether all the EE values of compartments were >1.0. The model assumes that any compartment cannot be consumed in excess of its production. To correct compartments with EE >1.0, we adjusted some input data for balancing. In our model, the biomass and P/B values were derived mostly from locally reliable data. However, the Q/B and diet of most invertebrates referred to other literature and were considered less reliable in our model. Hence, we gradually adjusted the Q/B or diet composition individually for balancing. Most of the changes were small and remained within 20% of the input values. The second step was to check if the GE (the gross food conversion efficiency, e.g., the production and consumption ratio) was in the range of 0.1–0.3, as the production of most compartments is approximately 10–30% of the consumption. In addition, the P/Q ratio cannot be higher than the net efficiency (the ratio between production and assimilated food).
The sensitivity routine [47] (in EwE 5.8) was used to check the effect each input parameter had on all of the ‘‘estimated” parameters for each compartment in the model by varying all basic input parameters in steps from −50% to +50% changes. Sensitivity analysis was performed on all input parameters of our final model. An increase of 30% in the biomass or P/B value of a group would result in a decrease of approximately 24% in its own estimated EE value and an increase of approximately 13% in the EE values of its prey groups. A 30% increase in Q/B would result in only an approximate 4% increase in the estimated EE values of its prey groups, suggesting that the biomass and P/B values were more sensitive in determining the EE values in our model and that our model was reliable, as the biomass and P/B values were derived mostly from locally reliable data.

2.5. Ecosystem Parameter Analysis

The balanced model shows the trophic level (TL), ecotrophic efficiency (EE), and omnivory index of each trophic group. All primary producers and detritus belonged to trophic level 1. The predatory groups had higher trophic levels than the herbivore or detritus feeding groups. The omnivory index shows the variety of food intake (a value between 0 and 1). A higher value represents a wide diet breadth of food sources.
The details of trophic transfer in the Dongsha seagrass bed model were revealed by ecological network analysis [48,49]. Network analysis shows trophic structure and path-way routes [49,50]. Network analysis is also a tool for comparative analyses with other ecosystems [51] that can be used to characterize the trophic structure and function of our seagrass bed model (Table 3). The total system throughput (TST) represents the size of an ecosystem in terms of flows [48]. TST is the sum of consumption, exports, respiratory flows, and flows into detritus and is indexed in terms of how much matter the system processes. The total biomass/TST ratio (B/TST) represents the amount of biomass necessary to maintain one unit of flow. B/TST is expected to increase along with ecosystem maturity [52]. The net primary production/respiration (P/R) ratio and the net primary production/total biomass (P/B) ratio were used to describe how mature the Dongsha model was. The cycling of matter is considered a critical process in the functioning of natural ecosystems, as it can facilitate homeostatic control over the magnitude of flows [52]. The Finn cycling index (FCI) [53] was used to reveal the relative importance of cycling to the TST in the Dongsha model. The detritivory/herbivory (D/H) ratio is a measure of the relative importance of detritivory flows in the system. The ascendency was used to reveal the development of the system from the TST [48,54]. Lindeman trophic analysis [53] summarized complicated food webs in terms of a single linear food chain. The trophic transfer efficiency (TE) from one aggregated trophic level to the next can be calculated as the fraction of the input of organic matter to a given level that was transferred to the next higher level.
The keystone index and relative total impact were also used to reveal the trophic influence of each compartment within the food web [55]. A compartment with an impact on more other compartments would have a higher relative total impact value. The mixed trophic impact (MTI) [56] was used to assess the effects that changes in the biomass of a compartment would have on the biomass of other compartments by trophic relationship. As a result, the MTI can be regarded as a form of sensitivity analysis for the input parameters of the model.

3. Result

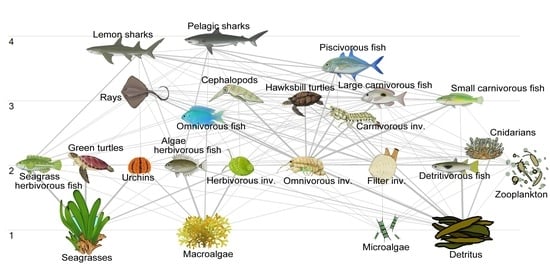
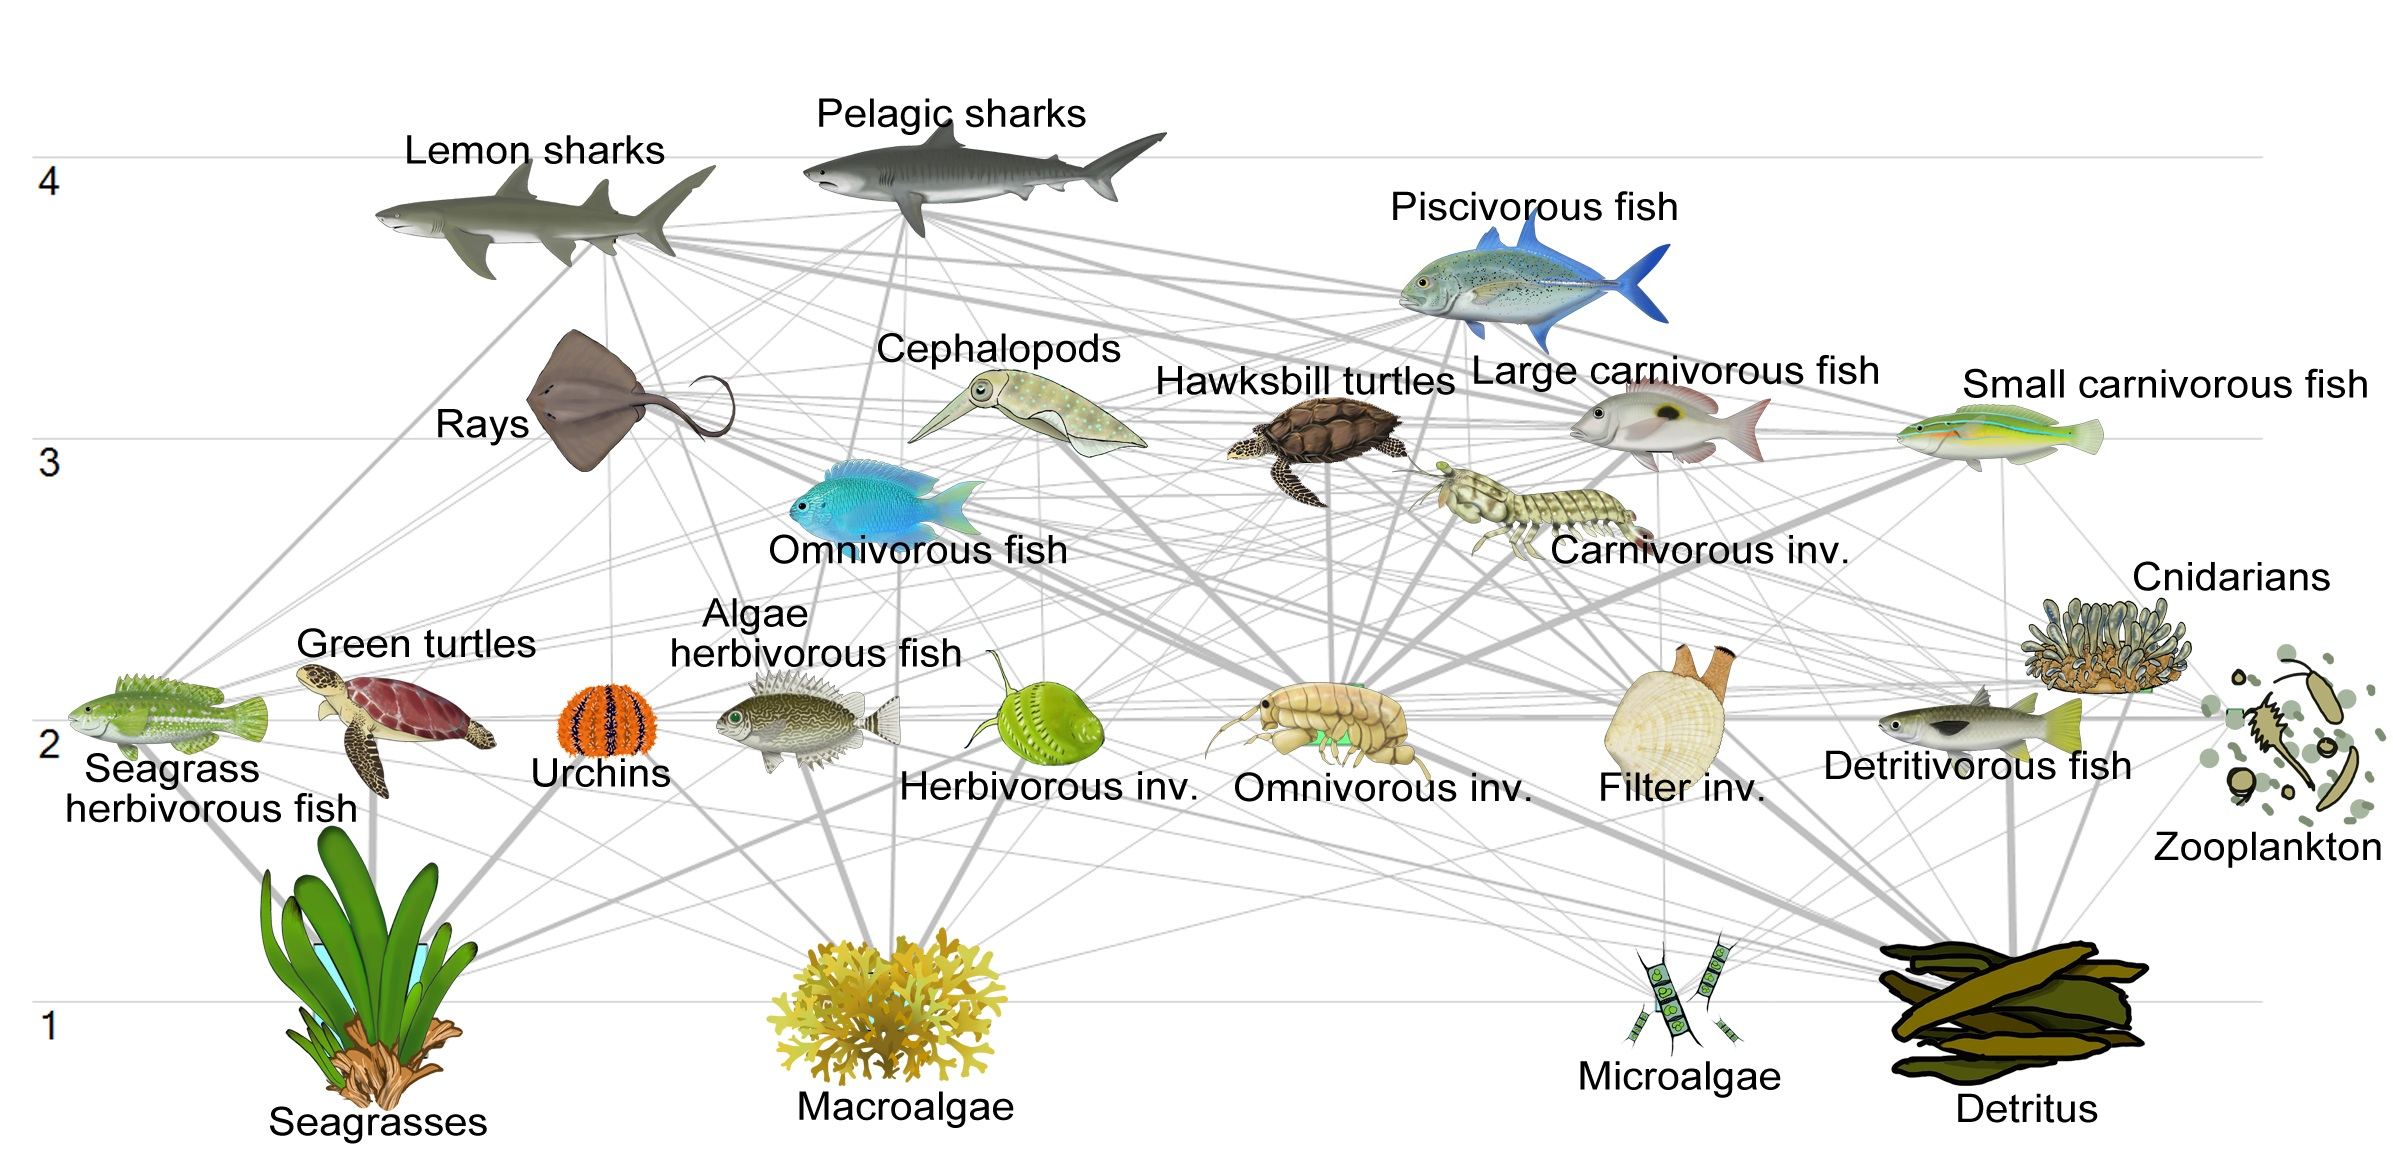
3.1. Trophic Flows and Networks

The trophic flow diagram shows that there were four trophic levels (TLs, hereafter), and energy flowed from TL 1 primary producers (seagrass, macroalgae, and microalgae) and detritus to TL 3.82 top predators (pelagic sharks) (Figure 2). The total living biomass of our model was 2295.27 g WW m−2 yr−1. Seagrasses comprised 79.36% of the total biomass since they were the main seascape in our model. The production of seagrass contributed 21.37% to the total production. The ecotrophic efficiency (EE) values of microalgae and macroalgae were 0.16 and 0.70, respectively, while the EE value of seagrasses was lower than 0.01. This result suggests that most seagrass production was not used by herbivores and, ultimately, flowed into the detrital pathway at Dongsha (Table 1).
Most invertebrate groups were distributed in TLs 2 and 3. Their omnivory indices were mostly <0.2, indicating their narrow diet breadth. Omnivorous invertebrates (TL: 2.02), filter invertebrates (TL: 2.01), cephalopods (TL: 2.97), and zooplankton (TL: 2.01) had rather high EE values (0.47, 0.82, 0.48, and 0.81, respectively) among all invertebrate groups. In terms of fish groups, pelagic sharks (TL: 3.82), lemon sharks (TL: 3.74), and piscivorous fish (TL: 3.49) were the top predators in our model. Their omnivory indices ranged from 0.25–0.37 since they consumed a variety of trophic groups in our model.
Total system throughput (TST) of Dongsha seagrass system was 158543 g WW m−2 yr−1. The low B/TST (0.02) and high P/B (30.99) ratios revealed the development status of the Dongsha seagrass ecosystems. The ascendency of 57%, however, represented that the food web of Dongsha seagrass beds was well-structured. The Finn cycling index (FCI) value shows that all cycled flows accounted for only 2.74% of the TST. The Dongsha seagrass bed model was an autotrophic system since the net primary production/respiration ratio (P/R) was 8.59.
The Lindeman trophic analysis reveals the TST in a food chain with seven integrated trophic levels (Figure 3). More organic matter flows were derived from detritus than primary production in our model. The detritivory/herbivory (D/H) ratio (1.23) also indicates that more energy was derived from detritus. The geometric mean trophic transfer efficiencies (TE) of the food chain were 5.76%. The highest TE was at trophic level II (8.42%). The TE then decreased gradually at higher trophic levels.

3.2. Keystone Species and Mixed Trophic Impacts

Keystone indices show that omnivorous invertebrates, filter invertebrates, piscivorous fish, lemon sharks, and pelagic sharks were the top five keystone groups in our model (Table 1). They had positive keystone indices and high relative total impact values (>0.75). Both the omnivorous and filter invertebrate groups fed mainly on detritus. They were also the main food sources of many other trophic groups. Their high ecotrophic efficiency (EE) values represent the high consumption proportions by other compartments in our model. The top predator groups, including pelagic sharks, lemon sharks, and piscivorous fish, affected a variety of trophic groups by their predation. Piscivorous fish had the top keystone index (0.13) and relative total impact values (1.00) among all trophic groups, indicating that their predation would affect all trophic groups in our model.
MTI analysis (Figure 4) shows that an increase in the biomass of omnivorous and filter invertebrates would have large effects on many predator and prey compartments. Since they recycled detrital food sources and were then consumed by many fish compartments, they became the most influential invertebrates in seagrass beds. A significant trophic cascade can be found in pelagic sharks, lemon sharks, and piscivorous fish. Increasing the biomass of piscivorous fish would have negative effects on other fish groups, leading to large positive effects on a variety of lower TL invertebrates. Lemon sharks had a great negative effect on piscivorous fish but had positive effects on other fish groups and filter invertebrates. Pelagic sharks had negative effects on most fish groups and two sea turtles but had a positive effect on piscivorous fish.
Increasing seagrass biomass would have positive effects on seagrass-herbivorous fish, green turtles, urchins, and herbivorous invertebrates. An increase in biomass in macroalgae and detritus would have great positive effects on the biomass of most fish and invertebrate compartments, which indicates that macroalgae and detritus were the main food sources for most primary consumers. An increase in detrital mass would also have negative effects on zooplankton and microalgae because detritus often accompanies these two compartments in the diets of many consumers. However, the large flows into detrital mass show that detritus was little affected by changes in the biomass of other compartments.

4. Discussion

In our model, the low ecotrophic efficiency (EE) value of seagrasses indicated that most of their production flowed into detritus. Unlike algae, seagrasses are considered a poor-quality food source because their cellulose-rich leaves are difficult to digest for most herbivores [8,9]. Only parrotfish, sea urchins, and some mesograzers (e.g., isopods and nerites snail) can directly consume seagrasses at Dongsha [57]. Seagrasses are often represented as “macrophytes” or “benthic autotrophs” by combining with macroalgae in many other trophic models. However, the nutrient content, cellulose shoot, and palatability of seagrasses are distinctly different from those of most macroalgae. Similar to our findings of the seagrass beds around Dongsha Island, stable isotope analysis also showed that macroalgae were generally the main food sources of herbivores in other tropical seagrass ecosystems [58,59,60]. For better resolution of production, consumption, and energy flows, we suggest distinguishing seagrasses and macroalgae as different compartments of primary producers when constructing trophic models of seagrass beds.
High seagrass production and a large amount of unconsumed detritus lead to high total system throughput (TST) and detrital pathways in the Dongsha seagrass bed model. The high P/B and P/R values reveal a rather low level of consumers relative to primary production, also suggesting that Dongsha seagrass beds may harbor more available trophic space for additional consumers in seagrass ecosystems. The detritivory/herbivory (D/H) ratio also reveals that more energy utilized was derived from detritus rather than primary production. Detritus recycling is a common energy route in coastal systems [18,61,62,63]. However, the FCI value in our model indicates that only 2.74% of the energy is recycled in our system. Although many detritus-feeding animals reused detritus, the seagrasses still produced overwhelming amounts of detritus in our model. In addition, a previous study indicated that seagrass detritus exported only approximately 10% of its mass at Dongsha [12]. As a result, a large part of unconsumed seagrass detritus would be buried in the organic carbon pool of the sediments. On the coastline around Dongsha Island, a large number of detrital layers have accumulated on the sediments of the intertidal zone, similar to seagrass detritus layers in the Mediterranean Sea [64,65]. The detritus layers in the inner lagoon and west inlet of Dongsha Island can reach over 1 m in depth due to the high water residence time in these regions. The detritus may become part of the carbon sink in the sediments. The vast seagrass beds around Dongsha Island are estimated to accumulate 11,367 tons of carbon per year [12,14]. The high detrital production and low recycling make tropical seagrass beds ideal blue carbon sinks in the atoll.
Detritus feeding consumers, including omnivorous invertebrates and filter invertebrates, play critical roles in the Dongsha seagrass beds. These consumers, including deposit-feeding crustaceans, polychaetes, and mollusks, feed mostly on benthic detritus. These invertebrate biomasses become secondary production, as they were also crucial food sources for the predators in our model. Previous studies have indicated that many benthic invertebrates play indispensable roles as they reuse detritus within food webs [66,67,68]. Moreover, we found a higher transfer efficiency (TE) in TL II (8.42%) than in TL I (4.11%) because most consumers in our models are carnivorous fish. They feed mostly on these secondary consumers, which links the detrital energy source to higher trophic levels. Similar higher TEs at secondary consumer levels can be observed in other tropical coastal ecosystems that also use more detrital food sources [69,70]. In the Dongsha seagrass beds, these invertebrates became an important key link, transferring energy from recycled detritus to consumers at higher trophic levels. Consequently, our results suggest that detritus-feeding invertebrates controlled the main trophic flows in tropical seagrass beds.
In addition to detritus-feeding invertebrates, piscivorous fish, lemon sharks, and pelagic sharks were also the keystone groups in the Dongsha seagrass ecosystems. Large predatory fish affected other compartments by predation, leading to strong top-down control via trophic cascade effects. Top-down control by top predators can reduce competition, differentiate resources, and enhance biodiversity within the system [71,72]. Carangids and sphyraenids were the dominant piscivorous fish in the Dongsha seagrass beds. They frequently rove above seagrass meadows and hunt for small fish. They themselves were also important food sources for sharks. These predations suggest that piscivorous fish can also transfer energy to the groups of top predators in the Dongsha seagrass beds.
Seagrass beds also support food sources for many elasmobranches (e.g., sharks and rays) at Dongsha (Table 4). Indeed, previous studies pointed out that shallow seagrass beds are crucial habitats for many sharks and rays in coastal waters. Pink whip rays (Pateobatis fai) and ocellated eagle rays (Aetobatus ocellatus) are common ray species in the Dongsha seagrass beds. They enter shallow seagrass beds and consume burrowed crustaceans and mollusks during flood tide [73]. Lemon sharks were the most common elasmobranches at Dongsha. They use seagrass beds as their nursery habitats and feeding grounds [16]. Most individuals present in the Dongsha seagrass beds are in young years or 1–2 years of age sharks (body-length range: 60–200 cm in total length). The same genus species, Negaprion brevirostris, from the Atlantic Ocean shows an ecological niche similar to our results. They also use shallow seagrass beds as their juvenile habitats and foraging grounds [74,75]. Large pelagic sharks had rather lower densities than rays and lemon sharks. Black tip shark Carcharhinus limbatus, which is found mostly in reef areas, sometimes enters subtidal seagrass beds, especially on the northern and southern coasts of Dongsha. They frequently enter seagrass beds for night-time foraging grounds in the Atlantic Ocean [75,76]. Few tiger sharks (Galeocerdo cuvier) were recorded in the Dongsha seagrass beds. Their young also use shallow seagrass beds for both nursery and foraging grounds [77,78]. The occurrence of these young apex predators suggests that the productive seagrass beds around Dongsha can not only be feeding grounds for consumers at high trophic levels but may also become potential nursery grounds for top predators.
Seagrass beds have been known to provide valuable ecosystem services to humankind [79]. Tropical seagrass beds are highly productive [1] and can efficiently sequester large quantities of CO2 [12,80]. Unfortunately, seagrass beds are in decline worldwide due predominantly to anthropogenic activity, such as coastal development and seawater pollution [81]. While seagrasses were often a small part of vegetation in other coastal trophic models [19], seagrass beds are the main seascape around Dongsha Island. Our Ecopath model shows the structure and function of pristine tropical seagrass beds around Dongsha Island. This Dongsha seagrass bed model can be used as a reference or baseline goal of tropical seagrass beds when comparing with other impacted seagrass ecosystems.

5. Conclusions

In summary, the seagrass beds around Dongsha were developing but well-structured ecosystems. Most seagrass production flowed into detrital pathways, and part of the detritus became the main food source as secondary production (detritus feeding invertebrates) in the seagrass ecosystem. Dongsha seagrass beds support diverse consumers, including predatory elasmobranchs. Nevertheless, the high production and low cycling rate of seagrass detritus would ultimately become a large organic carbon pool in the sediments.

Author Contributions

C.-L.L. contributed to the main design and idea of this study and verified the analytical methods. C.-L.L. and W.-J.L. carried out the field work and sampling quantification. Shao, K.-T.S. provided faunal data from the coral reefs at Dongsha. C.-L.L. and P.-J.L. completed the main framework of the Ecopath model. H.-J.L. took the lead of the Dongsha research project, applied the funding, and supervised this work. C.-L.L. and H.-J.L. wrote the manuscript. All authors have read and agreed to the published version of the manuscript.

Funding

This study was financially supported and permitted by Marine National Park Headquarters, Kaohsiung, Taiwan (Grant No. 98415) and the “Innovation and Development Center of Sustainable Agriculture” from the Featured Areas Research Center Program within the Higher Education Sprout Project by the Ministry of Education (MOE) of Taiwan.

Institutional Review Board Statement

Not applicable.

Informed Consent Statement

Not applicable.

Data Availability Statement

The data presented in this study are available on request from the corresponding author.

Acknowledgments

We gratefully thank Yen-Hsun Huang, Hui-Yuan Cheng, Chia-Yun Chung, Xiao-Xun Dai, and Jun-Ming Yei for field assistance, and Yu-Yun Chen for precious field data about sharks and rays. We sincerely thank the staff of Dongsha Marine National Park Headquarters for assistance in field surveys and providing local data.

Conflicts of Interest

The authors declare no conflict of interest.

References

  1. Duarte, C.M.; Chiscano, C.L. Seagrass biomass and production: A reassessment. Aquat. Bot. 1999, 65, 159–174. [Google Scholar] [CrossRef]
  2. Duarte, C.M.; Marbà, N.; Gacia, E.; Fourqurean, J.; Beggins, J.; Barrón, C.; Apostolaki, E. Seagrass community metabolism: Assessing the carbon sink capacity of seagrass meadows. Glob. Biogeochem. Cycles 2010, 24. [Google Scholar] [CrossRef] [Green Version]
  3. Jernakoff, P.; Nielsen, J. Plant-animal associations in two species of seagrasses in Western Australia. Aquat. Bot. 1998, 60, 359–376. [Google Scholar] [CrossRef]
  4. Hyndes, G.A.; Lavery, P.S. Does transported seagrass provide an important trophic link in unvegetated, nearshore areas? Estuar. Coast. Shelf Sci. 2005, 63, 633–643. [Google Scholar] [CrossRef]
  5. Parrish, J. Fish communities of interacting shallow-water habitats in tropical oceanic regions. Mar. Ecol. Prog. Ser. 1989, 58, 143–160. [Google Scholar] [CrossRef]
  6. Duffy, J. Biodiversity and the functioning of seagrass ecosystems. Mar. Ecol. Prog. Ser. 2006, 311, 233–250. [Google Scholar] [CrossRef] [Green Version]
  7. Anderson, E.E. Economic Benefits of Habitat Restoration: Seagrass and the Virginia Hard-Shell Blue Crab Fishery. N. Am. J. Fish. Manag. 1989, 9, 140–149. [Google Scholar] [CrossRef]
  8. Thayer, G.W.; Bjorndal, K.; Ogden, J.C.; Williams, S.L.; Zieman, J.C. Role of Larger Herbivores in Seagrass Communities. Estuaries 1984, 7, 351–376. [Google Scholar] [CrossRef]
  9. Duarte, C.M. Seagrass nutrient content. Mar. Ecol. Prog. Ser. 1990, 67, 201–207. [Google Scholar] [CrossRef]
  10. Cebrian, J. Variability and control of carbon consumption, export, and accumulation in marine communities. Limnol. Oceanogr. 2002, 47, 11–22. [Google Scholar] [CrossRef] [Green Version]
  11. Mateo, M.; Cebrián, J.; Dunton, K.; Mutchler, T. Carbon flux in seagrass ecosystems. In Seagrasses: Biology, Ecology, and Conservation; Larkum, A.W., Orth, R.J., Duarte, C., Eds.; Springer: Dordrecht, The Netherlands, 2006; pp. 159–192. [Google Scholar]
  12. Huang, Y.-H.; Lee, C.-L.; Chung, C.-Y.; Hsiao, S.-C.; Lin, H.-J. Carbon budgets of multispecies seagrass beds at Dongsha Island in the South China Sea. Mar. Environ. Res. 2015, 106, 92–102. [Google Scholar] [CrossRef]
  13. Lee, C.-L.; Wen, C.K.; Huang, Y.-H.; Chung, C.-Y.; Lin, H.-J. Ontogenetic Habitat Usage of Juvenile Carnivorous Fish Among Seagrass-Coral Mosaic Habitats. Diversity 2019, 11, 25. [Google Scholar] [CrossRef] [Green Version]
  14. Lin, H.J.; Hsiao, S.C. Phenology and Production of Seagrass and Macroalgae of Dongsha Island; Research Report; Marine National Park Headquarters: Kaohsiung, Taiwan, 2010.
  15. Lin, H.J.; Hsiao, S.C. Biota Researches and Keystone Assessment of Dongsha Island; Research Report; Marine National Park Headquarters: Kaohsiung, Taiwan, 2011.
  16. Lee, C.-L.; Huang, Y.-H.; Chung, C.-Y.; Lin, H.-J. Tidal variation in fish assemblages and trophic structures in tropical Indo-Pacific seagrass beds. Zool. Stud. 2014, 53, 56. [Google Scholar] [CrossRef] [Green Version]
  17. Jørgensen, S.E.; Chon, T.S.; Recknagel, F. Handbook of Ecological Modelling and Informatics; Wit Press: Southampton, UK, 2009. [Google Scholar]
  18. Lin, H.-J.; Dai, X.-X.; Shao, K.-T.; Su, H.-M.; Lo, W.-T.; Hsieh, H.-L.; Fang, L.-S.; Hung, J.-J. Trophic structure and functioning in a eutrophic and poorly flushed lagoon in southwestern Taiwan. Mar. Environ. Res. 2006, 62, 61–82. [Google Scholar] [CrossRef]
  19. Liu, P.-J.; Shao, K.-T.; Jan, R.-Q.; Fan, T.-Y.; Wong, S.-L.; Hwang, J.-S.; Chen, J.-P.; Chen, C.-C.; Lin, H.-J. A trophic model of fringing coral reefs in Nanwan Bay, southern Taiwan suggests overfishing. Mar. Environ. Res. 2009, 68, 106–117. [Google Scholar] [CrossRef] [Green Version]
  20. Lin, H.J.; Hsieh, L.Y.; Liu, P.J. Seagrasses of Tongsha Island, with descriptions of four new records to Taiwan. Bot. Bull. Acad. Sin. 2005, 46, 163–168. [Google Scholar]
  21. Christensen, V.; Walters, C.J.; Pauly, D.; Forrest, R. Ecopath with Ecosim Version 6: User’s Guide; University of British Columbia, Fisheries Centre: Vancouver, BC, Canada, 2008. [Google Scholar]
  22. Pauly, D.; Christensen, V.; Walters, C. Ecopath, Ecosim, and Ecospace as tools for evaluating ecosystem impact of fisheries. ICES J. Mar. Sci. 2000, 57, 697–706. [Google Scholar] [CrossRef]
  23. Froese, R.; Pauly, D. FishBase. 2012. Available online: www.fishbase.org (accessed on 22 September 2021).
  24. Pauly, D. On the interrelationships between natural mortality, growth parameters, and mean environmental temperature in 175 fish stocks. ICES J. Mar. Sci. 1980, 39, 175–192. [Google Scholar] [CrossRef]
  25. Palomares, M.; Pauly, D. A multiple regression model for prediction the food consumption of Marine Fish populations. Mar. Freshw. Res. 1989, 40, 259–273. [Google Scholar] [CrossRef]
  26. Palomares, M.L.D.; Pauly, D. Predicting food consumption of fish populations as functions of mortality, food type, morphometrics, temperature and salinity. Mar. Freshw. Res. 1998, 49, 447–453. [Google Scholar] [CrossRef]
  27. Wabnitz, C.C.C. Sea Turtle Conservation and Ecosystem-Based Management with a Focus on Green Turtles (Chelonia mydas) and Seagrass Beds. Ph.D. Thesis, University of British Columbia, Vancouver, BC, Canada, 2010. [Google Scholar]
  28. Bjorndal, K.A. Foraging ecology and nutrition of sea turtles. In The Biology of Sea Turtles; Lutz, P.L., Musick, J.A., Eds.; CRC Press: New York, NY, USA, 1997; pp. 199–231. [Google Scholar]
  29. Bjorndal, K.; Bolten, A.; Chaloupka, M. Survival probability estimates for immature green turtles Chelonia mydas in the Bahamas. Mar. Ecol. Prog. Ser. 2003, 252, 273–281. [Google Scholar] [CrossRef] [Green Version]
  30. Crouse, D. Population modeling and implications for Caribbean hawksbill sea turtle management. Chelonian Conserv. Biol. 1999, 3, 185–188. [Google Scholar]
  31. Brand, S.J.; Lanyon, J.M.; Limpus, C.J. Digesta composition and retention times in wild immature green turtles, Chelonia mydas: A preliminary investigation. Mar. Freshw. Res. 1999, 50, 145–147. [Google Scholar] [CrossRef]
  32. Warwick, R.M.; Clark, K.R. Comparing the severity of disturbance: A meta-analysis of marine macrobenthic community data. Mar. Ecol. Prog. Ser. 1993, 92, 221–231. [Google Scholar] [CrossRef]
  33. Arana, H.H.; Warwick, R.; Attrill, M.; Rowden, A.; Gold-Bouchot, G. Assessing the impact of oil-related activities on benthic macroinfauna assemblages of the Campeche shelf, Southern Gulf of Mexico. Mar. Ecol. Prog. Ser. 2005, 289, 89–107. [Google Scholar] [CrossRef] [Green Version]
  34. Balgos, M.C.; Pauly, D. Age and growth of the squid Sepioteuthis lessoniana in NW Luzon, Philippines. Afr. J. Mar. Sci. 1998, 20, 449–452. [Google Scholar] [CrossRef]
  35. Chávez, E.; Garduño, M.; Arreguín-Sánchez, F. Trophic dynamic structure of Celestun Lagoon, Southern Gulf of Mexico. In Trophic Models of Aquatic Ecosystems; Christensen, V., Pauly, D., Eds.; International Center for Living Aquatic Resources Management Conference Proceedings: Manila, Phillipines, 1993; pp. 186–192. [Google Scholar]
  36. Opitz, S. Trophic Interactions in Caribbean Coral Reefs; ICLARM Technical Report; International Center for Living Aquatic Resources Management: Manila, Phillipines, 1996; p. 43. [Google Scholar]
  37. Chang, W.B.; Lei, C.H. The development and energy content of a brackishwater copepod, Apocyclops royi (Lindberg), reared in the laboratory. Bull. Inst. Zool. Acad. Sin. 1993, 32, 62–81. [Google Scholar]
  38. Pauly, D.; Christensen, V. Stratified models of large marine ecosystems: A general approach and an application to the South China Sea. In Large Marine Ecosystems: Stress, Mitigation and Sustainability; Sherman, K., Alexander, L.M., Gold, B.D., Eds.; AAAS Press: Washington, DC, USA, 1993; pp. 148–174. [Google Scholar]
  39. Zieman, J.C. Methods for the study of the growth and production of turtle grass, Thalassia testudinum König. Aquaculture 1974, 4, 139–143. [Google Scholar] [CrossRef]
  40. Jeffrey, S.W.; Humphrey, G.F. New spectrophotometric equations for determining hlorophylls a, b, c1 and c2 in higher plants, algae and natural phytoplankton. Biochem. Physiol. Pflanz. 1975, 167, 191–194. [Google Scholar] [CrossRef]
  41. Chen, C.C.; Shiah, F.K.; Jan, S.; Hsu, S.S. The Ecosystem Research of Donsha Atoll; Research Report; Marine National Park Headquarters: Kaohsiung, Taiwan, 2011.
  42. Migné, A.; Davoult, D.; Splimont, N.; Menu, D.; Boucher, G.; Gattuso, J.P.; Rybarczyk, H. A closed-chamber CO2-flux method for estimating intertidal primary production and respiration under emersed conditions. Mar. Biol. 2002, 140, 865–869. [Google Scholar]
  43. Lee, L.; Hsieh, L.; Lin, H.-J. In situ production and respiration of the benthic community during emersion on subtropical intertidal sandflats. Mar. Ecol. Prog. Ser. 2011, 441, 33–47. [Google Scholar] [CrossRef] [Green Version]
  44. Wilson, R.F. Measurement of organic carbon in seawater. Limnol. Oceanogr. 1961, 6, 259–261. [Google Scholar] [CrossRef]
  45. Shiah, F.K.; Chung, S.W.; Kao, S.J.; Gong, G.C.; Liu, K.K. Biological and hydrographical responses to tropical cyclones (typhoons) in the continental shelf of the Taiwan Strait. Cont. Shelf Res. 2000, 20, 2029–2044. [Google Scholar] [CrossRef]
  46. Sobczak, W.V.; Cloern, J.E.; Jassby, A.D.; Müller-Solger, A.B. Bioavailability of organic matter in a highly distributed estuary: The role of detrital and algal resources. Proc. Natl. Acad. Sci. USA 2002, 99, 8101–8105. [Google Scholar] [CrossRef] [Green Version]
  47. Majkowski, J. Usefulness and applicability of sensitivity analysis in a multispecies approach to fisheries management. In Theory and Management of Tropical Fisheries; Pauly, D., Murphy, G.I., Eds.; International Center for Living Aquatic Resources Management Conference Proceedings: Manila, Phillipines, 1982; Volume 9, pp. 149–165. [Google Scholar]
  48. Tennenbaum, S.; Ulanowicz, R.E. Growth and Development: Ecosystems Phenomenology. Estuaries 1988, 11, 73. [Google Scholar] [CrossRef]
  49. Wulff, F.; Field, J.G.; Mann, K.H. Network Analysis in Marine Ecology-Methods And Applications-Coastal And Estuarine Studies Formerly Lecture Notes on Coastal And Estuarine Studies; Springer: New York, NY, USA, 1989. [Google Scholar]
  50. Fath, B.D.; Patten, B.C. Review of the Foundations of Network Environ Analysis. Ecosystems 1999, 2, 167–179. [Google Scholar] [CrossRef]
  51. Christian, R.R.; Baird, D.; Luczkovich, J.; Johnson, J.C.; Scharler, U.M.; Ulanowicz, R.E. Role of network analysis in comparative ecosystem ecology of estuaries. In Aquatic Food Webs: An Ecosystem Approach; Belgrano, A., Scharler, U.M., Dunne, J., Ulanowicz, R.E., Eds.; Oxford University Press: Oxford, UK, 2005; pp. 25–40. [Google Scholar]
  52. Odum, E.P. The strategy of ecosystem development. Science 2014, 104, 203–216. [Google Scholar] [CrossRef]
  53. Kay, J.J.; Graham, L.A.; Ulanowicz, R.E. A detailed guide to network analysis. In Network Analysis in Marine Ecology: Methods and Applications; Wulff, F., Field, J.G., Mann, K.H., Eds.; Springer: New York, NY, USA, 1989; pp. 15–61. [Google Scholar]
  54. Ulanowicz, R.E.; Norden, J.S. Symmetrical overhead in flow networks. Int. J. Syst. Sci. 1990, 21, 429–437. [Google Scholar] [CrossRef]
  55. Libralato, S.; Christensen, V.; Pauly, D. A method for identifying keystone species in food web models. Ecol. Model. 2006, 195, 153–171. [Google Scholar] [CrossRef]
  56. Ulanowicz, R.E.; Puccia, C.J. Mixed trophic impacts in ecosystems. Coenoses 1990, 5, 7–16. [Google Scholar]
  57. Lee, C.; Huang, Y.; Chung, C.; Hsiao, S.; Lin, H. Herbivory in multi-species, tropical seagrass beds. Mar. Ecol. Prog. Ser. 2015, 525, 65–80. [Google Scholar] [CrossRef]
  58. Nakamoto, K.; Hayakawa, J.; Kawamura, T.; Ohtsuchi, N.; Yamada, H.; Kitagawa, T.; Watanabe, Y. Seasonal fluctuation in food sources of herbivorous gastropods in a subtropical seagrass bed estimated by stable isotope analysis. J. Mar. Biol. Assoc. UK 2018, 99, 1119–1125. [Google Scholar] [CrossRef]
  59. Du, J.; Zheng, X.; Peristiwady, T.; Liao, J.; Makatipu, P.C.; Yin, X.; Hu, W.; Koagouw, W.; Chen, B. Food sources and trophic structure of fishes and benthic macroinvertebrates in a tropical seagrass meadow revealed by stable isotope analysis. Mar. Biol. Res. 2016, 12, 748–757. [Google Scholar] [CrossRef]
  60. Vonk, J.A.; Christianen, M.J.; Stapel, J. Redefining the trophic importance of seagrasses for fauna in tropical Indo-Pacific meadows. Estuarine Coast. Shelf Sci. 2008, 79, 653–660. [Google Scholar] [CrossRef]
  61. Manickchand-Heileman, S.; Arreguín-Sánchez, F.; Lara-Dominguez, A.; Soto, L.A. Energy flow and network analysis of Terminos Lagoon, SW Gulf of Mexico. J. Fish Biol. 1998, 53, 179–197. [Google Scholar] [CrossRef]
  62. Riddle, M.J.; Alongi, M.D.; Dayton, K.P.; Hansen, A.J.; Klumpp, W.D. Detritical pathways in a coral reef lagoon: I. Macrofaunal biomass and estimates of production. Mar. Biol. 1990, 104, 109–118. [Google Scholar]
  63. Sorokin, I.Y. Aspects of trophic relations, productivity and energy balance in coral-reef ecosystems. In Ecosystems of the World: Coral Reefs; Dubinski, Z., Ed.; Elsevier: Amsterdam, The Netherlands, 1990; Volume 25, pp. 401–409. [Google Scholar]
  64. Romero, J.; Pérez, M.; Mateo, M.; Sala, E. The belowground organs of the Mediterranean seagrass Posidonia oceanica as a biogeochemical sink. Aquat. Bot. 1994, 47, 13–19. [Google Scholar] [CrossRef]
  65. Mateo, M.; Romero, J.; Pérez, M.; Littler, M.; Littler, D. Dynamics of Millenary Organic Deposits Resulting from the Growth of the Mediterranean Seagrass Posidonia oceanica. Estuarine Coast. Shelf Sci. 1997, 44, 103–110. [Google Scholar] [CrossRef]
  66. Peduzzi, P.; Herndl, G.J. Decomposition and significance of seagrassleaf litter (Cymodocea nodosa) for the microbial food web in coastal waters (Gulf of Trieste, Northern Adriatic Sea). Mar. Ecol. Prog. Ser. 1991, 71, 163–174. [Google Scholar] [CrossRef]
  67. Robertson, A.; Mann, K.H. The role of isopods and amphipods in the initial fragmentation of eelgrass detritus in Nova Scotia, Canada. Mar. Biol. 1980, 59, 63–69. [Google Scholar] [CrossRef]
  68. Bologna, P.A. Assessing within habitat variability in plant demography, faunal density, and secondary production in an eelgrass (Zostera marina L.) bed. J. Exp. Mar. Biol. Ecol. 2006, 329, 122–134. [Google Scholar] [CrossRef]
  69. Arias-González, J.E.; Delesalle, B.; Salvat, B.; Galzin, R. Torphic functioning of the Tiahura reef sector, Moorea Island, French Polynesia. Coral Reefs 1997, 16, 231–246. [Google Scholar]
  70. Johnson, C.; Klumpp, D.; Field, J.; Bradbury, R. Carbon flux on coral reefs: Effects of large shifts in community structure. Mar. Ecol. Prog. Ser. 1995, 126, 123–143. [Google Scholar] [CrossRef] [Green Version]
  71. Paine, R.T. A Note on Trophic Complexity and Community Stability. Am. Nat. 1969, 103, 91–93. [Google Scholar] [CrossRef]
  72. Schmitz, O.J.; Krivan, V.; Ovadia, O. Trophic cascades: The primacy of trait-mediated indirect interactions. Ecol. Lett. 2004, 7, 153–163. [Google Scholar] [CrossRef] [Green Version]
  73. Chang, K.C. Distribution Heterogeneity of the Rays Pateobatis fai and Aetobatus ocellatus in Shallow Water of Dongsha Island-Hypothesis Testing. Master’s Thesis, National Sun Yat-sen University, Kaohsiung, Taiwan, 2019. [Google Scholar]
  74. DeAngelis, B.; McCandless, C.; Kohler, N.; Recksiek, C.; Skomal, G. First characterization of shark nursery habitat in the United States Virgin Islands: Evidence of habitat partitioning by two shark species. Mar. Ecol. Prog. Ser. 2008, 358, 257–271. [Google Scholar] [CrossRef] [Green Version]
  75. Legare, B.; Kneebone, J.; de Angelis, B.; Skomal, G. The spatiotemporal dynamics of habitat use by blacktip (Carcharhinus limbatus) and lemon (Negaprion brevirostris) sharks in nurseries of St. John, United States Virgin Islands. Mar. Biol. 2015, 162, 699–716. [Google Scholar] [CrossRef]
  76. Legare, B.; Skomal, G.; DeAngelis, B. Diel movements of the blacktip shark (Carcharhinus limbatus) in a Caribbean nursery. Environ. Boil. Fishes 2018, 101, 1011–1023. [Google Scholar] [CrossRef]
  77. Heithaus, M.R.; Dill, L.; Marshall, G.; Buhleier, B. Habitat use and foraging behavior of tiger sharks (Galeocerdo cuvier) in a seagrass ecosystem. Mar. Biol. 2002, 140, 237–248. [Google Scholar]
  78. Heithaus, M.R.; Vaudo, J.J.; Kreicker, S.; Layman, C.A.; Krützen, M.; Burkholder, D.A.; Gastrich, K.; Bessey, C.; Sarabia, R.; Cameron, K.; et al. Apparent resource partitioning and trophic structure of large-bodied marine predators in a relatively pristine seagrass ecosystem. Mar. Ecol. Prog. Ser. 2013, 481, 225–237. [Google Scholar] [CrossRef] [Green Version]
  79. Jackson, E.L.; Rees, S.; Wilding, C.; Attrill, M.J. Use of a seagrass residency index to apportion commercial fishery landing values and recreation fisheries expenditure to seagrass habitat service. Conserv. Biol. 2015, 29, 899–909. [Google Scholar] [CrossRef] [PubMed] [Green Version]
  80. Zou, Y.-F.; Chen, K.-Y.; Lin, H.-J. Significance of belowground production to the long-term carbon sequestration of intertidal seagrass beds. Sci. Total Environ. 2021, 800, 149579. [Google Scholar] [CrossRef] [PubMed]
  81. Orth, R.; Carruthers, T.J.B.; Dennison, W.C.; Duarte, C.M.; Fourqurean, J.W.; Heck, K.L.; Hughes, A.R.; Kendrick, G.A.; Kenworthy, W.J.; Olyarnik, S.; et al. A Global Crisis for Seagrass Ecosystems. BioScience 2006, 56, 987–996. [Google Scholar] [CrossRef] [Green Version]
Figure 1. Maps showing (a) the location of Dongsha Atoll in the South China Sea; (b) the position of Dongsha Island in the Atoll; the dark gray area indicates the distribution of seagrass beds around Dongsha Island; and (c) the modeling area of seagrass beds around Dongsha Island. The locations of five study sites are shown by stars.
Diversity 13 00544 g001
Figure 2. Trophic flow diagram of the Dongsha seagrass bed model. The area of each compartment represents the proportion of the total biomass of the model contained by the compartment. The line between each compartment represents the trophic relationship between them. Line width represents the relative flux between compartments. The numerical legend for compartments is: 1. pelagic sharks; 2. lemon sharks; 3. ray; 4. piscivorous fish; 5. large carnivorous fish; 6. small carnivorous fish; 7. omnivorous fish; 8. detritivorous fish; 9. seagrass herbivorous fish; 10. algae herbivorous fish; 11. hawksbill turtles; 12. green turtles; 13. cephalopods; 14. urchins; 15. carnivorous invertebrates; 16. omnivorous invertebrates; 17. filter invertebrates; 18. herbivorous invertebrates; 19. cnidarians; 20. zooplankton; 21. macroalgae; 22. microalgae; 23. seagrasses; and 24. detritus.
Diversity 13 00544 g002
Figure 3. Lindeman spines of organic matter (g wet weight m−2 yr−1) and trophic efficiencies (TE, %) in different trophic levels from Level I including primary producer (P) and detritus (D) to consumers at Level II–VI in the Dongsha seagrass bed model. P: primary producers; D: detritus; TL: trophic level; TST: Total system throughput; and TE: transfer efficiency.
Diversity 13 00544 g003
Figure 4. Mixed trophic impacts of the Dongsha seagrass bed model. The figure reveals the direct and indirect trophic impacts that an increase in the biomass of the compartments listed on the right would have, both with positive (white histograms) and negative (black histograms) influences listed. The proportion of the impact is represented by the size of the histogram.
Diversity 13 00544 g004
Table 1. The input parameters and calculated output of compartments in the Dongsha seagrass bed model. The values in parentheses were estimated by Ecopath. Shaded compartments are the top five influential compartments in the model by keystone index and relative total impact. B, biomass (g, wet weight (WW) m−2); P/B, production/biomass ratio (yr−1); Q/B, consumption/biomass ratio (yr−1); and EE, ecotrophic efficiency.
Basic InputCalculated Output
GroupBP/BQ/BEETrophic LevelNet EfficiencyOmnivory IndexFlow to DetritusKeystone IndexRelative
Total Impact
1Pelagic sharks0.230.323.90(0.00)3.820.100.350.250.020.78
2Lemon sharks3.250.312.60(0.01)3.740.150.372.690.060.86
3Rays3.860.633.30(0.00)3.170.240.074.97−0.200.47
4Piscivorous fish12.460.645.49(0.28)3.490.140.2519.380.131.00
5Large
carnivorous fish
52.441.558.08(0.26)3.040.240.02144.99−0.090.61
6Small carnivorous fish13.691.6112.59(0.83)3.010.160.0238.14−0.510.23
7Omnivorous fish2.602.2719.79(0.58)2.790.140.2112.74−0.660.17
8Detritivorous fish2.791.6017.42(0.71)2.000.110.0011.00−1.460.03
9Seagrass
herbivorous fish
15.061.7929.94(0.38)2.000.070.00107.02−0.160.52
10Algae
herbivorous fish
6.134.3924.75(0.34)2.000.220.0048.02−0.470.25
11Hawksbill turtles0.000.103.50(0.22)2.970.040.090.00−3.650.00
12Green turtles0.010.116.76(0.08)2.000.020.000.01−3.840.00
13Cephalopods0.123.10(15.50)(0.48)3.070.250.090.56−2.700.00
14Urchins2.921.54(7.70)(0.41)2.000.250.007.13−1.010.07
15Carnivorous
invertebrates
5.558.27(41.36) (0.16)2.820.250.1784.27−0.650.17
16Omnivorous
invertebrates
145.3513.48(67.41)(0.47)2.020.250.023195.910.070.93
17Filter invertebrates43.928.21(41.05)(0.82)2.010.250.01426.080.020.80
18Herbivorous
invertebrates
4.286.80(34.00)(0.26)2.000.250.0050.67−0.550.21
19Cnidarians6.122.09(10.45)(0.40)2.150.250.2419.20−1.200.05
20Zooplankton0.6032.00192.00(0.81)2.010.210.1226.77−1.340.03
21Macroalgae124.5419.70 (0.16)1.00 0.002070.21−0.150.56
22Microalgae1.4226.55 (0.71)1.00 0.0010.99−1.820.01
23Seagrasses1836.9037.18 (0.01)1.00 0.0067748.51−0.790.62
24Detritus30.31 (0.15)1.000.000.070.00
Table 2. Diet composition matrix in percentage of prey groups (in rows) for each consumer group (in columns) for the Dongsha seagrass bed model.
1234567891011121314151617181920
1Pelagic sharks<0.001
2Lemon sharks0.010
3Rays0.010<0.001
4Piscivorous fish0.2540.2210.0010.0010.001 <0.001
5Large carnivorous fish0.3550.3870.0010.2490.001 0.001 <0.001
6Small carnivorous fish <0.0010.0100.1860.013 0.002 0.001
7Omnivorous fish0.0500.005<0.0010.0390.001 0.002 0.001
8Detritivorous fish<0.0010.0250.0010.0360.001 0.002 0.001
9Seagrass herbivorous fish0.1100.2400.0010.1030.002 0.002 0.001
10Algae herbivorous fish0.2100.1210.0010.1030.002 0.002 0.001
11Hawksbill turtles<0.001
12Green turtles<0.001
13Cephalopods<0.0010.001<0.0010.001<0.001 0.050
14Urchins 0.100 0.001 0.001 0.001
15Carnivorous invertebrates 0.1060.0020.0100.0050.015 0.010 0.001 0.001
16Omnivorous invertebrates 0.4150.2810.8680.9640.557 0.440 0.829 0.5450.001
17Filter invertebrates 0.309 0.1000.0090.155 0.250 0.009 0.2450.018 0.0500.005
18Herbivorous invertebrates 0.055<0.0010.0010.0030.001 0.1000.0010.001 0.0050.001
19Cnidarians 0.025 0.0010.0500.001 0.0010.001
20Zooplankton <0.0010.0020.0020.002 0.001 <0.001<0.0010.007 0.0100.005
21Macroalgae 0.2240.0310.0220.8560.0500.048 0.250 0.013 0.690
22Microalgae 0.0010.003 0.0010.011<0.0010.0100.010
23Seagrasses 0.9740.005 0.951 0.700 0.005 0.293
24Detritus 0.0010.0180.0200.9640.0040.138 0.0500.2000.9610.9720.0170.3300.100
Input from outside 0.100 0.100 0.010 0.6000.880
Table 3. Ecosystem parameters of network analysis used to characterize the trophic structure and function of the Dongsha seagrass bed model.
ParameterAbbreviationDescriptionUnit
AscendencyAA measure of the magnitude of organic
matter flowing through a food web
%
Detritivory/herbivory ratioD/HA measure of the importance of detritivory
flows relative to herbivory flows in a system
Finn cycling indexFCIA measure of the relative importance of cycling to
the total system throughput (TST) in a system
%
Net primary production/total biomass ratioP/BThe relationship between net primary production
and total biomass in a system
Net primary production/respiration ratioP/RThe relationship between net primary production
and respiration in a system
Omnivory index A measure of the distribution of feeding
interactions among trophic levels in a system
Total biomass/TST ratioB/TSTThe amount of biomass necessary to maintain
one unit of flow in a system
Total system throughputTSTSum of all flows in a system; a measure
of system activity
g WW m−2 yr−1
Trophic transfer efficiencyTEA measure of the fraction of the input of
organic matter to a given level that was
transferred to the next higher level
%
Table 4. Common elasmobranchs and their ecological information at Dongsha.
SpeciesFamilyDensity (per ha)Body-Length Range (cm)DietMajor HabitatFunctional Group
Tiger shark
(Galeocerdo cuvier)
Carcharhinidae<0.01220–370Fish, shark, ray, sea turtle *Seagrass bed, Reefpelagic shark
Black tip shark
(Carcharhinus limbatus)
Carcharhinidae1.2990–200Fish (mostly carangid, lethrinid lutjanid)Reefpelagic shark
Sharptooth lemon shark (Negaprion acutidens)
Carcharhinidae23.0160–200Fish (mostly mugilid,
carangid, lethrinid lutjanid, scarid)
Squid (Sepioteuthis lessoniana)
Seagrass bed,
Inner lagoon, Reef
lemon shark
Pink whip ray
(Pateobatis fai)
Dasyatidae12.1160–150Crab, Shrimp, Clam,
Snail, Urchin
Seagrass bed, Inner lagoonray
Round ribbon-tail ray
(Taeniura meyeni)
Dasyatidae1.60100–200Crab, Shrimp, Clam, UrchinSeagrass bed,
Reef
ray
Ocellated eagle ray
(Aetobatus ocellatus)
Aetobatidae8.0950–160Crab, Clam, SnailSeagrass bed, Reefray
* Data from Fishbase.
Publisher’s Note: MDPI stays neutral with regard to jurisdictional claims in published maps and institutional affiliations.

