Article

Full-Length Transcriptomics Reveal the Gene Expression Profiles of Reef-Building Coral Pocillopora damicornis and Symbiont Zooxanthellae

1
State Key Laboratory of Bioelectronics, School of Biological Science and Medical Engineering, Southeast University, Nanjing 210096, China
2
Guangxi Key Lab of Mangrove Conservation and Utilization, Guangxi Mangrove Research Center, Guangxi Academy of Sciences, Beihai 536000, China
3
Nanjing Institute of Paleontology and Geology, Nanjing 210008, China
*
Authors to whom correspondence should be addressed.
Diversity 2021, 13(11), 543; https://doi.org/10.3390/d13110543
Submission received: 23 September 2021 / Revised: 23 October 2021 / Accepted: 25 October 2021 / Published: 28 October 2021

Abstract

:
Since the last century, episodes of coral reef bleaching and mortality have occurred almost annually in tropical or subtropical seas. When the temperature exceeds the tolerant limit of a coral–zooxanthellae holobiont, it induces physiological stress and disrupts the vulnerable fine-tuned balance between the two partners, leading to bleaching. The gene expression profiles of a scleractinian coral and its symbiotic zooxanthellae can offer important information with which to decipher this balanced relationship at the functional level of genes. Here, we sequence a full-length transcriptome of a well-known, common and frequently dominant reef-building coral, Pocillopora damicornis, to acquire gene expression information for the coral–zooxanthellae holobiont. To this end, we identify 21,926 and 465 unique genes in the coral and algal symbiont, respectively, and examine the functional enrichment among these genes based on GO (gene ontology) terms and KEGG (the Kyoto Encyclopedia of Genes and Genomes) pathways. The results show that the zooxanthellae provide for their coral host through energy and nutrition metabolism by photosynthesis, and that both the coral host and zooxanthellae have an anti-stress molecular mechanism, though the two parties have independent abilities to survive in the short term. This work sheds light on the valuable gene expression profile of a coral–zooxanthellae holobiont and provides grounds for further molecular biological research to support ecological protection work.

Graphical Abstract

1. Introduction

Coral reef ecosystems, which are intricate and diverse collections of species that interact with each other and the physical environment to provide a habitat for many marine organisms, have been undergoing unprecedented mass coral bleaching events in recent decades, fueled by ocean warming, ocean acidification and the massive encroachment of the predatory crown-of-thorns starfish [1,2,3,4,5]. Global change continues to diminish the productivity and biodiversity of coral reefs, along with their capacity to deposit calcium carbonate [5,6].
Pocillopora damicornis, or scleractinian coral, a type of coral characterized by its hard skeleton, provides the bedrock of the reef and is, thus, one of the most widely distributed reef corals, which also makes it one of the most well-studied [7,8,9]. Scleractinian coral displays a population structure typical of organisms with an intimately intracellular coexistence, containing microscopic algae called zooxanthellae, which exist with the animal in a symbiotic relationship [10,11,12]. The symbiont is crucial to the maintenance and photosynthesis of the coral reef [13]. Changes in a suite of environmental conditions, however, can lead to the breakdown and dissociation of the coral–algal symbiosis, which results in coral bleaching [12]. Bleached corals die if not re-populated with Symbiodinium, and even recovered corals have reduced growth, regeneration and fitness, and a greater susceptibility to bleaching in the future [14,15,16,17]. The gene expression profile of the symbiont affects the host–symbiotic culture in corals and shows that the coral–zooxanthellae holobiont expresses messages for molecules involved with the regulation of the ecosystem to prevent bleaching.
Some preliminary studies of P. damicornis have been undertaken. In ocean warming and acidification conditions, oxidative stress is unlikely to have been the driver for symbiont expulsion and corals may have increased their resilience to the widespread climate change [18,19]. The microbiome in corals can be manipulated to lessen the effect of bleaching; thus, helping to alleviate pathogen and temperature stresses [20,21]. Next-generation transcriptome sequencing was firstly reported by Jeremie Vidal-Dupiol et al., who identified related genes that are upregulated in response to a CO2-driven pH decrease [22]. Niche partitioning of a closely related symbiotic in P. damicornis was studied for the first time using this approach [23]. Zhou Zhi et al. established transcriptome libraries of P. damicornis after ammonium stress and explored the dual-recognition activity of a rhamnose-binding lectin to pathogenic bacteria and zooxanthellae [24]. Although these papers studied the role of zooxanthellae in a symbiont and investigated the effects of zooxanthellae and corals on symbionts, the research was carried out under special conditions, such as acidification. As zooxanthellae live in symbiosis with corals in a normal marine environment, their influence on each other and complementary interaction must also be studied in such a setting.
Recent advances of PacBio Sequel II sequencing technology provide a way to obtain large amounts of full-length transcriptome data from many organisms and tissues [25,26,27]. In principle, such data can allow us to identify all expressed transcripts as a complete and contiguous mRNA sequence from the transcription start site to the transcription end site. This approach can be applied to multiple alternatively spliced isoforms and to allow a precise analysis of fusion genes, homologous genes, superfamily genes, or alleles. With these tools, researchers can accurately and more efficiently analyze all gene expression profile information, such as that on gene expression, variable splicing, gene fusion, expression regulation, the coding sequence (CDS), protein structure, etc. This overcomes the problems of short and error splicing triggered by next-generation sequencing technology and the problems caused by amplifying target genes one by one, which was an issue early in the days of polymerase chain reaction and Sanger sequencing [28,29,30]. However, to date, no studies on the full-length transcriptome analysis and expression profiles of zooxanthellae and coral have been reported in P. damicornis.
In this study, we first perform SMRT (single-molecule real-time) transcriptome sequencing of P. damicornis using the PacBio RSII sequence platform, which provides the technologies needed to directly obtain complete transcripts containing 5′UTR and 3′UTR with poly(A) tails. Additionally, zooxanthellae transcripts isolated from the algal symbiont transcriptome allow us to investigate and identify the highly expressed genes and related pathways at a molecular level, to provide further insight into the molecular mechanisms of a coral symbiont.

2. Methods and Materials

2.1. Ethics

All coral samples were collected and processed in accordance with local laws for invertebrate protection.

2.2. Sample Collection

The samples in the study were collected from the Xisha Islands in the South China Sea (latitude 15°40′–17°10′ N, longitude 111°–113° E). The coral samples were cultured in our laboratory coral tank with conditions conforming to their habitat environment, i.e., the Red Sea® tank with 150 cm (length) × 60 cm (width) × 55 cm (height) (redsea575, Red Sea Aquatics, Ltd., Hongkong, China) at 26 °C, 1.025 salinity and pH 7.8. The physical conditions of the coral culture system were maintained using the following equipment: three coral lamps (AI®, Red Sea Aquatics, Ltd., Hongkong, China) with 200–220 µmol photons·m2·sec light intensity and emitted light containing wavelengths of 380–400 nm, a protein skimmer (regal250s, Reef Octopus, Shenzhen, China), a water chiller (tk1000, TECO, Ltd., Port Louis, Mauritius), two wave devices (VortechTM MP40, EcoTech Marine, Ltd., Bethlehem, Pakistan) and a calcium reactor (CalReact 200, Reef Octopus), etc.

2.3. RNA Extraction

The RNA extraction procedure was performed according to the following instructions: (1) coral samples were ground (we kept the samples submerged in liquid nitrogen at all times); (2) when the samples were ground into small pieces, the TRIzol® LS reagent (Thermo Fisher Scientific, Carlsbad, CA, USA, 10296028) was added, the ratio of sample to reagent was about 1:3; (3) samples were left to stand and thaw naturally; (4) TRIzol® LS reagent was continuously added until the samples were dissolved, and dispensed into 50 mL centrifuge tubes; (5) centrifuged at 4 °C and 3000 rpm for 5–15 min; (6) the supernatant was dispensed into 50 mL centrifuge tubes; (7) BCP (Molecular Research Center, Cincinnati, OH, USA, BP151) was added to the above centrifuge tubes, the ratio of sample to reagent was about 5:1, samples were shaken well and then left to stand for 10 min; (8) centrifuged at 4 °C and 10,500 rpm for 15 min; (9) an equal volume of Isopropanol (AMRESCO, 0918-500ML) was added to the supernatant and mixed well, left to stand overnight at −20 °C; (10) it was centrifuged at 4 °C and 10,500 rpm for 30 min, and the supernatant was discarded; (11) rinsed 2 times with 75% Ice Ethanol (Sigma, Shanghai, China, E7023-500ML), and treated with DNase I (Thermo Fisher Scientific, 18068015). Finally, three samples of each coral were extracted in equal amounts (total > 10 µg) and mixed for PacBio full-length transcriptome sequencing, the remainders (>1.5 µg per sample) were used for Illumina sequencing.
The high-quality mRNAs were isolated with a FastTrack MAG Maxi mRNA Isolation Kit (Thermo Fisher Scientific, K1580-02). The samples were separated from healthy P. damicornis to ensure that enough high-quality RNA (>10 µg) could be obtained for a full-length cDNA (complementary DNA) transcriptome library.

2.4. Library Construction and Sequencing

To support the accuracy and credibility of the data, we used three sample repetitions for the library construction and sequencing. Before establishing the library, the quality of the total RNA was tested. Agarose gel electrophoresis was used to analyze the degree of degradation of RNA and determine whether it was contaminated. A Nanodrop nucleic acid quantifier was used to detect the purity of the RNA (OD260/280 ratio), a Qubit RNA assay was used to accurately quantify the RNA concentration and an Agilent 2200 TapeStation was used to accurately detect the integrity of the RNA. The Clontech SMARTer® PCR cDNA Synthesis Kit (Clontech Laboratories, California, CA, USA, 634926) and the BluePippin Size Selection System protocol, as described by Pacific Biosciences (PN 100-092-800-03), were used to prepare the isoform sequencing (Iso-Seq) library according to the Iso-Seq protocol. We used the PacBio Sequel II platform with SMRT (single-molecular real-time) sequencing technology to obtain raw data.

2.5. Data Processing

SMRT Link v7.0 software (minLength 50; maxLength 15,000; minPasses 1) was used to process sequencing samples. Raw data obtained by the platform contained sequencing adapters and low-quality reads [31]. To ensure the quality and reliability of the data analysis, it was necessary to filter the raw data, removing the joints and reads of less than 50 bp in length, to obtain subread BAM (Binary Alignment/Map format) files. Circular consensus sequences (CCSs) were generated from subread sequences using a CCS algorithm with the following parameters: min_length: 50; max_drop_fraction: 0.8; no_polish: TRUE; min_zscore: −9999.0; min_passes: 1; min_predicted_accuracy: 0.8; max_length: 15,000. The CCSs were classified into full-length non-chimera (FLNC) reads and non-full-length (nFL) reads. FLNC FASTA files were clustered by isoform-level clustering and polished by Arrow (hq_quiver_min_accuracy: 0.99; bin_by_primer: false; bin_size_kb: 1; qv_trim_5p: 100; qv_trim_3p: 30) until we obtained consensus reads.

2.6. Error Correction Using Illumina Reads

LoRDEC v0.7 constructed a DBG (de Bruijn graph) based on sequences obtained by the Illumina platform and read every consensus to identify whether the sequence was supported by Illumina data in DBG [32]. The sequences not supported by next-generation data were corrected and the corrected consensus sequences were outputted.

2.7. Removing Redundancies

Any redundancy in the corrected consensus reads was removed by CD-HIT v4.6.8 (-c: 0.95; -T: 6; -G: 0; -aL: 0.00; -aS: 0.99) to obtain unigenes and sequence clustering information for subsequent analysis [33].

2.8. Gene Functional Annotation

The gene function was annotated based on the following databases: NR (NCBI non-redundant protein sequences) [34]; NT (NCBI non-redundant nucleotide sequences); Pfam (protein family); KOG/COG (clusters of orthologous groups of proteins) [35]; Swiss-Prot (manually annotated and reviewed protein sequence database) [36]; KEGG (Kyoto Encyclopedia of Genes and Genomes) [37]; GO (gene ontology) [38]. We used BLAST software and set the e-value to ‘1e-10′ in the NT database analysis, used Diamond BLASTX and set the e-value to ‘1e-10′ in the NR, KOG, Swiss-Prot and KEGG databases analyses and used the Hmmscan software in the Pfam database analysis [39].

2.9. CDS Prediction

The ANGEL V2.4 pipeline was used to identify protein coding sequences (CDSs) from cDNAs [40]. We used closely related species-confident protein sequences for ANGEL training and predicted the CDSs of P. damicornis.

2.10. TF Analysis

Plant transcription factors (TFs) were predicted using iTAK v1.7a software and animal TFs were identified using the animalTFDB v2.0 database [41,42].

2.11. SSR Analysis

SSRs (simple sequence repeats) of transcriptomes were identified using the MISA V1 website sever (http://pgrc.ipk-gatersleben.de/misa/misa.html, accessed on 21 October 2020), via which we located perfect microsatellites as well as compound microsatellites that were interrupted by a certain number of bases [43].

2.12. LncRNA Analysis

PLEK and CNCI (coding non-coding index) software were used to predict the transcriptome coding potential according to sequence characteristics of transcripts with default parameters [44,45]. The PLEK SVM (support vector machines) classifier uses an optimized K-mer approach to construct the best classifier with which to assess the coding potential of a species that lacks high-quality genomic sequences and annotations. The CNCI profiles adjoin nucleotide triplets to effectively distinguish protein-coding and non-coding sequences independent of known annotations. Then, after the PLEK and CNCI prediction, the transcript coding potential was assessed by CPC2 (coding potential calculator 2) software. The CPC mainly assesses the extent and quality of the ORF (open reading frame) in a transcript, and searches the sequences with a known protein sequence database to clarify the coding and non-coding transcripts [46]. We used the NCBI eukaryotes’ protein database and set the e-value to ‘1e-10′ in our analysis. Finally, the transcription sequences obtained in the prior steps were homology searched with the Pfam-A and Pfam-B databases for Hmmscan, and the lncRNAs (long noncoding RNAs) were finally obtained.

2.13. Quantification of Gene Expression Levels

We used bowtie2 software in RSEM (end-to-end and sensitive) to compare the clean reads of each sample obtained by Illumina to reference sequences (Ref), which were unigenes obtained by CD-HIT [47]. The read count for each transcript was obtained from the mapping results and then transformed into the FPKM (expected number of fragments per kilobase of transcript sequence per million base pairs sequenced) for analysis.

2.14. Correlation Analysis of Gene Expression

The correlation of the gene expression level between samples was an important index with which to test the reliability of the experiment and the rationality of the sample selection. The closer the correlation coefficient was to 1, the higher the similarity of the expression patterns between samples. The Encode program recommends a Pearson correlation coefficient square (R2) greater than 0.92 (ideal for sampling and experimental conditions). In a specific project’s operation, generally, an R2 between biological repetition samples that is greater than 0.8 is considered to represent reasonable and good biological repetition.

2.15. GO and KEGG Enrichment Analysis

Gene ontology (GO) enrichment analysis of differentially expressed genes or lncRNA target genes was implemented by the GOseq R package, in which the gene length bias was corrected [38]. GO terms with corrected p-values of less than 0.05 were considered significantly enriched by differentially expressed genes. KEGG is a database resource for understanding high-level functions and utilities of the biological system, such as the cell, organism and ecosystem, using molecular-level information, especially large-scale molecular datasets generated by genome sequencing and other high-throughput experimental technologies (http://www.genome.jp/kegg/, accessed on 25 July 2021) [37]. We used KOBAS software to test the statistical enrichment of the genes in the KEGG pathways [48].

3. Results

3.1. Raw Data Quality Control

The PacBio Sequel sequencing platform is a circular sequencing platform, and sequencing reads produced by a single molecule during the sequencing process are called polymerase reads. Subreads are obtained by filtering and removing the joint and polymerase reads with a length of less than 50 bp. The statistical results for the polymerase reads and subreads in this study are shown in Table S1 and Figures S1 and S2.

3.2. Transcript Correction

The third-generation sequencing technology represented by PacBio has the advantage of an extremely long read length, but also has a high single-base error rate. Yet, its sequencing errors are random and can improve the data accuracy by increasing the sequencing depth up to 99.99%. Furthermore, the full-length transcriptome can be corrected multiple times to improve the data accuracy. High-quality CCSs are consistent sequences obtained from subreads in each ZMW (Zero-Mode Waveguides), where the same template is sequenced multiple times to perform in-hole corrections for zero-mode waveguide holes without a reference sequence alignment. CCS statistics are shown in Table S2 and Figure S3. The lengths of CCSs range from 2000 to 3000 at most. In SMRT Link software, a sequence containing both 3′ and 5′ UTRs and a poly(A) tail before the 3′ primer, is defined as either a full-length (FL) read or non-full-length read. A non-chimeric sequence in an FL read is called a full-length non-chimeric (FLNC) read. The statistical results of the full-length transcript classification are shown in Table 1 and Figure S4. Multi-copy transcript sequencing data were clustered to eliminate redundancies, and an interhole correction of zero-mode waveguide holes was performed to obtain cluster consensus sequences. Arrow software was used to polish the cluster consensus sequences, to obtain consensus sequences. Consensus statistical results are shown in Table S2 and Figure S5. The lengths of the consensus sequences ranged from 2000 to 3000 at most and they had a similar length distribution to the FLNC reads. To further improve the sequencing accuracy, LoRDEC software was used to adjust the consensus sequences with next-generation data, and corrected consensus sequences were obtained. The lengths of the sequence before and after transcription correction were statistically analyzed (Table 2).

3.3. Redundant Removal

CD-HIT uses heuristic algorithms to quickly find highly similar fragments between sequences. To do so in this study, first, all sequences were sorted according to their length. Then, the first cluster was formed from the longest sequence. Finally, the sequences were processed in turn. If the similarity between a new sequence and a representative sequence of the existing sequence cluster was above a set identity threshold, the new sequence would be added to the existing cluster; otherwise, a new cluster would be formed. According to a 95% similarity between sequences, we conducted clustering to eliminate redundancies from the corrected consensus sequences, and the results are shown in Figure 1, Table 3 and Tables S3 and S4. After redundancy removal, the number of unigenes was reduced by nearly 50% compared with the number of transcripts, of which 14,840 transcripts had no redundancies and 4170 unigenes contained two transcripts.

3.4. Gene Function Annotation

To obtain comprehensive gene function information, a gene function annotation was performed on symbiont unigenes with the NR, NT, Pfam, KOG/COG, Swiss-Prot, GO and KEGG databases. There were 21,204 genes annotated in at least one database, and 4256 genes were annotated in all seven databases (Figures S6 and S7, Table S5 and Supplementary Data S1). To distinguish the unigenes of corals and zooxanthellae, the full-length transcriptome of the symbiont was divided into a full-length coral transcriptome and full-length zooxanthellae transcriptome, based on consensus, according to NR and NT annotation. This annotation is characterized by its comprehensive content, with the annotated results containing species information that is used for classification. A total of 21,926 unigenes was found in the coral and the zooxanthellae had 465 unigenes. The two transcriptomes were corrected and redundancies removed, according to the aforementioned methods, and reannotated based on the seven databases listed. All statistical results are shown in Table S5 and Figure 2.

3.4.1. NR Database Annotation

By comparing the similarities of the gene sequences of this species and those of the related species, and annotating with the NR database, functional information on the genes of this species could be obtained. There were 20,309 and 423 unigenes annotated in the NR database and the statistical results are shown in Figures S8 and S9. The top three species with the highest numbers of annotated unigenes in the coral were A. digitifera, Exaiptasia pallida and Nematostella vectensis, together comprising 92.12% of the unigenes. The top three species with the highest number of annotated unigenes in zooxanthellae, meanwhile, were A. digitifera, Symbiodinium microadriaticum and E. pallida, together comprising 81.80% of the unigenes.

3.4.2. GO Classification

GO is divided into three categories: (1) cellular component, used to describe subcellular structures, locations and macromolecular complexes, such as nucleoli, telomere and the recognition of the initiation complex; (2) molecular function, used to describe the functions of individual genes or gene products, such as binding to carbohydrates or ATP hydrolase activity; (3) biological process, used to describe biological processes in which the products encoded by genes participate, such as mitosis or purine metabolism. The successfully annotated unigenes were classified according to the second level of the three GO categories, and the results are shown in Figure S10. In total, 15,147 coral unigenes and 36 zooxanthellae unigenes were successfully annotated.

3.4.3. KOG Classification

Through a comparison, a protein sequence could be annotated into a KOG for eukaryotes, and each cluster of KOG is composed of lineal homologous sequences, meaning that the function of the sequence can be inferred. According to the function, a KOG can be divided into 26 clusters (http://www.ncbi.nlm.nih.gov/COG/, accessed on 17 March 2020). In this study, 13,660 coral genes and 191 zooxanthellae genes were successfully annotated in the KOG database (Table S6 and Figure S11).

3.4.4. KEGG Classification

KEGG is a database used to analyze the metabolic pathways of gene products, compounds in cells and the functions of these gene products. KEGG combines data from genomes, chemical molecules and biochemical systems, including the metabolic KEGG pathway, KEGG drug, KEGG disease, KEGG module, KEGG genes and KEGG genome annotation systems. The KO (KEGG ORTHOLOGY) system links each KEGG annotation systems together, completing the annotation system for the functional annotation of a genome or transcriptome for newly sequenced species (http://www.genome.jp/kegg, accessed on 9 March 2020). After KO annotation, unigenes can be classified according to the KEGG metabolic pathway they participate in, as shown in Figure S12.

3.4.5. Pfam Database Annotation

The Pfam database contains many protein domain families, which are composed of two parts: Pfam-A and Pfam-B. Pfam-A originates from the Pfamseq database based on the latest high-quality UniProtKB. As a supplement to Pfam-A, Pfam-B is extremely useful for identifying functional, conserved areas that Pfam-A cannot cover (http://pfam.xfam.org/, accessed on 20 April 2020). The annotation results of the Pfam database are shown in Supplementary Data S2.

3.4.6. Swiss-Prot Database Comment

Swiss-Prot is an annotated protein sequence database, including protein function, post-translational modification, variation and other descriptive information, which can be used to further identify protein variation and reduce redundancy (Supplementary Data S3).

3.5. Gene Structure Analysis

3.5.1. CDS Prediction

The prediction of a protein-coding region is helpful for a preliminary unigene analysis and also sets the basis for a subsequent protein structure analysis. ANGEL software using a machine-learning algorithm was applied for the predictive analysis of the CDS. This maximized the limited information from the input sequence to predict the CDS. The frequency of codon usage, and protein structure information that is difficult to apply to the random model algorithm, were used to optimize the limited information. Therefore, the accuracy of the prediction results was independent of the length of the input sequence. The CDS length distribution results are shown in Figure 3.

3.5.2. TF Analysis

For the species in the animalTFDB 2.0 database, if they were Ensembl Gene ID, the transcription factors would be screened directly, and for unigenes not Ensembl Gene ID, BLASTX screening would be performed by the known transcription factor protein sequences of species in the database. For species not included in the database, hmmsearch was used to identify them according to pfam files of transcription factor families. The top 30 transcription factor families annotated to the largest number of transcripts are displayed in Figure 3.

3.5.3. SSR Analysis

The high variability of SSR length is caused by different nucleotides of repeat units and different repeats, among which the most common is the dinucleotide repeat type, such as (CA)n. The minimum repetition times of each of the corresponding unit sizes are: 1–10, 2–6, 3–5, 4–5, 5–5, 6–5 (for example, with 1–10, when a single nucleotide is used as the repetition unit, its repetition number can be detected only when it is at least 10; with 2–6, when a dual-core nucleotide is used for the repeat unit, the minimum number of replications is six for SSR detection in the MISA software (http://pgrc.ipk-gatersleben.de/misa/misa.html, accessed on 12 July 2020). Figure S13 displays an SSR distribution diagram.

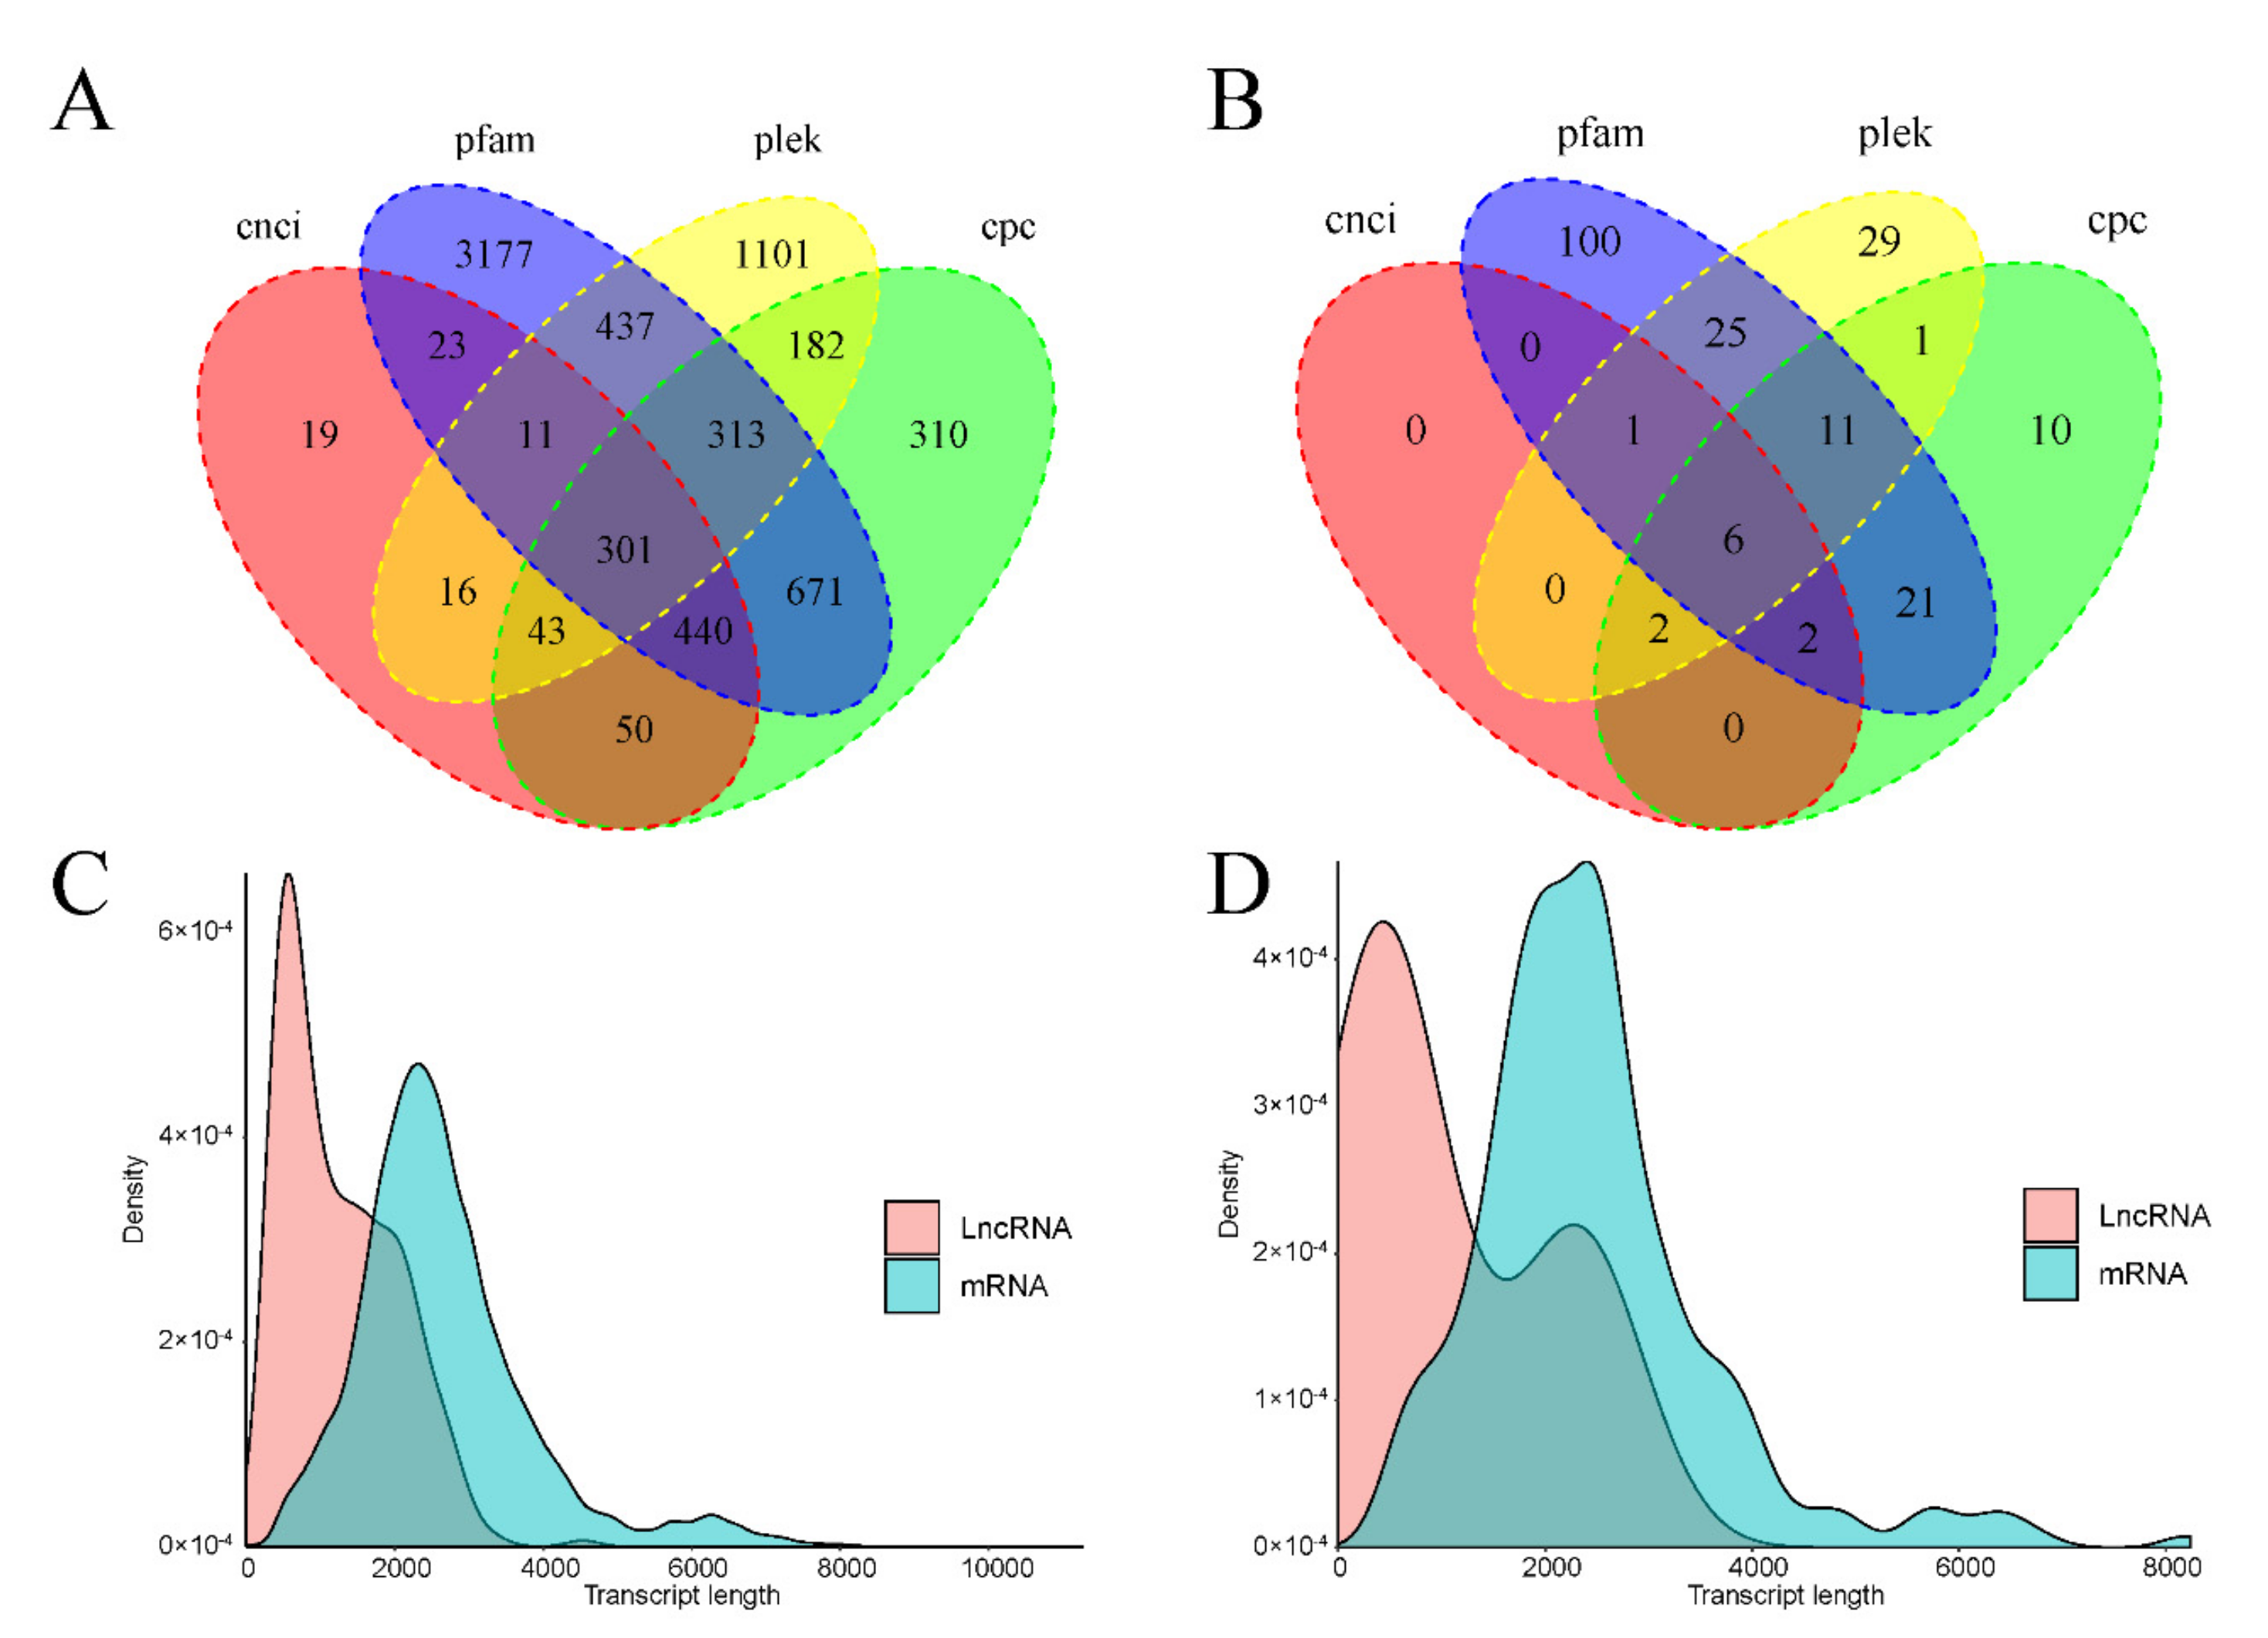
3.5.4. LncRNA Prediction

LncRNA (long non-coding RNA) is a class of RNA molecules with transcripts over 200 nt long that do not encode proteins. Due to the limitation of the library construction principle, we could only obtain lncRNA containing a poly(A) tail. We used CNCI, CPC2, Pfam and PLEK to predict the coding potential of the unigenes. The number of noncoding unigenes predicted by each software was plotted into a Venn diagram displaying the numbers of common and unique LncRNAs predicted by each method (Figure 4). The length distribution density of mRNA and predicted lncRNA was then calculated (Figure 4).

3.6. Gene Expression Analysis

3.6.1. Reference Sequence Alignment

Bowtie2, in RSEM software, was used to compare the clean reads of each sample obtained by Illumina sequencing of unigenes, and the results are shown in Table S6.

3.6.2. Gene Expression Statistics

We used RSEM software to produce statistics of the bowtie2 comparison results, and further obtained a read count value of each sample in comparison to each unigene. Next, we performed FPKM conversion to analyze the gene expression level. The numbers of unigenes at different expression levels and the expression level of a single unigene were counted (Tables S7 and S8).

3.7. Enrichment Analysis of Coral High-Expression Genes

3.7.1. GO Entries

To screen unigenes with high expression levels, an FPKM of greater than 100 was taken as the screening threshold. A directed acyclic graph (DAG) is a graphical result of the GO enrichment analysis. Branches represent the inclusion relationship, and the range of functions defined from top to bottom became smaller and smaller. Generally, the top 10 results of the GO enrichment analysis are selected as the main nodes of a DAG. Each node of a DAG represents a GO term, and the box represents a GO with a top 10 enrichment degree. The depth of color represents the enrichment degree, and the darker the color, the higher the enrichment degree. According to the DAG results, the organonitrogen compound biosynthetic process enriched the most unigenes in the biological process (Figure S14). The ribosomes, cytoplasmic parts, ribonucleoprotein complexes and non-membrane-bound organelles, in the cellular component and structural molecular activity of the molecular function, enriched the most unigenes (Figures S15 and S16, Supplementary Data S4 and Figure 5).

3.7.2. KEGG Entries

The two pathways with the most KEGG enrichment were ribosome and oxidative phosphorylation. The top 20 pathways enriched in KEGG also included mineral absorption, indicating that coral reefs are formed mainly by the expression of genes related to mineral absorption (Figure 6 and Supplementary Data S5).

3.8. Functional Gene Analysis of Zooxanthellae

As the number of unigenes in zooxanthellae was low, to obtain more comprehensive gene function information, GO, KEGG and KOG were used for the functional classification of the unigenes in zooxanthellae. In addition to forming basic cell structures, zooxanthellae also participated in the metabolism, regulation of biological processes and locomotion biological processes (Figure S10B). In the KEGG classification results, besides a human diseases cluster, signal transduction and energy metabolism enriched the most unigenes (Figure S12B). Similar to the KEGG classification results, signal transduction mechanisms, general function prediction alone, posttranslational modification and transcription matched the most unigenes (Figure S11B).

4. Discussion

4.1. Coral Biological Process

In addition to 43 ribosomal proteins, which mainly require organonitrogen compound biosynthesis, there are other proteins with important functions among the 71 enriched genes (Figure 4). ATP synthase produces ATP from ADP (adenosine diphosphate) in the presence of a proton gradient across the membrane, which is generated by electron transport complexes of the respiratory chain [49,50]. Nucleoside diphosphate kinase B plays a major role in the synthesis of nucleoside triphosphates other than ATP [51]. The activating enzyme activates a given amino acid by attaching it to the corresponding transfer ribonucleic acid [52]. Translational elongation factors are proteins that play important roles during the elongation cycle of protein biosynthesis on the ribosome [53]. The barrier to the autointegration factor is involved in multiple pathways, including mitosis, nuclear assembly, viral infection, chromatin and gene regulation and the DNA damage response [54]. The synthesis of organic nitrogen in coral is mainly used to produce protein and ATP.

4.2. Coral Cellular Component

There are 51 enriched genes in ribosomes, of which 42 are ribosomal proteins and the remaining are eukaryotic translation initiation factors and elongation factors involved in translation (Figure 4). These assemble amino acids to form proteins that are essential to carry out cellular functions. The cytoplasmic part and ribonucleoprotein complex also have more than 80% ribosomal proteins. It is noteworthy that aspartic acid genes related to coral skeleton growth are enriched in non-membrane-bounded organelles [55]. Aspartic acid is the most abundant of all amino acids in the coral skeleton and shows a clear seasonal fluctuation.

4.3. Coral Molecular Function

Heat shock factor-binding protein 1 (HSBP1) is enriched in the molecular function. HSBP1 is critical for early embryonic development and potentially affects the Wnt signaling pathway related to coral growth [56]. In molecular function, collagen I alpha 1 (which produces type-I collagen) is the most abundant structural protein of the connective tissues, which is responsible for connecting coral tissues (Figure 4).

4.4. Coral Mineral Absorption

Sodium/potassium-transporting ATPase is the catalytic component of the active enzyme, which catalyzes the hydrolysis of ATP coupled with the exchange of sodium and potassium ions across the plasma membrane; thus, providing the energy for the active transport of various nutrients [57]. Ferritins were identified as highly expressed in each sample. Ferritins are primarily used in organisms to store iron [58]. Iron availability is known to indirectly stimulate heterotrophic microbial production through the release of phytoplankton-derived dissolved organic matter. The expression of ferritin in corals can stimulate zooxanthellae to provide necessary nutrients; thus, promoting the symbiotic relationship between coral and the zooxanthellae.

4.5. Gene Function of Zooxanthellae

Zooxanthellae express proteins to construct their own structures, synthesize nutrients, regulate transcriptional DNA replication, etc., to maintain their own life activities. Proteins that are used to make up the contents of the cell membrane, cell wall and cytoplasm, as well as to sustain cell activity, are expressed in zooxanthellae. Ankyrins are a family of proteins that link the integral membrane proteins to the underlying spectrin–actin cytoskeleton and play key roles in activities such as cell motility, activation, proliferation, contact and the maintenance of specialized membrane domains [59]. Inositol oxygenase 2 is involved in the biosynthesis of UDP-glucuronic acid (Uridine diphosphate-GlcA); thus, providing nucleotide sugars for cell-wall polymers [60]. The ammonium transporter (AMT) plays a key role in NH4+ absorption and transport and is involved in maintaining the Golgi structure [61]. Vinexin is an adaptor protein supposed to play pivotal roles in various cellular events such as cell adhesion, cytoskeletal organization, signaling and gene expression [62]. Endoplasmin is a molecular chaperone that functions in the processing and transport of secreted proteins [63]. Alpha adducin, ADD1, is a ubiquitously expressed protein that is part of the cytoskeleton and may modulate ion transport [64]. These proteins are used to make up the contents of the zooxanthellae’s cell membrane, cell wall and cytoplasm. E3 ubiquitin–protein ligase (BRE1B) plays a central role in histone coding and gene regulation [65]. The COMM domain is a scaffold protein motif domain that is implicated in diverse physiological processes, the function of which may be in part linked to its ability to regulate the ubiquitination of specific cellular proteins [66]. The enhancer of a rudimentary homolog (ERH) has several binding proteins and has been associated with various cellular processes, such as pyrimidine metabolism, cell-cycle progression and transcription control [67]. Soluble starch synthase I (SSI) is a key enzyme in the biosynthesis of plant amylopectin [68]. Under the co-regulation of these proteins, zooxanthellae can complete the regulation of cell growth gene expression, DNA replication, cell polarity development and other related protein expressions, while maintaining the balance of the zooxanthellae population in coral.
Zooxanthellae may also have signaling molecules that regulate the communication between cells and the relationships with corals. The allene oxide synthases may be converted to allene oxides and, subsequently, give rise to plant signaling molecules [69]. The allene oxide synthases may act as pheromones in zooxanthellae to transmit information. The members of the Syndecan family of heparan sulfate proteoglycans play diverse roles in cell adhesion and cell communication by serving as co-receptors for both cell-signaling and extracellular matrix molecules [70].
The sulfite reductase hemoprotein beta-component is a component of the sulfite reductase complex that catalyzes the six-electron reduction in sulfite to sulfide [71]. This is one of several activities required for the biosynthesis of the NLRC3 protein, which is a cytosolic regulator of innate immunity. L-cysteine from sulfate stimulates the inhibitory effect of vitamin D on oxidative stress, IL-8 and McP-1 secretion in monocytes treated with high glucose [72]. Tumor necrosis factor receptor-associated factor (TRAF) proteins play crucial roles in plant development and the response to abiotic stress [73]. Heat shock factor proteins are highly expressed in zooxanthellae, and also expressed in coral transcriptome. Nudix hydrolase 8 may be involved in plant immunity and act as a positive regulator of the defense response through salicylic acid (SA) signaling [74]. Zooxanthellae can also express the heat stress protein, NLRC3 protein, tumor necrosis factor receptor-associated protein and sulfite reductase hemoprotein. Beta-component, L-cysteine, Nudix hydrolase 8, etc., provide the self-regulating ability to cope with environmental change.
Notably, in the zooxanthellae transcriptome, chloroplast-related expression proteins are used for photosynthesis and ATP formation. The peridinin-chlorophyll a-binding protein is a water-soluble antenna for the capture of solar energy in the blue–green range [75]. Chloroplast functioning requires the import of nuclear-encoded proteins from the cytoplasm across the chloroplast double membrane [76]. This is accomplished by two protein complexes, the Toc complex located at the outer membrane and the Tic complex located at the inner membrane. The Toc complex recognizes specific proteins by a cleavable N-terminal sequence and is primarily responsible for translocation through the outer membrane, while the Tic complex translocates the protein through the inner membrane. The chloroplast stem-loop binding protein, meanwhile, binds and cleaves RNA, particularly in stem-loops, and associates with pre-ribosomal particles in chloroplasts. The protein participates in the chloroplast ribosomal RNA metabolism, probably during the final steps of 23S rRNA maturation [77]. Further to this, light-harvesting complex I LH38 proteins are synthesized as a 100 kDa polyprotein that is entirely imported into the chloroplast, where it is, subsequently, cleaved into five mature 20 kDa LH38 proteins [78]. Pyruvate kinase (PK) is the enzyme responsible for the final step of glycolysis, in which phosphoenolpyruvate is converted to pyruvate with the production of ATP [79]. Pyruvate phosphate dikinase (PPDK) is an essential enzyme of C4 photosynthesis in plants, catalyzing the ATP-driven conversion of pyruvate to phosphoenolpyruvate (PEP) [80]. PEPC (phosphoenolpyruvate carboxylase) plays a key role in photosynthesis by C4 and crassulacean acid metabolism in plants, in addition to its many anaplerotic functions [81]. Zooxanthellae capture solar energy in the blue–green range by the peridinin-binding protein, and transport nuclear-encoded proteins into chloroplasts via Tic and Toc to regulate gene expression [82]. ATP is produced through pyruvate kinase and pyruvate phosphate dikinase and carbon is fixed in organic matter for coral growth to generate oxygen. In the dark, PEPC can be used for the photosynthesis.

4.6. Biochemical Connection in the Coral and Algal Symbiont

The generation of ATP and reductant (NADP(H)) in Symbiodinium cell chloroplasts and mitochondria sustains the active uptake and assimilation of nutrients into organic compounds forming the key carbon ‘skeletons’: carbohydrates, proteins, lipids and trace elements, which are important nutrients for coral subsistence [83,84,85,86,87]. Peridinin-binding protein, PEPC and other photosynthesis associated proteins expressed in zooxanthellae transcriptomes can fix carbon and form nutrients for symbiont. Nuclear encoded proteins, Soluble starch synthase I, Vinexin, COMM Domain and the Syndecan family of Heparan sulfate proteoglycans are related to the transport of formed compounds to corals. During the endosymbiotic interaction, a host regulates glycan profiles of the symbiont populations by post-translational modification to produce the required nutrients [88]. Symbiotic Symbiodinium (i.e., in hospite) contained less nitrogen compounds, more lipids and soluble carbohydrates than free-living Symbiodinium, indicating that the excess produced nutrients are to be transported to the coral [89,90]. Muscatine and Hand suggested that labeled metabolites moved from the algae to the tissue of the anemone host after 48 h of exposure but not after 18 h [91] and C14 incorporates into lipids, amino acids, acidic and neutral compounds [92]. Trench has identified the compounds produced by Symbiodinium, and it was shown that glycerol was the major extracellular product and other labeled compounds included alanine, glucose, fumaric acid, succinic acid, glycolic acid and two other unidentified organic acids [93]. However, the hosts controlling the release of metabolites from the symbiont are “host factors” (HF) or “host release factors” (HRF) [93,94]. Gates et al. proposed that the metabolites of host, free amino acids, served as HRFs [86]. The above findings are consistent with our results, and our study confirmed the role of symbiotic zooxanthellae in symbionts at the gene expression level.

5. Conclusions

The gene expression profile of a coral–zooxanthellae holobiont forms the molecular foundation of coral reef biology. In this study, the split gene expression profiles of the reef-building coral P. damicornis and its symbiotic zooxanthellae were acquired through full-length transcriptome sequencing using PacBio Sequel II sequencing technology. GO and KEGG analyses determined that coral has the capacity to regulate life activities, respond to stress and absorb minerals. Besides this, it had an anti-stress ability. Zooxanthellae, meanwhile, could produce signaling molecules for communication. Zooxanthellae also provided for the coral host through energy and nutrition metabolism by photosynthesis.

Supplementary Materials

The following are available online at https://www.mdpi.com/article/10.3390/d13110543/s1, Figure S1: Polymerase reads distribution statistical results, Figure S2: Subreads distribution statistical results, Figure S3: CCS reads distribution statistical results, Figure S4: FLNC distribution statistical results, Figure S5: Consensus reads distribution statistical results, Figure S6: Seven database annotation statistical results, Figure S7: Gene functional annotation Venn diagram, Figure S8: Annotation statistical results of coral full-length transcriptome according to the NR database, Figure S9: Annotation statistical results of zooxanthellae full-length transcriptome according to the NR database, Figure S10: Annotation statistical results of coral and zooxanthellae full-length transcriptome according to the GO database, Figure S11: Annotation statistical results of coral and zooxanthellae full-length transcriptome according to the KOG database, Figure S12: Annotation statistical results of coral and zooxanthellae full-length transcriptome according to the KEGG database, Figure S13: SSR distribution results of coral and zooxanthellae, Figure S14: Gene GO enrichment DAG of biological process, Figure S15: Gene GO enrichment DAG of cellular component, Figure S16: Gene GO enrichment DAG of molecular function, Table S1: Statistical results of polymerase read and subread, Table S2: Statistical results of CCSs and FLNCs, Table S3: Statistical results of unigene number corresponding transcripts, Table S4: Statistical results of sequence length distribution after de-redundancy, Table S5: Statistical annotation results of symbiont, coral and zooxanthellae, Table S6: Reads comparison results of coral and zooxanthellae, Table S7: Different expression level gene number statistical results of coral, Table S8: Different expression level gene number statistical results of zooxanthellae.

Author Contributions

Z.G.: experiment, writing and editing. T.H.: experiment. J.C.: improvement. C.H.: reviewing. Z.L.: supervision. X.L.: project approval. All authors have read and agreed to the published version of the manuscript.

Funding

This work was supported by the open research fund of State Key Laboratory of Bioelectronics, Southeast University (Sklb2021-k02), and open research fund program of Guangxi Key Lab of Mangrove Conservation and Utilization (grant no. GKLMC-202002).

Institutional Review Board Statement

The study was conducted according to the guidelines of the Declaration of Helsinki, and approved by the Ethics Committee of Institutional Animal Care and Use Committee of NMU (protocol code IACUC-1910003 and date of approval is 10 October 2019).

Data Availability Statement

The dataset generated for this study can be found in the National Center for Biotechnology Information (NCBI) (accession number: SAMN16237127) in BioProject: PRJNA544778.

Conflicts of Interest

The authors declare no competing interests.

References

  1. Muscatine, L. Glycerol Excretion by Symbiotic Algae from Corals and Tridacna and Its Control by the Host. Science 1967, 156, 516–519. [Google Scholar] [CrossRef] [PubMed]
  2. Odum, H.T.; Odum, E.P. Trophic Structure and Productivity of a Windward Coral Reef Community on Eniwetok Atoll. Ecol. Monogr. 1955, 25, 291–320. [Google Scholar] [CrossRef]
  3. Costanza, R.; De Groot, R.; Sutton, P.; Van der Ploeg, S.; Anderson, S.J.; Kubiszewski, I.; Farber, S.; Turner, R.K. Changes in the global value of ecosystem services. Glob. Environ. Chang. 2014, 26, 152–158. [Google Scholar] [CrossRef]
  4. Moberg, F.; Folke, C. Ecological goods and services of coral reef ecosystems. Ecol. Econ. 1999, 29, 215–233. [Google Scholar] [CrossRef]
  5. Reimer, J.D.; Kise, H.; Wee, H.B.; Lee, C.L.; Soong, K. Crown-of-thorns starfish outbreak at oceanic Dongsha Atoll in the northern South China Sea. Mar. Biodivers. 2019, 49, 2495–2497. [Google Scholar] [CrossRef]
  6. Foster, N.L.; Attrill, M.J. Changes in coral reef ecosystems as an indication of climate and global change. In Climate Change, 3rd ed.; Elsevier: Amsterdam, The Netherlands, 2021; pp. 427–443. [Google Scholar]
  7. Kleypas, J.A.; Buddemeier, R.W.; Gattuso, J.P. The future of coral reefs in an age of global change. Int. J. Earth Sci. 2001, 90, 426–437. [Google Scholar] [CrossRef]
  8. Benhaim, Y.; Zichermankeren, M.; Rosenberg, E. Temperature-Regulated Bleaching and Lysis of the Coral Pocillopora damicornis by the Novel Pathogen Vibrio coralliilyticus. Appl. Environ. Microbiol. 2003, 69, 4236. [Google Scholar] [CrossRef] [Green Version]
  9. Rosenberg, E.; Ben-Haim, Y. Microbial diseases of corals and global warming. Environ. Microbiol. 2002, 4, 318–326. [Google Scholar] [CrossRef]
  10. Zhou, G.; Tong, H.; Cai, L.; Huang, H. Transgenerational Effects on the Coral Pocillopora damicornis Microbiome under Ocean Acidification. Microb. Ecol. 2021, 68, 1–9. [Google Scholar]
  11. Camaya, A.P. Stages of the symbiotic zooxanthellae-host cell division and the dynamic role of coral nucleus in the partitioning process: A novel observation elucidated by electron microscopy. Coral Reefs 2020, 39, 929–938. [Google Scholar] [CrossRef]
  12. Huang, C.; Leng, D.; Sun, S.; Zhang, X.D. Re-analysis of the coral Acropora digitifera transcriptome reveals a complex lncRNAs-mRNAs interaction network implicated in Symbiodinium infection. BMC Genom. 2019, 20, 48. [Google Scholar] [CrossRef] [Green Version]
  13. Brown, B. Coral bleaching: Causes and consequences. Coral Reefs 1997, 16, S129–S138. [Google Scholar] [CrossRef]
  14. Muscatine, L.; Porter, J.W. Reef corals—Mutualistic symbioses adapted to nutrient-poor environments. Bioscience 1977, 27, 454–460. [Google Scholar] [CrossRef]
  15. Kuzminov, F.I.; Brown, C.M.; Fadeev, V.V.; Gorbunov, M.Y. Effects of metal toxicity on photosynthetic processes in coral symbionts, Symbiodinium spp. J. Exp. Mar. Biol. Ecol. 2013, 446, 216–227. [Google Scholar] [CrossRef]
  16. Rowan, R.; Knowlton, N.; Baker, A.; Jara, J.H. Landscape ecology of algal symbionts creates variation in episodes of coral bleaching. Nature 1997, 388, 265–269. [Google Scholar] [CrossRef]
  17. LaJeunesse, T. Diversity and community structure of symbiotic dinoflagellates from Caribbean coral reefs. Mar. Biol. 2002, 141, 387–400. [Google Scholar]
  18. Al-Sofyani, A.A.; Floos, Y. Effect of temperature on two reef-building corals Pocillopora damicornis and P. verrucosa in the red sea. Oceanologia 2013, 55, 917–935. [Google Scholar] [CrossRef] [Green Version]
  19. Nielsen, D.A.; Petrou, K.; Gates, R.D. Coral bleaching from a single cell perspective. ISME J. 2018, 12, 1558–1567. [Google Scholar] [CrossRef]
  20. Jiang, L.; Guo, M.-L.; Zhang, F.; Zhang, Y.-Y.; Zhou, G.-W.; Lei, X.-M.; Yuan, X.-C.; Sun, Y.-F.; Yuan, T.; Cai, L.; et al. Impacts of elevated temperature and pCO2 on the brooded larvae of Pocillopora damicornis from Luhuitou reef, China: Evidence for local acclimatization. Coral Reefs 2020, 39, 331–344. [Google Scholar] [CrossRef]
  21. Rosado, P.M.; Leite, D.C.D.A.; Duarte, G.A.S.; Chaloub, R.M.; Jospin, G.; da Rocha, U.N.; Saraiva, J.P.; Dini-Andreote, F.; Eisen, J.A.; Bourne, D.G.; et al. Marine probiotics: Increasing coral resistance to bleaching through microbiome manipulation. ISME J. 2019, 13, 921–936. [Google Scholar] [CrossRef] [Green Version]
  22. LaJeunesse, T.C. Zooxanthellae. Curr. Biol. 2020, 30, R1110–R1113. [Google Scholar] [CrossRef]
  23. Vidal-Dupiol, J.; Zoccola, D.; Tambutté, E.; Grunau, C.; Cosseau, C.; Smith, K.M.; Freitag, M.; Dheilly, N.M.; Allemand, D.; Tambutté, S. Genes related to ion-transport and energy production are upregulated in response to CO2-driven pH decrease in corals: New insights from transcriptome analysis. PLoS ONE 2013, 8, e58652. [Google Scholar] [CrossRef] [Green Version]
  24. Sampayo, E.M.; Franceschinis, L.; Hoegh-Guldberg, O.; Dove, S. Niche partitioning of closely related symbiotic dinoflagellates. Mol. Ecol. 2010, 16, 3721–3733. [Google Scholar] [CrossRef]
  25. Zhou, Z.; Yu, X.; Tang, J.; Zhu, Y.; Chen, G.; Guo, L.; Huang, B. Dual recognition activity of a rhamnose-binding lectin to pathogenic bacteria and zooxanthellae in stony coral Pocillopora damicornis. Dev. Comp. Immunol. 2017, 70, 88–93. [Google Scholar] [CrossRef]
  26. Tombácz, D.; Sharon, D.; Oláh, P.; Csabai, Z.; Snyder, M.; Boldogkői, Z. Strain Kaplan of Pseudorabies Virus Genome Sequenced by PacBio Single-Molecule Real-Time Sequencing Technology. Genome Announc. 2014, 2, e00628-14. [Google Scholar] [CrossRef] [Green Version]
  27. Chin, C.S.; Alexander, D.H.; Marks, P.; Klammer, A.A.; Korlach, J. Nonhybrid, finished microbial genome assemblies from long-read smrt sequencing data. Nat. Methods 2013, 10, 563. [Google Scholar] [CrossRef]
  28. Chen, S.; Qiu, G.; Yang, M. SMRT sequencing of full-length transcriptome of seagrasses Zostera japonica. Sci. Rep. 2019, 9, 14537. [Google Scholar] [CrossRef]
  29. van Dijk, E.L.; Jaszczyszyn, Y.; Naquin, D.; Thermes, C. The third revolution in sequencing technology. Trends Genet. 2018, 34, 666–681. [Google Scholar] [CrossRef]
  30. Lu, H.; Giordano, F.; Ning, Z. Oxford Nanopore MinION sequencing and genome assembly. Genom. Proteom. Bioinform. 2016, 14, 265–279. [Google Scholar] [CrossRef] [Green Version]
  31. Rhoads, A.; Au, K.F. PacBio sequencing and its applications. Genom. Proteom. Bioinform. 2015, 13, 278–289. [Google Scholar] [CrossRef] [Green Version]
  32. Chin, C.-S.; Peluso, P.; Sedlazeck, F.J.; Nattestad, M.; Concepcion, G.T.; Clum, A.; Dunn, C.; Omalley, R.; Figueroa-Balderas, R.; Morales-Cruz, A.; et al. Phased diploid genome assembly with single-molecule real-time sequencing. Nat. Methods 2016, 13, 1050–1054. [Google Scholar] [CrossRef] [PubMed] [Green Version]
  33. Salmela, L.; Rivals, E. LoRDEC: Accurate and efficient long read error correction. Bioinformatics 2014, 30, 3506–3514. [Google Scholar] [CrossRef] [PubMed]
  34. Fu, L.; Niu, B.; Zhu, Z.; Wu, S.; Li, W. CD-HIT: Accelerated for clustering the next-generation sequencing data. Bioinformatics 2012, 28, 3150–3152. [Google Scholar] [CrossRef] [PubMed]
  35. Li, W.; Jaroszewski, L.; Godzik, A. Tolerating some redundancy significantly speeds up clustering of large protein databases. Bioinformatics 2002, 18, 77–82. [Google Scholar] [CrossRef]
  36. Tatusov, R.L.; Fedorova, N.D.; Jackson, J.D.; Jacobs, A.R.; Kiryutin, B.; Koonin, E.V.; Krylov, D.M.; Mazumder, R.; Mekhedov, S.L.; Nikolskaya, A.N.; et al. The COG database: An updated version includes eukaryotes. BMC Bioinform. 2003, 4, 41. [Google Scholar] [CrossRef] [Green Version]
  37. Bairoch, A.; Apweiler, R. The SWISS-PROT protein sequence database and its supplement TrEMBL in 2000. Nucleic Acids Res. 2000, 28, 45–48. [Google Scholar] [CrossRef]
  38. Kanehisa, M.; Goto, S.; Kawashima, S.; Okuno, Y.; Hattori, M. The KEGG resource for deciphering the genome. Nucleic Acids Res. 2004, 32, 277–280. [Google Scholar] [CrossRef] [Green Version]
  39. Ashburner, M.; Ball, C.A.; Blake, J.A.; Botstein, D.; Cherry, J.M. Gene ontology: Tool for the unification of biology. The gene ontology consortium. Nat. Genet. 2000, 25, 25–29. [Google Scholar] [CrossRef] [Green Version]
  40. Altschul, S.F.; Gish, W.; Miller, W.; Myers, E.W.; Lipman, D.J. Basic local alignment search tool. J. Mol. Biol. 1990, 215, 403–410. [Google Scholar] [CrossRef]
  41. Shimizu, K.; Adachi, J.; Muraoka, Y. ANGLE: A sequencing errors resistant program for predicting protein coding regions in unfinished cDNA. J. Bioinform. Comput. Biol. 2006, 4, 649–664. [Google Scholar] [CrossRef]
  42. Zheng, Y.; Jiao, C.; Sun, H.; Rosli, H.; Pombo, M.A.; Zhang, P.; Banf, M.; Dai, X.; Martin, G.; Giovannoni, J.J.; et al. ITAK: A program for genome-wide prediction and classification of plant transcription factors, transcriptional regulators, and protein kinases. Molecular Plant 2016, 9, 1667–1670. [Google Scholar] [CrossRef] [Green Version]
  43. Zhang, H.-M.; Liu, T.; Liu, C.-J.; Song, S.; Zhang, X.; Liu, W.; Jia, H.; Xue, Y.; Guo, A.-Y. Animaltfdb 2.0: A resource for expression, prediction and functional study of animal transcription factors. Nucleic Acids Res. 2015, 1, D76. [Google Scholar] [CrossRef]
  44. Thiel, T.; Michalek, W.; Varshney, R.; Graner, A. Exploiting EST databases for the development and characterization of gene-derived SSR-markers in barley (Hordeum vulgare L.). Theor. Appl. Genet. 2003, 106, 411–422. [Google Scholar] [CrossRef]
  45. Sun, L.; Luo, H.; Bu, D.; Zhao, G.; Yu, K.; Zhang, C.; Liu, Y.; Chen, R.; Zhao, Y. Utilizing Sequence Intrinsic Composition to Classify Protein-Coding and Long Non-Coding Transcripts. Nucleic Acids Res. 2013, 17, e166. [Google Scholar] [CrossRef]
  46. Aimin, L.; Junying, Z.; Zhongyin, Z. PLEK: A Tool for Predicting Long Non-Coding Rnas and Messenger Rnas Based on an Improved K-Mer Scheme. BMC Bioinform. 2014, 15, 311. [Google Scholar]
  47. Kang, Y.J.; Yang, D.C.; Kong, L.; Hou, M.; Meng, Y.Q.; Wei, L.; Gao, G. CPC2: A fast and accurate coding potential calculator based on sequence intrinsic features. Nucleic Acids Res. 2017, 45, W12–W16. [Google Scholar] [CrossRef] [Green Version]
  48. Li, B.; Dewey, C.N. RSEM: Accurate transcript quantification from RNA-Seq data with or without a reference genome. BMC Bioinform. 2011, 12, 323. [Google Scholar] [CrossRef] [Green Version]
  49. Bu, D.; Luo, H.; Huo, P.; Wang, Z.; Zhang, S.; He, Z.; Wu, Y.; Zhao, L.; Liu, J.; Guo, J.; et al. KOBAS-i: Intelligent prioritization and exploratory visualization of biological functions for gene enrichment analysis. Nucleic Acids Res. 2021, 49, W317–W325. [Google Scholar] [CrossRef]
  50. Boyer, P.D. The atp synthase—A splendid molecular machine. Annu. Rev. Biochem. 1997, 66, 717–749. [Google Scholar] [CrossRef] [Green Version]
  51. Stock, D.; Leslie, A.G.; Walker, J.E. Molecular architecture of the rotary motor in atp synthase. Science 1999, 286, 1700–1705. [Google Scholar] [CrossRef] [Green Version]
  52. Karlsson, A.; Mesnildrey, S.; Xu, Y.; Moréra, S.; Janin, J.; Véron, M. Nucleoside diphosphate kinase. J. Biol. Chem. 1996, 271, 19928–19934. [Google Scholar] [CrossRef] [Green Version]
  53. Kurakawa, T.; Ueda, N.; Maekawa, M.; Kobayashi, K.; Kojima, M.; Nagato, Y.; Sakakibara, H.; Kyozuka, J. Direct control of shoot meristem activity by a cytokinin-activating enzyme. Nature 2007, 445, 652–655. [Google Scholar] [CrossRef]
  54. Ramakrishnan, V. Ribosome structure and the mechanism of translation. Cell 2002, 108, 557–572. [Google Scholar] [CrossRef] [Green Version]
  55. Jamin, A.; Wiebe, M.S. Barrier to autointegration factor (banf1): Interwoven roles in nuclear structure, genome integrity, innate immunity, stress responses and progeria. Curr. Opin. Cell Biol. 2015, 34, 61–68. [Google Scholar] [CrossRef] [Green Version]
  56. Nyberg, J.; Csapó, J.; Malmgren, B.A. Changes in the d- and l-content of aspartic acid, glutamic acid, and alanine in a scleractinian coral over the last 300 years. Org. Geochem. 2001, 32, 623–632. [Google Scholar] [CrossRef]
  57. Hsu, S.F.; Lai, H.C.; Jinn, T.L. Cytosol-localized heat shock factor-binding protein, athsbp, functions as a negative regulator of heat shock response by translocation to the nucleus and is required for seed development in arabidopsis. Plant Physiol. 2010, 153, 773–784. [Google Scholar] [CrossRef] [Green Version]
  58. Ogawa, H.; Shinoda, T.; Cornelius, F.; Toyoshima, C. Crystal structure of the sodium-potassium pump (na+, k+-atpase) with bound potassium and ouabain. Proc. Natl. Acad. Sci. USA 2009, 106, 13742–13747. [Google Scholar] [CrossRef] [Green Version]
  59. Arosio, P.; Ingrassia, R.; Cavadini, P. Ferritins: A family of molecules for iron storage, antioxidation and more. Biochim. Biophys. Acta Gen. Subj. 2009, 1790, 589–599. [Google Scholar] [CrossRef]
  60. Bennett, V.; Otto, E.; Davis, J.; Davis, L.; Kordeli, E. Chapter 5 ankyrins: A family of proteins that link diverse membrane proteins to the spectrin skeleton. Curr. Top. Membr. 1991, 38, 65–77. [Google Scholar]
  61. Kanter, U.; Usadel, B.; Guerineau, F.; Yong, L.; Pauly, M.; Tenhaken, R. The inositol oxygenase gene family of arabidopsis is involved in the biosynthesis of nucleotide sugar precursors for cell-wall matrix polysaccharides. Planta 2005, 221, 243–254. [Google Scholar] [CrossRef] [Green Version]
  62. Ludewig, U.; von Wirén, N.; Frommer, W.B. Uniport of nh by the root hair plasma membrane Ammonium Transporter LeAMT1;1. J. Biol. Chem. 2002, 277, 13548–13555. [Google Scholar] [CrossRef] [PubMed] [Green Version]
  63. Mizutani, K.; Ito, H.; Iwamoto, I.; Morishita, R.; Deguchi, T.; Nozawa, Y.; Asano, T.; Nagata, K.-I. Essential roles of erk-mediated phosphorylation of vinexin in cell spreading, migration and anchorage-independent growth. Oncogene 2007, 26, 7122. [Google Scholar] [CrossRef] [PubMed] [Green Version]
  64. Koch, G.; Smith, M.J.; Macer, D.; Webster, P.; Mortara, R.A. Endoplasmic reticulum contains a common, abundant calcium-binding glycoprotein, endoplasmin. J. Cell Sci. 1986, 86, 217–232. [Google Scholar] [CrossRef] [PubMed]
  65. Tripodi, G.; Valtorta, F.; Torielli, L.; Chieregatti, E.; Bianchi, G. Hypertension-associated point mutations in the adducin alpha and beta subunits affect actin cytoskeleton and ion transport. J. Clin. Investig. 1996, 97, 2815–2822. [Google Scholar] [CrossRef] [Green Version]
  66. Hellmann, H. Plant development: Regulation by protein degradation. Science 2002, 297, 793–797. [Google Scholar] [CrossRef] [Green Version]
  67. Dumoulin, B.; Ufer, C.; Stehling, S.; Heydeck, D.; Kuhn, H.; Sofi, S. Identification of the COMM-domain containing protein 1 as specific binding partner for the guanine-rich RNA sequence binding factor 1. Biochim. Biophys. Acta Gen. Subj. 2020, 1864, 129678. [Google Scholar] [CrossRef]
  68. Weng, M.-T.; Tung, T.-H.; Lee, J.-H.; Wei, S.-C.; Lin, H.-L.; Huang, Y.-J.; Wong, J.-M.; Luo, J.; Sheu, J.-C. Enhancer of rudimentary homolog regulates DNA damage response in hepatocellular carcinoma. Sci. Rep. 2015, 5, 9357. [Google Scholar] [CrossRef] [Green Version]
  69. Wang, Y.; Li, Y.; Zhang, H.; Zhai, H.; Liu, Q.; He, S. A soluble starch synthase I gene, IbSSI, alters the content, composition, granule size and structure of starch in transgenic sweet potato. Sci. Rep. 2017, 7, 2315. [Google Scholar] [CrossRef] [Green Version]
  70. Tijet, N.; Brash, A.R. Allene oxide synthases and allene oxides. Prostaglandins Other Lipid Mediat. 2002, 68, 423–431. [Google Scholar] [CrossRef]
  71. Kim, C.W.; Goldberger, O.A.; Gallo, R.L.; Bernfield, M. Members of the syndecan family of heparan sulfate proteoglycans are expressed in distinct cell-, tissue-, and development-specific patterns. Mol. Biol. Cell 1994, 5, 797–805. [Google Scholar] [CrossRef] [Green Version]
  72. Gruez, A.; Pignol, D.; Zeghouf, M.; Covès, J.; Fontecave, M.; Ferrer, J.-L.; Fontecilla-Camps, J.C. Four crystal structures of the 60 kda flavoprotein monomer of the sulfite reductase indicate a disordered flavodoxin-like module. J. Mol. Biol. 2000, 299, 199–212. [Google Scholar] [CrossRef]
  73. Salman, Z.K.; Refaat, R.; Selima, E.; Sarha, A.E.; Ismail, M.A. The combined effect of metformin and l-cysteine on inflammation, oxidative stress and insulin resistance in streptozotocin-induced type 2 diabetes in rats. Eur. J. Pharmacol. 2013, 714, 448–455. [Google Scholar] [CrossRef]
  74. Bao, Y.; Wang, C.; Jiang, C.; Pan, J.; Zhang, G.; Liu, H.; Zhang, H. The tumor necrosis factor receptor-associated factor (TRAF)-like family protein SEVEN IN ABSENTIA 2 (SINA2) promotes drought tolerance in an ABA-dependent manner in Arabidopsis. New Phytol. 2014, 202, 174–187. [Google Scholar] [CrossRef]
  75. Pedro, F.J.; Xinnian, D.; Devarenne, T.P. Functional characterization of a nudix hydrolase atnudx8 upon pathogen attack indicates a positive role in plant immune responses. PLoS ONE 2014, 9, e114119. [Google Scholar]
  76. Jing, J.; Hao, Z.; Kang, Y.; Bina, D.; Lo, C.S.; Blankenship, R.E. Characterization of the peridinin–chlorophyll a-protein complex in the dinoflagellate Symbiodinium. Biochim. Biophys. Acta 2012, 1817, 983–989. [Google Scholar] [CrossRef] [Green Version]
  77. Brown, E.C.; Somanchi, A.; Mayfield, S.P. Interorganellar crosstalk: New perspectives on signaling from the chloroplast to the nucleus. Genome Biol. 2001, 2, 1–4. [Google Scholar]
  78. Bollenbach, T.J.; Sharwood, R.; Gutierrez, R.; Lerbs-Mache, S.; Stern, D.B. The RNA-binding proteins CSP41a and CSP41b may regulate transcription and translation of chloroplast-encoded RNAs in Arabidopsis. Plant Mol. Biol. 2009, 69, 541–552. [Google Scholar] [CrossRef]
  79. Meyer, T.E. Evolution of photosynthetic reaction centers and light harvesting chlorophyll proteins. Biosystems 1994, 33, 167–175. [Google Scholar] [CrossRef]
  80. Alves-Filho, J.C.; Pålsson-McDermott, E.M. Pyruvate Kinase M2: A Potential Target for Regulating Inflammation. Front. Immunol. 2016, 7, 145. [Google Scholar] [CrossRef] [Green Version]
  81. Minges, A.; Groth, G. Small-molecule inhibition of pyruvate phosphate dikinase targeting the nucleotide binding site. PLoS ONE 2017, 12, e0181139. [Google Scholar] [CrossRef] [Green Version]
  82. Kai, Y.; Matsumura, H.; Izui, K. Phosphoenolpyruvate carboxylase: Three-dimensional structure and molecular mechanisms. Arch. Biochem. Biophys. 2013, 414, 170–179. [Google Scholar] [CrossRef]
  83. Kodaimati Mohamad, S.; Lian, S.; Schatz George, C.; Weiss Emily, A. Energy transfer-enhanced photocatalytic reduction of protons within quantum dot light-harvesting–catalyst assemblies. Proc. Natl. Acad. Sci. USA 2018, 115, 201805625. [Google Scholar] [CrossRef] [Green Version]
  84. Suggett, D.J.; Warner, M.E.; Leggat, W. Symbiotic Dinoflagellate Functional Diversity Mediates Coral Survival under Ecological Crisis. Trends Ecol. Evol. 2017, 32, 735–745. [Google Scholar] [CrossRef]
  85. Zhang, Y.; Ip, J.C.; Xie, J.Y.; Yeung, Y.H.; Sun, Y.; Qiu, J.W. Host-symbiont transcriptomic changes during natural bleaching and recovery in the leaf coral Pavona decussata. Sci. Total Environ. 2021, 806, 150656. [Google Scholar]
  86. Gates, R.D.; Hoegh-Guldberg, O.; McFall-Ngai, M.J.; Bil, K.Y.; Muscatine, L. Free amino acids exhibit anthozoan “host factor” activity: They induce the release of photosynthate from symbiotic dinoflagellates in vitro. Proc. Natl. Acad. Sci. USA 1995, 92, 7430–7434. [Google Scholar] [CrossRef] [Green Version]
  87. Gates, R.D.; Bil, K.Y.; Muscatine, L. The influence of an anthozoan “host factor” on the physiology of a symbiotic dinoflagellate. J. Exp. Mar. Biol. Ecol. 1999, 232, 241–259. [Google Scholar] [CrossRef]
  88. Cook, C.B.; Davy, S.K. Are free amino acids responsible for the ‘host factor’ effects on symbiotic zooxanthellae in extracts of host tissue? Hydrobiologia 2001, 461, 71–78. [Google Scholar] [CrossRef]
  89. Muscatine, L.; Karakashian, S.J.; Karakashian, M.W. Soluble Extracellular Products of Algae Symbiotic with a Ciliate, a Sponge and a Mutant Hydra. Comp. Biochem. Physiol. 1967, 20, 1–6. [Google Scholar] [CrossRef]
  90. Muscatine, L.; Hand, C. Direct Evidence for the Transfer of Materials from Symbiotic Algae to the Tissues of a Coelenterate. Proc. Natl. Acad. Sci. USA 1958, 44, 1259–1263. [Google Scholar] [CrossRef] [Green Version]
  91. Huang, K.-J.; Huang, Z.-Y.; Lin, C.-Y.; Wang, L.-H.; Chou, P.-H.; Chen, C.-S.; Li, H.-H. Generation of clade- and symbiont-specific antibodies to characterize marker molecules during Cnidaria-Symbiodinium endosymbiosis. Sci. Rep. 2017, 7, 5488. [Google Scholar] [CrossRef]
  92. Jiang, P.L.; Pasaribu, B.; Chen, C.S. Nitrogen-deprivation elevates lipid levels in Symbiodinium spp. by lipid droplet accumulation: Morphological and compositional analyses. PLoS ONE 2014, 9, e87416. [Google Scholar] [CrossRef] [PubMed] [Green Version]
  93. Goreau, T.F.; Goreau, N.I.; Yonge, C.M. On the utilization of photosynthetic products from zooxanthellae and of a dissolved amino acid in Tridacna maxima f. elongata (Mollusca: Bivalvia). J. Zool. 2010, 169, 417–454. [Google Scholar] [CrossRef]
  94. Trench, R.K. The Physiology and Biochemistry of Zooxanthellae Symbiotic with Marine Coelenterates. II. Liberation of Fixed 14C by Zooxanthellae in Vitro. Proc. R. Soc. Lond. B Biol. Sci. 1971, 177, 237–250. [Google Scholar]
Figure 1. Statistical results of consensus reads’ distribution. The horizontal axis represents length of read and the vertical axis the read number.
Diversity 13 00543 g001
Figure 2. All Databases annotation statistical results. (A,B) are annotations’ statistical results for coral and zooxanthellae, respectively. The horizontal axis represents the database and the vertical axis the number of genes annotated to the database. (C,D) are annotation Venn diagrams of coral and zooxanthellae, respectively. The sum of the numbers in each large circle represents the number of transcripts annotated by the database, and the overlapping part of the circles represents the transcript annotations shared between databases.
Diversity 13 00543 g002
Figure 3. CDS length distribution and TF analysis in coral and zooxanthellae. (A,C) are CDS length distribution statistic results of coral and zooxanthellae, respectively. The horizontal axis represents the length of the predicted CDS and the vertical axis the number of CDS transcripts. (B,D) are the transcription factor analysis results of coral and zooxanthellae, respectively. The horizontal axis indicates different transcription factor families and the vertical axis the TF number.
Diversity 13 00543 g003
Figure 4. LncRNA analysis results of coral and zooxanthellae. (A,B) are LncRNA prediction Venn diagrams of coral and zooxanthellae, respectively. The sum of the numbers in each large circle represents the number of transcripts annotated by the database, and the part of the circle that overlaps represents the number of transcripts shared between the databases. (C,D) are the LncRNA and mRNA length distribution results of coral and zooxanthellae, respectively. The horizontal axis represents the transcript length and the vertical axis the density.
Diversity 13 00543 g004
Figure 5. Highly expressed GO enrichment of coral. The green, orange and gray bars represent the biological process, molecular function and cellular component, respectively. The horizontal axis shows the number of genes and the vertical axis the GO term.
Diversity 13 00543 g005
Figure 6. Highly expressed gene KEGG scatter plot of coral. The horizontal axis represents the rich factor and the vertical axis the KEGG term. The circle size represents the number of genes, and the color from purple to red indicates a q-value from 1 to 0.
Diversity 13 00543 g006
Table 1. Statistical results of full-length transcript classification.
Statistical ItemsResults
CCS number602,185
CCS mean num passes8
NFL116,774
FL485,411
FLNC463,766
FLC20,569
FLNC mean length2476
FLNC/CCS77.01%
Table 2. Statistical results of length distribution before and after transcript correction.
ItemsTypeResults
Total nucleotidesBefore correct98,097,845
Total nucleotidesAfter correct98,043,063
Total numberBefore correct38,663
Total numberAfter correct38,663
Mean lengthBefore correct2538
Mean lengthAfter correct2536
Min lengthBefore correct65
Min lengthAfter correct65
Max lengthBefore correct11,283
Max lengthAfter correct11,283
N50Before correct2699
N50After correct2699
N90Before correct1741
N90After correct1741
Table 3. Statistical results of length frequency distribution before and after transcript de-redundancy.
Transcripts Length Interval<500 bp500–1 kbp1–2 kbp2–3 kbp>3 kbpTotal
Number of transcripts324146010,23417,275937038,663
Number of genes18389154489445644122,408
Publisher’s Note: MDPI stays neutral with regard to jurisdictional claims in published maps and institutional affiliations.

