Article

Spatial and Temporal Patterns in Macroherbivore Grazing in a Multi-Species Tropical Seagrass Meadow of the Great Barrier Reef

by
Abigail L. Scott
1,2,*,
Paul H. York
1 and
Michael A. Rasheed
1,2
1
Centre for Tropical Water and Aquatic Ecosystem Research (TropWATER), James Cook University, Cairns, QLD 4870, Australia
2
College of Science and Engineering, James Cook University, Cairns, QLD 4870, Australia
*
Author to whom correspondence should be addressed.
Diversity 2021, 13(1), 12; https://doi.org/10.3390/d13010012
Submission received: 19 November 2020 / Revised: 19 December 2020 / Accepted: 28 December 2020 / Published: 2 January 2021
(This article belongs to the Special Issue Biodiversity in Seagrass Ecosystems)

Abstract

:
Macroherbivory is an important process in seagrass meadows worldwide; however, the impact of macroherbivores on seagrasses in the Great Barrier Reef (GBR) has received little attention. We used exclusion cages and seagrass tethering assays to understand how the intensity of macroherbivory varies over space and time in the seagrass meadows around Green Island (Queensland), and what impact this has on overall meadow structure. Rates of macroherbivory were comparatively low, between 0.25–44% of daily seagrass productivity; however, rates were highly variable over a one-year period, and among sites. Loss of seagrass material to macroherbivory was predominantly due to fish; however, urchin herbivory was also taking place. Macroherbivory rates were of insufficient intensity to impact overall meadow structure. No macroherbivory events were identified on video cameras that filmed in the day, indicating that feeding may be occurring infrequently in large shoals, or at night. While relatively low compared to some meadows, seagrass macroherbivory was still an important process at this site. We suggest that in this highly protected area of the GBR, where the ecosystem and food webs remain largely intact, macroherbivory was maintained at a low level and was unlikely to cause the large-scale meadow structuring influence that can be seen in more modified seagrass systems.

1. Introduction

Seagrasses are some of the most productive ecosystems on the planet, capable of turning over their entire standing crop in as little as three to four days for some tropical meadows [1]. This productivity supports diverse food webs through detrital pathways and direct consumption by herbivores, as well as accumulation of detritus in sediments which acts as a carbon sink or is exported to adjacent ecosystems [2,3]. On a global scale, consumption of seagrass material is relatively low; however, in the tropics, grazing rates can be much higher [4]. Grazing of seagrasses by megaherbivores (e.g., green turtles and dugong) is an important process in tropical regions, such as the Great Barrier Reef (GBR), and can have large-scale impacts on seagrass meadows [5,6,7]. However, we know less about the impacts of macroherbivores (e.g., fish and urchins) on GBR seagrass habitats.
Rates of macroherbivory in seagrass meadows can be very high, in some locations exceeding the daily productivity of the meadow. In temperate and subtropical meadows, herbivorous fish can consume all of the daily seagrass productivity, and in peak grazing events, they can consume over 10 times the daily productivity [8,9,10]. In tropical seagrass meadows, estimates of macroherbivore seagrass consumption range from as little as 3–26% of daily seagrass productivity [11,12,13,14], up to 10 times daily productivity at times [15], with grazing dominated by herbivorous fish [11,12]. Urchin herbivory can be high in temperate environments, where urchins can consume over 80% of aboveground seagrass biomass [16,17]. Less is known about the role of urchin grazing in tropical meadows, but aggregations of urchins can cause large declines in slow growing tropical seagrasses, and urchin herbivory can exceed fish herbivory in some tropical meadows [18,19].
The intensity of seagrass grazing by macroherbivores varies over space and time. Temporal changes in both seagrass productivity and macroherbivore grazing mean that proportional losses of seagrass to macroherbivory can vary seasonally, and losses to macroherbivory are greatest when seagrass productivity is at its lowest [9,10,20]. Seasonal changes mean macroherbivores can impact meadow establishment and recovery to different degrees at certain times of year [21,22]. Macroherbivory also changes on local and landscape spatial scales. This variability can be due to location-specific factors, e.g., sheltered sites can have five times the losses from macroherbivory than meadows exposed to prevailing winds [23]. More complex seascapes can also have higher populations of macroherbivores with increased rates of macroherbivory [15], e.g., scarid fish grazing can double in seagrass meadows that are in proximity to mangroves [24] and reef associated fish can feed in halos around reefs [25,26].
In some locations, the results of macroherbivore grazing can lead to substantial changes in seagrass meadow structure, particularly when grazers are present in large numbers, aggregate in groups, or where top-down controls are removed. High macroherbivore grazing rates can result in seagrass meadows with higher shoot densities [27], less aboveground seagrass material [17,27], lower rhizome sugar content [27], losses of belowground material [17,28] and lower flowering intensity [27]. When grazing reduces primary production and canopy height, macroherbivores can reduce meadow function, particularly when grazing on already fragmented seagrass meadows or when large aggregations of macroherbivores overgraze meadows [29,30]. These losses in meadow function due to herbivory can have implications for the ecosystem services delivered by a seagrass meadow [17,28,29,31,32]. Seagrass grazing by fish can modify the meadow to such an extent that it is a less valuable habitat and foraging ground for other macroherbivores. For example, macroherbivory can reduce meadow structure and increase predation risk for urchins [33,34].
In multi-species seagrass meadows, macroherbivores may show a preference for a given species of seagrass and can impact establishment of fast-growing species [14,21,35,36]. In some cases, macroherbivores can show a grazing preference based on nutritional characteristics of the plant [8,35,37,38,39], but this is not always the case [9], and the availability of seagrass can be the most important factor influencing grazing [15].
The GBR consists of a network of Marine Protected Areas (MPAs) that offer varying levels of protection to habitats and fauna, from exclusive no-take zones, through to areas where most forms of fishing are allowed [40]. We know that MPAs can have a strong influence on macroherbivores through modification of top-down controls that can result in both positive and negative outcomes for seagrass meadows that may differ for fish and urchins [21,27,41,42,43]. Therefore, the potential outcomes from the pressures of macroherbivory for seagrass meadows in the GBR are likely to be variable. For example, where coastal seagrass meadows in the GBR have been heavily impacted by turtle and dugong grazing, macroherbivory was found to have an insignificant role in further influencing meadow characteristics [7]. However, our understanding of other meadow types and locations in the GBR is limited, especially for areas that have the highest level of protection. This is surprising given the focus on macroherbivores in reef systems, where they play a key role in maintaining GBR reef resilience and promoting coral recovery [44,45,46,47].
In this study we examine patterns of macroherbivory over a year in a multi-species tropical seagrass meadow in Green Island (Queensland, Australia), one of the oldest no-take MPAs on the GBR [40,48]. Green Island is home to a diverse fish and invertebrate community, many of which are herbivorous or omnivorous, with a diverse piscivorous fish population also present [49]. We established macroherbivore exclusion experiments to test whether macroherbivory at this site was having an influence on seagrass meadow structure. We also used seagrass tethering assays to test how macroherbivory varies over space and time around Green Island and used tethers and meadow cores to test whether macroherbivores showed a preference for a given species of seagrass in this multi-species meadow.

2. Materials and Methods

2.1. Study Site

Experiments were conducted at three sites within intertidal and shallow subtidal seagrass meadows around Green Island, a vegetated coral cay 27 km off the coast of Cairns, Queensland, Australia (Figure 1). Green Island is one of the oldest MPAs on the GBR and was first protected in 1937 then declared a Marine National Park in 1974; since then, no fishing has been permitted around the island [40,48]. The seagrass here is diverse, with 10 species found around the Island [50,51], and a range of macroherbivores. There are four species of siganid found around Green Island and adults of both shoaling species present, Siganus fuscescens and Siganus lineatus, have been shown to feed on seagrass as an important part of their diet [52]. Visual census surveys around Green Island have found 14 species of parrotfish and herbivorous surgeonfish [49]. Sea urchins are also present in the meadows at Green Island, Diadema spp. have been recorded around the coral reef [48], and the authors have observed Tripneustes gratilla in the seagrass meadow. Differences in the characteristics between the sites examined in this study at Green Island are outlined in Table 1. The sites were comprised of six species; Cymodocea rotundata, Cymodocea serrulata, Halodule uninervis, Halophila ovalis, Syringodium isoetifolium and Thalassia hemprichii. There are limited seasonal fluctuations within this meadow. For sites 1 and 3, the exclusion cages and tethers (see below) were placed in the same location; at site 2, exclusion cages were placed within an area of lower density seagrass to investigate if this was caused by herbivory, but the tethers were placed closer inshore within an area of higher canopy height and shoot density.

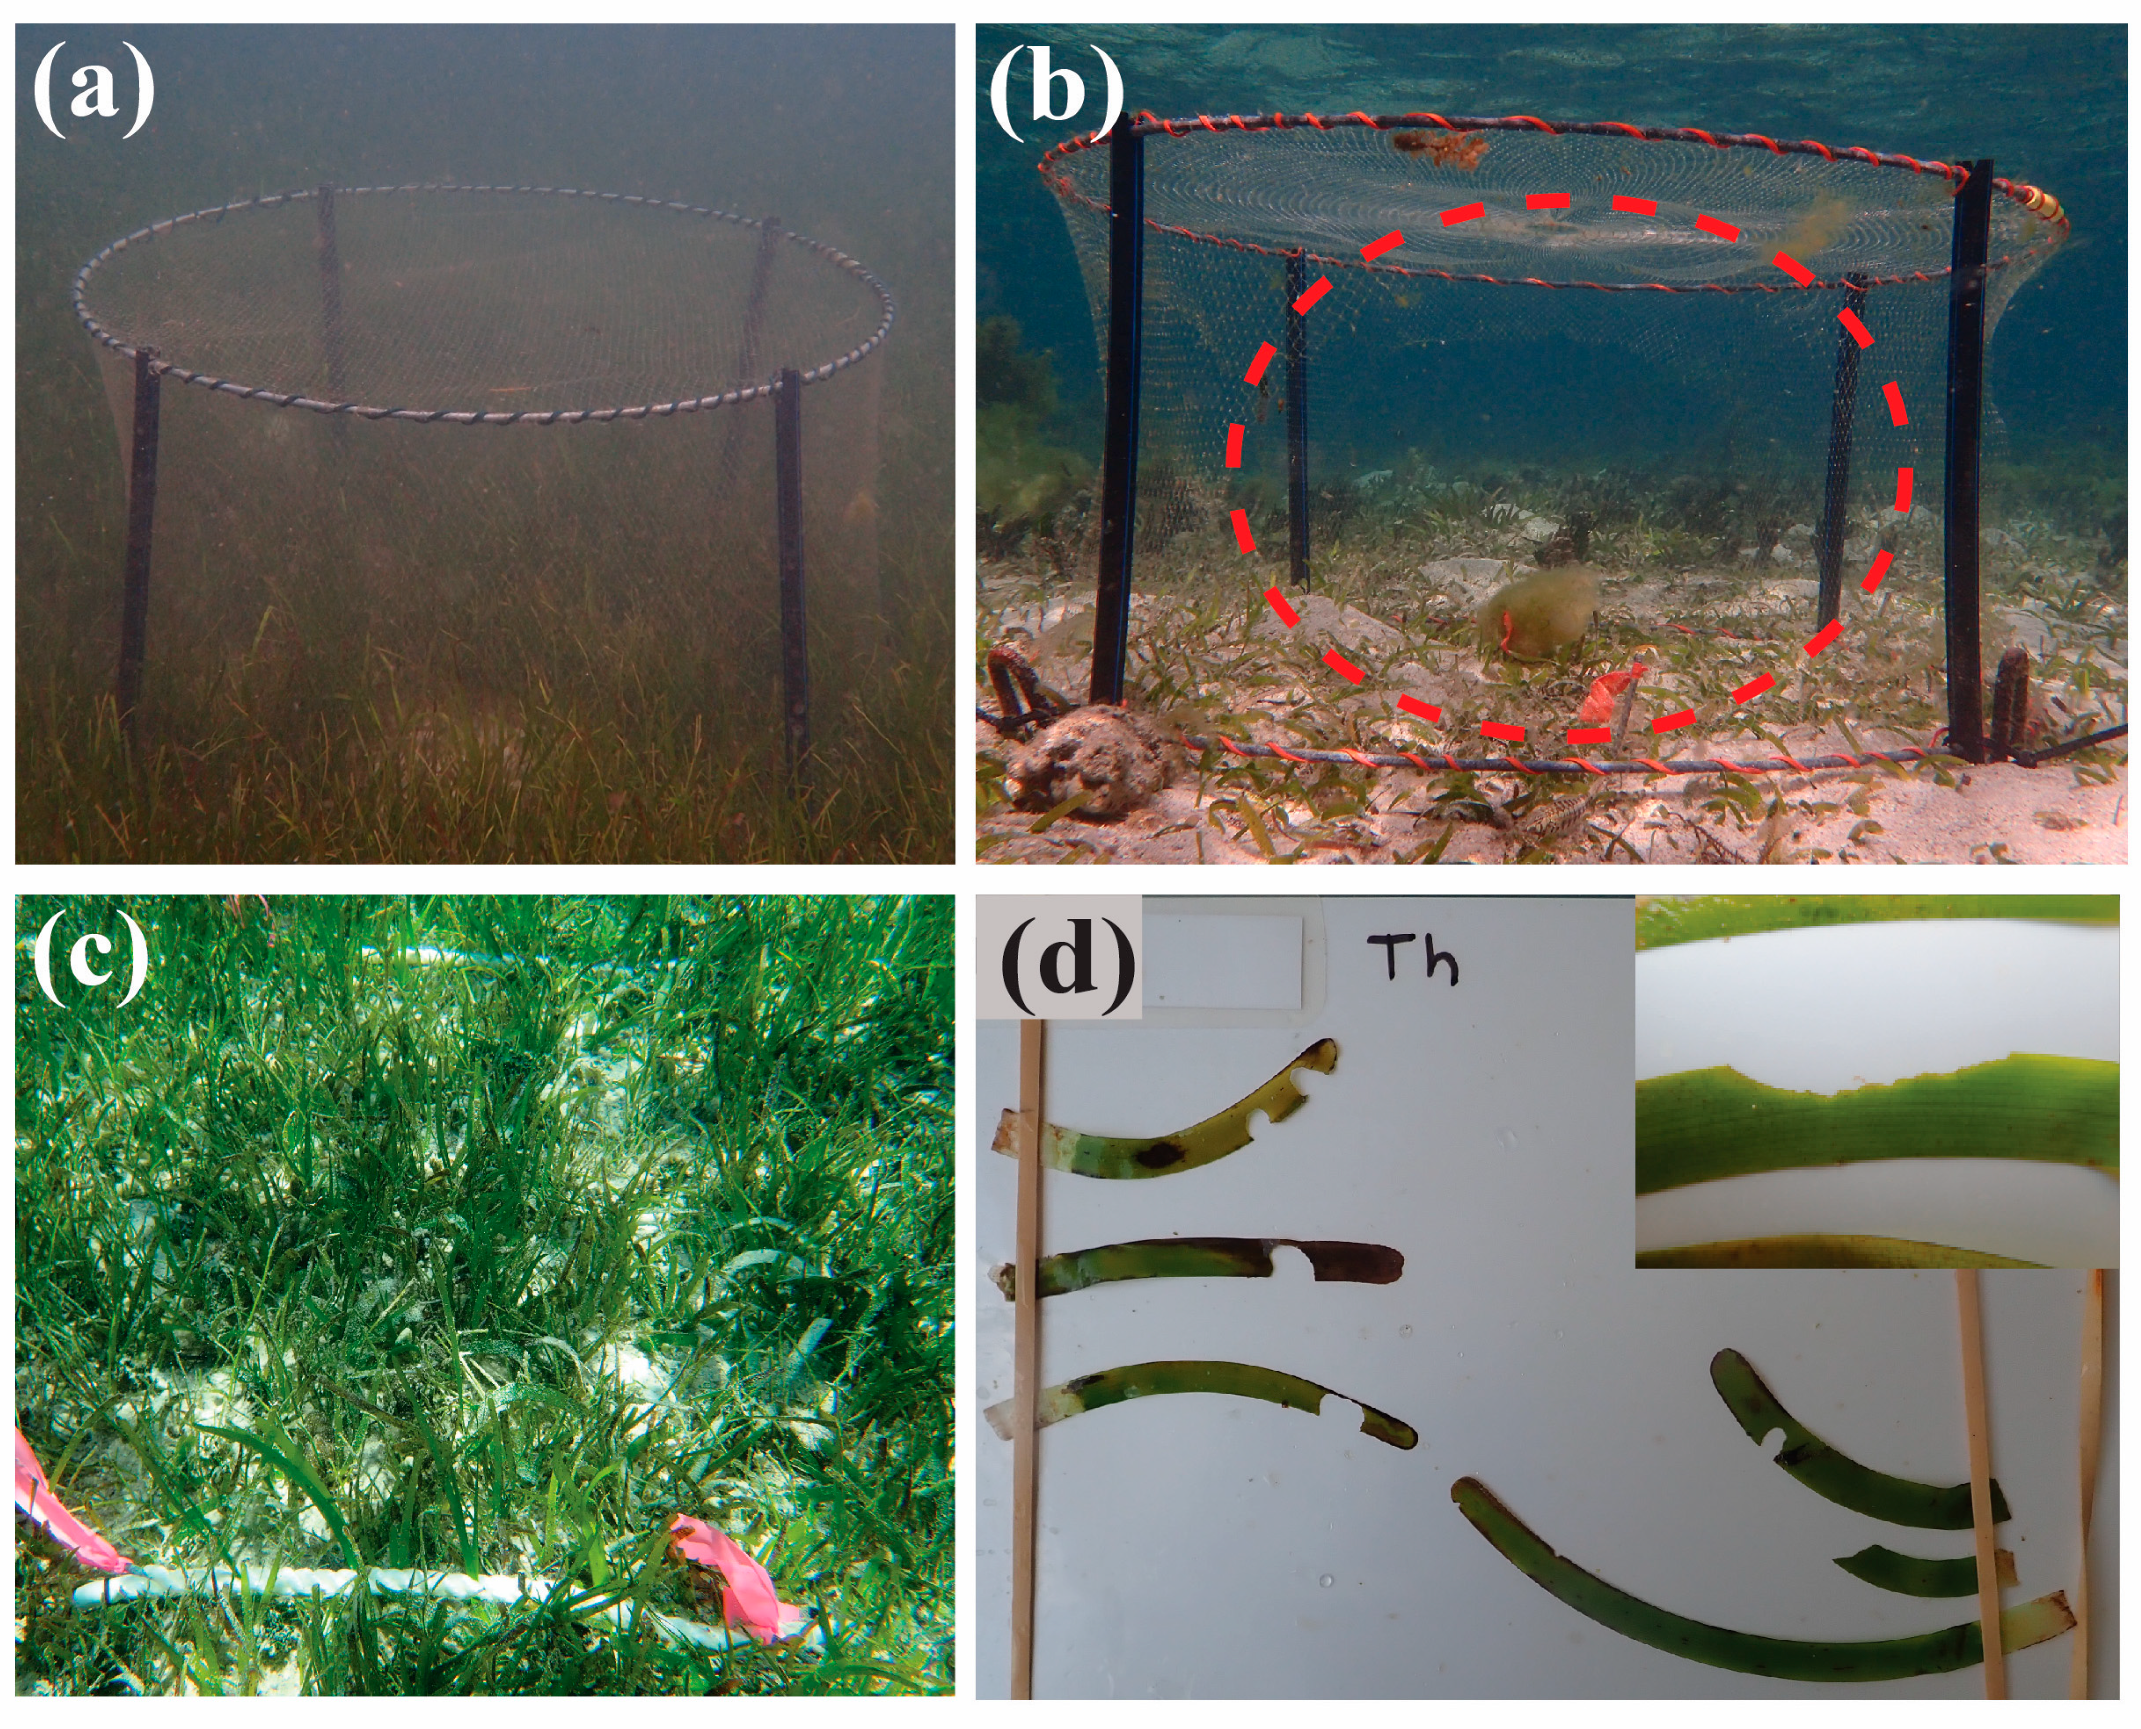
2.2. Exclusion cage Experiments

Manipulative field experiments to exclude macroherbivores were carried out at sites 1, 2 and 3, shown in Figure 1 and described in Table 1. Macroherbivore exclusion cages were made from a modified 1 m diameter × 0.5 m high crab pot that was covered in 10 mm monofilament mesh (Figure 2). Exclusion cages were deployed in the seagrass meadow for a total of seven weeks from April to June 2018. Exclusion cages were deployed at each site in a grid layout with six cages, six control plots and six procedural controls—macroherbivore exclusion cages with holes cut in the sides to allow macroherbivores to access the seagrass (Figure 2). Treatments were arranged haphazardly in the grid and plots were 2 m apart.
To monitor and minimise the impact of shading caused by the cages, they were regularly cleaned and light measurements were taken. Macroherbivore cages at all three sites were manually cleaned twice a week for the duration of the experiment and were periodically swapped out for clean cages. Benthic light measurements reaching the seagrass canopy were taken inside a control plot and a macroherbivore cage for the first month of the experiment using 2π cosine-corrected irradiance loggers (Submersible Odyssey Photosynthetic Irradiance Recording System, Dataflow Systems Pty. Ltd., Christchurch, New Zealand) calibrated using a cosine corrected Li-Cor underwater quantum sensor (LI-190SA; Li-Cor Inc., Lincoln, NE, USA) and corrected for immersion using a factor of 1.33 [53]. Loggers measured photosynthetically active radiation (PAR) and recorded readings every 15 min, these readings were used to measure total daily light (mol photons m−2 day−1) reaching the seagrass in both cage and control plots.
At the end of the seven-week exclusion experiment, an 11 cm diameter (10.6 cm internal diameter) core sample was taken from every cage, control and procedural control plot under a marine park permit (G17/38934.1). These cores were stored in the freezer and processed in the lab for aboveground biomass, shoot counts and counts of fish bite marks and urchin shreds. Samples were gently defrosted in the lab and above and belowground material separated where the shoot meets the rhizome. Shoots were counted for each species and the number of bite marks due to herbivory was also recorded. Aboveground biomass material for each species was then dried in the oven at 60 °C and weighed after one week of drying.

2.3. Tethering Experiments

Seagrass tethering experiments were used to quantify macroherbivory over time using an established technique detailed below [9], modified by changing the length and type of rope, number of seagrass shoots and duration of time in the meadow. Tethering experiments were carried out at sites 1, 2a (from August onwards) and 3 shown in Figure 1 and Table 1 every 2 months from June 2019 to April 2020. These experiments used the two most common species across all three sites; C. rotundata and T. hemprichii. Both species were collected from the meadow at each site by selecting blades that were not heavily covered in epiphytes (to ensure all blades were similar and minimise the likelihood that herbivores would select or avoid blades) or with signs of grazing and arranged in tethers. Each tethered shoot was made up of two outside blades and one middle blade of the seagrass taken from the same meadow and from the same shoot where possible [15]; all blades were photographed before being spliced into a 30 cm rope (the tether). Each tether had two shoots of C. rotundata and two shoots of T. hemprichii spliced into it; these tethers were pegged into the seagrass meadow with the same orientation and shoot height as the surrounding meadow (see Figure 2). Ten tethers were placed in the seagrass meadow at each site in two rows of five; tethers were separated by 0.5 m and the two rows of tethers were 0.5 m apart. Tethers remained in situ for a total of three days, and after collection, each blade was photographed again. Photos were used to calculate the surface area of blades at the start and end of the experiment, and the surface area lost to herbivory using ImageJ [54]. Photos were also used to count bite marks and categorise these as: urchin shreds, large fish bites (>5 mm), small fish bites (<5 mm) or megaherbivory by green turtles (see Figure 2). Shoots were frozen and subsequently weighed in the lab following drying in an oven at 60 °C for four days.
Remote underwater cameras (GoPro model) were used to film tethered seagrass at each site to record herbivore grazing behaviour. Cameras were placed around the tethers and left recording for 60–90 min at each site and two recordings were carried out at all sites on days one and two of tether deployment where tidal conditions allowed. All footage was viewed to look for the presence of herbivores. For three camera deployments per site per sampling event, a random 15 min section of video was watched in detail and all fish were identified and the number in that section of video was recorded along with the MaxN (maximum number of individuals in a frame) [55].
Seagrass meadow productivity measurements were carried out at all sites in June 2018 and at site 1 in February 2020. Shoots of all species were pierced with a syringe halfway up the leaf sheath and then harvested after 1–3 weeks; new growth was weighed in the lab and calculated as mg Dry Weight (DW) d−1 per shoot to enable comparisons with losses from tethered shoots [56]. Shoots were examined for signs of herbivory, and any that showed losses due to green turtle cropping were excluded from analysis. To compare productivity measurements to losses due to macroherbivory, average productivity from all measurements of each species was used, with June measurements used for the dry season months and February measurements used for wet season months.

2.4. Statistical Analysis

All data were analysed using a generalised linear model (GLM) using R v.3.5.2. [57] and model outputs were plotted using ggplot2 [58]. Exclusion cage data were analysed using a GLM with a gamma distribution and log-link, site and treatment were included as fixed factors with the response variables aboveground biomass, belowground biomass and shoot density tested individually. Tether data were analysed using the MASS package [59] and a GLM with a negative binomial distribution and log-link with site, seagrass species and month included as fixed factors with the response variables total bite marks and surface area lost to macroherbivory. An F-test was used to determine the significance of each variable in the best-fit model using the anova() function in R. Post-hoc analysis was conducted to compare treatment groups using a Tukey test in the emmeans package [60]. If a variable was not significant in the ANOVA, this was excluded from the model in the post-hoc analysis.
To analyse the number of bite marks per blade from cores taken at the end of the experiment, an ANOVA was used to test for differences in bite marks per blade of each species. Each site was analysed separately due to the different species compositions at each.

3. Results

Macroherbivore grazing at Green Island varied throughout the year and between sites, in terms of the amount of seagrass consumed (Figure 3a). Numbers of bite marks on tethers also varied over space and time, but not between seagrass species. Peaks in herbivory were being driven by numbers of fish bite marks rather than urchins (Figure 3b). Macroherbivores consumed between 0.25–44% of aboveground daily seagrass productivity (Table 2). There was a difference in the weight of seagrass lost to herbivory between the two species used on the tethers, but there was no clear preference for either of the seagrass species in terms of the number of bite marks on each (Figure 3a). However, results from the analysis of cores across the meadow as a whole show that less common seagrass species such as H. ovalis and C. serrulata may be targeted by fish grazers at Green Island (Figure 4). Despite being present, macroherbivores did not measurably impact seagrass meadow properties such as shoot density, aboveground biomass and species composition within the meadow (Figure 5).

3.1. Rates of Herbivory

Loss of seagrass material on tethered seagrass throughout the year differed between sites (F2,288 = 32.08, p < 0.001), months (F5,283 = 3.74, p = 0.002) and species (F1,282 = 9.05, p = 0.003) with an interaction between site:month (F9,273 = 32.08, p < 0.001). Losses to macroherbivory were lowest at site 2 throughout the year, and highest at site 3 in the August/October peak (Figure 3a). Post hoc analysis showed differences between the two seagrass species on the tethers at site 3 in August and site 2 in October (p < 0.05), where losses of T. hemprichii were higher than C. rotundata. There was no difference between months at sites 1 or 2, but site 3 had higher losses to herbivory in October than June.

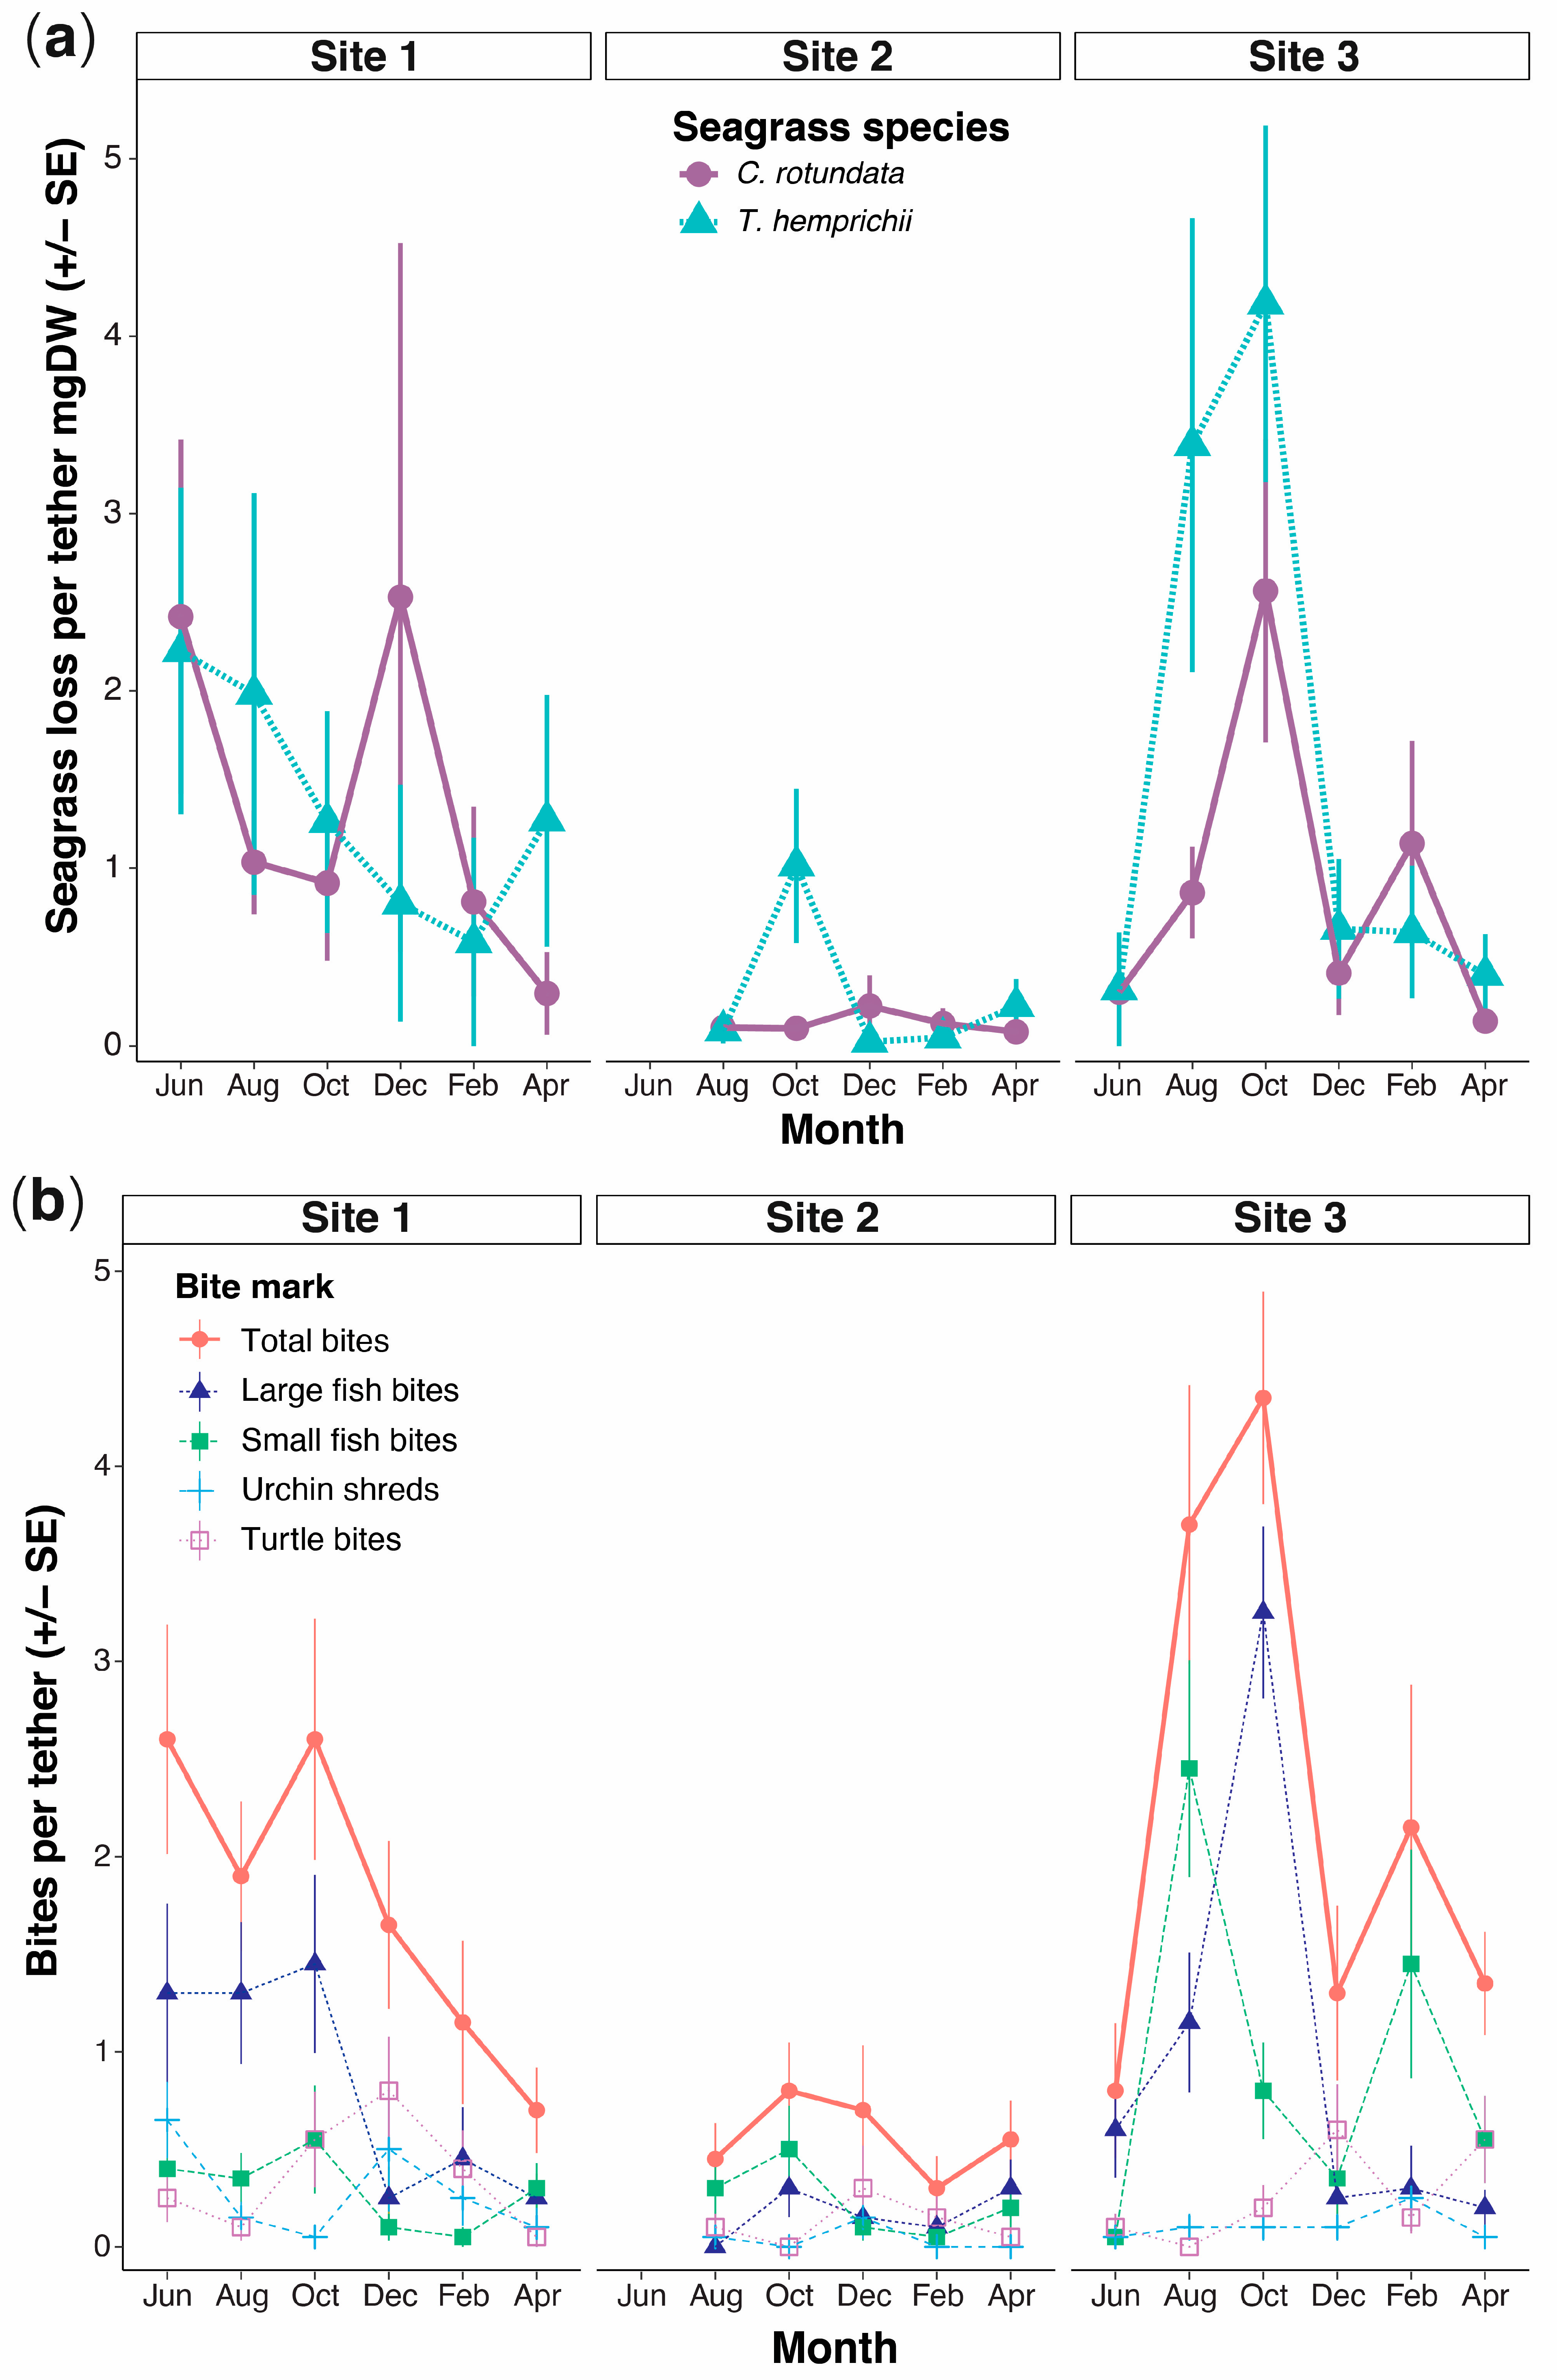
3.2. Spatial and Temporal Variability in Herbivory

The total number of fish, urchin and turtle bite marks per tether differed between sites (F2,338 = 32.28, p < 0.001) and months (F5,333 = 5.86, p < 0.001), but not between seagrass species (F1,322 = 2.78, p = 0.52) (Figure 3b). There was an interaction between site and month regarding the total number of bite marks on tethers (F10,322 = 2.78, p = 0.002). Herbivory peaked at all sites in October, with a second peak occurring at site 1 in June (Figure 3b).
Post-hoc tests showed that within site 1, bite marks were fewer in April than the June and October peaks. Within site 2, there were no differences between months, and within site 3, there were fewer bite marks in June than the peak months of August and October. Throughout most of the year, bite marks were highest at site 3 and lowest at site 2. The only months with no differences in bite marks between sites were April and December. The peaks in herbivory at all sites were driven by higher numbers of fish bites rather than urchin feeding (Figure 3b). All types of bite marks were contributing to herbivory pressure at all three sites during the experiment, small fish bite marks were highest at site 3 throughout much of the year, whereas turtle and urchin bites were higher at site 1.

3.3. Proportion of Productivity Consumed

The amount of seagrass productivity consumed by macroherbivores varied depending on the time of year and species of seagrass and ranged between 0.25 and 44% of seagrass productivity (Table 2). This variation depended on the time of year, species of seagrass and the site, with the highest outright and proportional losses of productivity to macroherbivores at sites 1 and 3 (Table 2).

3.4. Identity of Macroherbivores

The herbivores responsible for bite marks on the tethers were not observed on the over 70 h of remote video footage. The only herbivorous fish seen were small siganids (Table A1); no urchins were seen on the cameras, but were occasionally observed in the meadow during this study. Siganids were observed on the video footage in very large numbers at site 3 in February (see Table A1 MaxN values); however, the majority of these were juveniles.

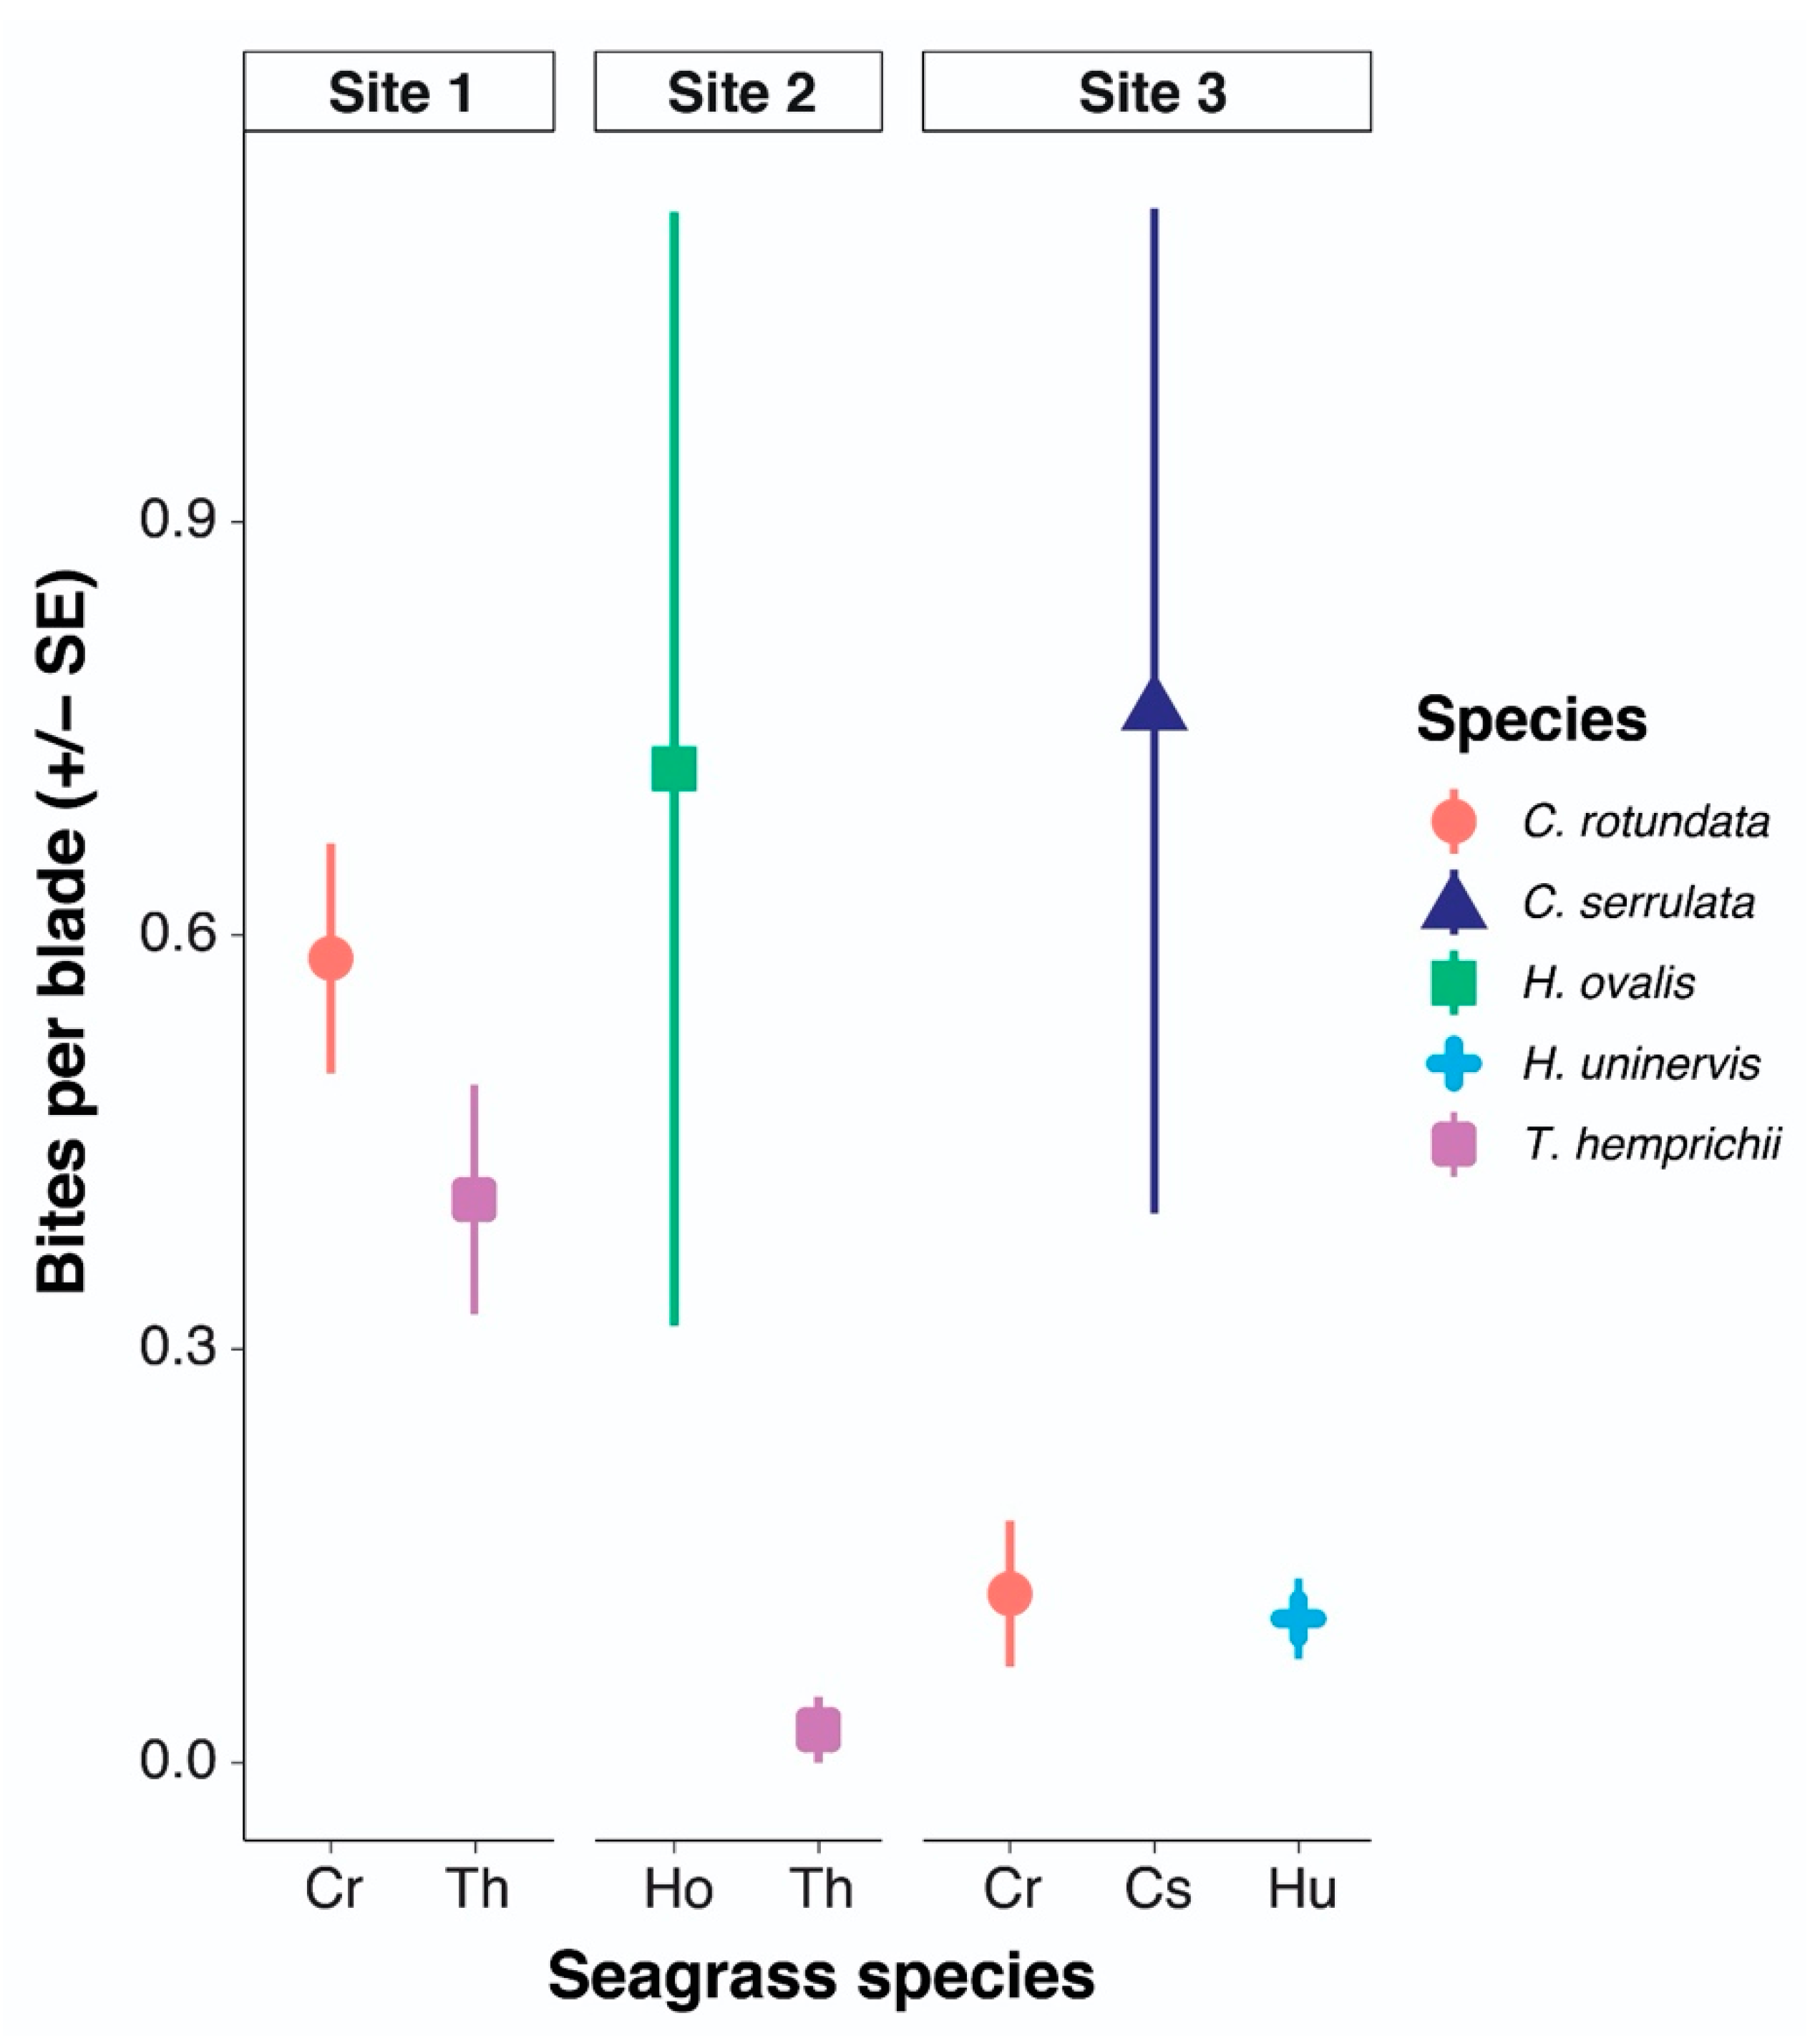
3.5. Species Preference

Bite mark data from all seagrass species in the control plots at the end of the exclusion experiment were analysed to look for overall patterns in seagrass species preference in this diverse meadow (Figure 4). There was no difference in the number of bite marks between C. rotundata and T. hemprichii at site 1 F1,8 = 1.72 (p = 0.231), which was also supported by comparing these two species in the tethering experiment. At site 2, H. ovalis had more bites per blade than T. hemprichii F1,9 = 3.63 (p = 0.09), and at site 3, C. serrulata had more bites per blade than C. rotundata and H. uninervis F2,13 = 4.83 (p = 0.03).

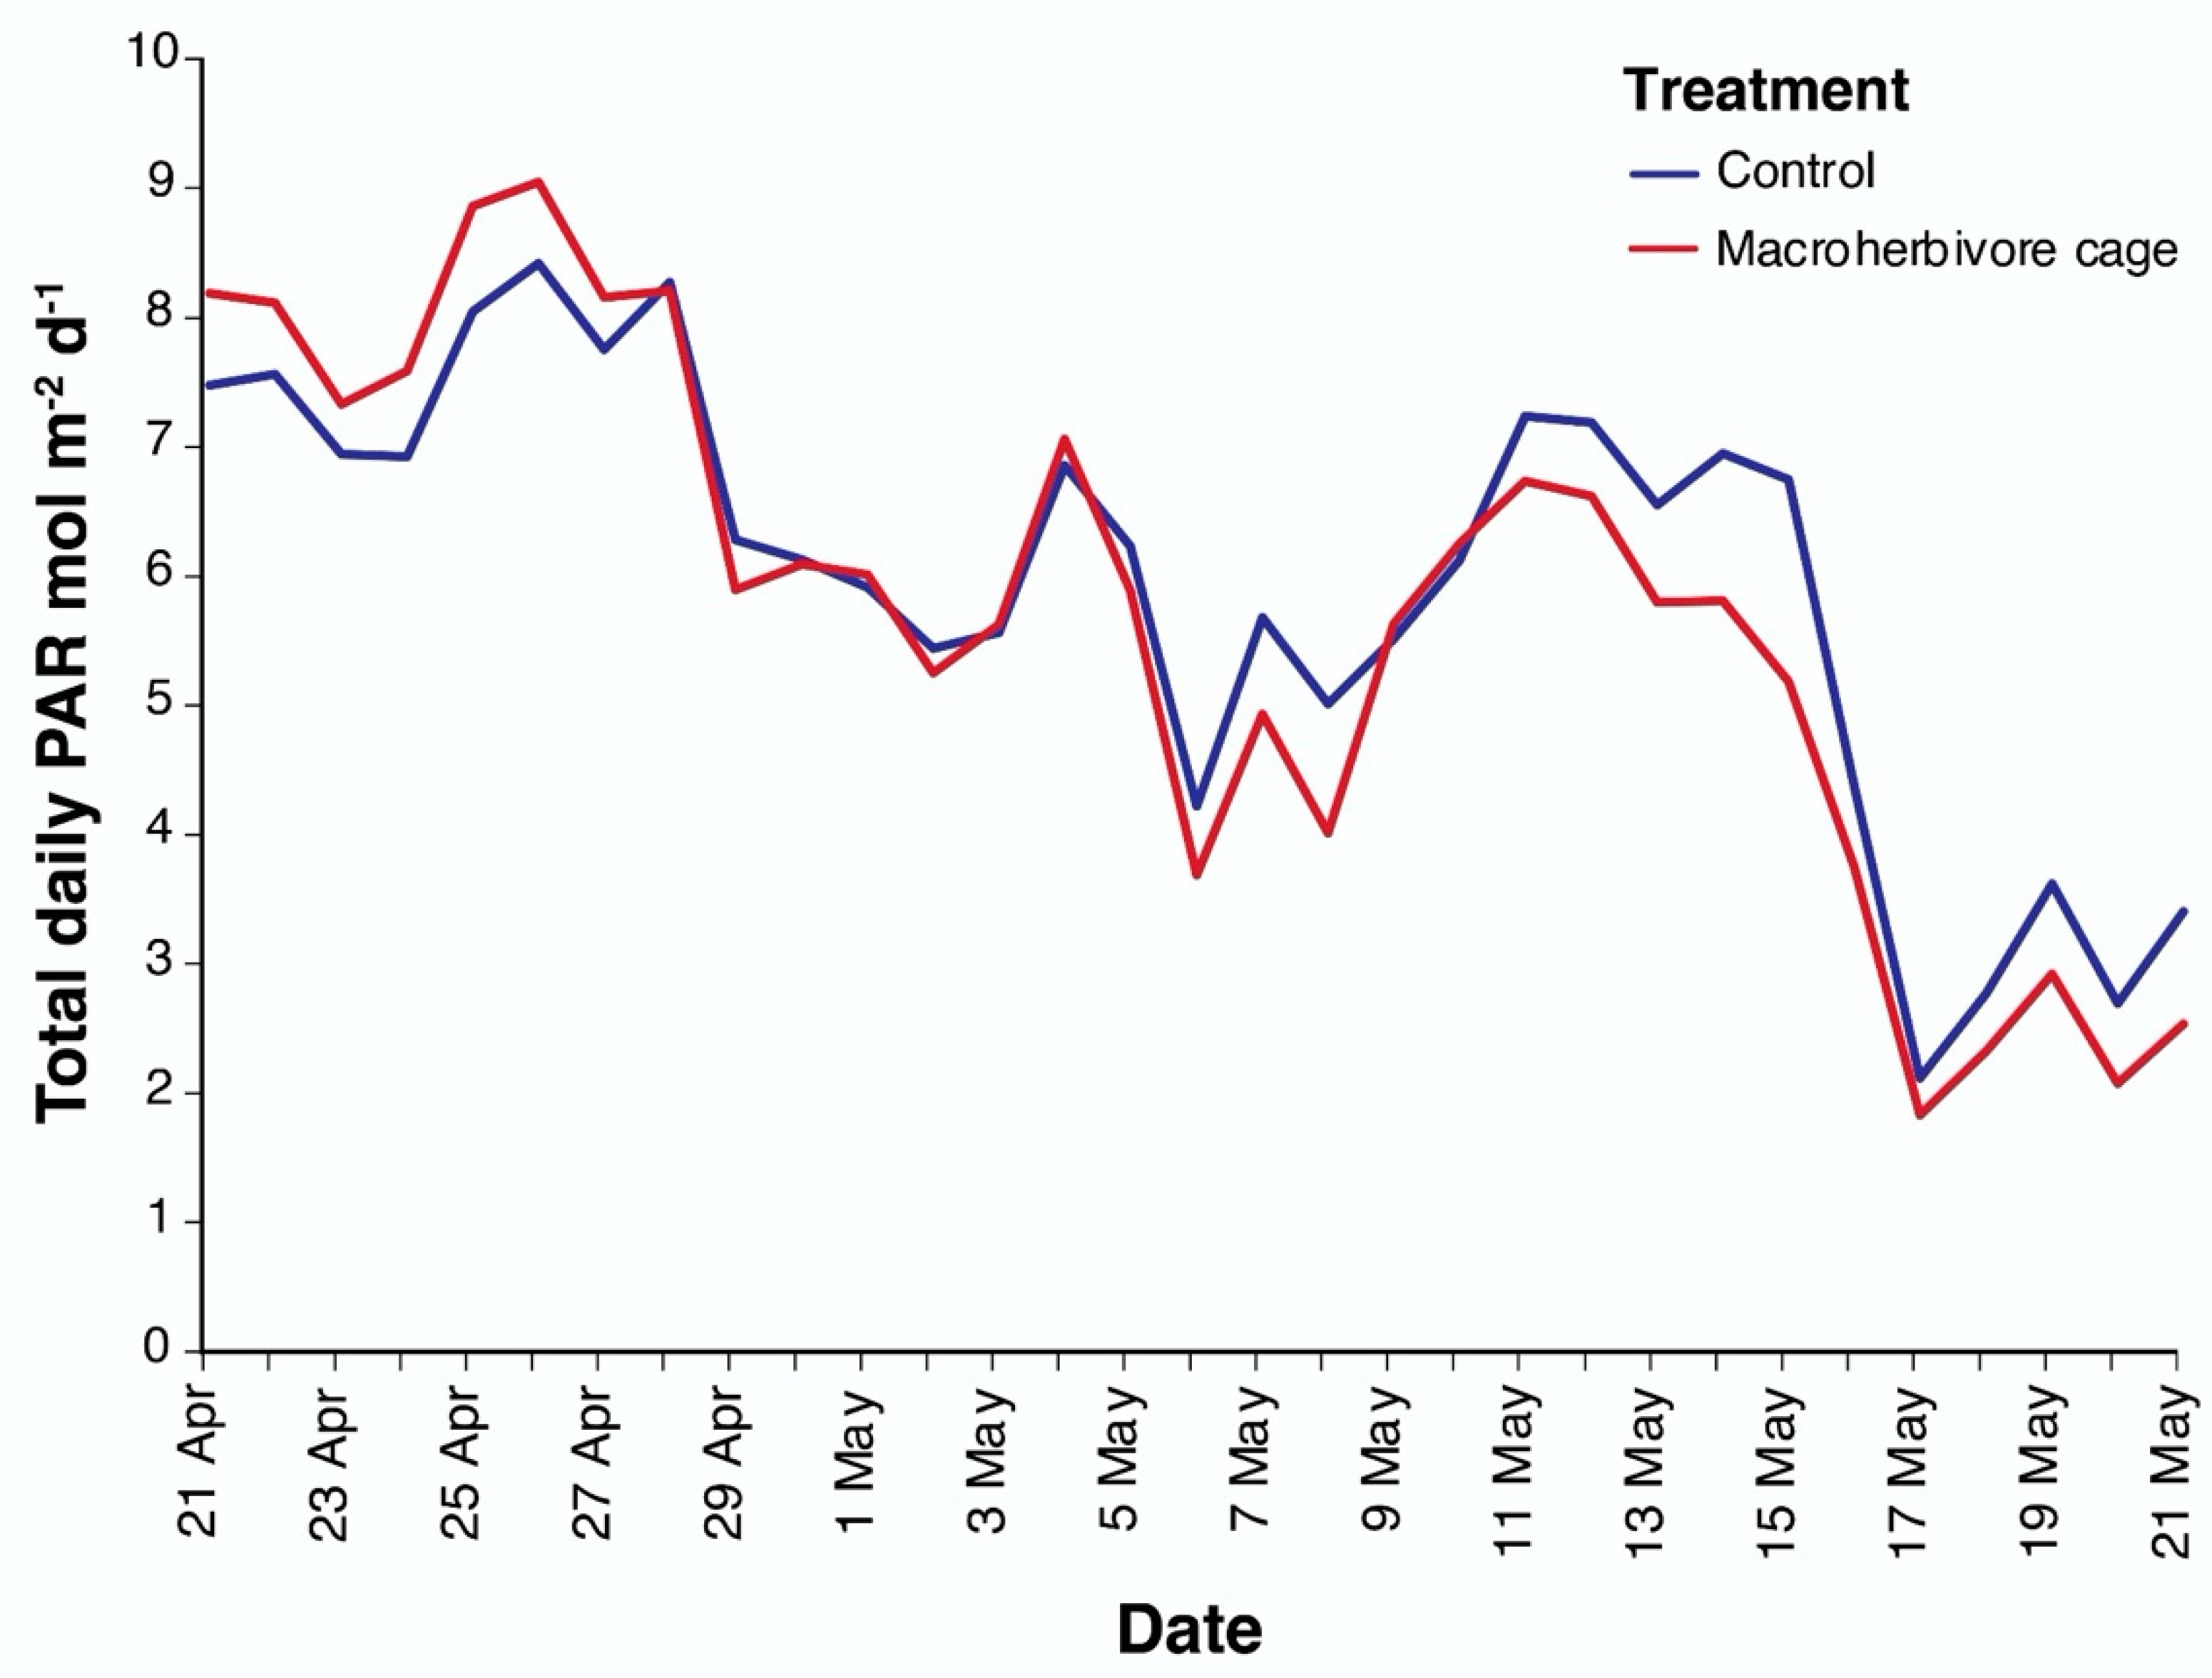
3.6. Impact of Macroherbivory on the Seagrass Meadow

At the end of the exclusion caging experiment, there was no effect of excluding macroherbivores on seagrass metrics, with no treatment differences in aboveground biomass (F2,47 = 0.5, p = 0.6), belowground biomass (F2,45 = 0.6, p = 0.5) or shoot density (F2,49 = 0.04, p = 0.9). There was no effect of excluding macroherbivores in the lower seagrass density area within the meadow at site 2 and the exclusion cages did not have an impact on the seagrass meadow. While there were no differences caused by macroherbivory, there were differences between site in aboveground biomass (F1,49 = 76.9, p < 0.001), belowground biomass (F1,47 = 83.2, p < 0.001) and shoot density (F1,51 = 56.13, p < 0.001). Aboveground biomass was lowest at site 2 (Figure 5a), shoot densities were lowest at sites 1 and 2 (Figure 5b) and belowground biomass was lowest at site 2 (Figure 5c).
While insufficient to cause a change in overall seagrass biomass in treatments, the analysis of bite mark numbers in seagrass blades revealed a difference in the number of bite marks between treatments (F2,48 = 9.1, p < 0.001) and between sites (F1,50 = 35.5, p < 0.001), and there was a site by treatment interaction (F2,46 = 3.7, p < 0.05). Post hoc analysis shows that bite marks were less frequent in cages that excluded macroherbivores than control plots (p < 0.05) at sites 1 and 3, but there was no difference at site 2 and very low levels of bite marks overall (Figure 5d). Light logger data show that cages did not reduce the total daily PAR reaching plots (Figure A1).

4. Discussion

This study examined macroherbivory in a tropical multispecies seagrass meadow in the Great Barrier Reef. Macroherbivory varied greatly both spatially and temporally, ranging from 0.25% to as much as 44% of the daily seagrass productivity. While evidence of grazing was present in the meadow, macroherbivory did not result in large-scale detectible impacts to seagrass meadow structure and biomass. Macroherbivores did not show a clear preference for either of the two most common species in the meadow, but may prefer the rarer species.
Rates of macroherbivory at Green Island were consistently low compared with temperate and subtropical meadows [8,9,10] and compared with studies from some other tropical locations where macroherbivory can be up to 10 times daily seagrass productivity [15,61]. The levels of macroherbivory at Green Island were more similar to rates documented in tropical seagrasses in the South China Sea, where herbivores removed up to 16% of seagrass productivity [11,12] and to herbivory rates found worldwide [62]. As macroherbivory at Green Island appeared to be highly variable, there may be peak grazing events that we did not observe during the timeframe of our study, where a larger amount of seagrass productivity is removed. Targeted grazing by signaids has previously been observed at Green Island, with large shoals of up to 100 individuals moving from the reef dominated areas, where they rest, to the seagrass flats (close to site 1 in this study), where they feed [52].
These rates of seagrass herbivory are also low compared to macroherbivory on algae within coral reefs in the GBR, where algal biomass removal rates in a 4 h period can be between 6–36% [63], but these rates can vary depending on the type of macroherbivore present [46]. Siganids are important herbivores on GBR reefs; however, they have very low rates of herbivory on seagrasses [64].
Green Island is one of the oldest MPAs in the GBR [40,48]. In other parts of the world, protected areas have been shown to modify macroherbivory and result in increased herbivory inside MPAs [19,43,65]. This may occur because of the number of trophic levels in the food web being protected. For example, where apex predators are functionally extinct and only three trophic levels are present, MPAs release fishing pressure on piscivores and result in reduced macroherbivore populations or changes in behaviour [66]. When apex predators are present and protected (four trophic levels) they reduce piscivore numbers and increase the populations of macroherbivores. However, when long-term protection and conservation measures are applied to a system, interactions generally become more diverse and complex and this can dampen these trophic cascades leading to more stable systems [42,67]. In the case of Green Island, it is possible that because top-predators are also protected, larger fish and sharks are able to exert top-down control on the herbivore populations here and modify their feeding behaviour [68]. Large predatory fish and blacktip sharks were frequently observed in the seagrass meadows at all sites and all times of year throughout the duration of the experiment and on the video footage collected during the study (e.g., video S1). A lack of top-down control due to overfishing of herbivore predators has been shown to contribute to overgrazing by macroherbivores in other locations [69] and presence of predators can control macroherbivore populations [61,66]. The presence of predators can also modify the feeding behaviours of megaherbivores over space and time, based on their perceived risk of predation [68,70,71] and it is possible the macroherbivores at Green Island are also attempting to avoid predators while foraging.
The levels of macroherbivory at Green Island were insufficient to cause a measurable impact on overall seagrass meadow structure. This contrasts with other locations where high grazing rates by macroherbivores have caused dramatic losses in above and below ground biomass [17,27,28,72], but is a similar pattern to other work from the GBR, which found no impact of macroherbivores on seagrass meadow structure [7]. In a previous study at Green Island, we identified the most important herbivore modifying seagrass meadow structure is the green turtle, Chelonia mydas [5]. These megaherbivores can graze intensively on small patches of seagrass within the Green Island meadow and impact both above and belowground seagrass structure [5] and mesoherbivores can impact epiphyte cover [73]. However, even these large herbivores did not act across the entire meadow with impacts measured in smaller grazing plots within the meadow, leaving the majority unaffected.
Bite marks on tethered seagrass show that macroherbivory at Green Island was dominated by fish, and peaks in macroherbivory were driven by fish bite marks. However, urchin herbivory was also taking place throughout the year at a lower frequency. Urchins have also been found to be a lower contributor to macroherbivory in other tropical and subtropical locations outside of Australia [12], particularly in areas where fishing is prohibited [19,41].
No macroherbivores were observed directly feeding on tethers in over 70 h of video collected in this experiment, and no large herbivores were seen in the footage; however, large numbers of schooling juvenile siganids were recorded at site 3 in February. As no macroherbivory events were captured on camera and were only rarely observed in the meadow throughout this experiment, macroherbivory may be taking place at night or could be due to large shoals of fish moving through the meadow sporadically. Previous work at Green Island has shown that Siganus fuscescens and Siganus lineatus feed on seagrass as an important part of their diet, and they can move through the meadows here in large foraging shoals [52]. Both urchins and siganids in tropical seagrasses and GBR reefs can graze at night [13,74,75]. Although juvenile siganids are associated with the Green Island seagrass meadows, they predominantly feed on turfing algae and animal material within the meadow [52]. Fixed site surveys indicate a diverse suite of herbivorous fish are present at Green Island, including scarids, siganids and acanthurids [49]. The parrotfish genus Sparisoma, which cause high rates of seagrass loss in the Caribbean and other areas, is not present in the Indo-Pacific [76], and although their functional equivalents Calotomus spp. and Leptoscarus vaigiensis are rare in the GBR [76], they have been shown to consume large amounts of seagrass in other areas in the Indo-Pacific [15,61].
Although rates of herbivory were low overall, there was small-scale spatial variability between sites around Green Island, and macroherbivory rates changed over time at each site. Such spatial and temporal variability in macroherbivory has been previously documented and depends on factors that cause patchiness in abundances of herbivores [10,12,20]. At Green Island, the neighbouring coral reef habitat may play a key role, as reef-associated fish can feed on seagrass, and in some locations, cause bare halos in seagrass around reefs by grazing and preventing the establishment of some seagrass species [25,77,78]. Similar halos were observed around some reefs at Green Island but were not investigated as part of this study. The depth of meadows is likely to also have been important; herbivory was highest at site 3 for much of the year, the deepest site in the study (other sites were intertidal). Other studies have also found mid-depth subtidal sites have higher macroherbivory [12,79] and larger herbivorous fish can occur deeper than juveniles [61]. Seasonal and temporal variability in macroherbivory is also very common in other locations, and targeted herbivory by shoals of fish is what allows these meadows to persist even when herbivore consumption exceeds daily primary productivity for short periods of time [9,15].
Macroherbivores at Green Island did not show a preference for either C. rotundata or T. hemprichii in the tethers; however, data from cores at the exclusion study sites showed they consumed rarer species H. ovalis and C. serrultata at relatively greater rates when they were present at sites. Macroherbivores in tropical seagrass meadows have been shown to prefer opportunistic species such as C. rotundata over climax species such as T. hemprichii [12,14,36]. In other tropical locations, fish have also shown a preference for the faster growing Syringodium filiforme or Halodule uninervis over Thalassia species [11,80]. These preferences may also be size-dependent, as larger parrotfish are able to feed on seagrass blades with a higher fibre content, meaning they can graze on the high nutrient, high fibre T. hemprichii [11].

5. Conclusions

This study found that macroherbivory was generally low in the multi-species seagrass meadow at Green Island. Large fish, small fish and urchins all fed on seagrass here, but this varied over space and time. Despite persistent feeding by macroherbivores throughout the study, it was of insufficient intensity to cause large-scale structural impacts to seagrass biomass, species composition or shoot density in the meadow. This pattern may be characteristic of other GBR seagrass meadows where macroherbivores are present; however, further studies are needed. Green Island is one of the oldest MPAs on the GBR, where both macroherbivores and their predators are protected; this top-down influence may be controlling rates of macroherbivory in this meadow, an area worthy of further study. Although the level of macroherbivory was comparatively low at Green Island, this is still likely to represent an important pathway for seagrass productivity to enter the food web. This study supports other recent work highlighting that tropical seagrass productivity provides an important component to food webs in the GBR, but shows that this varies over space and time [5,7,81].

Supplementary Materials

The following are available online at https://www.mdpi.com/1424-2818/13/1/12/s1, Video S1: Blacktip reef sharks around tethers.

Author Contributions

Conceptualisation, A.L.S., P.H.Y. and M.A.R.; methodology, A.L.S.; formal analysis, A.L.S.; investigation, A.L.S.; writing—original draft preparation, A.L.S.; writing—review and editing, P.H.Y. and M.A.R.; visualisation, A.L.S.; supervision, P.H.Y. and M.A.R.; funding acquisition, A.L.S., P.H.Y. and M.A.R. All authors have read and agreed to the published version of the manuscript.

Funding

This research was supported through Australian Research Council grant LP160100492 and funding from Gladstone Ports Corporation; A.L.S. was supported by the Holsworth Wildlife Research Endowment (Ecological Society of Australia), the National Environment Science Programme Tropical Water Quality Hub and an Australian Government Research Training Program Scholarship.

Institutional Review Board Statement

Not applicable.

Informed Consent Statement

Not applicable.

Data Availability Statement

The data presented in this study are available at the Tropical Data Hub (https://tropicaldatahub.org/).

Acknowledgments

Our thanks to the seagrass ecology field team for their assistance: P. Leeson, L. Shepherd, L. Hoffman, P. Davey, C. Reason, H. Kish, T. Smith, J. Wilkinson and S. Troy, and to volunteers W. Bishoff, A. Bouet, E. Joyce, J. Kenneally-Clark, J. Kramer, M. Mariotta, Z. Skein, O. Rowley, W. Sheedy and J. Valentine.

Conflicts of Interest

The authors declare no conflict of interest.

Appendix A

Figure A1. Total daily light in control and macroherbivore cage plot.
Diversity 13 00012 g0a1

Appendix B

Table A1. Total number of fish observed on three 15 min camera drops per site per month with the maximum number (MaxN) in a frame shown in brackets.
Species NameJuneAugustOctoberDecemberFebruaryApril
13123123123123123
Ablennes hians11 (4)1 (1)58 (24)1 (1) 1 (1) 44 (13) 1 (1) 16 (9)23 (4)
Arothron spp. 1 (1) 1 (1) 1 (1)
Atherinidae 18 (11) 1 (1)
Blenniidae3 (1) 3 (1) 1 (1) 2 (2)
Caesionidae 12 (8) 3 (1)34 (7)
Carangoides orthogrammus 1 (1)
Caranx ignobilis 25 (12) 1 (1)1 (1)
Caranx melampygus
Caranx papuensis 1 (1)2 (1)1 (1)7 (2)4 (1)2 (1) 6 (2) 29 (21) 1 (1)1 (1)19 (4)
Carharhinus limbatus 1(1)1(1)1 (1) 1 (1) 3 (1)1 (1)
Cheilio inermis 6 (2) 15 (3)3 (2) 4 (2)7 (3)
Chrysiptera brownriggii 2 (1)
Echeneis naucrates 1(1) 1 (1)1 (1)
Gerres oyena 52 (22)
Gnathanodon speciosus 12 (11)
Gobiidae 2 (2)2 (1)
Labroides spp. 1 (1) 1 (1)
Lethrinid5 (3)22 (3) 2 (2)2 (2) 1 (1)17 (2)12 (2)52 (4)62 (24)4 (1)91 (12)4 (2)1 (1)6 (3)
Lethrinus nebulosus 2 (1)2 (1)
Lethrinus obsoletus 2 (1)
Myxus elongatus 30 (13)35 (22) 16 (8)
Parupeneus spp. 1(1) 3 (3)20 (5)1 (1) 5 (2)
Pastinachus sephen 1 (1) 1 (1)
Platax orbicularis 1(1) 1 (1) 1 (1) 1 (1)
Rhinecanthus aculeatus 1 (1)
Siganus lineatus1 (1) 3 (1)70 (8) 30 (17)687 (30)
Siganus doliatus 44 (8)
Stethojulis strigiventer12 (3)4 (2) 2 (2) 8 (3)87 (7)7 (4) 52 (6) 4 (3)
Trachinotus blochii 1(1) 1 (1) 3 (1) 3 (2)2 (1)2 (1) 10 (5)

References

  1. Rasheed, M.A.; Dew, K.R.; McKenzie, L.J.; Coles, R.G.; Kerville, S.P.; Campbell, S.J. Productivity, carbon assimilation and intra-annual change in tropical reef platform seagrass communities of the Torres Strait, north-eastern Australia. Cont. Shelf Res. 2008, 28, 2292–2303. [Google Scholar] [CrossRef]
  2. Duarte, C.M.; Cebrián, J. The fate of marine autotrophic production. Limnol. Oceanogr. 1996, 41, 1758–1766. [Google Scholar] [CrossRef]
  3. Hyndes, G.A.; Nagelkerken, I.; Mcleod, R.J.; Connolly, R.M.; Lavery, S.; Vanderklift, M.A. Mechanisms and ecological role of carbon transfer within coastal seascapes. Biol. Rev. 2014, 89, 232–254. [Google Scholar] [CrossRef] [Green Version]
  4. Heck, K.L.; Samsonova, M.; Poore, A.G.B.B.; Hyndes, G.A. Global Patterns in Seagrass Herbivory: Why, Despite Existing Evidence, There Are Solid Arguments in Favor of Latitudinal Gradients in Seagrass Herbivory. Estuaries Coasts 2020. [Google Scholar] [CrossRef]
  5. Scott, A.L.; York, P.H.; Rasheed, M.A. Green turtle (Chelonia mydas) grazing plot formation creates structural changes in a multi-species Great Barrier Reef seagrass meadow. Mar. Environ. Res. 2020, 162, 105183. [Google Scholar] [CrossRef] [PubMed]
  6. Aragones, L.; Marsh, H. Impact of dugong grazing and turtle cropping on tropical seagrass communities. Pacific Conserv. Biol. 2000, 5, 286–288. [Google Scholar] [CrossRef]
  7. Scott, A.L.; York, P.H.; Rasheed, M.A. Herbivory Has a Major Influence on Structure and Condition of a Great Barrier Reef Subtropical Seagrass Meadow. Estuaries Coasts 2020. [Google Scholar] [CrossRef]
  8. Holzer, K.K.; Seekell, D.A.; McGlathery, K.J. Bucktooth parrotfish Sparisoma radians grazing on Thalassia in Bermuda varies seasonally and with background nitrogen content. J. Exp. Mar. Bio. Ecol. 2013, 443, 27–32. [Google Scholar] [CrossRef]
  9. Kirsch, K.D.; Valentine, J.F.; Heck, K.L. Parrotfish grazing on turtlegrass Thalassia testudinum: Evidence for the importance of seagrass consumption in food web dynamics of the Florida Keys National Marine Sanctuary. Mar. Ecol. Prog. Ser. 2002, 227, 71–85. [Google Scholar] [CrossRef] [Green Version]
  10. Tomas, F.; Turon, X.; Romero, J. Seasonal and small-scale spatial variability of herbivory pressure on the temperate seagrass Posidonia oceanica. Mar. Ecol. Prog. Ser. 2005, 301, 95–107. [Google Scholar] [CrossRef]
  11. Lee, C.L.; Huang, Y.H.; Chen, C.H.; Lin, H.J. Remote underwater video reveals grazing preferences and drift export in multispecies seagrass beds. J. Exp. Mar. Bio. Ecol. 2016, 476, 1–7. [Google Scholar] [CrossRef]
  12. Lee, C.L.; Huang, Y.H.; Chung, C.Y.; Hsiao, S.C.; Lin, H.J. Herbivory in multi-species, tropical seagrass beds. Mar. Ecol. Prog. Ser. 2015, 525, 65–80. [Google Scholar] [CrossRef]
  13. Tertschnig, W.P. Diel Activity Patterns and Foraging Dynamics of the Sea Urchin Tripneustes ventricosus in a Tropical Seagrass Community and a Reef Environment (Virgin Islands). Mar. Ecol. 1989, 10, 3–21. [Google Scholar] [CrossRef]
  14. Vonk, J.A.; Pijnappels, M.H.J.; Stapel, J. In situ quantification of Tripneustes gratilla grazing and its effects on three co-occurring tropical seagrass species. Mar. Ecol. Prog. Ser. 2008, 360, 107–114. [Google Scholar] [CrossRef] [Green Version]
  15. Unsworth, R.K.F.; Taylor, J.D.; Powell, A.; Bell, J.J.; Smith, D.J. The contribution of scarid herbivory to seagrass ecosystem dynamics in the Indo-Pacific. Estuar. Coast. Shelf Sci. 2007, 74, 53–62. [Google Scholar] [CrossRef]
  16. Burnell, O.W.; Connell, S.D.; Irving, A.D.; Russell, B.D. Asymmetric patterns of recovery in two habitat forming seagrass species following simulated overgrazing by urchins. J. Exp. Mar. Bio. Ecol. 2013, 448, 114–120. [Google Scholar] [CrossRef] [Green Version]
  17. Carnell, P.E.; Ierodiaconou, D.; Atwood, T.B.; Macreadie, P.I. Overgrazing of Seagrass by Sea Urchins Diminishes Blue Carbon Stocks. Ecosystems 2020, 23, 1437–1448. [Google Scholar] [CrossRef]
  18. Alcoverro, T.; Mariani, S. Effects of sea urchin grazing on seagrass (Thalassodendron ciliatum) beds of a Kenyan lagoon. Mar. Ecol. Prog. Ser. 2002, 226, 255–263. [Google Scholar] [CrossRef] [Green Version]
  19. Hay, M.E. Patterns of Fish and Urchin Grazing on Caribbean Coral Reefs: Are Previous Results Typical? Ecol. Soc. Am. 1984, 65, 446–454. [Google Scholar] [CrossRef]
  20. Wressnig, A.; Booth, D.J. Patterns of seagrass biomass removal by two temperate Australian fishes (Monacanthidae). Mar. Freshw. Res. 2008, 59, 408–417. [Google Scholar] [CrossRef]
  21. Bessey, C.; Heithaus, M.R.; Fourqurean, J.W.; Gastrich, K.R.; Burkholder, D.A. Importance of teleost macrograzers to seagrass composition in a subtropical ecosystem with abundant populations of megagrazers and predators. Mar. Ecol. Prog. Ser. 2016, 553, 81–92. [Google Scholar] [CrossRef]
  22. Valentine, J.F.; Heck, K.L.; Kirsch, K.D.; Webb, D. Role of sea urchin Lytechinus variegatus grazing in regulating subtropical turtlegrass Thalassia testudinum meadows in the Florida Keys (USA). Mar. Ecol. Prog. Ser. 2000, 200, 213–228. [Google Scholar] [CrossRef] [Green Version]
  23. Cebrián, J.; Duarte, C.M.; Marbà, N. Herbivory on the seagrass Cymodocea nodosa (Ucria) ascherson in contrasting Spanish Mediterranean habitats. J. Exp. Mar. Bio. Ecol. 1996, 204, 103–111. [Google Scholar] [CrossRef]
  24. Swindells, K.L.; Murdoch, R.J.; Bazen, W.D.; Harman, N.W.; Unsworth, R.K.F. Habitat configuration alters herbivory across the tropical seascape. Front. Mar. Sci. 2017, 4, 48. [Google Scholar] [CrossRef] [Green Version]
  25. Chiquillo, K.L.; Mims, B.M.; Chong, A.U.; Johnson, C.; Habtes, S.Y.; Fong, C.R.; Barber, P.H.; Fong, P. Herbivory as a limiting factor for seagrass proximity to fringing reefs in Moorea, French Polynesia. Aquat. Bot. 2021, 168, 103294. [Google Scholar] [CrossRef]
  26. Valentine, J.F.; Jr, K.L.H.; Blackmon, D.; Goecker, M.E.; Christian, J.; Kroutil, R.M.; Peterson, B.J.; Vanderklift, M.A.; Kirsch, K.D.; Beck, M. Exploited species impacts on trophic linkages along reef-seagrass interfaces in the Florida Keys. Ecol. Appl. 2008, 18, 1501–1515. [Google Scholar] [CrossRef] [PubMed]
  27. Planes, S.; Raventos, N.; Ferrari, B.; Alcoverro, T. Fish herbivory leads to shifts in seagrass Posidonia oceanica investments in sexual reproduction. Mar. Ecol. Prog. Ser. 2011, 431, 205–213. [Google Scholar] [CrossRef] [Green Version]
  28. Peterson, B.J.; Rose, C.D.; Rutten, L.M.; Fourqurean, J.W. Disturbance and recovery following catastrophic grazing: Studies of a successional chronosequence in a seagrass bed. Oikos 2002, 97, 361–370. [Google Scholar] [CrossRef]
  29. Eklöf, J.S.; de la Torre-Castro, M.; Gullström, M.; Uku, J.; Muthiga, N.; Lyimo, T.; Bandeira, S.O. Sea urchin overgrazing of seagrasses: A review of current knowledge on causes, consequences, and management. Estuar. Coast. Shelf Sci. 2008, 79, 569–580. [Google Scholar] [CrossRef]
  30. Gera, A.; Pagès, J.F.; Romero, J.; Alcoverro, T. Combined effects of fragmentation and herbivory on Posidonia oceanica seagrass ecosystems. J. Ecol. 2013, 101, 1053–1061. [Google Scholar] [CrossRef] [Green Version]
  31. Scott, A.L.; York, P.H.; Duncan, C.; Macreadie, P.I.; Connolly, R.M.; Ellis, M.T.; Jarvis, J.C.; Jinks, K.I.; Marsh, H.; Rasheed, M.A. The Role of Herbivory in Structuring Tropical Seagrass Ecosystem Service Delivery. Front. Plant Sci. 2018, 9. [Google Scholar] [CrossRef]
  32. Rose, C.D.; Sharp, W.C.; Kenworthy, W.J.; Hunt, J.H.; Lyons, W.G.; Valentine, J.F.; Hall, M.O.; Whitfield, P.E.; Fourqurean, J.W. Overgrazing of a large seagrass bed by the sea urchin Lytechinus variegatus in Outer Florida Bay. Mar. Ecol. Prog. Ser. 1999, 190, 211–222. [Google Scholar] [CrossRef]
  33. Pagès, J.F.; Farina, S.; Gera, A.; Arthur, R.; Romero, J.; Alcoverro, T. Indirect interactions in seagrasses: Fish herbivores increase predation risk to sea urchins by modifying plant traits. Funct. Ecol. 2012, 26, 1015–1023. [Google Scholar] [CrossRef]
  34. Heck, K.L.; Valentine, J.F. Sea urchin herbivory: Evidence for long-lasting effects in subtropical seagrass meadows. J. Exp. Mar. Bio. Ecol. 1995, 189, 205–217. [Google Scholar] [CrossRef]
  35. Bell, S.Y.; Fraser, M.W.; Statton, J.; Kendrick, G.A. Salinity stress drives herbivory rates and selective grazing in subtidal seagrass communities. PLoS ONE 2019, 14, e0214308. [Google Scholar] [CrossRef]
  36. Mariani, S.; Alcoverro, T. A mulitple-choice feeding-preference experiment utilising seagrasses with a natural population of herbivorous fish. Mar. Ecol. Prog. Ser. 1999, 189, 295–299. [Google Scholar] [CrossRef] [Green Version]
  37. McGlathery, K.J. Nutrient and grazing influences on a subtropical seagrass community. Mar. Ecol. Prog. Ser. 1995, 122, 239–252. [Google Scholar] [CrossRef]
  38. Goecker, M.E.; Heck, K.L.; Valentine, J.F. Effects of nitrogen concentrations in turtlegrass Thalassia testudinum on consumption by the bucktooth parrotfish Sparisoma radians. Mar. Ecol. Prog. Ser. 2005, 286, 239–248. [Google Scholar] [CrossRef]
  39. Prado, P.; Heck, K.L. Seagrass selection by omnivorous and herbivorous consumers: Determining factors. Mar. Ecol. Prog. Ser. 2011, 429, 45–55. [Google Scholar] [CrossRef] [Green Version]
  40. Ogilvie, P. Marine protected areas in Queensland: Past and present. In Big, Bold and Blue: Lessons from Australia’s Marine Protected Areas; Wescott, G., Fitzsimmons, J., Eds.; CSIRO Publishing: Melbourne, VIC, Australia, 2016; p. 195. [Google Scholar]
  41. Alcoverro, T.; Mariani, S. Patterns of fish and sea urchin grazing on tropical Indo-Pacific seagrass beds. Ecography (Cop.). 2004, 3, 361–365. [Google Scholar] [CrossRef]
  42. Finke, D.L.; Denno, R.F. Predator diversity and the functioning of ecosystems: The role of intraguild predation in dampening trophic cascades. Ecol. Lett. 2005, 8, 1299–1306. [Google Scholar] [CrossRef]
  43. Prado, P.; Farina, S.; Tomas, F.; Romero, J.; Alcoverro, T. Marine protection and meadow size alter fish herbivory in seagrass ecosystems. Mar. Ecol. Prog. Ser. 2008, 371, 11–21. [Google Scholar] [CrossRef]
  44. Bellwood, D.R.; Hoey, A.S.; Choat, J.H. Limited functional redundancy in high diversity systems: Resilience and ecosystem function on coral reefs. Ecol. Lett. 2003, 6, 281–285. [Google Scholar] [CrossRef]
  45. Bellwood, D.R.; Hughes, T.P.; Folke, C.; Nyström, M. Confronting the coral reef crisis. Nature 2004, 429, 827–833. [Google Scholar] [CrossRef] [PubMed]
  46. Ceccarelli, D.M.; Jones, G.P.; McCook, L.J. Interactions between herbivorous fish guilds and their influence on algal succession on a coastal coral reef. J. Exp. Mar. Bio. Ecol. 2011, 399, 60–67. [Google Scholar] [CrossRef]
  47. Cheal, A.J.; Emslie, M.J.; Macneil, M.A.; Miller, I.; Sweatman, H.P.A. Spatial variation in the functional characteristics of herbivorous fish communities and the resilience of coral reefs. Ecol. Appl. 2016, 23, 174–188. [Google Scholar] [CrossRef] [Green Version]
  48. Baxter, I.N. Green Island Information Review. A report to the Great Barrier Reef Marine Park Authority; Great Barrier Reef Marine Park Authority: Townsville, QLD, Australia, 1990. [Google Scholar]
  49. AIMS AIMS Long-term Monitoring Program: Visual Census Fish Data (Great Barrier Reef). Available online: https://apps.aims.gov.au/metadata/view/5be0b340-4ade-11dc-8f56-00008a07204e (accessed on 27 October 2020).
  50. Fuentes, M.M.P.B.; Lawler, I.R.; Gyuris, E. Dietary preferences of juvenile green turtles (Chelonia mydas) on a tropical reef flat. Wildl. Res. 2006, 33, 671–678. [Google Scholar] [CrossRef]
  51. Rasheed, M.A. Recovery and succession in a multi-species tropical seagrass meadow following experimental disturbance: The role of sexual and asexual reproduction. J. Exp. Mar. Biol. Ecol. 2004, 310, 13–45. [Google Scholar] [CrossRef]
  52. Pitt, J.M. The Feeding Ecology of Rabbitfish (Siganidae) at Green Island Reef: Ontogenetic and Interspecific Differences in Diet, Morphology and Habitat Utilisation. Ph.D. Thesis, James Cook University, Townsville, Australia, 1997. [Google Scholar]
  53. Kirk, J.T.O. Light and Photosynthesis in Aquatic Ecosystems; Cambridge University Press: Cambridge, UK, 1994; ISBN 9781139168212. [Google Scholar]
  54. Schneider, C.A.; Rasband, W.S.; Eliceiri, K.W. NIH Image to ImageJ: 25 years of image analysis. Nat. Methods 2012, 9, 671–675. [Google Scholar] [CrossRef]
  55. Harvey, E.S.; Cappo, M.; Butler, J.J.; Hall, N.; Kendrick, G.A. Bait attraction affects the performance of remote underwater video stations in assessment of demersal fish community structure. Mar. Ecol. Prog. Ser. 2007, 350, 245–254. [Google Scholar] [CrossRef] [Green Version]
  56. Zieman, J.C. Methods for the Study of the Growth and Production of Turtle Grass, Thalassia testudinum Konig. Aquaculture 1974, 4, 139–143. [Google Scholar] [CrossRef]
  57. R: A Language and Environment for Statistical Computing. Available online: https://www.r-project.org/ (accessed on 18 December 2020).
  58. Wickham, H. ggplot2: Elegant Graphics for Data Analysis. Available online: https://ggplot2.tidyverse.org/ (accessed on 18 December 2020).
  59. Venables, W.N.; Ripley, B.D. Modern Applied Statistics with S, 4th ed.; Springer: Cham, Switzerland, 2002. [Google Scholar]
  60. emmeans: Estimated Marginal Means, aka Least-Squares Means. Available online: https://rdrr.io/cran/emmeans/ (accessed on 18 December 2020).
  61. Gullström, M.; Berkström, C.; Öhman, M.C.; Bodin, M.; Dahlberg, M. Scale-dependent patterns of variability of a grazing parrotfish (Leptoscarus vaigiensis) in a tropical seagrass-dominated seascape. Mar. Biol. 2011, 158, 1483–1495. [Google Scholar] [CrossRef]
  62. Cebrián, J.; Duarte, C.M. Patterns in leaf herbivory on seagrasses. Aquat. Bot. 1998, 60, 67–82. [Google Scholar] [CrossRef]
  63. Loffler, Z.; Bellwood, D.R.; Hoey, A.S. Among-habitat algal selectivity by browsing herbivores on an inshore coral reef. Coral Reefs 2015, 34, 597–605. [Google Scholar] [CrossRef]
  64. Fox, R.J.; Bellwood, D.R. Remote video bioassays reveal the potential feeding impact of the rabbitfish Siganus canaliculatus (f: Siganidae) on an inner-shelf reef of the Great Barrier Reef. Coral Reefs 2008, 27, 605–615. [Google Scholar] [CrossRef]
  65. Ferrari, B.; Raventos, N.; Planes, S. Assessing effects of fishing prohibition on Posidonia oceanica seagrass meadows in the Marine Natural Reserve of Cerbère-Banyuls. Aquat. Bot. 2008, 88, 295–302. [Google Scholar] [CrossRef]
  66. Carroll, J.M.; Stubler, A.D.; Finelli, C.M.; Peterson, B.J. The potential use of seagrass herbivory patterns as an indicator of herbivore community change after tropical marine protected area establishment. Gulf Caribb. Res. 2019, 30, SC1–SC6. [Google Scholar] [CrossRef] [Green Version]
  67. Duffy, J.E.; Cardinale, B.J.; France, K.E.; McIntyre, P.B.; Thébault, E.; Loreau, M. The functional role of biodiversity in ecosystems: Incorporating trophic complexity. Ecol. Lett. 2007, 10, 522–538. [Google Scholar] [CrossRef] [Green Version]
  68. Burkholder, D.A.; Heithaus, M.R.; Fourqurean, J.W.; Wirsing, A.; Dill, L.M. Patterns of top-down control in a seagrass ecosystem: Could a roving apex predator induce a behaviour-mediated trophic cascade? J. Anim. Ecol. 2013, 82, 1192–1202. [Google Scholar] [CrossRef]
  69. Wallner-Hahn, S.; de la Torre-Castro, M.; Eklöf, J.S.; Gullström, M.; Muthiga, N.A.; Uku, J. Cascade effects and sea-urchin overgrazing: An analysis of drivers behind the exploitation of sea urchin predators for management improvement. Ocean Coast. Manag. 2015, 107, 16–27. [Google Scholar] [CrossRef]
  70. Heithaus, M.R.; Frid, A.; Wirsing, A.J.; Dill, L.M.; Fourqurean, J.W.; Burkholder, D.; Thomson, J.; Bejder, L. State-dependent risk-taking by green sea turtles mediates top-down effects of tiger shark intimidation in a marine ecosystem. J. Anim. Ecol. 2007, 76, 837–844. [Google Scholar] [CrossRef] [Green Version]
  71. Wirsing, A.J.; Heithaus, M.R.; Dill, L.M. Fear factor: Do dugongs (Dugong dugon) trade food for safety from tiger sharks (Galeocerdo cuvier)? Oecologia 2007, 153, 1031–1040. [Google Scholar] [CrossRef]
  72. Ruíz, J.M.; Pérez, M.; Romero, J.; Tomas, F. The importance of herbivory in the decline of a seagrass (Posidonia oceanica) meadow near a fish farm: An experimental approach. Bot. Mar. 2009, 52, 449–458. [Google Scholar] [CrossRef]
  73. Hoffmann, L.; Edwards, W.; York, P.H.; Rasheed, M.A. Richness of primary producers and consumer abundance mediate epiphyte loads in a tropical seagrass system. Diversity 2020, 12, 384. [Google Scholar] [CrossRef]
  74. Young, M.A.L.; Bellwood, D.R. Diel patterns in sea urchin activity and predation on sea urchins on the Great Barrier Reef. Coral Reefs 2011, 30, 729–736. [Google Scholar] [CrossRef]
  75. Fox, R.J.; Bellwood, D.R. Unconstrained by the clock? Plasticity of diel activity rhythm in a tropical reef fish, Siganus lineatus. Funct. Ecol. 2011, 25, 1096–1105. [Google Scholar] [CrossRef]
  76. Hoey, A.S.; Bellwood, D.R. Cross-shelf variation in the role of parrotfishes on the Great Barrier Reef. Coral Reefs 2008, 27, 37–47. [Google Scholar] [CrossRef]
  77. Valentine, J.F.; Heck, K.L.; Blackmon, D.; Goecker, M.E.; Christian, J.; Kroutil, R.M.; Kirsch, K.D.; Peterson, B.J.; Beck, M.; Vanderklift, M.A. Food web interactions along seagrass-coral reef boundaries: Effects of piscivore reductions on cross-habitat energy exchange. Mar. Ecol. Prog. Ser. 2007, 333, 37–50. [Google Scholar] [CrossRef]
  78. Randall, J.E. Grazing effect on sea grasses by herbivorous reef fishes in the West Indies. Ecology 1965, 46, 255–260. [Google Scholar]
  79. Sluka, R.D.; Miller, M.W. Herbivorous fish assemblages and herbivory pressure on Laamu Atoll, Republic of Maldives. Coral Reefs 2001, 20, 255–262. [Google Scholar] [CrossRef]
  80. Tribble, G.W. Reef-basel herbivores and the distribution of two seagrasses (Syringodium filiforme and Thalassia testudinum) in the San Blas Islands (Western Caribbean). Mar. Biol. 1981, 65, 277–281. [Google Scholar] [CrossRef]
  81. Jinks, K.I.; Brown, C.J.; Rasheed, M.A.; Scott, A.L.; Sheaves, M.; York, P.H.; Connolly, R.M. Habitat complexity influences the structure of food webs in Great Barrier Reef seagrass meadows. Ecosphere 2019, 10. [Google Scholar] [CrossRef] [Green Version]
Figure 1. Map of study sites.
Diversity 13 00012 g001
Figure 2. (a) Macroherbivore exclusion cages; (b) procedural control cages that allowed macroherbivores to access seagrass (with one of the holes outlined); (c) tethers deployed in the meadow; (d) fish bite marks seen on tethered seagrass with urchin shred mark (d-inset).
Diversity 13 00012 g002
Figure 3. Seagrass loss (mgDW) per tether due to macroherbivory (turtle bites excluded) during the experiment (a) and bites per tether showing the overall total and types of bite marks present (b).
Diversity 13 00012 g003
Figure 4. Bites per seagrass blade in control plots of all species found at all sites.
Diversity 13 00012 g004
Figure 5. Aboveground biomass (a), shoot density (b), belowground biomass (c) and bite marks per core (d) in all treatments at all sites at the end of the exclusion cage experiment.
Diversity 13 00012 g005
Table 1. Characteristics of the different sites used in this study.
SiteSpecies CompositionDepthMean Aboveground Biomass/gDW m−2Mean Shoot Density/m−2HabitatExperiment
1C. rotundata
T. hemprichii
0–2 m213.81605In meadowCages and tethering
2H. ovalis
T. hemprichii
0–2.5 m13.11208In reef patchCages
2aC. rotundata
T. hemprichii
0–2.5 m--In meadowTethering
3C. rotundata
C. serrulata
H. uninervis
S. isoetifolium
T. hemprichii
1–3 m181.38649In meadowCages and tethering
Table 2. Percentage of daily seagrass productivity consumed as a percentage of daily productivity per shoot in the wet season (February, October, December) and dry season (April, June, August). Productivity and seagrass consumption shown as mean ± SE.
SiteSeasonSpeciesProductivitySeagrass ConsumptionProductivity Consumed by
(mg day−1 shoot−1)(mg day−1 shoot−1)Macroherbivores
1WetC. rotundata1.68 ± 0.560.21 ± 0.418–25%
T. hemprichii1.57 ± 0.560.15 ± 0.296–13%
DryC. rotundata1.32 ± 0.480.19 ± 0.284–30%
T. hemprichii1.63 ± 0.930.30 ± 0.4513–23%
2WetC. rotundata1.68 ± 0.560.02 ± 0.061–2%
T. hemprichii1.57 ± 0.560.06 ± 0.150.25–11%
DryC. rotundata1.32 ± 0.480.13 ± 0.441–30%
T. hemprichii1.63 ± 0.930.09 ± 0.261–13%
3WetC. rotundata1.68 ± 0.560.27 ± 0.364–25%
T. hemprichii1.57 ± 0.560.30 ± 0.397–44%
DryC. rotundata1.32 ± 0.480.07 ± 0.122–11%
T. hemprichii1.63 ± 0.930.26 ± 0.463–33%
Publisher’s Note: MDPI stays neutral with regard to jurisdictional claims in published maps and institutional affiliations.

