Abstract
Coral reefs are susceptible to climate change, anthropogenic influence, and environmental stressors. However, corals in Kāneʻohe Bay, Hawaiʻi have repeatedly shown resilience and acclimatization to anthropogenically-induced rising temperatures and increased frequencies of bleaching events. Variations in coral and algae cover at two sites—just 600 m apart—at Malaukaʻa fringing reef suggest genetic or environmental differences in coral resilience between sites. A reciprocal transplant experiment was conducted to determine if calcification (linear extension and dry skeletal weight) for dominant reef-building species, Montipora capitata and Porites compressa, varied between the two sites and whether or not parent colony or environmental factors were responsible for the differences. Despite the two sites representing distinct environmental conditions with significant differences between temperature, salinity, and aragonite saturation, M. capitata growth rates remained the same between sites and treatments. However, dry skeletal weight increases in P. compressa were significantly different between sites, but not across treatments, with linear mixed effects model results suggesting heterogeneity driven by environmental differences between sites and the parent colonies. These results provide evidence of resilience and acclimatization for M. capitata and P. compressa. Variability of resilience may be driven by local adaptations at a small, reef-level scale for P. compressa in Kāneʻohe Bay.
1. Introduction
Anthropogenically-induced rising sea surface temperatures, ocean acidification, and progressively frequent bleaching events threaten shallow tropical coral reef ecosystems globally [1,2]. Currently, reefs are undergoing significant declines as environmental conditions are favorable to algal growth, which smother corals, leading to a worldwide phase-shift from coral-dominated reefs to algae-dominated reefs [3]. The resilience of coral reefs to anthropogenic and environmental stressors is key to ensuring their longevity [4]. Some species and individuals of corals and coral reefs, for example, exhibit resilience through a natural resistance to bleaching [5]. Additionally, individual corals may acclimatize to more frequent bleaching events [6] and survive to pass down their resistance, so the population can adapt and become more resilient [7,8,9]. While genotype and genetic variation can impact coral survivorship, environmental conditions also influence coral responses (e.g., growth, bleaching, etc.) [10].
Coral reefs in Kāneʻohe Bay, one of the most well-studied estuarine reef ecosystems, have shown more resilience and higher tolerances in response to stressors [11], such as increased temperatures and decreased pH, in comparison to corals from other Hawaiian localities [12]. Kāneʻohe Bay coral reefs have recovered from anthropogenic and environmental stressors such as sewage discharge [13], freshwater inundation [14], and three major bleaching events [15]. The reefs in Kāneʻohe experience subaerial exposure at low tides [16] and, during summer months, experience 1–2 °C elevated water temperatures similar to the mean global middle/end of the century IPCC scenarios [17]—which offshore reefs will not be exposed to for several years—due to restricted flow [11]. Environmental disturbances, such as those in Kāneʻohe Bay, may increase resilience to bleaching [5]. For example, coral cover on the Malaukaʻa fringing reef in central Kāneʻohe Bay has remained stable over the last 18 years [18]. The resilience of corals to anthropogenic and environmental stressors and extreme temperatures [11] makes Kāneʻohe Bay an ideal study site to explore the responses of individual corals to different environmental conditions.
A recent study suggests local adaptation could be the mechanism driving coral resilience in Kāneʻohe Bay [19]. Following the most recent thermal-stress driven bleaching event in 2015, corals in different areas of the Bay recovered at different rates [15]. A 2018 benthic survey completed on the Malaukaʻa fringing reef revealed variations in benthic cover at two sites just 600 m apart from one another [18]. Benthic cover within 30 m of Site 1 had 38.9% coral cover and 58.3% algae cover, while the cover within 30 m of Site 2 had 62.5% coral cover and 25% algae cover (Figure 1) (Barnhill, unpublished data). These observations led to the question of whether genetic variability influences resilience between corals in the Bay, specifically at Malaukaʻa fringing reef.
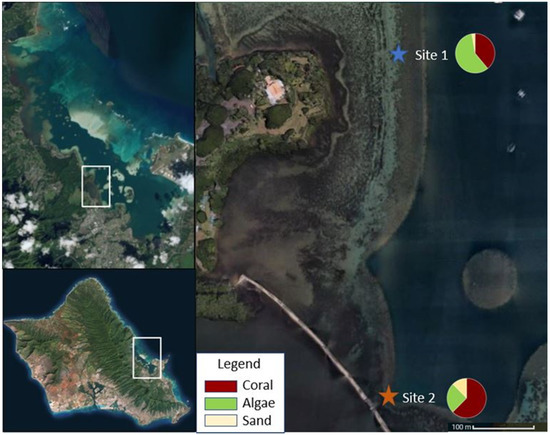
Figure 1.
Map of Malaukaʻa fringing reef situated in Kāneʻohe Bay, Oʻahu with Site 1 and Site 2 identified and benthic cover described. Picture credit: Digital Globe.
In the era of molecular and genetic studies, common garden and reciprocal transplant experiments are often overlooked despite their ability to test whether local adaptations affect phenotypic traits [20]. A reciprocal transplant experiment at Kāneʻohe Bay was used to determine if calcification variability between two sites could be described by environmental conditions or acclimatory plasticity. Porites compressa and Montipora capitata were the selected species for this experiment as they are the most common reef-building corals in Kāneʻohe Bay [11]. Calcification was the chosen parameter for measurements, as Smith et al. [21] suggests basing coral reef health on reef-building capacities of the corals, defining healthy reefs as those dominated by accreting and calcifying reef-building corals. Unhealthy, algae-dominated reefs show depressed calcification rates compared to coral-dominated reefs [22], and temperature-induced bleaching can decrease or halt calcification rates [23], which must remain above the rate of erosion/dissolution to maintain coral cover and net accretion [24]. Additionally, calcification rates are known to be heritable for these species of corals in Oʻahu [25]. The objectives of this experiment were to (1) determine if M. capitata and P. compressa calcify at different rates between the two sites and if so, (2) determine if environment or genetics explained the differences in calcification between sites.
2. Materials and Methods
2.1. Study Site
This research was conducted in Kāneʻohe Bay, Hawaiʻi (21.4° N, 157.8° W). A barrier reef separates the ocean from the inshore estuarine Bay system, which is characterized by numerous shallow patch reefs (<1 m depth) and a shallow fringing reef (0.3–0.9 m depth) ringing the majority of the shoreline [16]. Coral reefs in the Bay have one of the highest percentages of coral cover (54–68%) among 32 hard-bottom habitat monitoring sites with permanent transects at 3 and 10 m depths within the main Hawaiian Islands (Hawaii average = 24.1%) [14,15,26]. Site 1 (21.44300899° N, 157.80636° W) was located approximately 125 m offshore of Kealohi Point at Heʻeia State park. Site 2 (21.43853104° N, 157.806541° W) was located just 25 m away from the Paepae o Heʻeia (Heʻeia traditional Hawaiian fishpond), directly in front of a triple mākāhā (sluice gate) providing freshwater input. Both sites were located on the inshore edge of Malaukaʻa fringing reef (Figure 1).
2.2. Environmental Parameters
The temperature (°C) at the two sites was recorded continuously during the experimental period (50 days, June–July 2018) using Hobo Pro V2 temperature loggers (Onset Computer Corporation). Sediment accumulation (mg cm−2 hr−1) was measured quarterly (n = 5 times) from May 2017–June 2018 by deploying two sediment traps at each site for 24 h. Sediment traps were constructed of polyvinyl chloride (PVC) with a diameter of 5 cm, and sediment weight was used to calculate sediment accumulation in mg cm−1 [27,28]. Nutrient data (i.e., nitrogen, phosphorous, phosphate, silicate, and ammonia) (μmol L−1) were taken during three quarterly samplings in September 2017, December 2017, and March 2018. Salinity (ppt), turbidity (NTU), pH (pHT), and Aragonite saturation (ΩAr) were recorded during seawater chemistry sampling over two 12 h cycles in July 2018. Salinity was recorded using an YSI 556 MPS (Xylem Analytics), and grab samples at each site were collected to measure turbidity with a 2100Q Portable Turbidimeter (Hach). Additional turbidity measurements beyond the two 12 h cycles were collected during the experimental period (June–July 2018). Optical pH measurements on the total scale (pHT) were made with m-cresol purple dye using an on-site LC Mass Spectrometer following carbonate chemistry standard procedures [29]. Two or more analyses were performed for each sample to reach a standard deviation of 0.01 or less. Total Alkalinity was measured using the Titrino© Plus 877, Metrohm automatic titrator. ΩAr was calculated from pH and Total Alkalinity values using the CO2SYS V2.1 Calc program for Excel [30].
2.3. Experimental Setup
Fragments from colonies of Porites compressa (n = 5) and Montipora capitata (n = 5) were collected within ~35 m of each other at each site at approximately 1 m depth and cut into coral nubbins (six nubbins per colony) of comparable size (11.66 g ± 2.95) for a total of 60 nubbins of P. compressa (n = 30) and M. capitata (n = 30) per site. Most individuals were collected from colonies 4–6 m apart, with the closest two colonies being within 0.5 m of one another. However, as colonies were not genotyped, differences between colonies cannot be confirmed. Corals were collected under a State of Hawai’i Special Activities Permit (SAP 2019-16 issued 11 April 2018).
Coral nubbins were tagged and affixed onto ceramic pedestals in an upright position and placed on one of six trays. Thirty nubbins of each species were randomly selected to either remain at the collection site (“Site 1 resident”: coral nubbin originally from Site 1 which remained at Site 1 during the experiment) or be transplanted to the reciprocal site (”Site 1 transplant”: coral nubbin originally from Site 2 which was transplanted to Site 1 during the experiment). One nubbin per colony was randomly placed on each tray to avoid pseudoreplication. Trays were placed in a triangular formation 0.5 m away from one another. The experiment took place over a 50-day period (11 June–31 July 2018). Calcification rates, including linear extension and dry skeletal weight increases, were quantified over the 50-day period (described below) [31]. Five P. compressa fragments with high levels of partial mortality (>80% tissue loss) at the end of the 50-day period were removed from the calcification analysis.
2.3.1. Coral Growth Measurements: Linear Extension
To measure linear extension rates, nubbins were stained prior to the start of the experiment using the Alizarin sodium monosulfonate (hereafter Alizarin) technique [32]. Coral nubbins were stained in an aerated 475 L tank with Alizarin concentration at 15 ppm for 8 h in direct sunlight [33]. Corals were unharmed during the staining process as Alizarin concentrations below 20 ppm are not damaging [34]. At the end of the 50-day experiment, all nubbins were exposed to a mixture of freshwater and bleach for 12 h to remove tissue and expose the stained skeleton. Calipers were used to measure coral skeletal growth from the stain to the point of maximum linear growth in mm to 1 decimal point (Figure 2). If a nubbin had multiple branches, the maximum linear growth was measured for each branch, and the mean value recorded. All linear extension values were converted to mm d−1.
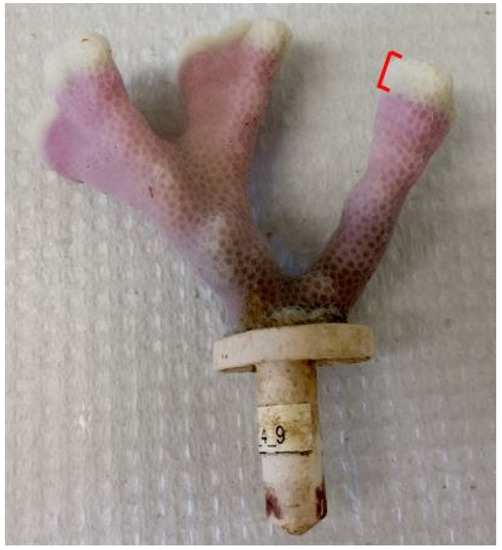
Figure 2.
A stained P. compressa nubbin’s exposed skeleton. Linear extension was measured from the stain to the white growth tip. Picture credit: Kelsey Archer Barnhill.
2.3.2. Coral Growth Measurements: Dry Skeletal Weight
To measure coral dry skeletal weight increases, each nubbin was weighed using the buoyant weight technique [35] before and after the 50-day experiment. Values were converted to dry skeletal weight [35], and change in mg g−1 d−1 was calculated.
2.4. Statistical Analysis
Descriptive and statistical analyses were conducted using Rstudio running R version 3.6.3 [36,37]. Environmental conditions (i.e., temperature, salinity, turbidity, sediment accumulation, pH, and ΩAr) between sites were analyzed using two-tailed paired t-tests. A Bonferroni correction (significant at p < 0.008) was used to counteract the multiple tests (n = 6) between environmental parameters. Assumptions of normal distribution and homoscedasticity were assessed through graphical analysis of the residuals. Pearson’s and Spearman’s rank correlation tests were carried out to investigate the relationship between dry skeletal weight and linear extension rates. For each species, the differences in dry skeletal weight and linear extension rates between destination sites, treatment (resident or transplant), and the interaction between the two, were analyzed using linear mixed effect models via the lmer () function from the lme4 package [38]. The linear mixed effects model was run for each species and each calcification measurement, separately. The mixed effect models used destination site, treatment, and the cross between destination site and treatment as fixed factors. The parent colony was included as a random factor nested within the original site (Original_Site:Parent_Colony) to control for multiple nubbins being cut from the same parent colony. The tray nested within destination site (Destination_Site:Tray) was set as a random effect to control for the effect of multiple nubbins being placed on the same tray.
We followed a two-step procedure to select the most parsimonious models: First, the model was run both with all fixed and random effects and then again with just the random effects; these were compared using anova () and by comparing the Akaike information criterion (AIC) values. In all cases, the model without Tray (Destination_Site:Tray) was deemed a better fit as it only explained <1% of the variation and had a higher AIC value. Secondly, with the random effect of Destination_Site:Tray removed, the effect of destination site, treatment, and their interaction was assessed using the lmer () function. A stepwise process of fixed effect removal was performed with models being compared using anova () and AIC values. The model with the lowest AIC value was selected. Model residuals were plotted and assessed for normal distribution and homoscedasticity using the ols_test_normality () function in the olsrr package [39]. Due to lmer () not producing p-values to assess significance, estimates that had a t-value of above 2 were accepted as a true effect [40]. All plots were produced using ggpubr [41] and ggplot2 [42] packages in Rstudio.
3. Results
3.1. Environmental Parameters
The mean midday (11:00–14:00) temperature (°C) (mean ± SD) at Site 1 (27.72 ± 0.94) was significantly higher than Site 2 (27.48 ± 0.96) (paired t-test; p < 0.0001) (Table 1). Site 1 also had a larger range of temperatures (25.89–31.94 °C) than Site 2 (25.67–30.72 °C) during the 50-day experiment. The mean salinity (ppt) at Site 1 (32.91 ± 2.20) was significantly higher than at Site 2 (29.68 ± 2.86) (paired t-test; p = 0.0037). There were no significant differences in mean turbidity (NTU) between Site 1 (0.38 ± 0.17) and Site 2 (0.97 ± 0.39) (paired t-test; p = 0.011). There was also no significant difference in mean sediment accumulation (mg cm−2 hr−1) between sites (Site 1: 0.34 ± 0.09; Site 2: 0.66 ± 0.29; paired t-test; p = 0.078). The mean pH (pHT) was also not significantly different at 8.28 ± 0.21 at Site 1 and 8.26 ± 0.10 at Site 2 (paired t-test; p = 0.744). There was a significant difference in ΩAr with Site 1 experiencing more elevated saturations (2.13 ± 0.50) than Site 2 (1.73 ± 0.56) (paired t-test; p = 0.0079). The average of three nutrient samplings for nitrogen, phosphorus, phosphate, silicate, and ammonia (μmol L−1) was 5.88, 0.33, 0.19, 10.34, and 0.45, respectively, for Site 1, and 7.11, 0.37, 0.16, 21.07, and 0.71, respectively, for Site 2. Nutrient differences between sites are presented as solely descriptive and were not tested for significance due to the small sample size (n = 3).

Table 1.
Environmental parameters for each site.
3.2. Correlation between Dry Skeletal Weight and Linear Extension Rates
Within the data for both species, there was one sample in each that had an unusually high dry skeletal weight increase (9.2 mg g−1 d−1 for M. capitata and 13.2 mg g−1 d−1 for P. compressa) which were treated as outliers. The outliers are included in the descriptive statistics and visualizations. The data for M. capitata were assessed for normality using histograms and Shapiro–Wilk’s test and were found to be normally distributed. Therefore, a Pearson’s correlation test was used to assess the relationship between dry skeletal weight and linear extension rates. The data for P. compressa were also assessed using histograms and Shapiro–Wilk’s test. The distribution for linear extension rates was not normally distributed; therefore, a Spearman’s rank correlation test was used to assess the relationship between dry skeletal weight and linear extension rates (Figure 3). There was a strong positive correlation between both measures of calcification for P. compressa (rs = 0.58, p < 0.0001) and M. capitata (R2 = 0.65, p < 0.0001) (Figure 3A). This is to be expected as the buoyant weight technique for measuring dry skeletal weight increase includes skeletal mass accrued by linear extension. However, these R2 and rs values were lower than 1, showing that there was also accretion across the entire coral and not just the growing tips of branches. The same process was repeated but with the outliers kept in (Figure 3B). For both species, the data were not normally distributed, so a Spearman’s rank correlation test was used. The results were the same for P.compressa with the outliers both kept in and taken out. However, for M. capitata there was a marginal decrease in strength of positive correlation.
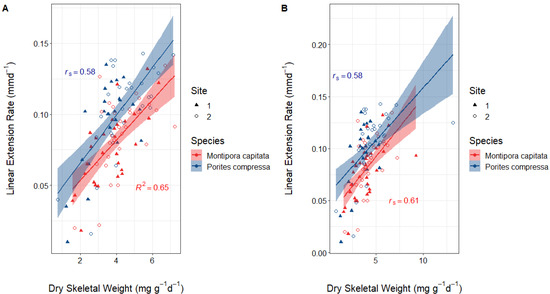
Figure 3.
Correlations between dry skeletal weight and linear extension rates for both P. compressa and M. capitata (A) with the outliers removed and (B) with the outliers left in. (A) The data for M. capitata were normal; therefore, R2 (0.65, p < 0.0001) was calculated using Pearson’s correlation test. Linear extension rates for P. compressa were not normal; therefore, rs (0.58, p < 0.0001) was calculated using Spearman’s rank correlation test. (B) Dry skeletal weight was not normally distributed for M. capitata; therefore, Spearman’s rank correlation test was used (rs = 0.61, p < 0.0001). For P. compressa, neither dry skeletal weight nor linear extension rates were normal, so Spearman’s Rank correlation was also used (rs = 0.58, p < 0.0001). Symbols distinguish nubbins placed at the two destination sites.
3.3. Coral Growth Measurements
The mean linear extension rate (mean ± SD) for M. capitata across treatments was 0.076 ± 0.025 mm d−1 at Site 1 and 0.087 ± 0.026 mm d−1 at Site 2. The mean linear extension rate for P. compressa across treatments was 0.091 ± 0.032 mm d−1 at Site 1 and 0.106 ± 0.031 mm d−1 at Site 2. See Table 2 for the linear extension broken down by treatment.
Table 2.
Mean linear extension and dry skeletal weight ± SD for resident and transplant M. capitata and P. compressa coral nubbins at each site with outliers included.
Montipora capitata had a mean dry skeletal weight increase across treatments (mean ± SD) of 3.66 ± 1.22 mg g−1 d−1 at Site 1 and 4.32 ± 1.18 mg g−1 d−1 at Site 2. With the outliers kept in these values were 3.85 ± 1.55 mg g−1 d−1 at Site 1 and unchanged at Site 2. Porites compressa had a mean dry skeletal weight increase across treatments of 3.46 ± 1.07 mg g−1 d−1 at Site 1 and 4.38 ± 1.34 mg g−1 d−1 at Site 2. With the outliers kept in these values were the same at Site 1 but increased to 4.67 ± 2.04 mg g−1 d−1 at Site 2. See Table 2 for dry skeletal weight increases broken down by treatment.
3.4. Reciprocal Transplant Results
Linear mixed effects models (Table 3 and Tables S1–S3) were used for each species to test whether the reciprocal transplant experiment impacted calcification. All statistical tests were performed on the data with the outliers removed. These outliers likely occurred due to field conditions and/or human error as there was some wind interference while weighing coral samples. The data were normal, and models had a better fit after the two outliers were removed.
Table 3.
Results of the linear mixed effects model for P. compressa dry skeletal weights.
3.4.1. Montipora capitata Results
There were no significant differences in linear extension rates across sites or treatments for M. capitata. The most parsimonious model with the lowest AIC included destination site and treatment but left the interaction term excluded (Table S2). The parent colony described ~36% of the total variation. There were also no significant differences in dry skeletal weight increases across sites or treatments for M. capitata. The most parsimonious model with the lowest AIC included destination site, treatment, and their interaction as fixed effects (Table S3). The parent colony explained ~49% of the total variation.
3.4.2. Porites compressa Results
There were no significant differences in linear extension rates across sites or treatments for P. compressa. The most parsimonious model with the lowest AIC included destination site and treatment but left the interaction term excluded (Table S1). The parent colony described ~24% of the total variation. Dry skeletal weight increases were significantly different between Site 1 and Site 2 residents for P. compressa as the destination site had a positive effect on growth (Table 3) at t value > 2. The highest overall dry skeletal weight was seen in Site 2 resident nubbins at (mean ± SD) 5.59 ± 2.31 mg g−1 d−1 (Figure 4) and was significantly higher than Site 1 residents (a difference of 2.08 mg g−1 d−1). Neither treatment nor interaction had a true effect on dry skeletal growth weights. The most parsimonious model with the lowest AIC included destination site, treatment, and their interaction as fixed effects. The parent colony explained ~28% of the total variation.
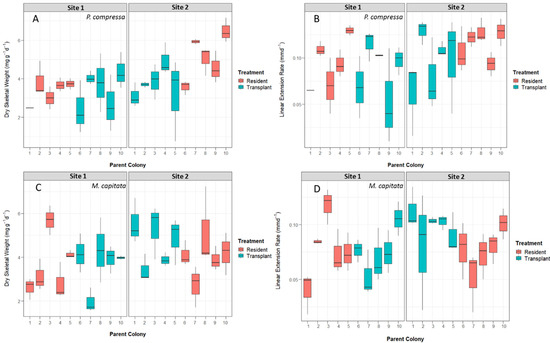
Figure 4.
Boxplots of calcification rates by parent colony and treatment across both Site 1 and Site 2. (A) Dry skeletal weight for P. compressa separated by destination site number and parent colony. (B) Dry skeletal weight for M. capitata separated by destination site number and parent colony. (C) Linear extension rates for P. compressa separated by destination site number and parent colony. (D) Linear extension rates for M. capitata separated by destination site number and parent colony. The bold line in each box represents medians, and box limits represent the 25th to 75th percentiles of the data. Whiskers extend to data points that are less than 1.5 times the interquartile range away from 1st or 3rd quartile.
4. Discussion
This study sought to explore how environment, genetics, and changes in environment impact calcification of reef-building corals. Variability in coral percent cover between two sites at the Malaukaʻa fringing reef could be caused by environmental differences between sites, genetic variations in individual corals from different parent colonies, or a combination of the two. Calcification differences between populations of each species at the two sites during the reciprocal transplant could potentially indicate genetic-based coral resilience [43].
4.1. Environmental Parameters
Corals at the two sites experienced different environmental conditions during the experiment as there were significant differences in temperature, salinity, and ΩAr. The midday average temperature experienced by corals at Site 1 was 0.24 °C higher than the average temperature experienced by corals at Site 2. Additionally, corals at Site 1 experienced two days with temperatures above the upper thermal threshold for Hawaiian corals (31 °C) [44,45] which Site 2 never reached, with a maximum temperature of 30.72 °C. The dynamic temperatures corals from Site 1 experienced may have helped increase their resistance to thermal bleaching, as high-frequency temperature variability has been found to mitigate bleaching [46].
Salinities were also significantly different between the two. At Site 1, the mean salinity (32.91 ppt) was significantly higher than at Site 2 (29.68 ppt). The lower salinity at Site 2 was likely caused by freshwater input from the adjacent stream and fishpond. Site 2 also experienced greater fluctuations in salinity levels with higher salinities during flood tides (maximum salinity observed = 33.01) and lower levels during ebb tides (minimum salinity observed = 23.7), as water from the adjacent fishpond flowed out of the triple mākāhā (sluice gates) onto the site. While the average salinity at each site was within threshold levels for coral reefs (>25 ppt, <45 ppt), salinity at Site 2 was below the previously recorded salinity range for Kāneʻohe Bay of 30.9–36.2 ppt [47]. Historically low salinity at Site 2 may be attributed to biocultural restoration conducted at the fishpond by local nonprofit groups (e.g., fishpond wall repair, alien mangrove removal) as a mean 5802 m3 of water flowed into the reef during each ebb tidal cycle pre-restoration (2012) compared to 20,220 m3 in 2018 [48]. Despite salinity values at Site 2 dropping below reef threshold levels, the depressed salinity did not negatively impact coral growth.
Based on two days of 12 h sampling of carbonate chemistry measurements, the ΩAr levels appeared to have spatial variability as well. The mean ΩAr levels at both sites (2.13, 1.73, respectively) were significantly lower than the 1998 global average of 3.8, as well as the global minimum mean of 3.3 [49]. The ΩAr levels in Kāneʻohe Bay were low relative to other sites around Oʻahu (ΩAr~3.5–4.0) [25]. Earlier research [50] stated that ΩAr levels are above 3.0 for all prominent reef ecosystems; however, since then, inshore reefs have been found to be capable of continued growth in ΩAr levels below what was once predicted as detrimental to coral health, including in undersaturated areas [51,52].
Despite low states of ΩAr, the average pH values at the Kāneʻohe sites (8.28, 8.26 pHT at Site 1 and 2) were within the average range of other coral reef systems (Ningaloo reef = 8.22–8.64; Great Barrier reef = 7.98–8.37; Media Luna reef (Puerto Rico) = 8.01–8.09) [53,54]. While the mean sediment accumulation (mg cm−2 hr−1) rates were not significantly different from one another between sites (0.34, 0.66 at Sites 1 and 2, respectively), the rate seen at Site 1 was within the mean rates for reefs not greatly impacted by human development (0.04~0.42), while the rate at Site 2 implies sediment accumulation has been anthropogenically-elevated and/or resuspended [55]. This is expected, as Site 2 is directly in front of a triple mākāhā from the fishpond. This freshwater influx as well as possible runoff from the nearby Heʻeia stream are likely to be the causes for the elevated sediment accumulation rates. Proximity to the triple mākāhā likely also influenced turbidity (NTU) at Site 2 (mean of 0.97 vs. 0.38 at Site 1). However, turbidity was not significantly different between sites (p = 0.011) due to using the Bonferroni corrected p < 0.008. The turbidity measurements at both sites were within mean turbidity levels seen at the Great Barrier Reef [56].
Nutrient data suggest there may be further differences between sites that we were not able to quantify. Values of nitrogen and silicate (μmol L−1) were higher at Site 2 (7.11, 21.07) than Site 1 (5.88, 10.34). These elevated nutrient levels at Site 2 were likely caused by input from the nearby stream and fishpond. While enriched nitrogen levels can reduce calcification rates in corals by up to 50%, such reductions are only seen at higher nitrogen concentrations (20 μmol L−1) than were observed at either site [57,58].
4.2. Reciprocal Transplant
Calcification is a good indicator of coral health as up to 30% of a coral’s energy is allocated to calcification [59]. Extension is characterized by low-density, fast upward growth at the tips and can be referred to as primary calcification [60]. Accretion (presented here as dry skeletal weight) follows extension and is a slower, outward growth from the sides of the coral, also referred to as secondary calcification [60]. Through measuring extension and dry skeletal weight, the results of this study explored both primary and secondary calcification. Extension and dry skeletal weight showed strong correlations for both species (R2 of 0.61 and 0.58 for M. capitata and P. compressa, respectively) indicating that the two growth mechanisms occur at similar time scales for these species [61]. However, as the results of the correlation tests (R2 and rs) values were not equal to 1, both primary and secondary calcification occurred, corroborating the findings of Dodge and Brass [62], who suggest measuring more than one parameter to sufficiently describe coral growth.
Primary calcification rates for both species were similar to previously quantified rates in Kāneʻohe Bay [63,64]. The similarity in extension rates for both species between sites indicates that the transplanted corals were able to acclimatize to their new environment and continue to extend upwards at similar rates.
The dry skeletal weight increases for M. capitata (4.082 ± 1.40 mg g−1 d−1) were higher than the previous maximum of 3.5 mg g−1 d−1 seen in Kāneʻohe Bay [45]. The results from this study show dry skeletal weight and linear extension for M. capitata were consistent across sites, regardless of environmental conditions. The parent colony was an important indicator for determining M. capitata calcification, explaining 36% of the variation for linear extension rates and 49% for dry skeletal weight. Growth and no mortality between sites support the ability of M. capitata to acclimatize to new environments, including environments with thermal stressors, low ΩAr levels, and low salinities.
Results from this study reveal that dry skeletal weight increases for P. compressa significantly differ between sites. As there was no significant effect between treatments, this shows the environment at Site 2 created more favorable conditions for dry skeletal weight increases, as both the resident and transplants at the site grew more than either treatment at Site 1. Thus, secondary calcification of P. compressa in Kāneʻohe Bay is influenced by environmental conditions, individual resilience, and colony genetics driving local adaptation. This was supported by the variance described not just by fixed factors, but also by the random effect of the parent colony, which described 28% of the variability. Aside from population-wide acclimatization trends, variation occurred at the individual level as well. Two out of three nubbins from the same colony of P. compressa died at the Site 1 resident treatment, while the third nubbin suffered 50% mortality with the remaining 50% pale. Future studies should further explore the responses of individuals from the same colony to better understand the genetic influence on acclimatization and resilience.
The survivorship and calcification rates of P. compressa have previously been found to be highly susceptible to elevated temperature and acidification, indicating that the species is sensitive to changes in environmental conditions [65]. The decreased dry skeletal weights at Site 1 could be driven by significantly higher temperatures experienced at that location. Dry skeletal weight increase was higher at Site 2 despite its depressed salinity values (minimum observed = 23.7 ppt) and low ΩAr (Minimum observed = 1.19). While calcification rates can be affected by different environmental conditions (e.g., nutrient levels, light, ΩAr, etc.), temperature has been found to be particularly important [45,66]. Calcification rates for Porites spp. are sensitive to thermal stress as a 1 °C increase in temperature decreases calcification rates by 0.40 g cm−2 yr−1 [66] and a 2.8 °C increase can reduce calcification rates in P. compressa by 51% [67]. The increased availability of nutrients at Site 2 is likely to have also positively impacted calcification rates. The changes in dry skeletal weights between sites thus corroborates previous findings that P. compressa is sensitive to environmental changes. The finding that environment, local adaptations, and acclimatization abilities influence P. compressa’s and Montipora capitata’s calcification rates in Kāneʻohe Bay adds to the growing body of evidence revealing resilience in this unique ecosystem. This also has management implications; it is important not only to consider the environment when modeling coral responses to stressors and coordinating reef restoration and outplanting efforts but also genetic legacies and maintaining diversity in the corals.
Supplementary Materials
The following are available online at https://www.mdpi.com/1424-2818/12/9/347/s1, Table S1: results of the linear mixed effects model for P. compressa linear extension; Table S2: results of the linear mixed effects model for M. capitata linear extension; Table S3: results of the linear mixed effects model for M. capitata dry skeletal weights.
Author Contributions
Conceptualization, K.A.B., I.B., and K.B.; methodology, K.A.B., K.R., and K.B.; software, K.A.B., N.J., C.B., and K.B.; validation, K.A.B., N.J., and K.B.; formal analysis, K.A.B., N.J., and C.B.; investigation, K.A.B., C.B., and A.M.; resources, K.R., I.B., and K.B.; data curation, K.A.B., N.J., and C.B.; writing—original draft preparation, K.A.B. and N.J.; writing—review and editing, K.A.B., N.J., C.B., A.M., K.R., I.B., and K.B.; visualization, K.A.B., N.J., and K.B.; supervision, K.R., I.B., and K.B.; project administration, K.A.B., A.M., and K.B.; funding acquisition, K.A.B. All authors have read and agreed to the published version of the manuscript.
Funding
K.A.B. acknowledges NMBU’s Noragric field stipend for travel support to conduct research.
Acknowledgments
Thank you to Coral Reef Ecology Lab members, Ilina Gobburu, and Robert Barnhill for field and logistical support. Thank you to Chris Jury for assisting with visual coral fragment health checks at the end of this experiment. K.A.B. thanks her master’s thesis external examiner, Magnus Nyström, for providing helpful comments and feedback on the portions of this manuscript included in her thesis defense. Finally, thank you to the three anonymous reviewers who invested their time to provide comments which improved manuscript quality.
Conflicts of Interest
The authors declare no conflict of interest.
References
- Hoegh-Guldberg, O.; Mumby, P.J.; Hooten, A.J.; Steneck, R.S.; Greenfield, P.; Gomez, E.; Harvell, C.D.; Sale, P.F.; Edwards, A.J.; Caldeira, K.; et al. Coral reefs under rapid climate change and ocean acidification. Science 2007, 318, 1737–1742. [Google Scholar] [CrossRef] [PubMed]
- Hughes, T.P.; Kerry, J.T.; Álvarez-Noriega, M.; Álvarez-Romero, J.G.; Anderson, K.D.; Baird, A.H.; Babcock, R.C.; Beger, M.; Bellwood, D.R.; Berkelmans, R.; et al. Global warming and recurrent mass bleaching of corals. Nature 2017. [Google Scholar] [CrossRef]
- Bonaldo, R.M.; Hay, M.E. Seaweed-coral interactions: Variance in seaweed allelopathy, coral susceptibility, and potential effects on coral resilience. PLoS ONE 2014. [Google Scholar] [CrossRef]
- Mumby, P.J.; Wolff, N.H.; Bozec, Y.M.; Chollett, I.; Halloran, P. Operationalizing the resilience of coral reefs in an era of climate change. Conserv. Lett. 2014. [Google Scholar] [CrossRef]
- West, J.M.; Salm, R.V. Resistance and Resilience to Coral Bleaching: Implications for Coral Reef Conservation and Management. Conserv. Biol. 2003, 17, 956–967. [Google Scholar] [CrossRef]
- Coles, S.L.; Brown, B.E. Coral bleaching–Capacity for acclimatization and adaptation. Adv. Mar. Biol. 2003, 46, 183–223. [Google Scholar] [CrossRef] [PubMed]
- Baker, A.C.; Starger, C.J.; McClanahan, T.R.; Glynn, P.W. Corals’ adaptive response to climate change. Nature 2004. [Google Scholar] [CrossRef]
- Pandolfi, J.M.; Connolly, S.R.; Marshall, D.J.; Cohen, A.L. Projecting coral reef futures under global warming and ocean acidification. Science 2011, 333, 418–422. [Google Scholar] [CrossRef]
- Putnam, H.M.; Ritson-Williams, R.; Cruz, J.A.; Davidson, J.M.; Gates, R.D. Nurtured by nature: Considering the role of environmental and parental legacies in coral ecological performance. BioRxiv 2018. [Google Scholar] [CrossRef]
- Drury, C.; Manzello, D.; Lirman, D. Genotype and local environment dynamically influence growth, disturbance response and survivorship in the threatened coral, Acropora cervicornis. PLoS ONE 2017. [Google Scholar] [CrossRef]
- Bahr, K.D.; Jokiel, P.L.; Toonen, R.J. The unnatural history of Kāne’ohe bay: Coral reef resilience in the face of centuries of anthropogenic impacts. PeerJ 2015. [Google Scholar] [CrossRef] [PubMed]
- Jury, C.P.; Toonen, R.J. Adaptive responses and local stressor mitigation drive coral resilience in warmer, more acidic oceans. Proc. R. Soc. B Biol. Sci. 2019, 286. [Google Scholar] [CrossRef] [PubMed]
- Pastorok, R.; Bilyard, G. Effects of sewage pollution on coral-reef communities. Mar. Ecol. Prog. Ser. 1985. [Google Scholar] [CrossRef]
- Jokiel, P.L.; Hunter, C.L.; Taguchi, S.; Watarai, L. Ecological impact of a fresh-water “reef kill” in Kaneohe Bay, Oahu, Hawaii. Coral Reefs 1993. [Google Scholar] [CrossRef]
- Bahr, K.D.; Rodgers, K.S.; Jokiel, P.L. Impact of three bleaching events on the reef resiliency of Kāne’ohe Bay, Hawai’i. Front. Mar. Sci. 2017. [Google Scholar] [CrossRef]
- Jokiel, P.L. Illustrated Scientific Guide To Kane’Ohe Bay, Oahu; Hawaii Institute of Marine Biology: Honolulu, Hawaii, 1991. [Google Scholar]
- IPCC. Climate Change 2014: Synthesis Report. Contribution of Working Groups I, II and III to the Fifth Assessment Report of the Intergovernmental Panel on Climate Change; Pachauri, R.K., Meyer, L.A., Eds.; IPCC: Geneva, Switzerland, 2014. [Google Scholar]
- Barnhill, K.A.; Bahr, K.D. Coral resilience at Malauka’a fringing reef, Kāne’ohe Bay, O’ahu after 18 years. J. Mar. Sci. Eng. 2019, 7, 311. [Google Scholar] [CrossRef]
- Ritson-Williams, R.; Gates, R.D. Coral community resilience to successive years of bleaching in Kāne‘ohe Bay, Hawai‘i. Coral Reefs 2020, 39, 757–769. [Google Scholar] [CrossRef]
- De Villemereuil, P.; Gaggiotti, O.E.; Mouterde, M.; Till-Bottraud, I. Common garden experiments in the genomic era: New perspectives and opportunities. Heredity 2016, 116, 249–254. [Google Scholar] [CrossRef]
- Smith, J.E.; Brainard, R.; Carter, A.; Grillo, S.; Edwards, C.; Harris, J.; Lewis, L.; Obura, D.; Rohwer, F.; Sala, E.; et al. Re-evaluating the health of coral reef communities: Baselines and evidence for human impacts across the central pacific. Proc. R. Soc. B Biol. Sci. 2016. [Google Scholar] [CrossRef]
- Gattuso, J.P.; Payri, C.E.; Pichon, M.; Delesalle, B.; Frankignoulle, M. Primary production, calcification, and air-sea CO2 fluxes of a macroalgal-dominated coral reef community (Moorea, French Polynesia). J. Phycol. 1997, 33, 729–738. [Google Scholar] [CrossRef]
- Carilli, J.E.; Norris, R.D.; Black, B.A.; Walsh, S.M.; McField, M. Local stressors reduce coral resilience to bleaching. PLoS ONE 2009. [Google Scholar] [CrossRef]
- Gattuso, J.P.; Frankignoulle, M.; Wollast, R. Carbon and carbonate metabolism in coastal aquatic ecosystems. Annu. Rev. Ecol. Syst. 1998. [Google Scholar] [CrossRef]
- Jury, C.P.; Delano, M.N.; Toonen, R.J. High heritability of coral calcification rates and evolutionary potential under ocean acidification. Sci. Rep. 2019, 9, 1–13. [Google Scholar] [CrossRef]
- Rodgers, K.S.; Jokiel, P.L.; Brown, E.K.; Hau, S.; Sparks, R. Over a Decade of Change in Spatial and Temporal Dynamics of Hawaiian Coral Reef Communities. Pac. Sci. 2015. [Google Scholar] [CrossRef]
- Gardner, W.D. Sediment trap dynamics and calibration: A laboratory evaluation. J. Mar. Res. 1980, 38, 17–39. [Google Scholar]
- Storlazzi, C.D.; Field, M.E.; Bothner, M.H. The use (and misuse) of sediment traps in coral reef environments: Theory, observations, and suggested protocols. Coral Reefs 2011, 30, 23–38. [Google Scholar] [CrossRef]
- Dickson, A.G.; Sabine, C.L.; Christian, J.R. Guide to Best Practices for Ocean CO2 Measurements; North Pacific Marine Science Organization: Sidney, British Columbia, 2007. [Google Scholar]
- Pierrot, D.; Lewis, E.; Wallace, D.W.R. MS Excel program developed for CO2 system calculations. In ORNL/CDIAC-105a. Carbon Dioxide Inf. Anal. Cent; Oak Ridge National Laboratory US Department Energy: Oak Ridge, TN, USA, 2006. [Google Scholar]
- Barnhill, K.A.; Brown, C.; McGowan, A.E.; Bahr, K.D. Reciprocal transplant coral growth rates for Porites compressa and Montipora capitata in Kāne’ohe Bay, O’ahu, Hawai’i. Pangaea 2020. [Google Scholar] [CrossRef]
- Barnes, D.J. Coral skeletons: An explanation of their growth and structure. Science 1970, 170, 1305–1308. [Google Scholar] [CrossRef]
- Rodgers, K.S.; Cox, E.F. The effects of trampling on Hawaiian corals along a gradient of human use. Biol. Conserv. 2003. [Google Scholar] [CrossRef]
- Lamberts, A.E. Alizarin Deposition by Corals; University of Hawai’i: Honolulu, HI, USA, 1973. [Google Scholar]
- Jokiel, P.L.; Maragos, J.; Franzisket, L. Coral growth: Buoyant weight technique. Coral Reefs Res. Methods 1978, 1, 529–541. [Google Scholar]
- Rstudio Team. RStudio: Integrated Development for R; RStudio, Inc.: Boston, MA, USA, 2019. [Google Scholar]
- R Core Team. R: A Language and Environment for Statistical Computing; R Foundation Statistical Computing: Vienna, Austria, 2020. [Google Scholar]
- Bates, D.; Mächler, M.; Bolker, B.; Walker, S. Fitting Linear Mixed-Effects Models Using lme. J. Stat. Softw. 2015, 67, 1–48. [Google Scholar] [CrossRef]
- Hebbali, A. olsrr: Tools for Building OLS Regression Models. R Package Version 0.5.1. Available online: https://olsrr.rsquaredacademy.com/ (accessed on 1 September 2020).
- Luke, S.G. Evaluating significance in linear mixed-effects models in R. Behav. Res. Methods 2017, 49, 1494–1502. [Google Scholar] [CrossRef]
- Kassambara, A. ggpubr: “ggplot2” Based Publication Ready Plots. R Package Version 0.2.4. 2019. Available online: https://rpkgs.datanovia.com/ggpubr/ (accessed on 10 July 2020).
- Wickham, H. ggplot2: Elegant Graphics for Data Analysis; Springer: Berlin/Heidelberg, Germany, 2016; ISBN 9780387981406. [Google Scholar]
- Barshis, D.J.; Ladner, J.T.; Oliver, T.A.; Seneca, F.O.; Traylor-Knowles, N.; Palumbi, S.R. Genomic basis for coral resilience to climate change. Proc. Natl. Acad. Sci. USA 2013. [Google Scholar] [CrossRef]
- Jokiel, P.L.; Coles, S.L. Effects of Heated Effluent on Hermatypic Corals at Kahe Point, Oahu. Pacific Sci. 1974, 28, 1–18. [Google Scholar]
- Jokiel, P.L.; Coles, S.L. Effects of temperature on the mortality and growth of Hawaiian reef corals. Mar. Biol. 1977. [Google Scholar] [CrossRef]
- Safaie, A.; Silbiger, N.J.; McClanahan, T.R.; Pawlak, G.; Barshis, D.J.; Hench, J.L.; Rogers, J.S.; Williams, G.J.; Davis, K.A. High frequency temperature variability reduces the risk of coral bleaching. Nat. Commun. 2018, 9, 1–12. [Google Scholar] [CrossRef]
- Coles, S.L.; Jokiel, P.L. Effects of Salinity on Coral Reefs. In Pollution in Tropical Aquatic Systems; CRC Press: Boca Raton, FL, USA, 1992; pp. 147–166. [Google Scholar]
- Möhlenkamp, P.; Beebe, C.K.; McManus, M.A.; Kawelo, A.H.; Kotubetey, K.; Lopez-Guzman, M.; Nelson, C.E.; Alegado, R.A. Ku Hou Kuapa: Cultural restoration improves water budget and water quality dynamics in He’eia Fishpond. Sustainable 2018, 11, 161. [Google Scholar] [CrossRef]
- Kleypas, J.A.; McManu, J.W.; Mene, L.A.B. Environmental limits to coral reef development: Where do we draw the line? Am. Zool. 1999. [Google Scholar] [CrossRef]
- Guinotte, J.M.; Buddemeier, R.W.; Kleypas, J.A. Future coral reef habitat marginality: Temporal and spatial effects of climate change in the Pacific basin. Coral Reefs 2003, 22, 551–558. [Google Scholar] [CrossRef]
- Uthicke, S.; Furnas, M.; Lønborg, C. Coral reefs on the edge? Carbon chemistry on inshore reefs of the great barrier reef. PLoS ONE 2014. [Google Scholar] [CrossRef]
- Enochs, I.C.; Formel, N.; Manzello, D.; Morris, J.; Mayfield, A.B.; Boyd, A.; Kolodziej, G.; Adams, G.; Hendee, J. Coral persistence despite extreme periodic pH fluctuations at a volcanically acidified Caribbean reef. Coral Reefs 2020, 39, 523–528. [Google Scholar] [CrossRef]
- Gagliano, M.; McCormick, M.I.; Moore, J.A.; Depczynski, M. The basics of acidification: Baseline variability of pH on Australian coral reefs. Mar. Biol. 2010. [Google Scholar] [CrossRef]
- Gray, S.E.C.; DeGrandpre, M.D.; Langdon, C.; Corredor, J.E. Short-term and seasonal pH, p CO 2 and saturation state variability in a coral-reef ecosystem. Global Biogeochem. Cycles 2012. [Google Scholar] [CrossRef]
- Rogers, C. Responses of coral reefs and reef organisms to sedimentation. Mar. Ecol. Prog. Ser. 1990. [Google Scholar] [CrossRef]
- Fabricius, K.E.; De’ath, G.; Humphrey, C.; Zagorskis, I.; Schaffelke, B. Intra-annual variation in turbidity in response to terrestrial runoff on near-shore coral reefs of the Great Barrier Reef. Estuar. Coast. Shelf Sci. 2013. [Google Scholar] [CrossRef]
- Kinsey, D.W.; Davies, P.J. Effects of elevated nitrogen and phosphorus on coral reef growth. Limnol. Oceanogr. 1979, 24, 935–940. [Google Scholar] [CrossRef]
- Fabricius, K.E. Effects of terrestrial runoff on the ecology of corals and coral reefs: Review and synthesis. Mar. Pollut. Bull. 2005. [Google Scholar] [CrossRef]
- Allemand, D.; Tambutté, É.; Zoccola, D.; Tambutté, S. Coral calcification, cells to reefs. In Coral Reefs: An Ecosystem in Transition; Springer: Berlin/Heidelberg, Germany, 2011; ISBN 9789400701137. [Google Scholar]
- Gladfeiter, E.H. Skeletal development in Acropora cervicornis: I. Patterns of calcium carbonate accretion in the axial corallite. Coral Reefs 1982. [Google Scholar] [CrossRef]
- Jokiel, P.L.; Jury, C.P.; Kuffner, I.B. Coral calcification and ocean acidification. In Coral Reefs at the Crossroads; Springer: Berlin/Heidelberg, Germany, 2016; pp. 7–45. [Google Scholar]
- Dodge, R.E.; Brass, G.W. Skeletal extension, density and calcification of the reef coral, Montastrea annularis: St. Croix, US Virgin Islands. Bull. Mar. Sci. 1984, 34, 288–307. [Google Scholar]
- Cox, E.F. The effects of a selective corallivore on growth rates and competition for space between two species of Hawaiian corals. J. Exp. Mar. Bio. Ecol. 1986. [Google Scholar] [CrossRef]
- Grottoli, A.G. Variability of stable isotopes and maximum linear extension in reef-coral skeletons at Kaneohe Bay, Hawaii. Mar. Biol. 1999. [Google Scholar] [CrossRef]
- Bahr, K.D.; Jokiel, P.L.; Rodgers, K.S. Relative sensitivity of five Hawaiian coral species to high temperature under high-pCO2 conditions. Coral Reefs 2016. [Google Scholar] [CrossRef]
- Carricart-Ganivet, J.P.; Cabanillas-Terán, N.; Cruz-Ortega, I.; Blanchon, P. Sensitivity of calcification to thermal stress varies among genera of massive reef-building corals. PLoS ONE 2012. [Google Scholar] [CrossRef] [PubMed]
- Coles, S.L.; Bahr, K.D.; Rodgers, K.S.; May, S.L.; McGowan, A.E.; Tsang, A.; Bumgarner, J.; Han, J.H. Evidence of acclimatization or adaptation in Hawaiian corals to higher ocean temperatures. PeerJ 2018. [Google Scholar] [CrossRef]


© 2020 by the authors. Licensee MDPI, Basel, Switzerland. This article is an open access article distributed under the terms and conditions of the Creative Commons Attribution (CC BY) license (http://creativecommons.org/licenses/by/4.0/).