Puerto Morelos Coral Reefs, Their Current State and Classification by a Scoring System


 ,
,  ,
,  ,
,  , ,
, ,
Abstract
1. Introduction
2. Materials and Methods
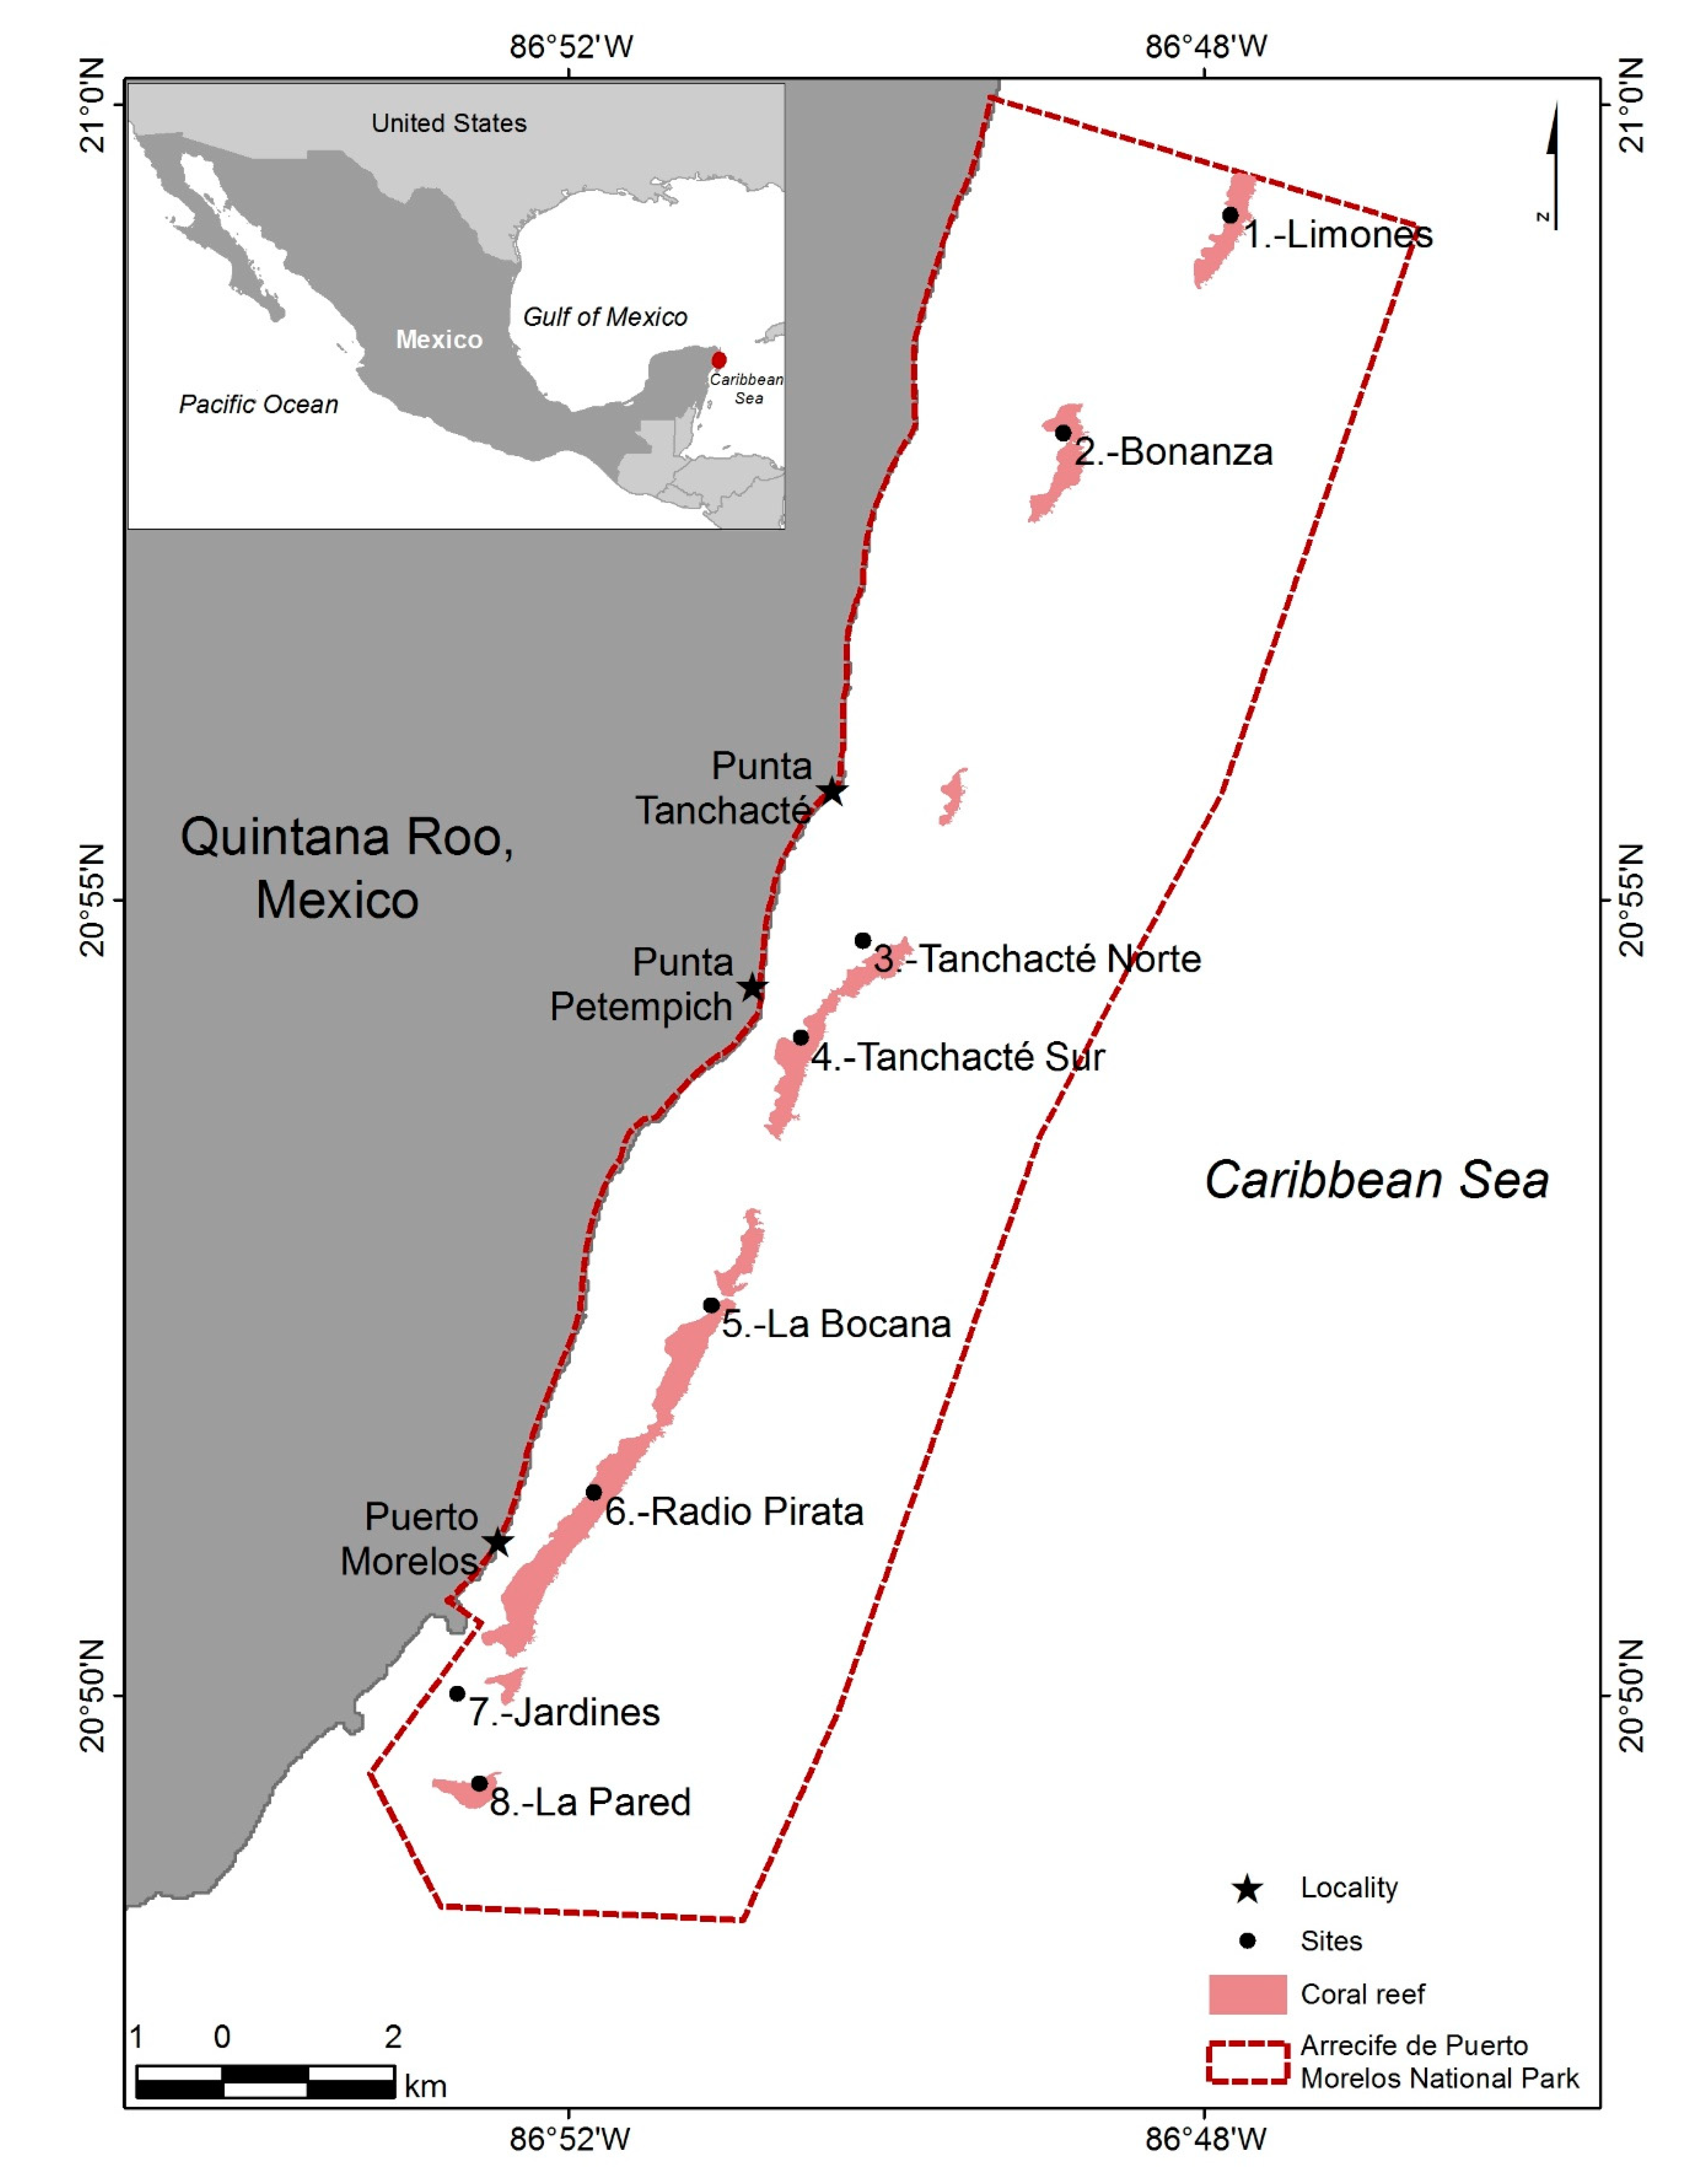
2.1. Study Zone
2.2. Sampling Methodology
- -
- Living coral: for scleractinian corals and hydrocorals (coral species were identified).
- -
- Recent mortality coral: was defined as any non-living part of a coral in which the corallite structures were still visible and were not covered by any other organism.
- -
- Old mortality coral: was defined as any non-living part of a coral in which the corallite structures were either gone or covered over by any other organisms (algae, sponges).
- -
- Fleshy algae: included leafy, filamentous, globose and corticated macroalgae.
- -
- Articulated calcareous algae: included calcareous macroalgae.
- -
- Crustose coralline algae: included coralline encrusted algae.
- -
- Turf: included cespitose algae with appreciable thickness.
- -
- Cyanobacteria.
- -
- Pavement: bare hard substrate, or hard substrate with very thin and spaced turf.
- -
- Rubble: gravel, very deteriorated and loose dead corals.
- -
- Sand: substrate covered with sand of appreciable thickness.
- -
- Soft corals: Any octocoral species.
- -
- Aggressive invertebrates: included encrusting sponges and other bioeroder invertebrates.
- -
- “Others”: anemones, zoanthids.
2.3. Data Processing Methodology
2.3.1. Quantitative Analysis of Biological Indicators
2.3.2. Qualitative Integral Assessment of the Coral Reef Condition
2.3.3. Temporal Variability Analysis
3. Results
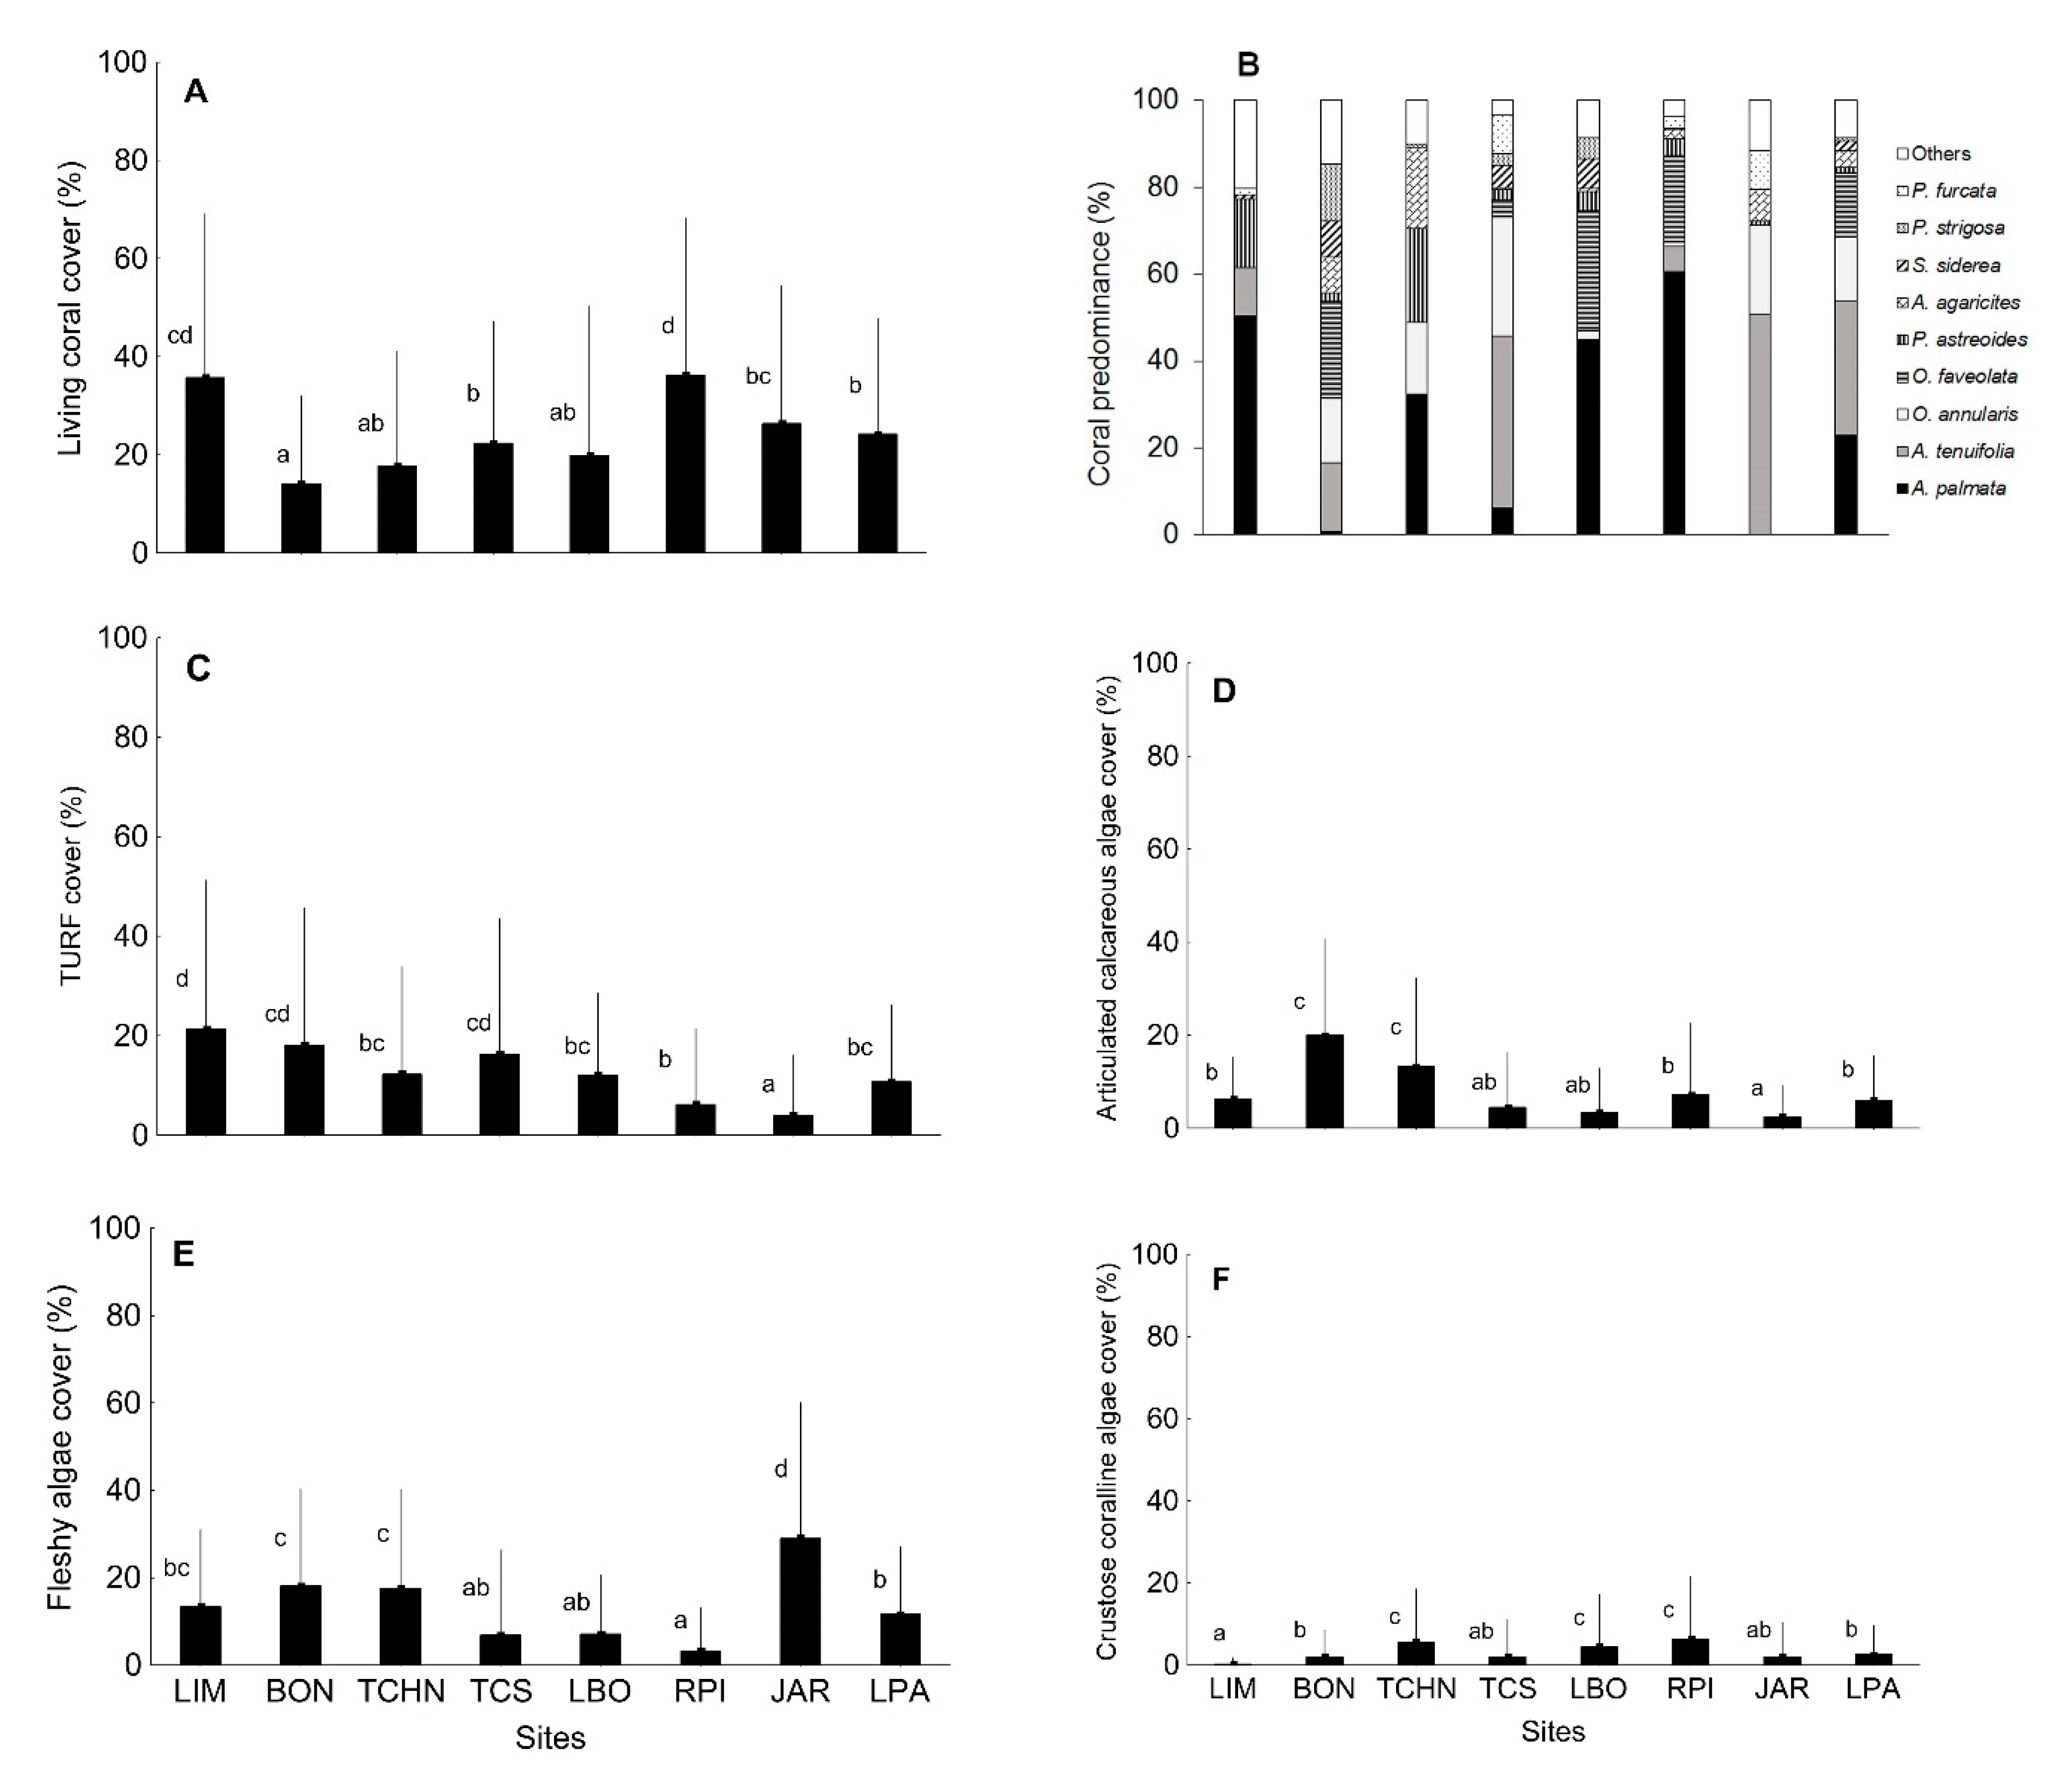
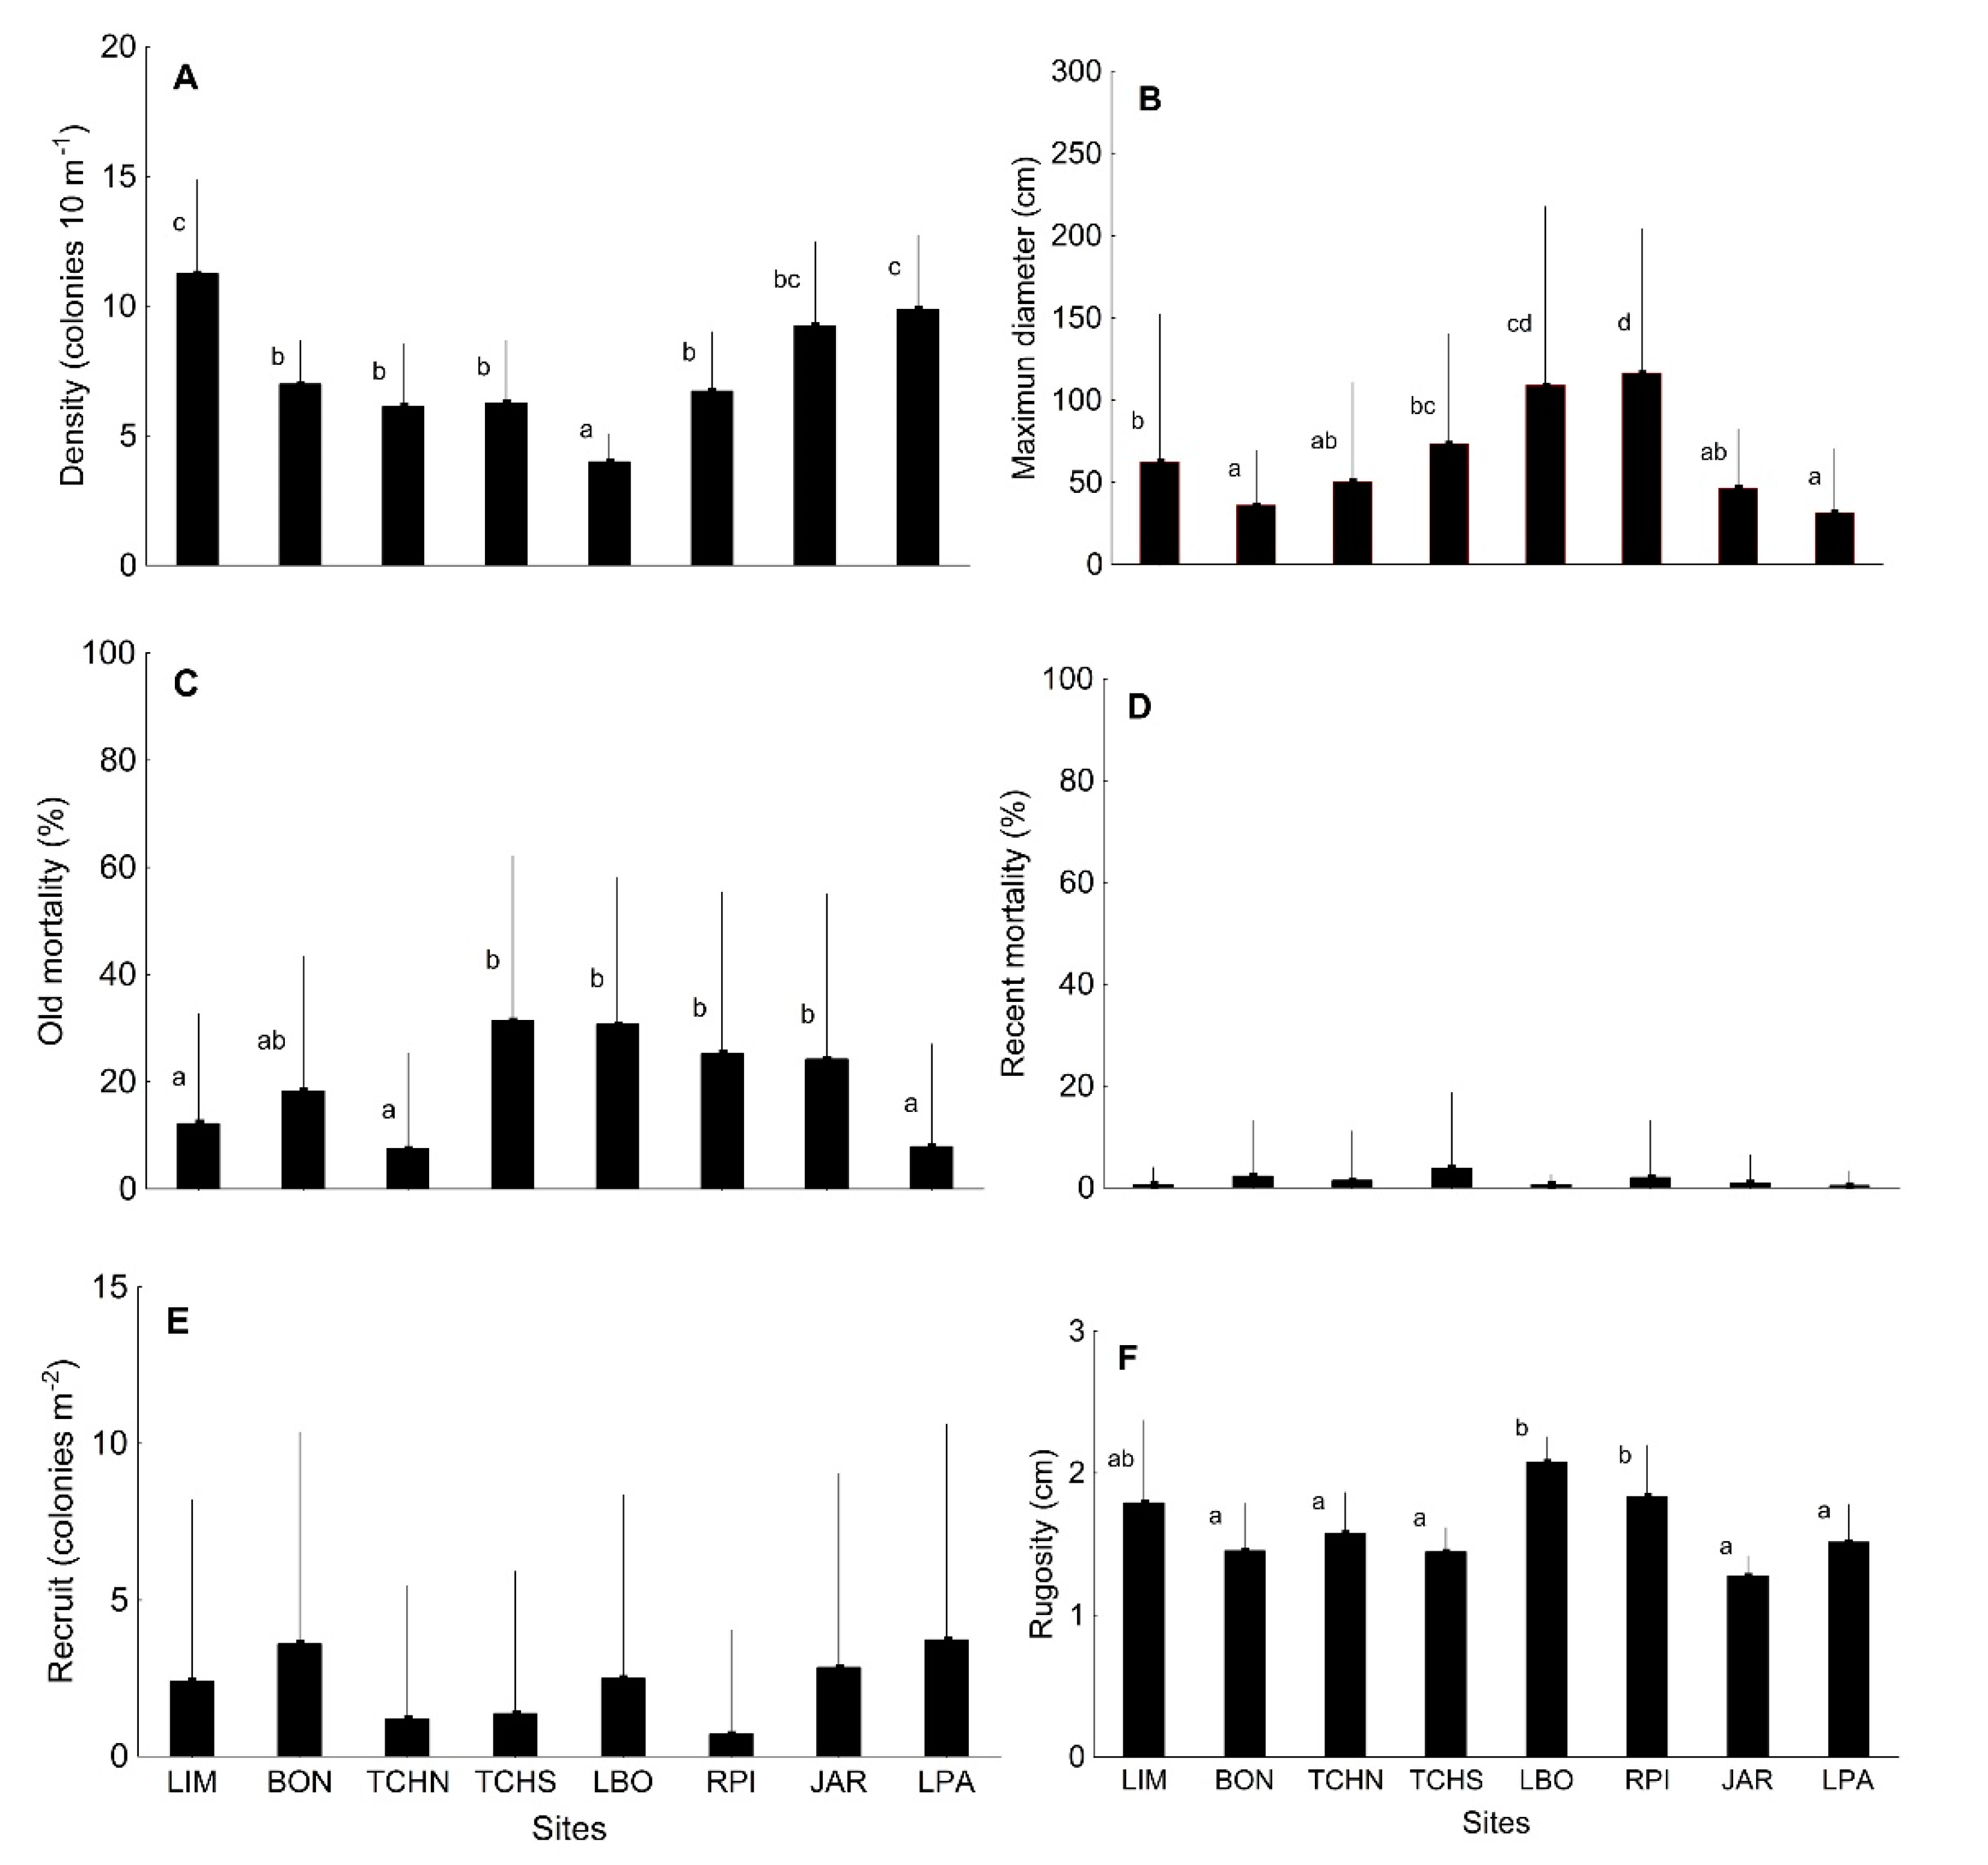
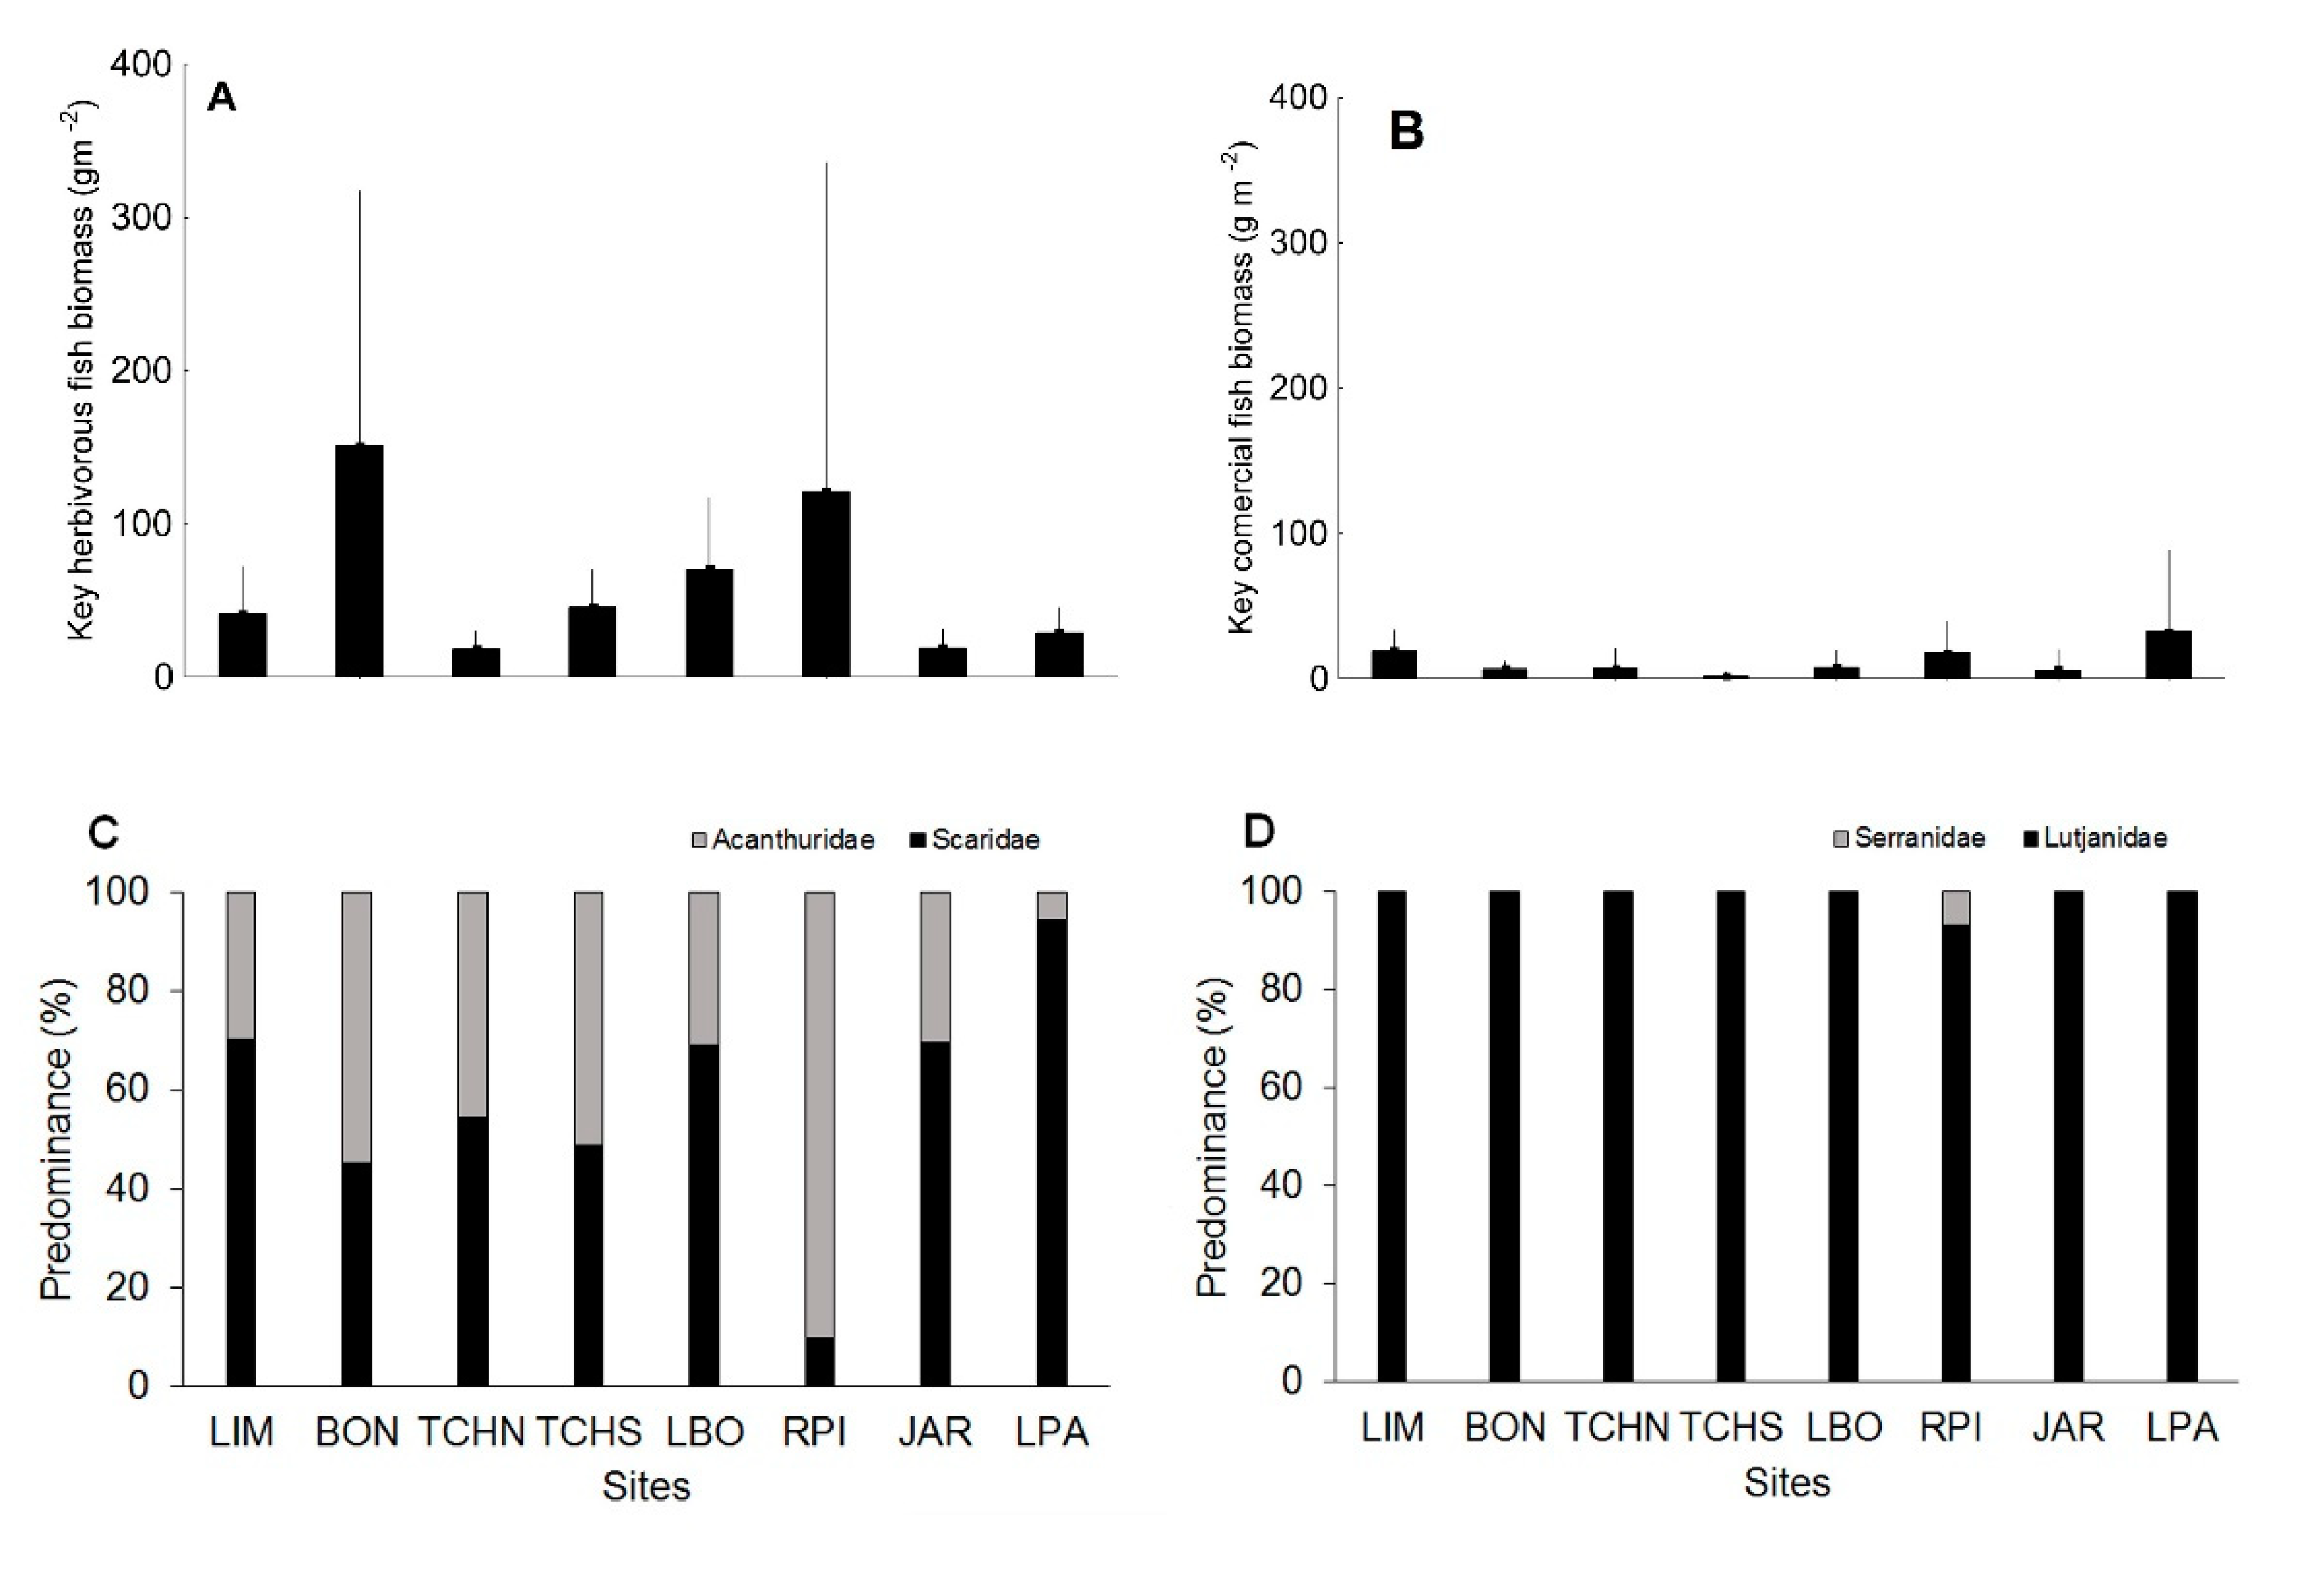
3.1. Quantitative Analysis of Biological Indicators
3.2. Qualitative Integral Assessment of the Coral Reef Condition
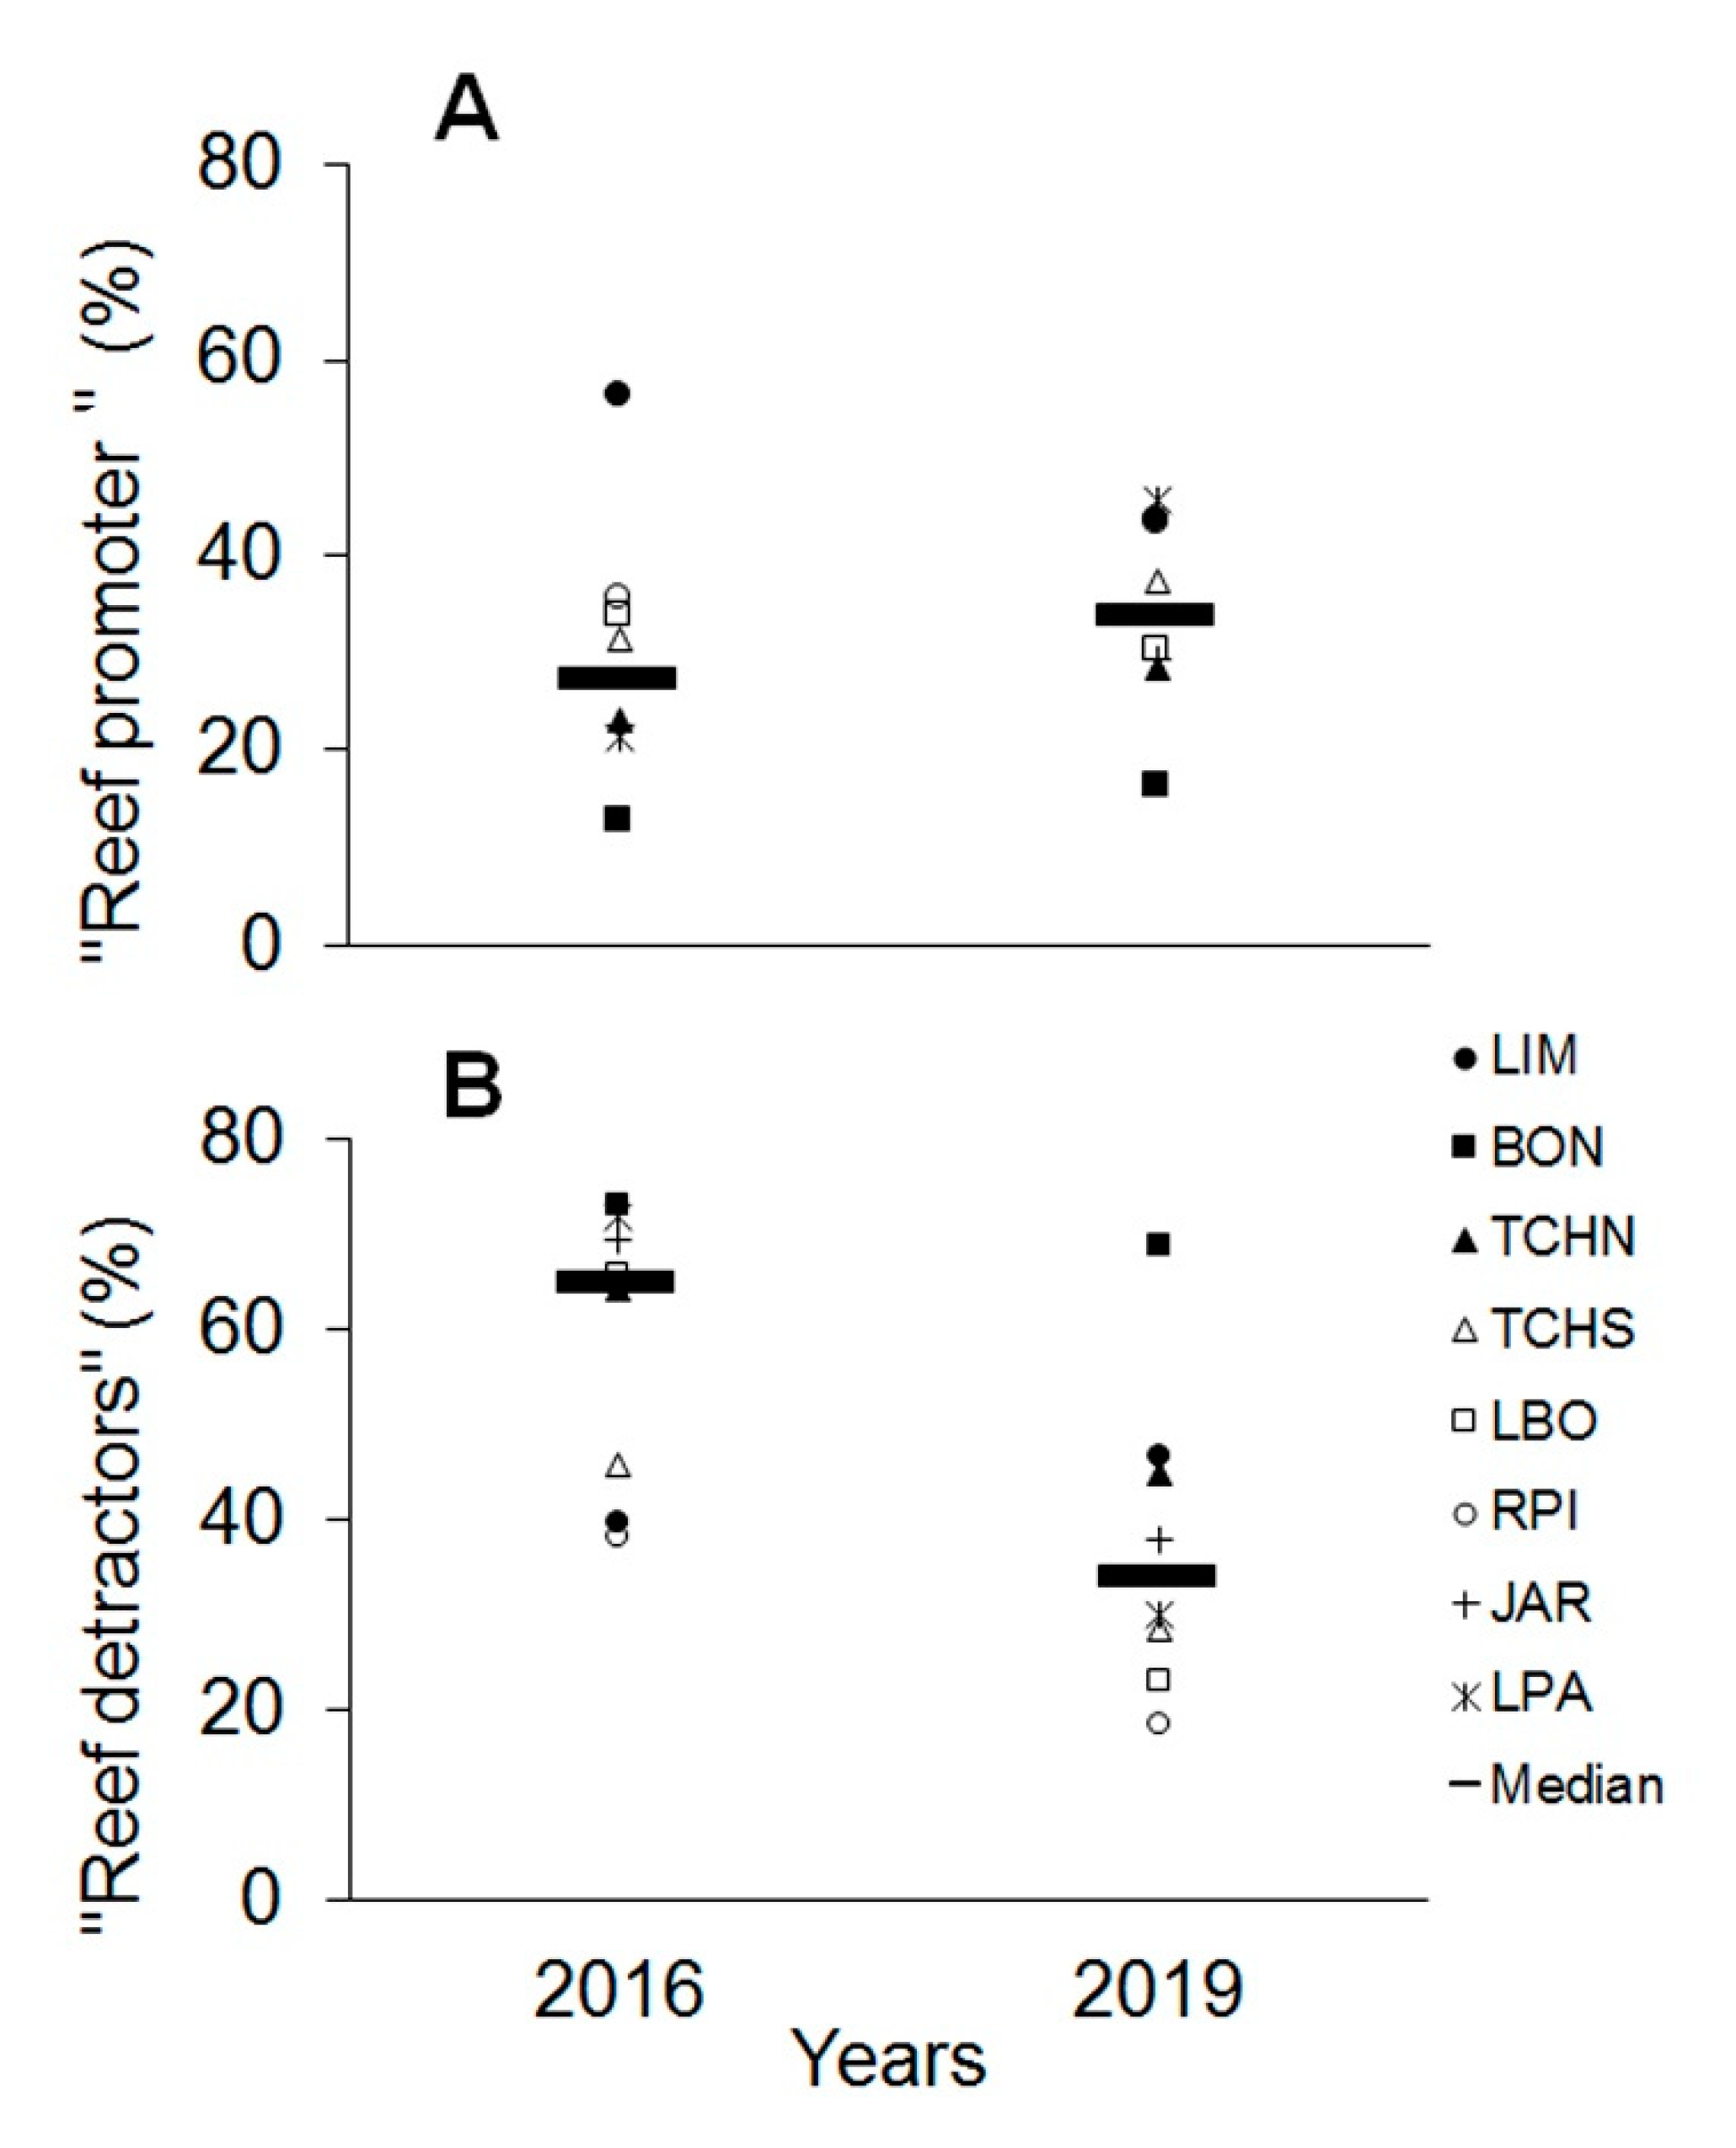
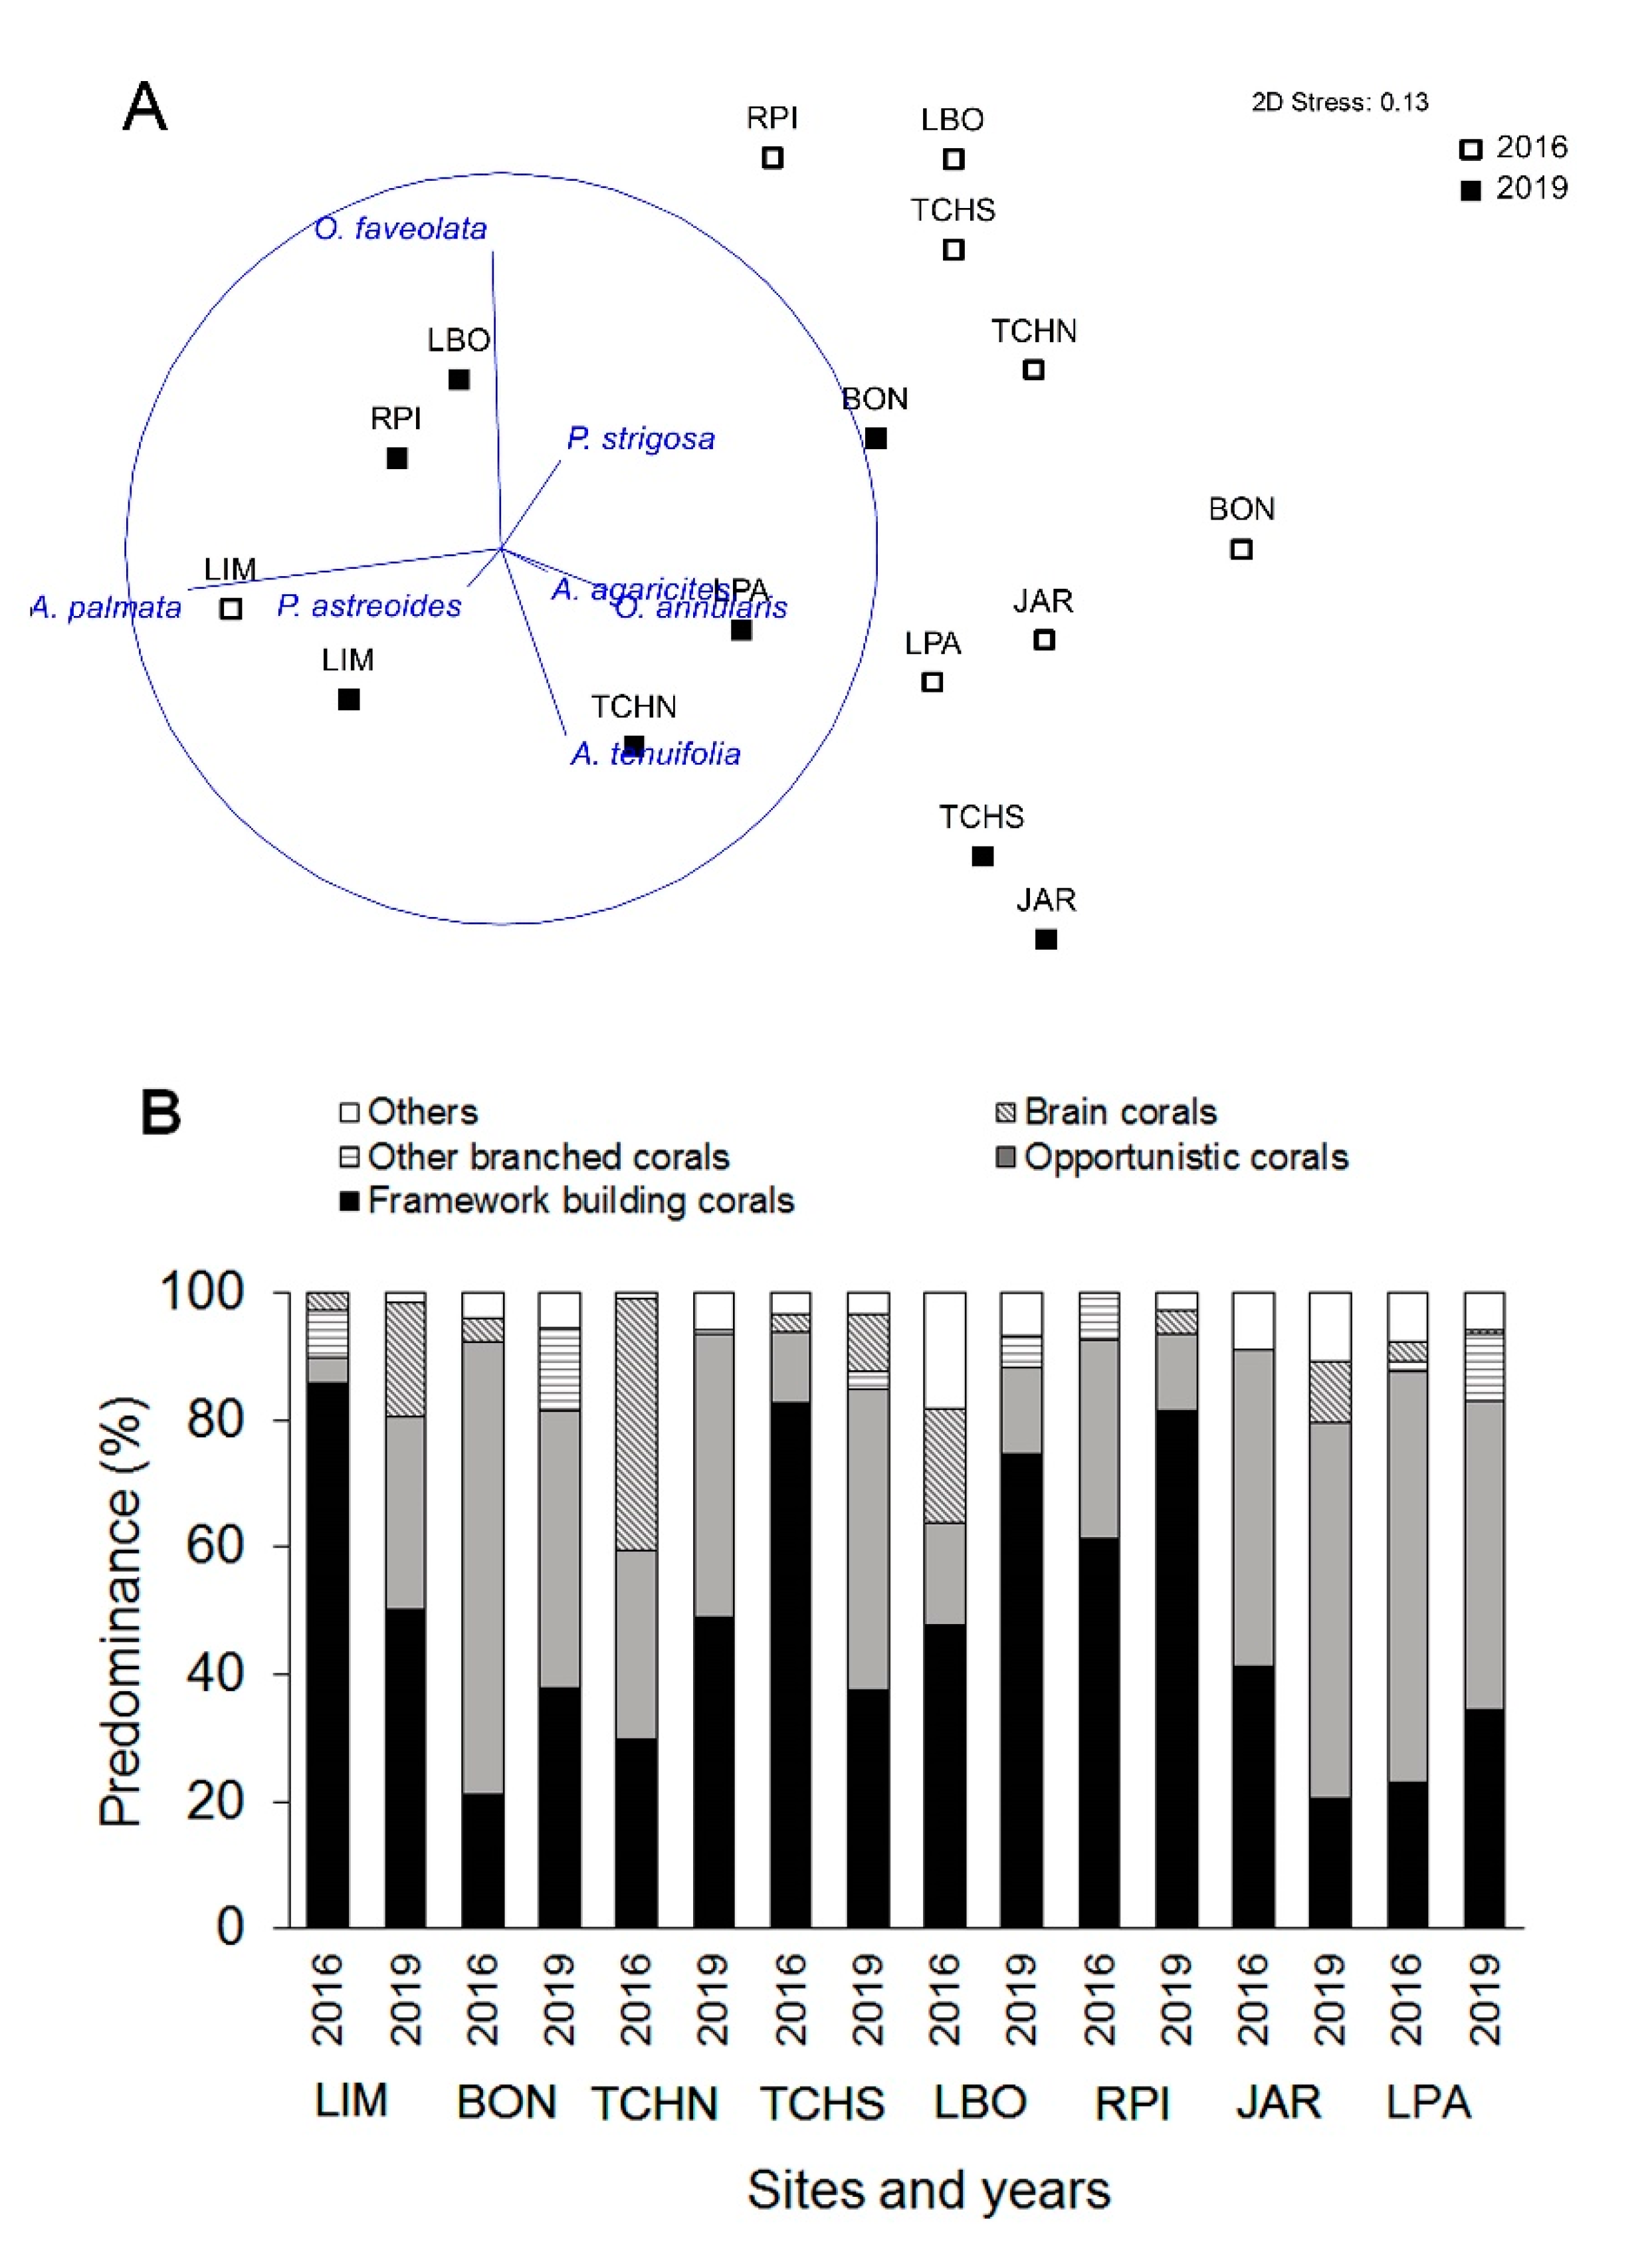
3.3. Temporal Variability Analysis
4. Discussion
5. Conclusions
Supplementary Materials
Author Contributions
Funding
Acknowledgments
Conflicts of Interest
References
- Schutte, G.W.; Selig, E.; Bruno, J.F. Regional spatiotemporal trends in Caribbean coral reef benthic communities. Mar. Ecol. Prog. Ser. 2010, 402, 115–122. [Google Scholar] [CrossRef]
- Jackson, J.B.C.; Donovan, M.K.; Cramer, K.L.; Lam, V.V. Status and Trends of Caribbean Coral Reefs: 1970–2012; Global Coral Reef Monitoring Network; IUCN: Gland, Switzerland, 2014. [Google Scholar]
- Hoegh-Guldberg, O.; Mumby, P.J.; Hooten, A.J.; Steneck, R.S.; Greenfield, P.; Gomez, E.; Harvell, D.C.; Sale, P.; Edwards, A.J.; Caldeira, K.; et al. Coral reefs under rapid climate change and ocean acidification. Science 2007, 318, 1737–1742. [Google Scholar] [CrossRef] [PubMed]
- Jackson, J.B.C. Ecological extinction and evolution in the brave new ocean. Proc. Natl. Acad. Sci. USA 2008, 105, 11458–11465. [Google Scholar] [CrossRef] [PubMed]
- D’Angelo, C.; Wiedenmann, J. Impacts of nutrient enrichment on coral reefs: New perspectives and implications for coastal management and reef survival. Curr. Opin. Env. Sustain. 2014, 7, 82–93. [Google Scholar] [CrossRef]
- Harborne, A.R.; Rogers, A.; Bozec, Y.; Mumby, P.J. Multiple Stressors and the functioning of coral reefs. Annu. Rev. Mar. Sci. 2017, 9, 1–24. [Google Scholar] [CrossRef]
- Hughes, T.P.; Kerry, J.T.; Baird, A.H.; Connolly, S.R.; Dietzel, A.; Eakin, C.M.; Heron, S.F.; Hoey, A.S.; Hoogenboom, M.O.; Liu, G.; et al. Global warming transforms coral reef assemblages. Nature 2018, 556, 492–496. [Google Scholar] [CrossRef]
- Gardner, T.A.; Côté, I.M.; Gill, M.; Grant, J.A.; Watkinson, A.R. Long-term region-wide declines in Caribbean corals. Science 2003, 301, 958–960. [Google Scholar] [CrossRef]
- Aronson, R.B.; Precht, W.F. White-band disease and the changing face of Caribbean coral reefs. Hydrobiologia 2001, 460, 25–38. [Google Scholar] [CrossRef]
- Edmunds, P.J. A quarter-century demographic analysis of the Caribbean coral, Orbicella annularis, and projections of population size over the next century. Limnol. Oceanogr. 2015, 60, 840–855. [Google Scholar] [CrossRef]
- Alvarez-Filip, L.; Dulvy, N.K.; Gill, J.A.; Côté, I.M.; Watkinson, A.R. Flattening of Caribbean coral reefs: Region-wide declines in architectural complexity. Proc. R. Soc. Lond. Ser. B Biol. Sci. 2009, 276, 3019–3025. [Google Scholar] [CrossRef]
- Lessios, H.A.; Robertson, D.R.; Cubit, J.D. Spread of Diadema mass mortality through the Caribbean. Science 1984, 226, 335–337. [Google Scholar] [CrossRef]
- Roff, G.; Mumby, P.J. Global disparity in the resilience of Coral Reefs. Trends Ecol. Evol. 2012, 27, 404–413. [Google Scholar] [CrossRef]
- Edwards, C.; Friedlander, A.; Green, A.; Hardt, M.; Sala, E.; Sweatman, H.; Williams, I.D.; Zgliczynski, B.; Sandin, S.A.; Smith, J. Global assessment of the status of coral reef herbivorous fishes: Evidence for fishing effects. Proc. R. Soc. B 2014, 281, 20131835. [Google Scholar] [CrossRef] [PubMed]
- Bruno, J.F.; Côté, I.M.; Toth, L.T. Climate change, coral loss, and the curious case of the parrotfish paradigm: Why don’t marine protected areas improve reef resilience? Annu. Rev. Mar. Sci. 2019, 11, 307–334. [Google Scholar] [CrossRef] [PubMed]
- Howarth, L.M.; Pickup, S.E.; Evans, L.E.; Cross, T.J.; Hawkins, J.P.; Roberts, C.M.; Stewart, B.D. Sessile and mobile components of a benthic ecosystem display mixed trends with- in a temperate marine reserve. Mar. Environ. Res. 2015, 107, 8–23. [Google Scholar] [CrossRef] [PubMed]
- Yamazaki, S.; Jennings, S.; Grafton, R.Q.; Kompa, T. Are marine reserves and harvest control rules substitutes or complements for rebuilding fisheries? Resour. Energy Econ. 2015, 40, 1–18. [Google Scholar] [CrossRef]
- Charles, A.; Westlund, L.; Bartley, D.M.; Fletcher, W.J.; Garcia, S.; Govan, H.; Sanders, J. Fishing livelihoods as key to marine protected areas: Insights from the World Parks Congress. Aquat. Conserv. 2016, 26, 165–184. [Google Scholar] [CrossRef]
- Perera-Valderrama, S.; Cerdeira-Estrada, S.; Martell-Dubois, R.; Rosique de la Cruz, L.O.; Caballero-Aragón, H.; Ressl, R. Programa de Monitoreo de la Biodiversidad en Áreas Naturales Protegidas del Caribe Mexicano; CONABIO: Mexico City, Mexico, 2020.
- Van Tussenbroek, B.I. Dynamics of seagrasses and associated algae in coral reef lagoons. Hidrobiologica 2011, 21, 293–310. [Google Scholar]
- Estrada-Saldívar, N.; Molina-Hernández, A.; Pérez-Cervantes, E.; Medellın-Maldonado, F.; González-Barrios, F.J.; Alvarez-Filip, L. Reef-scale impacts of the stony coral tissue loss disease outbreak. Coral Reefs 2020. [Google Scholar] [CrossRef]
- Rodríguez-Martínez, R.E.; Banaszak, A.T.; McField, M.D.; Beltrán-Torres, A.U.; Álvarez-Filip, L. Assessment of Acropora palmata in the Mesoamerican reef system. PLoS ONE 2014, 9, e96140. [Google Scholar] [CrossRef]
- Contreras-Silva, A.I.; Tilstra, A.; Migani VThiel, A.; Pérez-Cervantes, E.; Estrada-Saldívar, N.; Elias-Ilosvay, X.; Mott, C.; Alvarez-Filip, L.; Wild, C. A meta-analysis to assess long-term spatiotemporal changes of benthic coral and macroalgae cover in the Mexican Caribbean. Sci. Rep. 2020, 10, 8897. [Google Scholar] [CrossRef] [PubMed]
- Van Tussenbroek, B.I.; Hernández Arana, H.; Rodríguez-Martínez, R.; Espinoza-Avalos, J.; Canizales-Flores, H.; González-Godoya, C.; Barba-Santos, G.; Vega-Zepeda, A.; Collado-Vides, L. Severe impacts of brown tides caused by Sargassum spp. on near-shore Caribbean seagrass communities. Mar. Pollut. Bull. 2017, 122, 272–281. [Google Scholar] [CrossRef] [PubMed]
- Alvarez-Filip, L.; Estrada-Saldívar, N.; Pérez-Cervantes, E.; Molina-Hernández, A.; González-Barrios, F.J. A rapid spread of the stony coral tissue loss disease outbreak in the Mexican Caribbean. PeerJ 2019, 7, e8069. [Google Scholar] [CrossRef] [PubMed]
- Cerdeira-Estrada, S.; Martell-Dubois, R.; Valdéz, J.; Rosique, L.O.; Perera-Valderrama, S.; López-Perea, J.R.; Ressl, R. Sistema de Información y Análisis Marino-Costero (SIMAR); CONABIO: Mexico City, México, 2019.
- Jordán Dahlgren, E. Atlas de los Arrecifes Coralinos del Caribe Mexicano; Centro de Investigaciones de Quintana Roo (CIQRO)/Instituto de Ciencias del Mar y Limnología, UNAM: Mexico City, México, 1993. [Google Scholar]
- DOF. Programa de Manejo del Parque Nacional Arrecife de Puerto Morelos; Diario Oficial de la Federación: Ciudad de México, México, 2000. [Google Scholar]
- Marks, K.W.; Lang, J.C. AGRRA Summary Products, Version (2016-08) 2016. Available online: https://www.agrra.org/data-explorer/explore-summary-products/ (accessed on 15 May 2020).
- Anderson, M.J.; Gorley, R.N.; Clarke, K.R. PERMANOVA + for PRIMER: Guide to Software and Statistical Methods; PRIMER-E: Plymounth, UK, 2008. [Google Scholar]
- Lang, J.C.; Kramer, P.A.; Marks, K.W. Fleshy Macroalgae Share Dominance with Other Organisms on Degraded Coral Reefs. In Proceedings of the 13th International Coral Reef Symposium, Honolulu, HI, USA, 19–24 June 2016. [Google Scholar]
- Alcolado, P.M.; Duran, A. Sistema de escalas para la clasificación y puntaje de condición del bentos e ictiofauna de arrecifes coralinos de Cuba y del Gran Caribe. Ser. Oceanol. 2011, 8, 1–5. [Google Scholar]
- Dahlgren, C.; Sherman, K.; Lang, J.; Kramer, P.R.; Marks, K. Bahamas Coral Reef Report Card: 2011–2013. Available online: http://www.blueprojectatlantis.org (accessed on 15 May 2020).
- McField, M.; Kramer, P.; Álvarez-Filip, L.; Drysdale, I.; Rueda-Flores, M.; Giró-Petersen, A.; Soto, M. 2018 Report Card for the Mesoamerican Reef. Healthy Reefs Initiative. Available online: www.healthyreefs.org (accessed on 15 May 2020).
- Precht, W.; Bruckner, A.; Aronson, R.; Bruckner, R. Endangered acroporid corals of the Caribbean. Coral Reefs 2002, 21, 41–42. [Google Scholar] [CrossRef]
- Perry, C.T.; Steneck, R.S.; Murphy, G.N.; Kench, P.S.; Edinger, E.N.; Smithers, S.G.; Mumby, P.J. Regional-scale dominance of non-framework building corals on Caribbean reefs affects carbonate production and future reef growth. Global Change Biol. 2015, 21, 1153–1164. [Google Scholar] [CrossRef]
- Yakob, L.; Mumby, P.J. Climate change induces demographic resistance to disease in novel coral assemblages. Proc. Natl. Acad. Sci. USA 2011, 108, 1967–1969. [Google Scholar] [CrossRef]
- Kramer, P.R.; Lang, J. The Atlantic and Gulf Rapid Reef Assessment (AGRRA) protocol: Former version 2.2. Atoll Res. Bull. 2003, 496, 1–58. [Google Scholar] [CrossRef]
- Healthy Reef Initiative. 2008 Eco-health Report Card for the Mesoamerican Reef: An Evaluation of Ecosystem Health. Available online: https://www.healthyreef.org (accessed on 15 May 2020).
- McField, M.; Kramer, P.; Giró Petersen, A.; Soto, M.; Drysdale, I.; Craig, N.; Rueda-Flores, M. 2020 Mesoamerican Reef Report Card. Healthy Reefs Initiative. Available online: https://www.healthyreef.org (accessed on 15 May 2020).
- McClanahan, T.R.; Donner, S.D.; Maynard, J.A.; MacNeil, M.A.; Graham, N.A.; Maina, J.; Baker, A.C.; Alemu, J.B.; Beger, M.; Campbell, C.J.; et al. Prioritizing key resilience indicators to support coral reef management in a changing climate. PLoS ONE 2012, 7, e42884. [Google Scholar] [CrossRef]
- Caballero-Aragón, H.; Armenteros, M.; Perera-Valderrama, S.; Rey-Villiers, N.; Cobián, D.; Campos, K.; Alcolado, P.M. Ecological condition of coral reef assemblages in the Cuban Archipelago. Mar. Biol. Res. 2019, 15, 61–73. [Google Scholar] [CrossRef]
- McField, M.; Kramer, P. Healthy Reefs for Healthy People: A Guide to Indicators of Reef Health and Social Well-Being in the Mesoamerican Reef Region; Franklin Trade Graphics: Miami, FL, USA, 2007; p. 208. [Google Scholar]
- Eakin, C.M.; Sweatman, H.P.A.; Brainard, R.E. The 2014–2017 global-scale coral bleaching event: Insights and impacts. Coral Reefs 2019, 38, 539–545. [Google Scholar] [CrossRef]
- Weiss, A.; Martindale, R. Crustose coralline algae increased framework and diversity on ancient coral reefs. PLoS ONE 2017, 12, e0181637. [Google Scholar] [CrossRef]
- Brown, K.T.; Bender-Champ, D.; Kubicek, A.; van der Zande, R.; Achlatis, M.; Hoegh- Guldberg, O.; Dove, S.G. The dynamics of coral-algal interactions in space and time on the Southern Great Barrier Reef. Front. Mar. Sci. 2018, 5, 1–13. [Google Scholar] [CrossRef]
- Tebben, J.; Motti, C.A.; Siboni, N.; Tapiolas, D.M.; Negri, A.P.; Schupp, P.J.; Kitamura, M.; Hatta, M.; Steinberg, P.D.; Harder, T. Chemical mediation of coral larval settlement by crustose coralline algae. Sci. Rep. 2015, 5, 1–11. [Google Scholar] [CrossRef]
- Asnaghi, V.; Thrush, F.S.; Hewitt, J.E.; Mangialajo, L.; Cattaneo-Vietti, R.; Chiantore, M. Colonization processes and the role of coralline algae in rocky shore community dynamics. J. Sea Res. 2015, 95, 132–138. [Google Scholar] [CrossRef]
- Lessios, H.A. Diadema antillarum 10 years after mass mortality: Still rare, despite help from competitor. Proc. R. Soc. Lond. Ser. B Biol. Sci. 1995, 259, 331–337. [Google Scholar] [CrossRef]
- Mercado-Molina, A.; Montañez-Acuña, A.; Rodríguez-Barreras, R.; Colón-Miranda, R.; Díaz-Ortega, G.; Martínez-González, N.; Schleier-Hernández, S.; Sabat, A.M. Revisiting the population status of the sea urchin Diadema antillarum in northern Puerto Rico. J. Mar. Biol. Assoc. 2014, 95, 1017–1024. [Google Scholar] [CrossRef]
- Levitan, D.; Edmunds, P.J.; Levitan, K.E. What makes a species common? No evidence of density-dependent recruitment or mortality of the sea urchin Diadema antillarum after the 1983–1984 mass mortality. Oecologia 2014, 175, 117–128. [Google Scholar] [CrossRef]
- Adam, T.C.; Burkepile, D.E.; Ruttenberg, B.I.; Paddack, M.J. Herbivory and the resilience of Caribbean coral reefs: Knowledge gaps and implications for management. Mar. Ecol. Prog. Ser. 2015, 520, 1–20. [Google Scholar] [CrossRef]
- Williams, S.M.; Yoshioka, P.M.; García-Sais, J. Recruitment pattern of Diadema antillarum in La Parguera, Puerto Rico. Coral Reefs 2010, 29, 809–812. [Google Scholar] [CrossRef]
- González-Gaviria, F.; García-Ureña, R. Estado actual de las poblaciones del erizo negro Diadema antillarum Philippi (Echinoidea: Diadematidae) en el parque nacional natural Tayrona y Playa Blanca, Santa Marta, Caribe Colombiano. Bol. Invest. Mar. 2011, 40, 401–417. [Google Scholar] [CrossRef]
- Caballero-Aragón, H.; Perera-Valderrama, S.; Rey-Villiers, N.; González-Méndez, J.; Armenteros, M. Population status of Acropora palmata (Lamarck, 1816) in Cuban coral reefs. Reg. Stud. Mar. Sci. 2020, 34, 1–8. [Google Scholar] [CrossRef]
- Banaszak, A.; Alvarez-Filip, L. Diagnóstico y Estado de Conservación de las Poblaciones de Acropora en el Parque Nacional Arrecife de Puerto Morelos; Informe Final PROCER 9.22; Unidad Académica de Sistemas Arrecifales, ICML, UNAM: Puerto Morelos, México, 2014. [Google Scholar]
- Perry, C.T.; Murphy, G.N.; Kench, P.S.; Smithers, S.G.; Edinger, E.N.; Steneck, R.S.; Mumby, P.J. Caribbean-wide decline in carbonate production threatens coral reef growth. Nat. Commun. 2013, 4, 1402. [Google Scholar] [CrossRef]
- Cote, I.M.; Darling, E.S. Rethinking Ecosystem Resilience in the Face of Climate Change. PLoS Biol. 2010, 8, e1000438. [Google Scholar] [CrossRef] [PubMed]
- Darling, E.S.; Alvarez-Filip, L.; Oliver, T.A.; McClanahan, T.R.; Cote, I.M. Evaluating life-history strategies of reef corals from species traits. Ecol. Lett. 2012, 15, 1378–1386. [Google Scholar] [CrossRef] [PubMed]
- Mumby, P.; Flower, J.; Chollett, L.; Box, S.; Bozec, Y.M.; Fitzsimmons, C.; Williams, S. Hacia la Resiliencia del Arrecife y Medios de Vida Sustentables. Un Manual para los Administradores de Arrecifes de Coral del Caribe; University of Exeter: Exeter, UK, 2014; p. 172. [Google Scholar]
- Hutchings, P. Bioerosion. In Encyclopedia of Modern Coral Reefs SE—5. Encyclopedia of Earth Sciences Series; Hopley, D., Ed.; Springer: Dordrecht, The Netherlands, 2011. [Google Scholar]
- Dahlgren, C.; Kramer, P.R.; Lang, J.; Sherman, K. New Providence and Rose Island, Bahamas 2014 Coral Reef Report Card; Perry Institute for Marine Science: Jupiter, FL, USA, 2014. [Google Scholar]


| Classification and Score | |||||
|---|---|---|---|---|---|
| Indexes | Critical (1) | Poor (2) | Regular (3) | Good (4) | Very Good (5) |
| “Reef promoter” | <15.0 | 15.0–29.9 | 30.0–59.9 | 60.0–80.0 | >80.0 |
| “Reef detractors” | >80.0 | 60.0–80.0 | 30.0–59.9 | 15.0–29.9 | <15.0 |
| Coral condition | <30.0 | 30.0–49.9 | 50.0–69.9 | 70.0–90.0 | >90.0 |
| Coral recruitment | <2.0 | 2.0–3.9 | 4.0–7.9 | 8.0–16.0 | >16.0 |
| Rugosity | 1.00–1.19 | 1.20–1.49 | 1.50–1.99 | 2.00–2.50 | >2.50 |
| Key herbivorous fish biomass | <20.0 | 20.0–39.9 | 40.0–59.9 | 60.0–80.0 | >80.0 |
| Key commercial fish biomass | <10.0 | 10.0–29.9 | 30.0–69.9 | 70.0–90.0 | >90.0 |
| Reef Integral condition | 1.0–1.8 | 1.9–2.6 | 2.7–3.4 | 3.5–4.2 | 4.3–5.0 |
| Indicator | Pseudo-F | p (Perm) | ECV (%) | Perms |
|---|---|---|---|---|
| Living Coral Cover | 7.563 | 0.0001 | 21.9 | 8959 |
| Fleshy Algae Cover | 15.184 | 0.0001 | 29.2 | 8193 |
| Crustose Coralline Algae Cover | 4.273 | 0.0004 | 16.5 | 5123 |
| Articulated calcareous Algae Cover | 14.412 | 0.0010 | 28.6 | 9958 |
| Turf Cover | 5.876 | 0.0010 | 19.4 | 9984 |
| Coral Species Predominance | 4.086 | 0.0001 | 37.8 | 9897 |
| Coral Density | 6.935 | 0.0001 | 45.7 | 4945 |
| Coral Maximun Diameter | 13.397 | 0.0001 | 30.7 | 9950 |
| Old Coral Mortality | 8.407 | 0.0001 | 25.4 | 9929 |
| Recent Coral Mortality | 1.101 | 0.3378 | 3.8 | 9933 |
| Coral Recruit Density | 1.566 | 0.1403 | 10.6 | 2235 |
| Rugosity Index | 6.620 | 0.0001 | 42.8 | 9461 |
| Key Herbivorous Fish Biomass | 1.540 | 0.1320 | 23.1 | 9896 |
| Key Commercial Fish Biomass | 1.105 | 0.3539 | 11.7 | 9913 |
| Sites | |||||||||
|---|---|---|---|---|---|---|---|---|---|
| Indexes | LIM | BON | TCHN | TCHS | LBO | RPI | JAR | LPA | APMNP |
| “Reef Promoter” | 3 | 2 | 2 | 3 | 3 | 3 | 2 | 3 | 3 |
| “Reef Detractors” | 3 | 2 | 3 | 4 | 4 | 4 | 3 | 3 | 3 |
| Coral Condition | 4 | 4 | 5 | 3 | 3 | 4 | 4 | 5 | 4 |
| Coral Recruitment | 2 | 2 | 1 | 1 | 2 | 1 | 2 | 2 | 2 |
| Rugosity | 3 | 2 | 3 | 2 | 4 | 3 | 2 | 3 | 3 |
| Key Herbivorous Fish Biomass | 3 | 5 | 1 | 3 | 4 | 5 | 1 | 2 | 4 |
| Key Commercial Fish Biomass | 2 | 1 | 1 | 1 | 1 | 2 | 1 | 3 | 2 |
| Reef Integral condition | 2.9 | 2.6 | 2.3 | 2.4 | 3.0 | 3.1 | 2.1 | 3.0 | 2.7 |
| Indicator | Source | Pseudo-F | p (Perm) | ECV (%) | Perms |
|---|---|---|---|---|---|
| “Reef Promoter” | Site | 19.823 | 0.001 | 20.6 | 9898 |
| Year | 6.8869 | 0.007 | 5.8 | 9895 | |
| Site X Year | 5.7694 | 0.001 | 14.7 | 9898 | |
| “Reef Detractors” | Site | 32.192 | 0.001 | 19.6 | 9897 |
| Year | 131.91 | 0.001 | 20.1 | 9896 | |
| Site X Year | 12.283 | 0.001 | 16.7 | 9899 | |
| Coral Species Composition | Site | 19.823 | 0.001 | 22.1 | 9851 |
| Year | 6.8869 | 0.001 | 14.8 | 9935 | |
| Site X Year | 5.7694 | 0.001 | 20.0 | 9871 |
© 2020 by the authors. Licensee MDPI, Basel, Switzerland. This article is an open access article distributed under the terms and conditions of the Creative Commons Attribution (CC BY) license (http://creativecommons.org/licenses/by/4.0/).
Share and Cite
Caballero-Aragón, H.; Perera-Valderrama, S.; Cerdeira-Estrada, S.; Martell-Dubois, R.; Rosique-de la Cruz, L.; Álvarez-Filip, L.; Pérez-Cervantes, E.; Estrada-Saldívar, N.; Ressl, R. Puerto Morelos Coral Reefs, Their Current State and Classification by a Scoring System. Diversity 2020, 12, 272. https://doi.org/10.3390/d12070272
Caballero-Aragón H, Perera-Valderrama S, Cerdeira-Estrada S, Martell-Dubois R, Rosique-de la Cruz L, Álvarez-Filip L, Pérez-Cervantes E, Estrada-Saldívar N, Ressl R. Puerto Morelos Coral Reefs, Their Current State and Classification by a Scoring System. Diversity. 2020; 12(7):272. https://doi.org/10.3390/d12070272
Chicago/Turabian StyleCaballero-Aragón, Hansel, Susana Perera-Valderrama, Sergio Cerdeira-Estrada, Raúl Martell-Dubois, Laura Rosique-de la Cruz, Lorenzo Álvarez-Filip, Esmeralda Pérez-Cervantes, Nuria Estrada-Saldívar, and Rainer Ressl. 2020. "Puerto Morelos Coral Reefs, Their Current State and Classification by a Scoring System" Diversity 12, no. 7: 272. https://doi.org/10.3390/d12070272
APA StyleCaballero-Aragón, H., Perera-Valderrama, S., Cerdeira-Estrada, S., Martell-Dubois, R., Rosique-de la Cruz, L., Álvarez-Filip, L., Pérez-Cervantes, E., Estrada-Saldívar, N., & Ressl, R. (2020). Puerto Morelos Coral Reefs, Their Current State and Classification by a Scoring System. Diversity, 12(7), 272. https://doi.org/10.3390/d12070272