Article

Impact of Various Grass Species on Soil Bacteriobiome

Department of Microbiology, University of Warmia and Mazury in Olsztyn, 10-727 Olsztyn, Poland
*
Author to whom correspondence should be addressed.
Diversity 2020, 12(6), 212; https://doi.org/10.3390/d12060212
Submission received: 2 April 2020 / Revised: 21 May 2020 / Accepted: 22 May 2020 / Published: 26 May 2020
(This article belongs to the Special Issue Genetic Diversity of Soil Bacterial Communities)

Abstract

:
Today, various grass species are important not only in animal feeding but, increasingly often, also in energetics and, due to esthetic and cultural values, in landscape architecture. Therefore, it is essential to establish the roles various grass species and their functional forms play in modifying soil bacteriobiome and enzymatic activity. To this end, a pot experiment was conducted to examine effects of various fodder grass and lawn grass species on the bacteriobiome and biochemical properties of soil. Nonsown soil served as the control for data interpretation. Analyses were carried out with standard and metagenomic methods. The intensity of effects elicited by grasses depended on both their species and functional form. More favorable living conditions promoting the development of soil bacteria and, thereby, enzymatic activity were offered by fodder than by lawn grass species. Among the fodder grasses, the greatest bacteriobiome diversity was caused by sowing the soil with Phleum pratense (Pp), whereas among lawn grasses in the soil sown with Poa pratensis (Pr). Among the fodder grasses, the highest enzymatic activity was determined in the soil sown with Lolium x hybridum Hausskn (Lh), and among the lawn grasses—in the soil sown with Lolium perenne. Sowing the soil with grasses caused the succession of a population of bacterial communities from r strategy to k strategy.

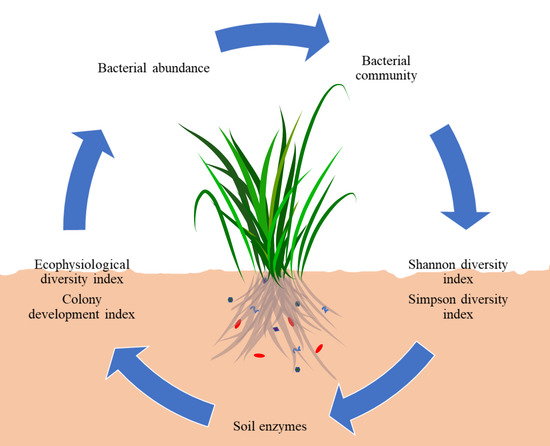
Graphical Abstract

1. Introduction

Interactions between soil, plants, and soil microbiome are complex in character and require extended research. Determination of changes in soil stability and identification of associations between microbiological diversity of soil and plants occurring in agricultural ecosystems are difficult because they are affected by plant root secretions [1,2,3,4], climatic changes [5,6,7], and various pollutants [2,7]. As the key component of life on Earth, soil is capable of meeting most of plant demands. Its traits, including abundance of nutrients, productivity, and fertility, are a measure of the strength of plant growth and crop yield [8,9,10,11]. Plant productivity largely depends on soil culture [9], count of soil bacteria and fungi colonizing the rhizosphere [12,13], count of epiphytic microorganisms occurring on the surface of plants and endophytic ones colonizing their tissues [14], presence of pathogens [15,16], humus content [17,18], soil pH [19], water-air balance [20,21,22], soil fraction size [23,24] as well as the microbiological and biochemical activity of soil [10,25,26,27].
For agricultural sustainability, 176 cultivars have been shortlisted by the Research Center for Cultivar Testing (Słupia Wielka, Poland, 52.227° N 17.218° E) of which 19 are grasses species of monocotyledonous flowering plants from the Poaceae (Gramineae) family, commonly known as grasses, have been used in contemporary agriculture: xFestulolium Asch. & Graebn., Festuca rubra L., Festuca pratensis Huds., Festuca filiformis Pourr., Festuca ovina L., Festuca trachyphylla (Hack.) Krajina, Festuca arundinacea Schreber, Dactylis glomerata L., Agrostis gigantea Roth, Agrostis capillaris L., Agrostis stolonifera L., Arrhenatherum elatius (L.) P. Beauv.ex J. Presl & C. Presl, Bromus catharticus Vahl, Phleum pratense L., Poa pratensis L., Poa trivialis L., Lolium x hybridum Hausskn, Lolium perenne L., and Lolium multiflorum Lam. Pursuant to EU regulations, all cultivars submitted to the national register are evaluated for distinctness, uniformity and stability (DUS), whereas crops are additionally evaluated for their value for cultivation and use [28]. Grasses from the Poaceae family, i.e., from the family of monocotyledoneous flowering plants, represent one of the most important and the most abundant group of plants on the entire Earth. This family includes crops and monocotyledoneous fodder plants. These plants constitute the source of feed to both, wild and domesticated animals. They possess therapeutic and health-promoting properties, and are able to adapt to various climatic zones and various habitats. The form assemblages of savannas, steppes, prairies and pampas, as well as lowland, mountain, and arctic meadows. They have been accompanying man for years. They have been and are used most often in animal feeding due to their high nutritive value, resulting from the chemical composition of plants. Grasses are rich in dietary fiber digestible protein, minerals, and vitamins [29]. According to Peeters [30], grasses have a higher nutritive value for animals than fodder beet. They represent complete feeds rich in organic and mineral compounds. Their leaves and stems may be easily ingested by animals and effectively digested by microorganisms colonizing their rumens. In addition, they are valuable energetic feed.
For sustainability, modern agricultural practices need to include every effort not to deplete the soil’s organic matter, because the use of chemicals together with intensive cultivation can lead to soil sterilization and microbiological imbalance [11,31,32]. The development of soil edaphon is at risk of the impairment of decomposition and humification processes due to organic matter accumulating in the soil [33].
Soil microorganisms and enzymes take part in the mineralization of organic substances [34,35,36,37,38,39], in retention of heavy metals [40,41,42], and in degradation of plant protection agents [43,44,45] and polycyclic aromatic hydrocarbons (PAHs) [34,36,46]. They are the driving force of the geochemical cycle of elements, and participate in transformations of simple and complex organic compounds [47]. Diversity of microorganisms influences the functioning of ecosystems, biological homeostasis as well as chemical and physical properties of soil, and by this means determines its productivity [35,48,49].
Microorganisms that colonize soil and other environments synthesize intra- and extracellular enzymes indispensable for depolymerization and hydrolysis of organic macromolecules which serve as sources of carbon and energy [50]. Determination of enzymatic activity of soil is essential to the understanding of the functional dynamics of a soil ecosystem. According to Moeskops et al. [51], Zhan et al. [52], and Knight and Dick [53], it is also a good indicator of the biological status of soil because the activity of enzymes from the class of oxidoreductases (dehydrogenases or catalase) is strictly responsible for respiration of microorganisms in the soil. A reliable indicator of changes undergoing in the soil is also the activity of urease. Although this is an extracellular enzyme related to a lesser extent with the condition of microorganisms, it is highly sensitive to various xenobiotics [52]. In turn, β-glucosidade is responsible for cellulose transformation to glucose [53], while phosphatases—for transformations of phosphorus compounds [54], and, inter alia, arylsulfatase—for the metabolism of organic sulfur [55]. It can therefore be concluded that the geochemical transformations proceeding in the soil are strongly associated with its biological activity.
Due to the small amount of research into the effects of grasses on soil biodiversity, research was undertaken to compare 1) the soil bacteriobiome of six grasses species (three fodder and three lawn grasses); 2) the effect of grasses on colony development and ecophysiological diversity index of soil bacteria; 3) the grass yield of fodder and lawn grasses; and 4) the enzymatic activities of soil with grasses and without grass.

2. Materials and Methods

2.1. Soil Characteristics

The experiment was conducted with eutric cambisol soil sampled from the topsoil, from a depth of 0 to 20 cm of the arable lands from the Olsztyn Lake District situated in the northeast of Poland (NE Poland, 53.7161° N 20.4167° E). It contained 74.93% of the sand fraction, 22.85% of the silt fraction, and 2.22% of the clay fraction. In terms of fraction size, this was loamy sand [56]. The physicochemical and chemical properties of soil are presented in Table 1. They were conducted according to the procedures presented in the manuscript by Borowik et al. [57].

2.2. Plant Characteristics

The study focused on plants having a well-developed root system, including three species of lawn grasses and three species of fodder grasses (Table 2).

2.3. Experimental Design

The study was conducted in a pot experiment, at the teaching-experimental station of the University of Warmia and Mazury in Olsztyn (NE Poland, 53.760° N 20.454° E). It was accomplished in two series: with nonsown (without grasses) soil and with soil sown with the selected grass species. The experiment (pots sown with six different species of grass and soil without grasses) was performed in four replications in 10 dm3 Kick–Brauckman pots, each filled with 9 kg of soil. Before the experiment had been established, the soil was sieved through a screen with mesh diameter of 5 mm, then thoroughly mixed, weighed into 9-kg portions, carefully mixed with mineral fertilizers, and poured into the pots. With soil sowing, 22 seeds were sown to each pot. The same mineral fertilization was applied for all grass species and control soil (not sown with grasses). The pre-sowing fertilization included, in mg kg−1 soil d.m. (dry matter): N—80, P—20, K—40, and Mg—10, whereas, after the harvest of the first and the second re-growth, the plants were additionally fertilized with nitrogen in the amount of 40 mg N kg−1 soil d.m.. All grass species emerged evenly and at the same time. After emergence, 20 plants were left in each pot. The experiment spanned for 105 days. Within this period, soil humidity was kept at a level of 50% of the maximum water capacity. The grasses were cut three times. Each time, the biomass of aerial parts was determined. In the last term of cutting (day 105 of experiment). Plants were removed from the pots and then the soil from each pot was mixed thoroughly.

2.4. Determination of Bacterial Count and Activity of Soil Enzymes

In soil samples, microbiological and biochemical analyses were carried out using standard methods, which are given in Table 3. These methods are described in detail in the manuscript of Borowik et al. [57] and Wyszkowska et al. [58]. Analyses were performed in four replications.

2.5. Metagenomic Analysis

Taxon of bacteria in soil samples was determined using analysis of the 16S rRNA encoding gene based on the hypervariable region V3–V4. Two primers were used for amplification: 1055F (5′-ATGGCTGTCGTCAGCT-3′) and 1392R (5′-ACGGGCGGTGTGTAC-3′). Polymerase chain reaction (PCR) was performed in real time in an Mx3000P thermocycler (Stratagene) and sequencing was in an Mx3000P thermocycler (Stratagene) at Genomed S.A. Warsaw, Poland.

2.6. Bioinformatic Analysis

The classification of bacteria was carried out with the QIIME package based on reference sequences database Greengenes v13_8 [65]. Sequences shorter than 1250 base pairs (bp), incomplete sequences and sequences containing more than 50 degenerated bases were omitted in the analysis and reference databases were prepared. The sequences were grouped in operational taxonomic units (OTUs).

2.7. Statistical Analysis

The Statistica 13.1 package [66] was used for statistical analyses. Homogenous groups were determined with the Tukey’s test, at p = 0.05, and respective results were presented graphically using principal component analysis (PCA) and graphs categorized for dependent variables (category X) and the grouping variable (category Y). Using the analysis of variance (ANOVA), F and P values were calculated for all parameters tested (Table S1). Relative abundance of microorganisms in soil samples was visualized with the use of STAMP 2.1.3 software, using a two-way test for statistical hypotheses: G-test (w/Yates’) + Fisher’s and Asymptotic with CC confidence interval method [67]. Genomic data were presented in the circular system using Circos 0.68 package [68]. Visualization of relative abundance data was performed using sequences with contribution exceeding 1%. The read-outs below 1% were summed up with the other nonclassified ones in a sample. To determine bacterial diversity at the level of each taxonomic group, Shannon–Wiener (H) and Simpson (D) indices were calculated using all metagenomic data. In addition, in order to consider not only the role of individual grass species in soil bacteriobiome modification but also to emphasize functional types of grasses, the fodder grasses: Lolium perenne (Lp), Festuca arundinacea (Fa), and Phleum pratense (Pp) were grouped and marked as T1, whereas the lawn grasses: Lolium perenne L.× hybridum (Lh), Poa pratensis (Pr), and Festuca rubra (Fr)—as T2.

3. Results

3.1. Grass Yield

The growth and development of grasses were significantly affected by their species (Figure 1). Generally, regardless of cutting term and grass species, the yield of fodder grasses (T1) was higher by 71.68% on average than that of the lawn grasses (T2). Among the fodder grasses, in the first and third terms of harvest—the greatest biomass yield was obtained from Lolium x hybridum Hausskn (Lh), whereas in the second term—from Festuca arundinacea (Fa). In the case of lawn grasses, the best yield was produced by Lolium perenne (Lp) in all three terms of harvest. To sum up, regardless of the harvest date, the largest biomass among fodder grasses was obtained in the case of Lolium x hybridum Hausskn (Lh), and, among lawn grasses, Lolium perenne (Lp).

3.2. Counts and Diversity of Soil Bacteria

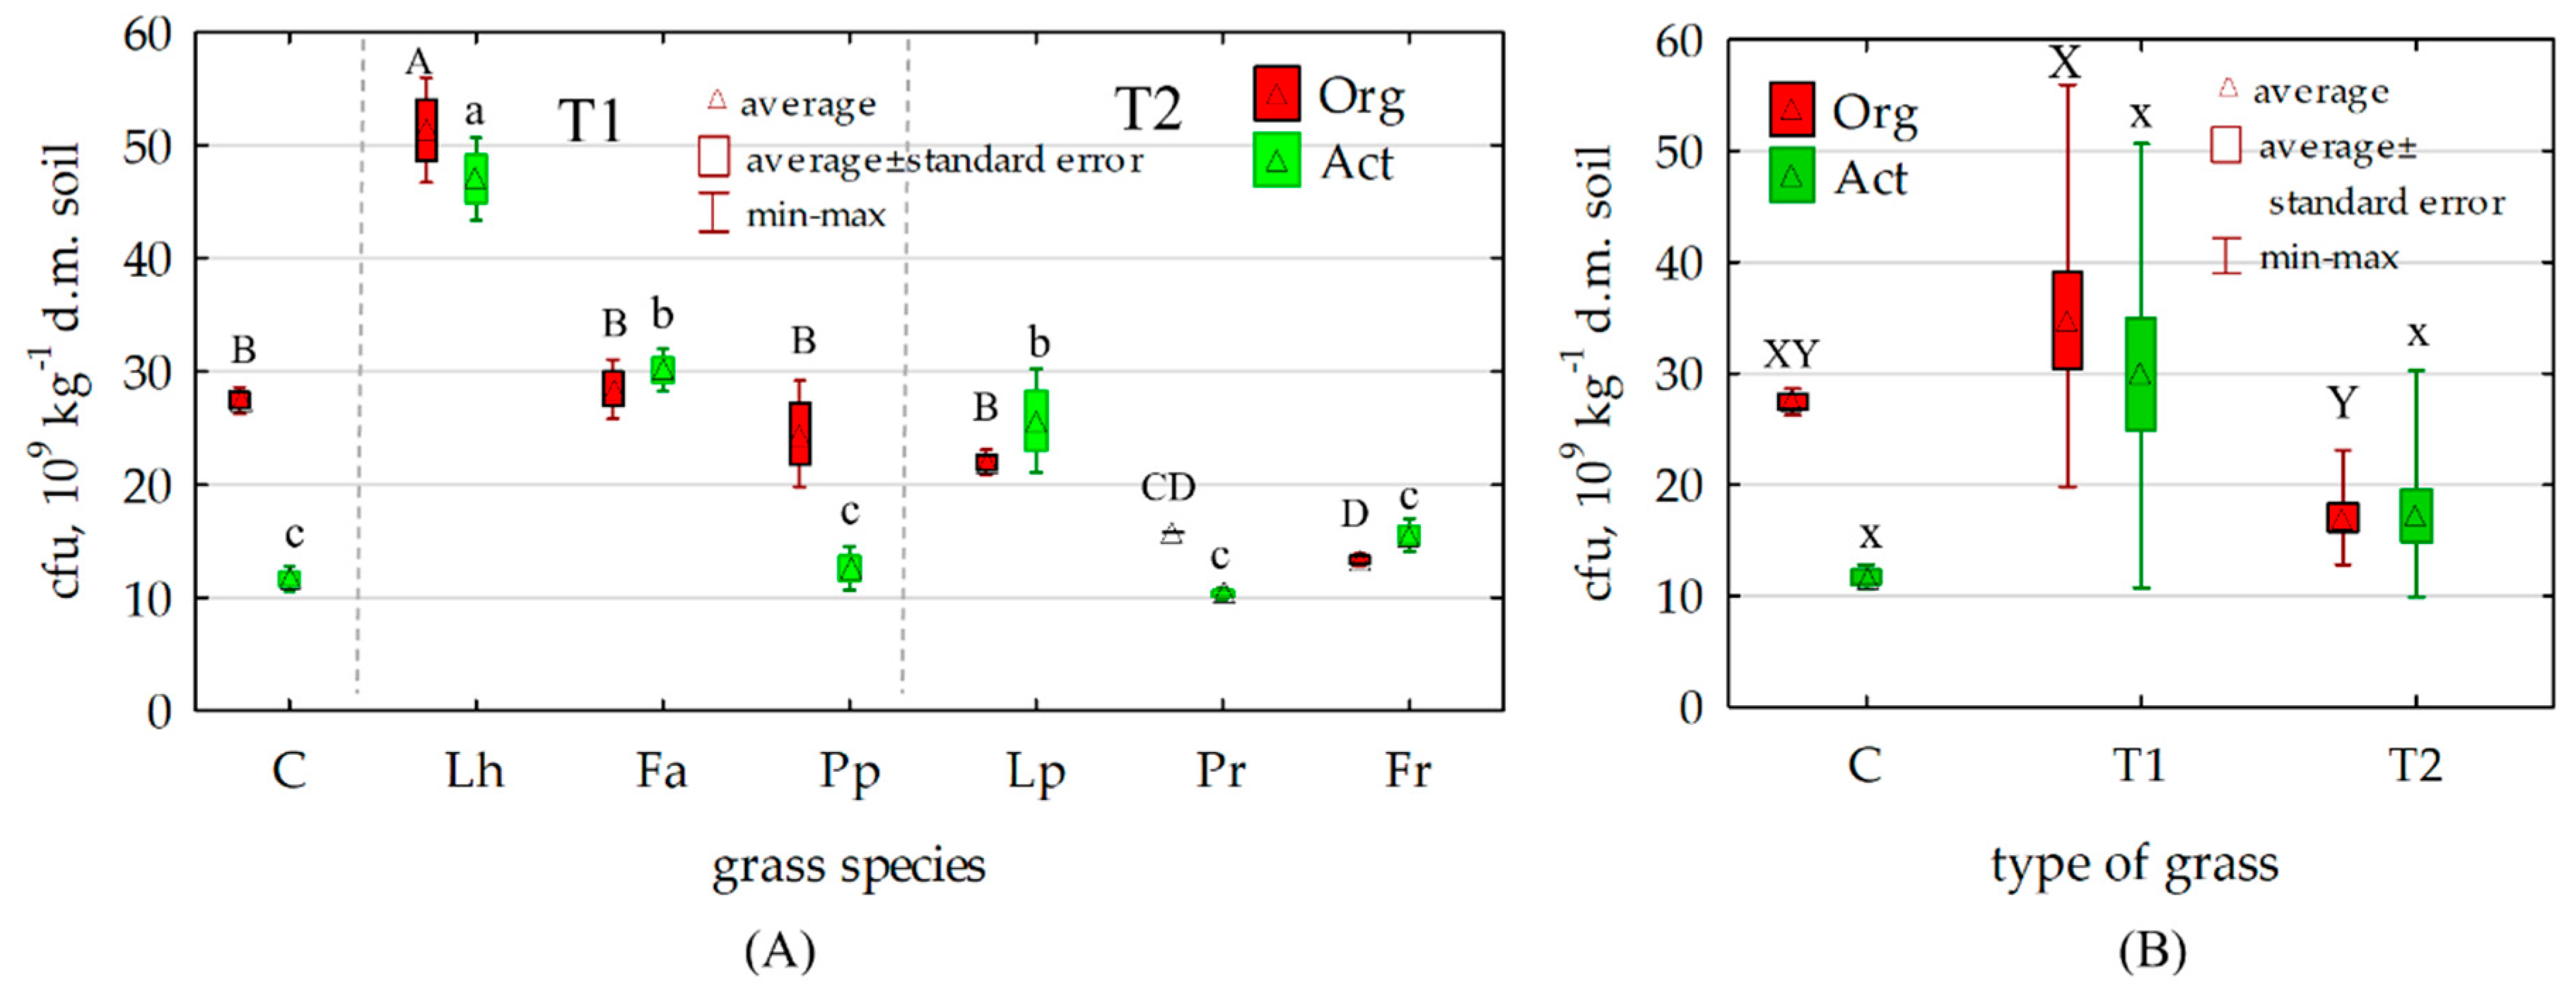
Cultivation of grasses ambiguously modified soil bacteriobiome (Figure 2). Sowing the soil with Lolium x hybridum Hausskn (Lh) caused a significant increase in the population number of both organotrophs and actinobacteria, whereas cultivation of Festuca arundinacea (Fa), Lolium perenne (Lp), and Festuca rubra (Fr)—only in the population number of actinobacteria. In turn, sowing Phleum pratense (Pp), Lolium perenne (Lp), Poa pratensis (Pr), and Festuca rubra (Fr) on soils significantly reduced the proliferation of organotrophic bacteria. Regardless of grass species, but considering their functional character, it was demonstrated that the fodder grasses (T1) increased the count of organotrophic bacteria by 26.57% and that of actinobacteria by 156.49% compared to the control soil (not sown with grasses), whereas the lawn grasses (T2) increased the count of actinobacteria by 47.43% and decreased that of organotrophs by 37.91% compared to the control soil.
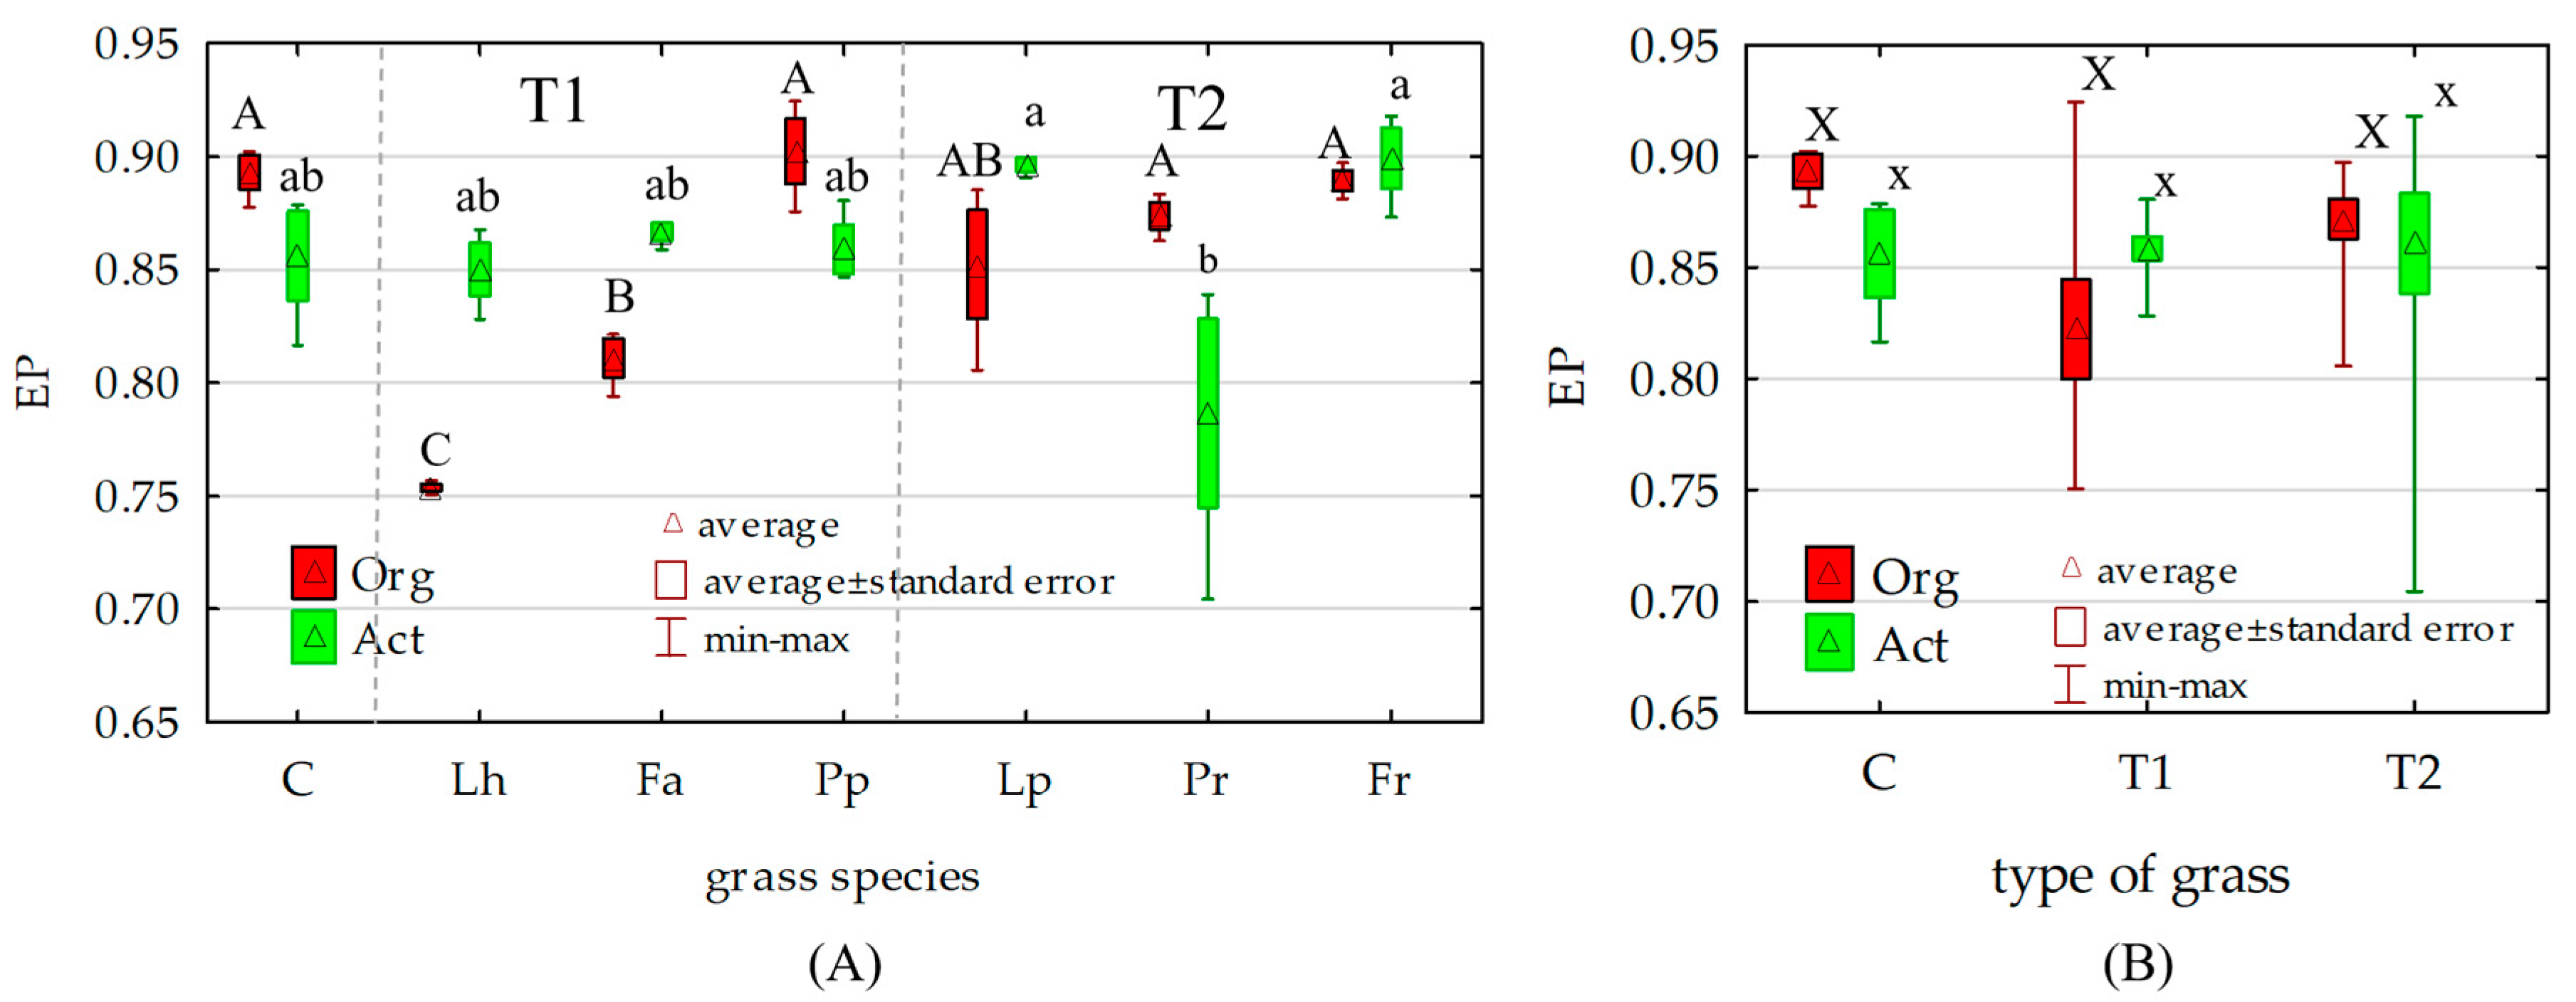
The positive impact of the fodder grasses on the proliferation of soil microorganisms was not reflected in their ecophysiological diversity index (EP), because cultivation of Lh, Fa, and Pp not only did not increase the EP index of organotrophs but decreased its value by 7.9% on average, and also did not change the EP index of actinobacteria (Figure 3). Also the cultivation of the lawn grasses caused insignificant changes in the value of EP index of organotrophic bacteria, whereas Lp and Fr had the same effect also on actinobacteria. Only Pr decreased EP index of actinobacteria by 8.14%.
Sowing the soil with both fodder and lawn grasses caused a significant decrease in the values of the colony development index (CD) calculated for the organotrophic bacteria (Figure 4). A decrease in CD value calculated for organotrophic bacteria ranged from 27.80% (Fa) to 36.88% (Lh) in the case of fodder grass species, and from 30.02% (Fr) to 37.73% (Pr) in the case of lawn grass species. A lesser decrease in CD value was observed in the case of actinobacteria, i.e., from 3.97% (Fa) to 16.26% (Pp) in the soils used to cultivate fodder grasses, and from 6.23% (Fr) to 16.93% (Pr) in the soils sown with lawn grasses.
At all plots, the prevailing phyla included Proteobacteria and Actinobacteria (Figure S1). In the control soil, Proteobacteria accounted for 28.78% of total bacteria, whereas this fraction was 38.56% in the soil sown with fodder grasses and 32.93% in that sown with lawn grasses. In the control soil, Actinobacteria accounted for 23.55%, in the soil sown with fodder grasses, for 19.77%, and, in the soil sown with lawn grasses, for 21.32% of total bacteria. The OTU number of Proteobacteria in the soil sown with fodder and lawn grasses was higher by 9.8% than in the control soil, whereas the OTU number of Actinobacteria decreased by 3.4% in the soil sown with fodder grasses and by 2.9% in soil sown with lawn grasses, compared to the control soil.
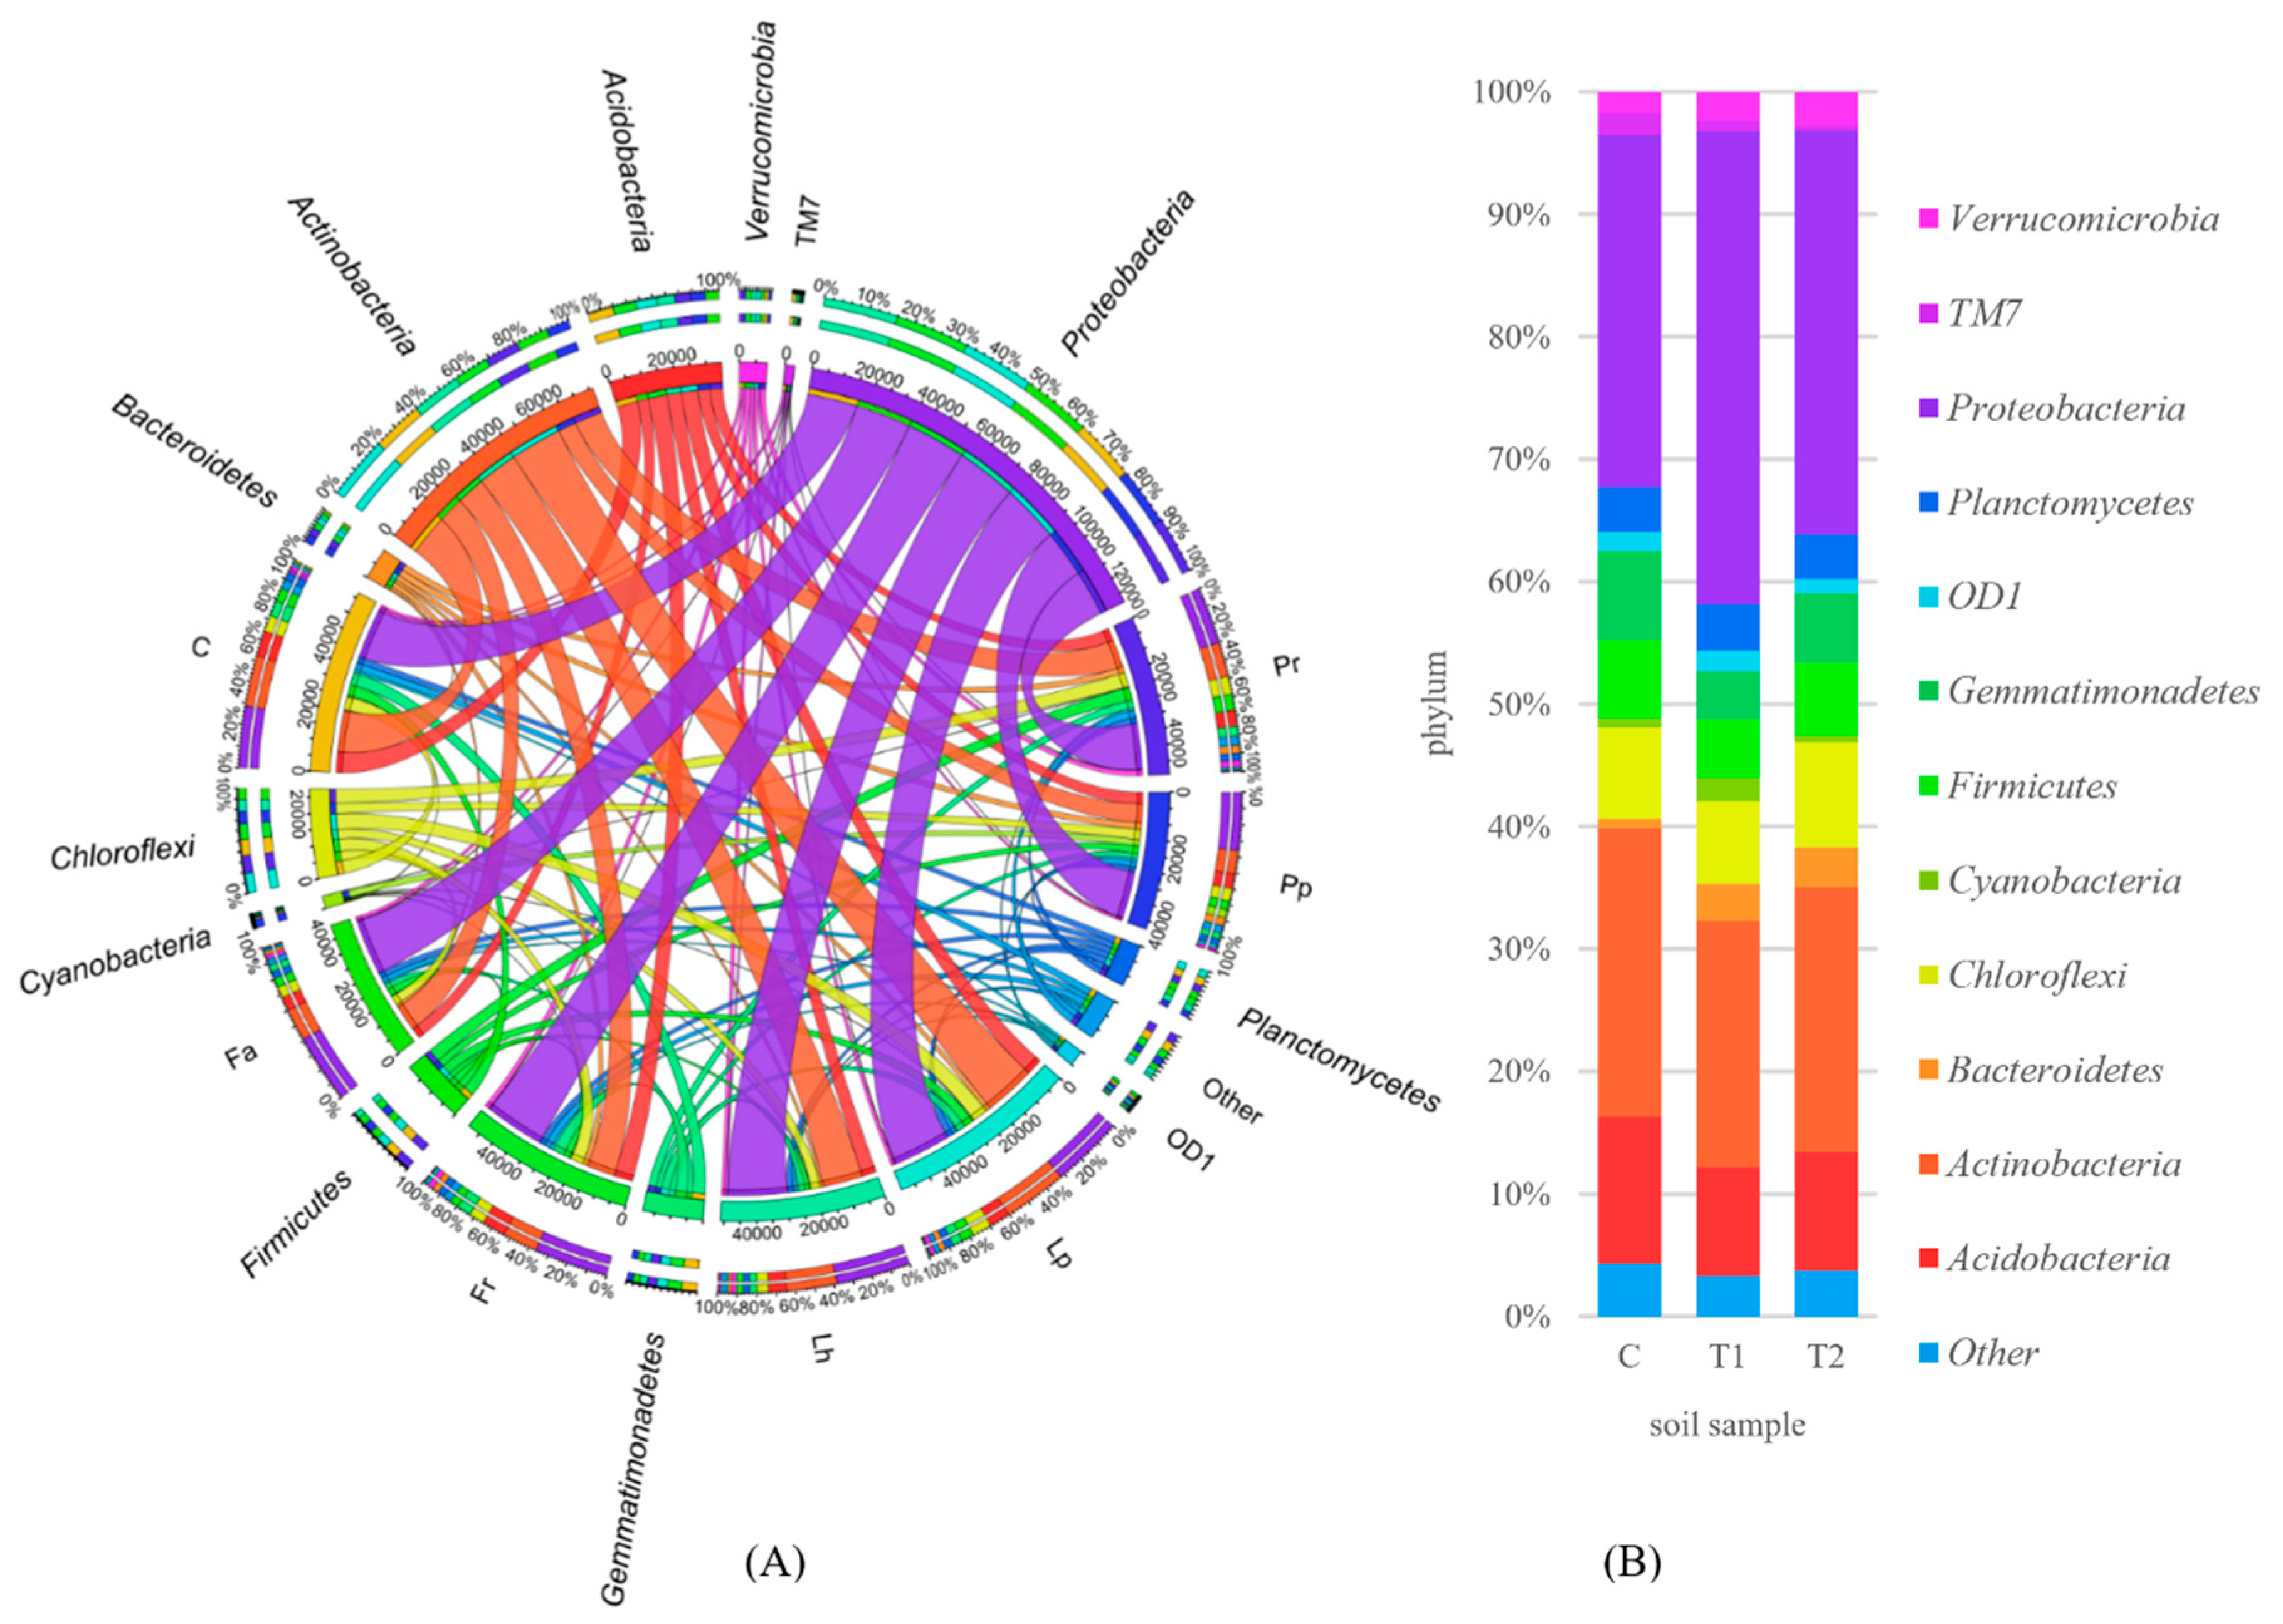
Apart from Proteobacteria and Actinobacteria, taxa identified at the phylum level included: Acidobacteria, Chloroflexi, Gemmatimonadetes, Firmicutes and Planctomycetes, Bacteroidetes, Verrucomicrobia, Cyanobacteria, as well as OD1 and TM7 (Figure 5A,B). The OTU number of bacteria classified as ‘others’ reached 4.3% in the control soil, 3.38% in the soil sown with fodder grasses, and 3.80% in the soil sown with lawn grasses. Cultivation of all grass species facilitated the proliferation of Proteobacteria, Bacteroidetes, and Verrucomicrobia bacteria, which resulted in higher OTU numbers of these bacteria compared to the control soil. The OTU number of Actinobacteria increased only in the sample of soil sown with Lolium x hybridum Hausskn (Lh) and Lolium perenne (Lp); the OTU number of Chloroflexi increased in the soils sown with Lolium perenne (Lp), Poa pratensis (Pr), and Festuca rubra (Fr); the OTU number of Firmicutes increased in the soil sown with Poa pratensis (Pr), whereas the OTU number of Planctomycetes rose in the soil sown with Poa pratensis (Pr), and Festuca arundinacea (Fa).
Both, in the control soil and soils sown with grasses, the prevailing class of bacteria was Alphaproteobacteria, which in the control soil accounted for 19.32% of total bacteria, in the soil sown with fodder grasses—for 19.99%, and in the soil sown with lawn grasses—for 16.50% (Figure S2). The second prevailing class was Actinobacteria, which in the structure of all bacterial classes represented 12.98% in the control soil, 13.88% in the soil used to cultivate fodder grasses, and 13.98% in the soil used to grow lawn grasses. Sowing the soils with fodder grasses caused the greatest changes in the abundance of bacterial classes: Gammaproteobacteria, Betaproteobacteria, and Acidobacteria-6, whose OTU numbers increased by 6.37%, 2.64%, and 1.99%, respectively, compared to the control soil.
Also, sowing the soil with lawn grasses increased OTU numbers of these bacteria in the range from 3.56% (Gammaproteobacteria) to 1.92% (Acidobacteria-6). Differences in changes in the bacterial structure were also noticeable between the rhizospheres of the fodder and lawn grasses. The OTU number of Alphaproteobacteria in the soils sown with fodder grasses was higher by 3.49% and that of Gammaproteobacteria by 2.82% than in the soils sown with lawn grasses. Regardless of grass species and functional designation, apart from the two prevailing classes Alphaproteobacteria and Actinobacteria, all soils contained also (in a descending order of OTUs): Betaproteobacteria, Thermoleophilia, Gammaproteobacteria, Bacilli, Acidobacteria-6, Gemmatimonadetes, Deltaproteobacteria, Planctomycetia, Solibacteres, Acidimicrobiia, Acidobacteriia, Gemm-1, C0119, Ellin6529, Chloracidobacteria, Clostridia, Phycisphaerae, Saprospirae, Ktedonobacteria, Pedosphaerae, ZB2, Thermomicrobia, Spartobacteria, Sphingobacteriia, Verrucomicrobiae, Chloroflexi, Chloroplast, TM7-1, Flavobacteriia, and Nostocophycideae (Figure 6A,B).
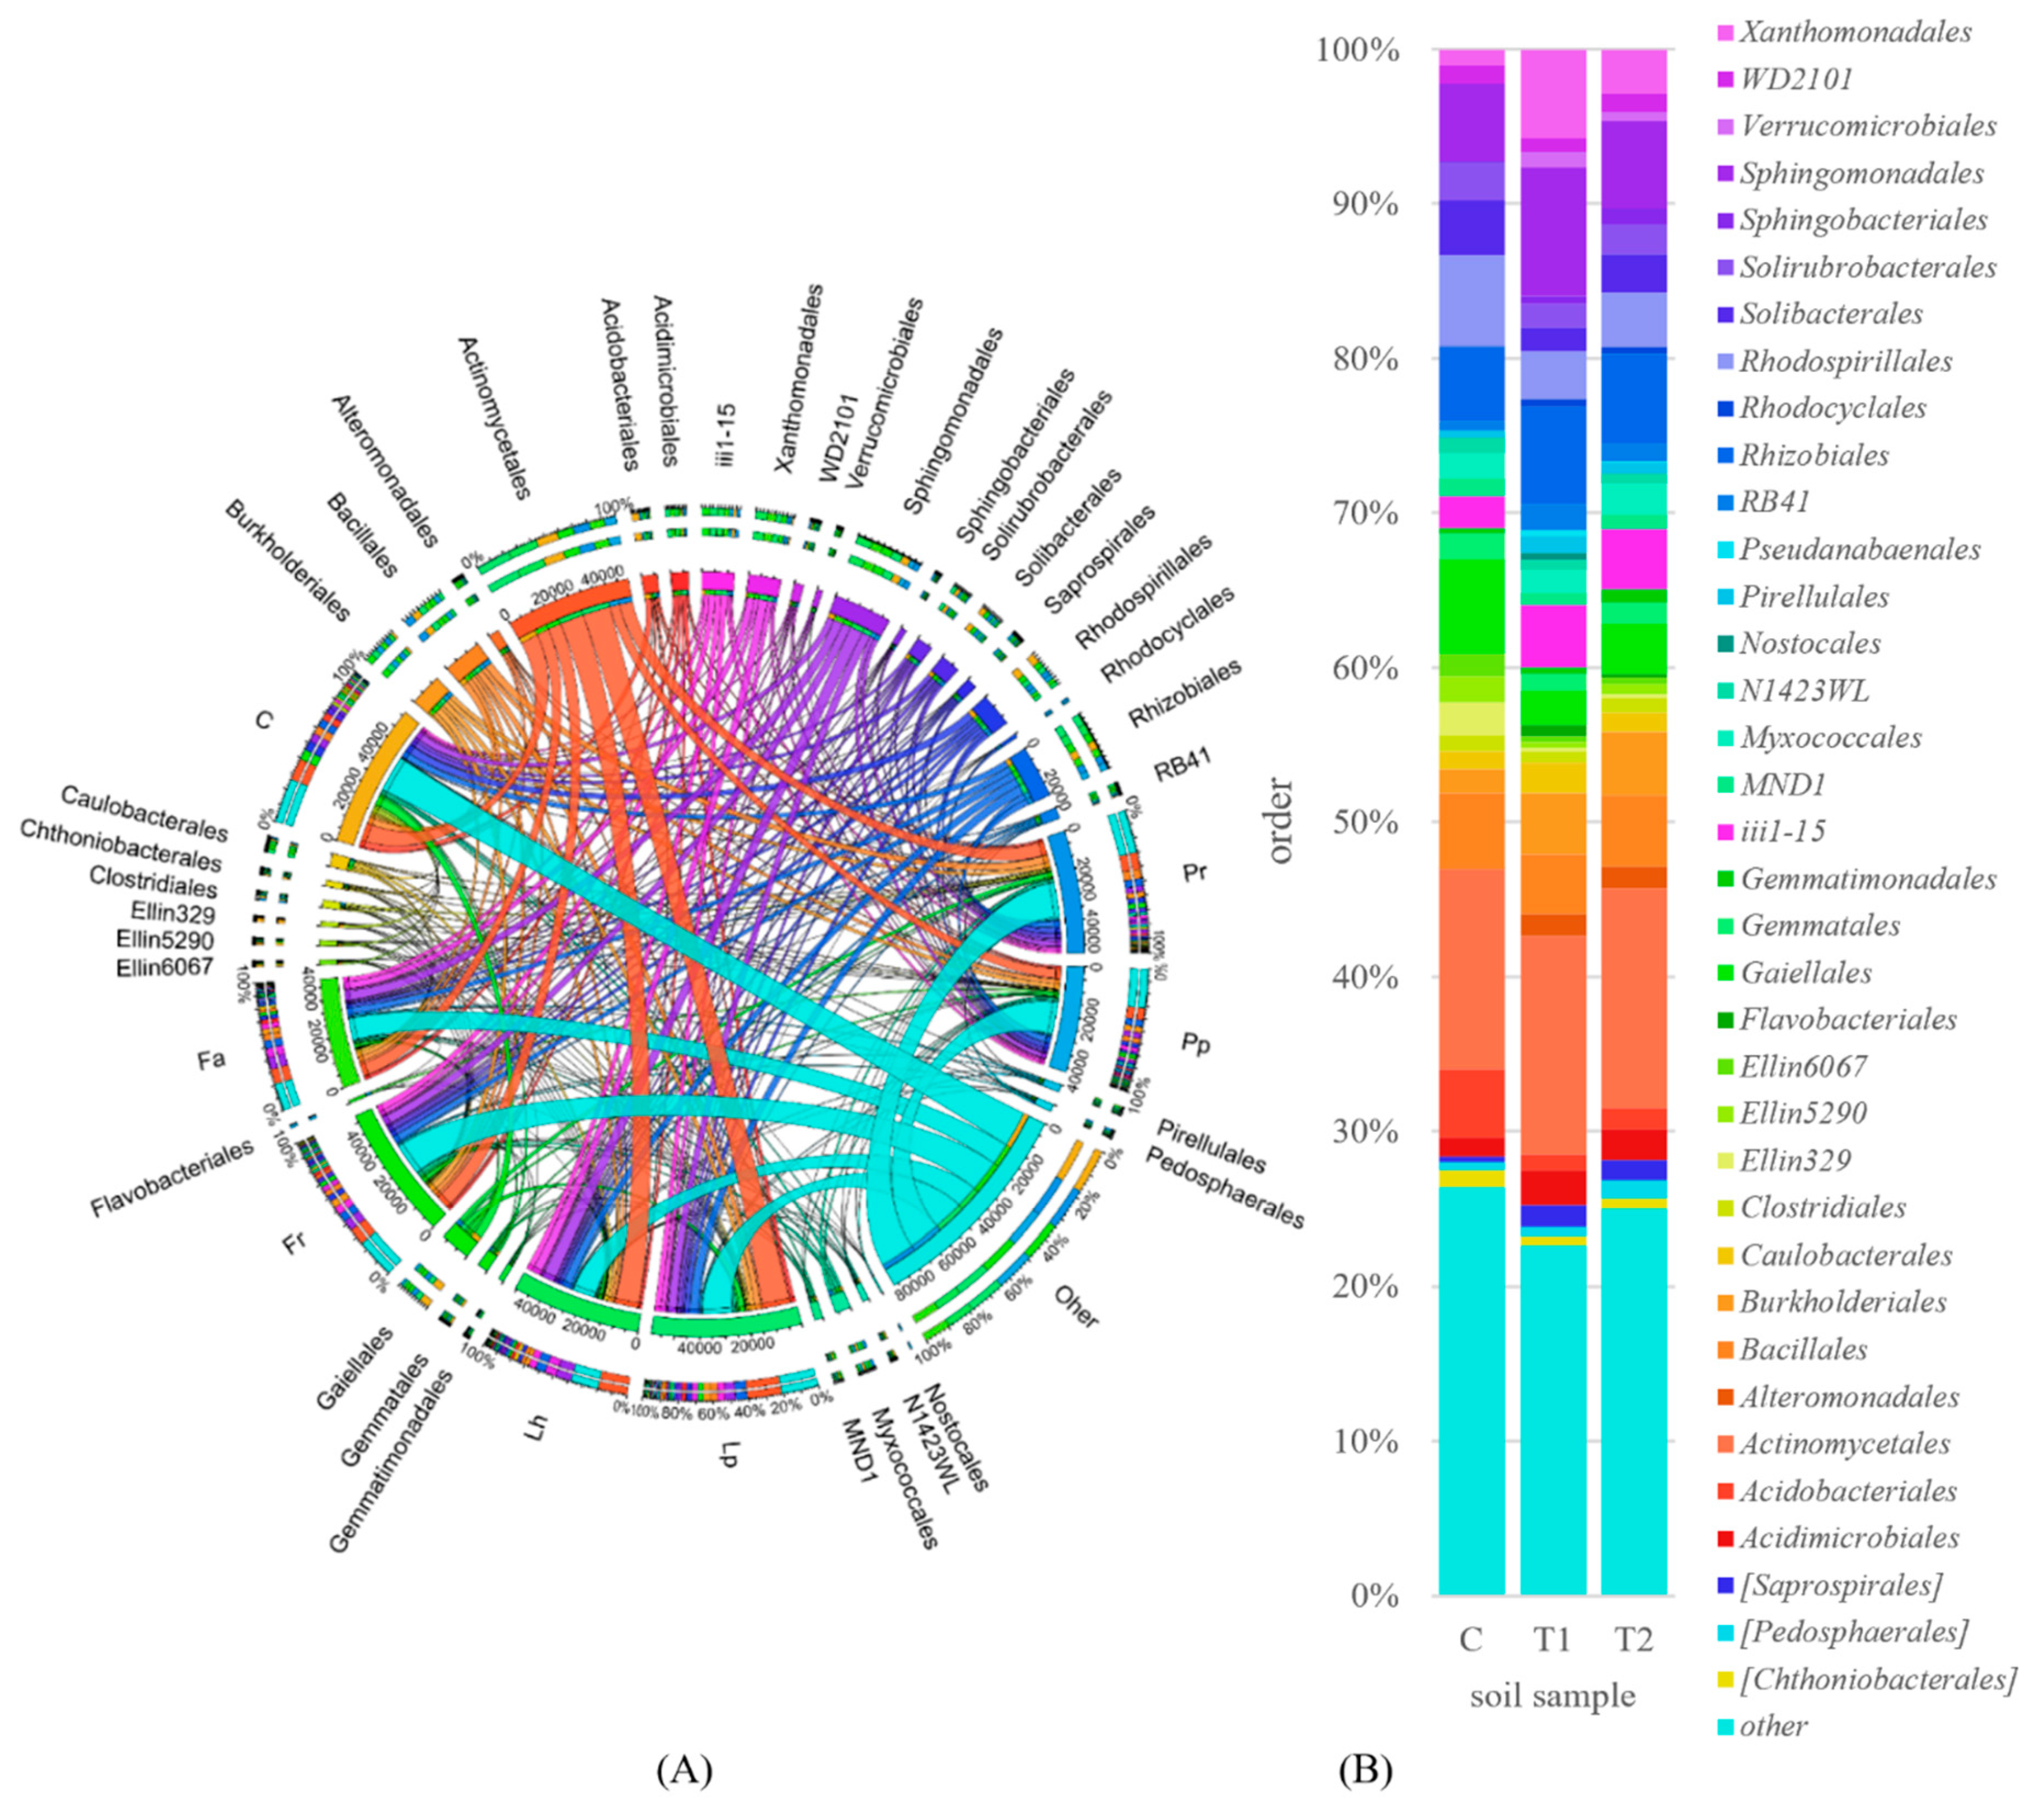
The effect of grasses on soil bacteriobiome was also noticeable at the order level. Among the 37 identified orders with OTU numbers above 1%, the greatest abundance was demonstrated for bacteria classified to Actinomycetales, Sphingomonadales, and Rhizobiales (Figure S3). When comparing effects of various functional types of grasses, it was found that sowing the soils with fodder grasses increased OTU numbers of Xanthomonadales by 4.67%, Sphingomonadales by 3.18%, Burkholderiales by 2.41%, Solibacterales by 2.04%, and Actinomycetales by 1.12%, whereas sowing the soils with lawn grasses increased OTU numbers of Burkholderiales by 2.60%, Xanthomonadales by 1.85%, Alteromonadales by 1.39%, Actinomycetales by 1.23, and Rhizobiales by 1.02%, compared to the nonsown control soil.
The highest OTU number of Actinomycetales bacteria was determined in the soils sown with Lolium x hybridum Hausskn (Lh) and Lolium perenne (Lp); whereas that of Sphingomonadales—in the soils sown with Lolium x hybridum Hausskn (Lh), Festuca arundinacea (Fa), Festuca rubra (Fr), and Lolium perenne (Lp) (Figure 7A,B). Higher OTU numbers were also determined in the soils with growing grasses than in the control soil for the bacteria from the following orders: Burkholderiales, Xanthomonadales, Saprospirales, and Sphingobacteriales.
Differences in the abundance of bacterial populations were also observed at the family level. Compared to the control soil, the greatest changes in the structure of bacteria classified to families, after soil sowing with both fodder and lawn grasses, occurred in the families of Gaiellaceae (decrease by 3.16% and 2.57%, respectively), Koribacteraceae (decrease by 2.77% and 2.54%), Intrasporangiaceae (increase by 2.14% and 1.38%), Xanthomonadaceae (increase by 3.54% and 1.13%), and Comamonadaceae (increase by 2.61% and 2.43) (Figure S4).
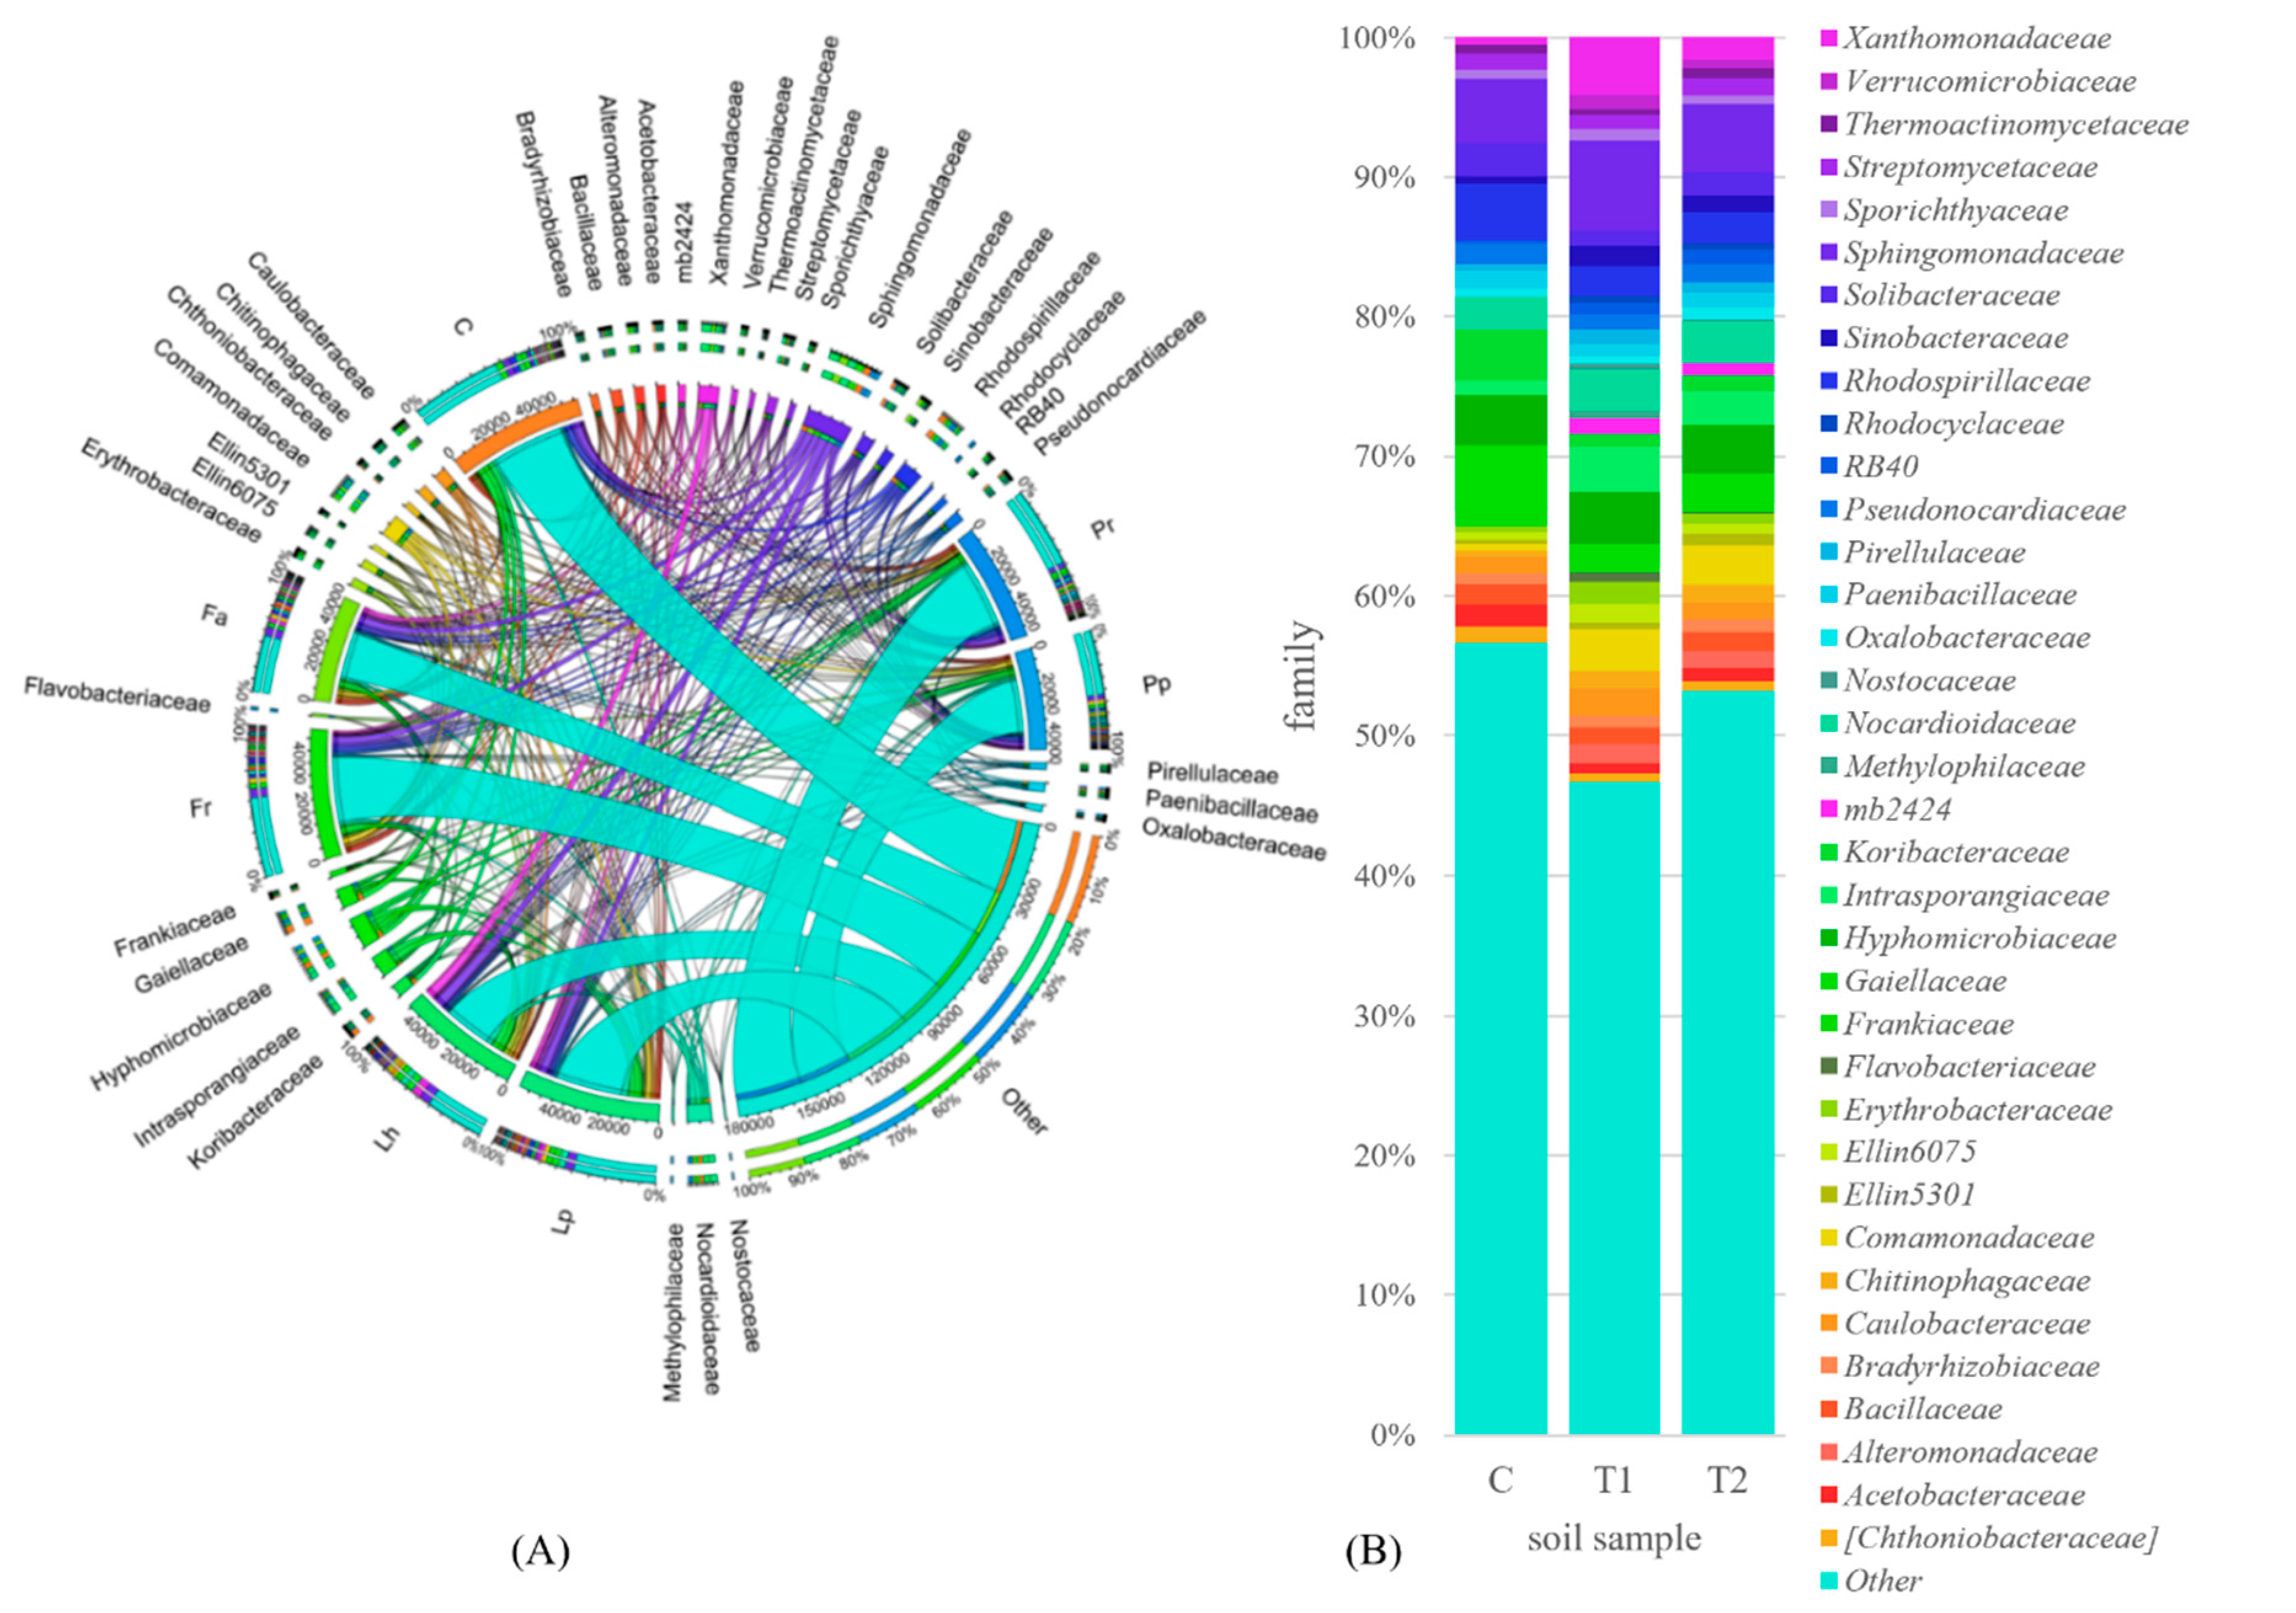
When comparing effects of individual grass species on OTU number of bacteria classified to families, it can be concluded that they were inexplicit (Figure 8A,B). All species increased OTU numbers of the following families: Intrasporangiaceae, Bradyrhizobiaceae, Xanthomonadaceae, Sinobacteraceae, Comamonadaceae, Pirellulaceae, Chitinophagaceae, Ellin5301, Nostocaceae, and Rhodocyclaceae, but decreased OTU numbers of Gaiellaceae, Rhodospirillaceae, Koribacteraceae, Solibacteraceae, Acetobacteraceae, Pseudonocardiaceae, Paenibacillaceae, Frankiaceae, and Chthoniobacteraceae. Noteworthy is the fact that sowing the grasses onto soils resulted in the appearance of families: Alteromonadaceae, Methylophilaceae, Flavobacteriaceae, and Verrucomicrobiaceae, that were not identified in the control soil.
Considering OTU numbers above 1%, only 11 bacterial genus were identified in the control soil not sown with grasses, whereas 17 genus in the soil sown with Pp and Pr, 16 genus in the soil sown with Fr and Lp, 15 genus in the soil sown with Fa, and 14 genus in the soil sown with Lh (Figure 9). The contribution of the identified bacteria in the genus structure ranged from 13.86% in the soil sown with Pr to 20.34% in the soil sown with Lh. The genus Kaistobacter was found to predominate on all plots. Regarding OTU number, it was followed by Rhodoplanes in the control soil and soil sown with Pr, by Terracoccus in the soil sown with Lh and Lp, by HB2-32-21 in the soil sown with Fa and Fr, and by Flavobacterium in the soil sown with Pp. Compared to the soils overgrown with grasses, no OTUs of the following genera were identified in the control soil: Arenimonas, Dechloromonas, Flavobacterium, Methylotenera, and Mycoplana.
The analysis of values of Shannon and Simpson diversity indices points to a richer microbiome of the soils sown with grasses compared to the control soil (Table 4). The greatest abundance among the fodder grasses was found in the rhizosphere of Pp, and, among the lawn grasses, in the rhizosphere of Pr.

3.3. Activity of Soil Enzymes

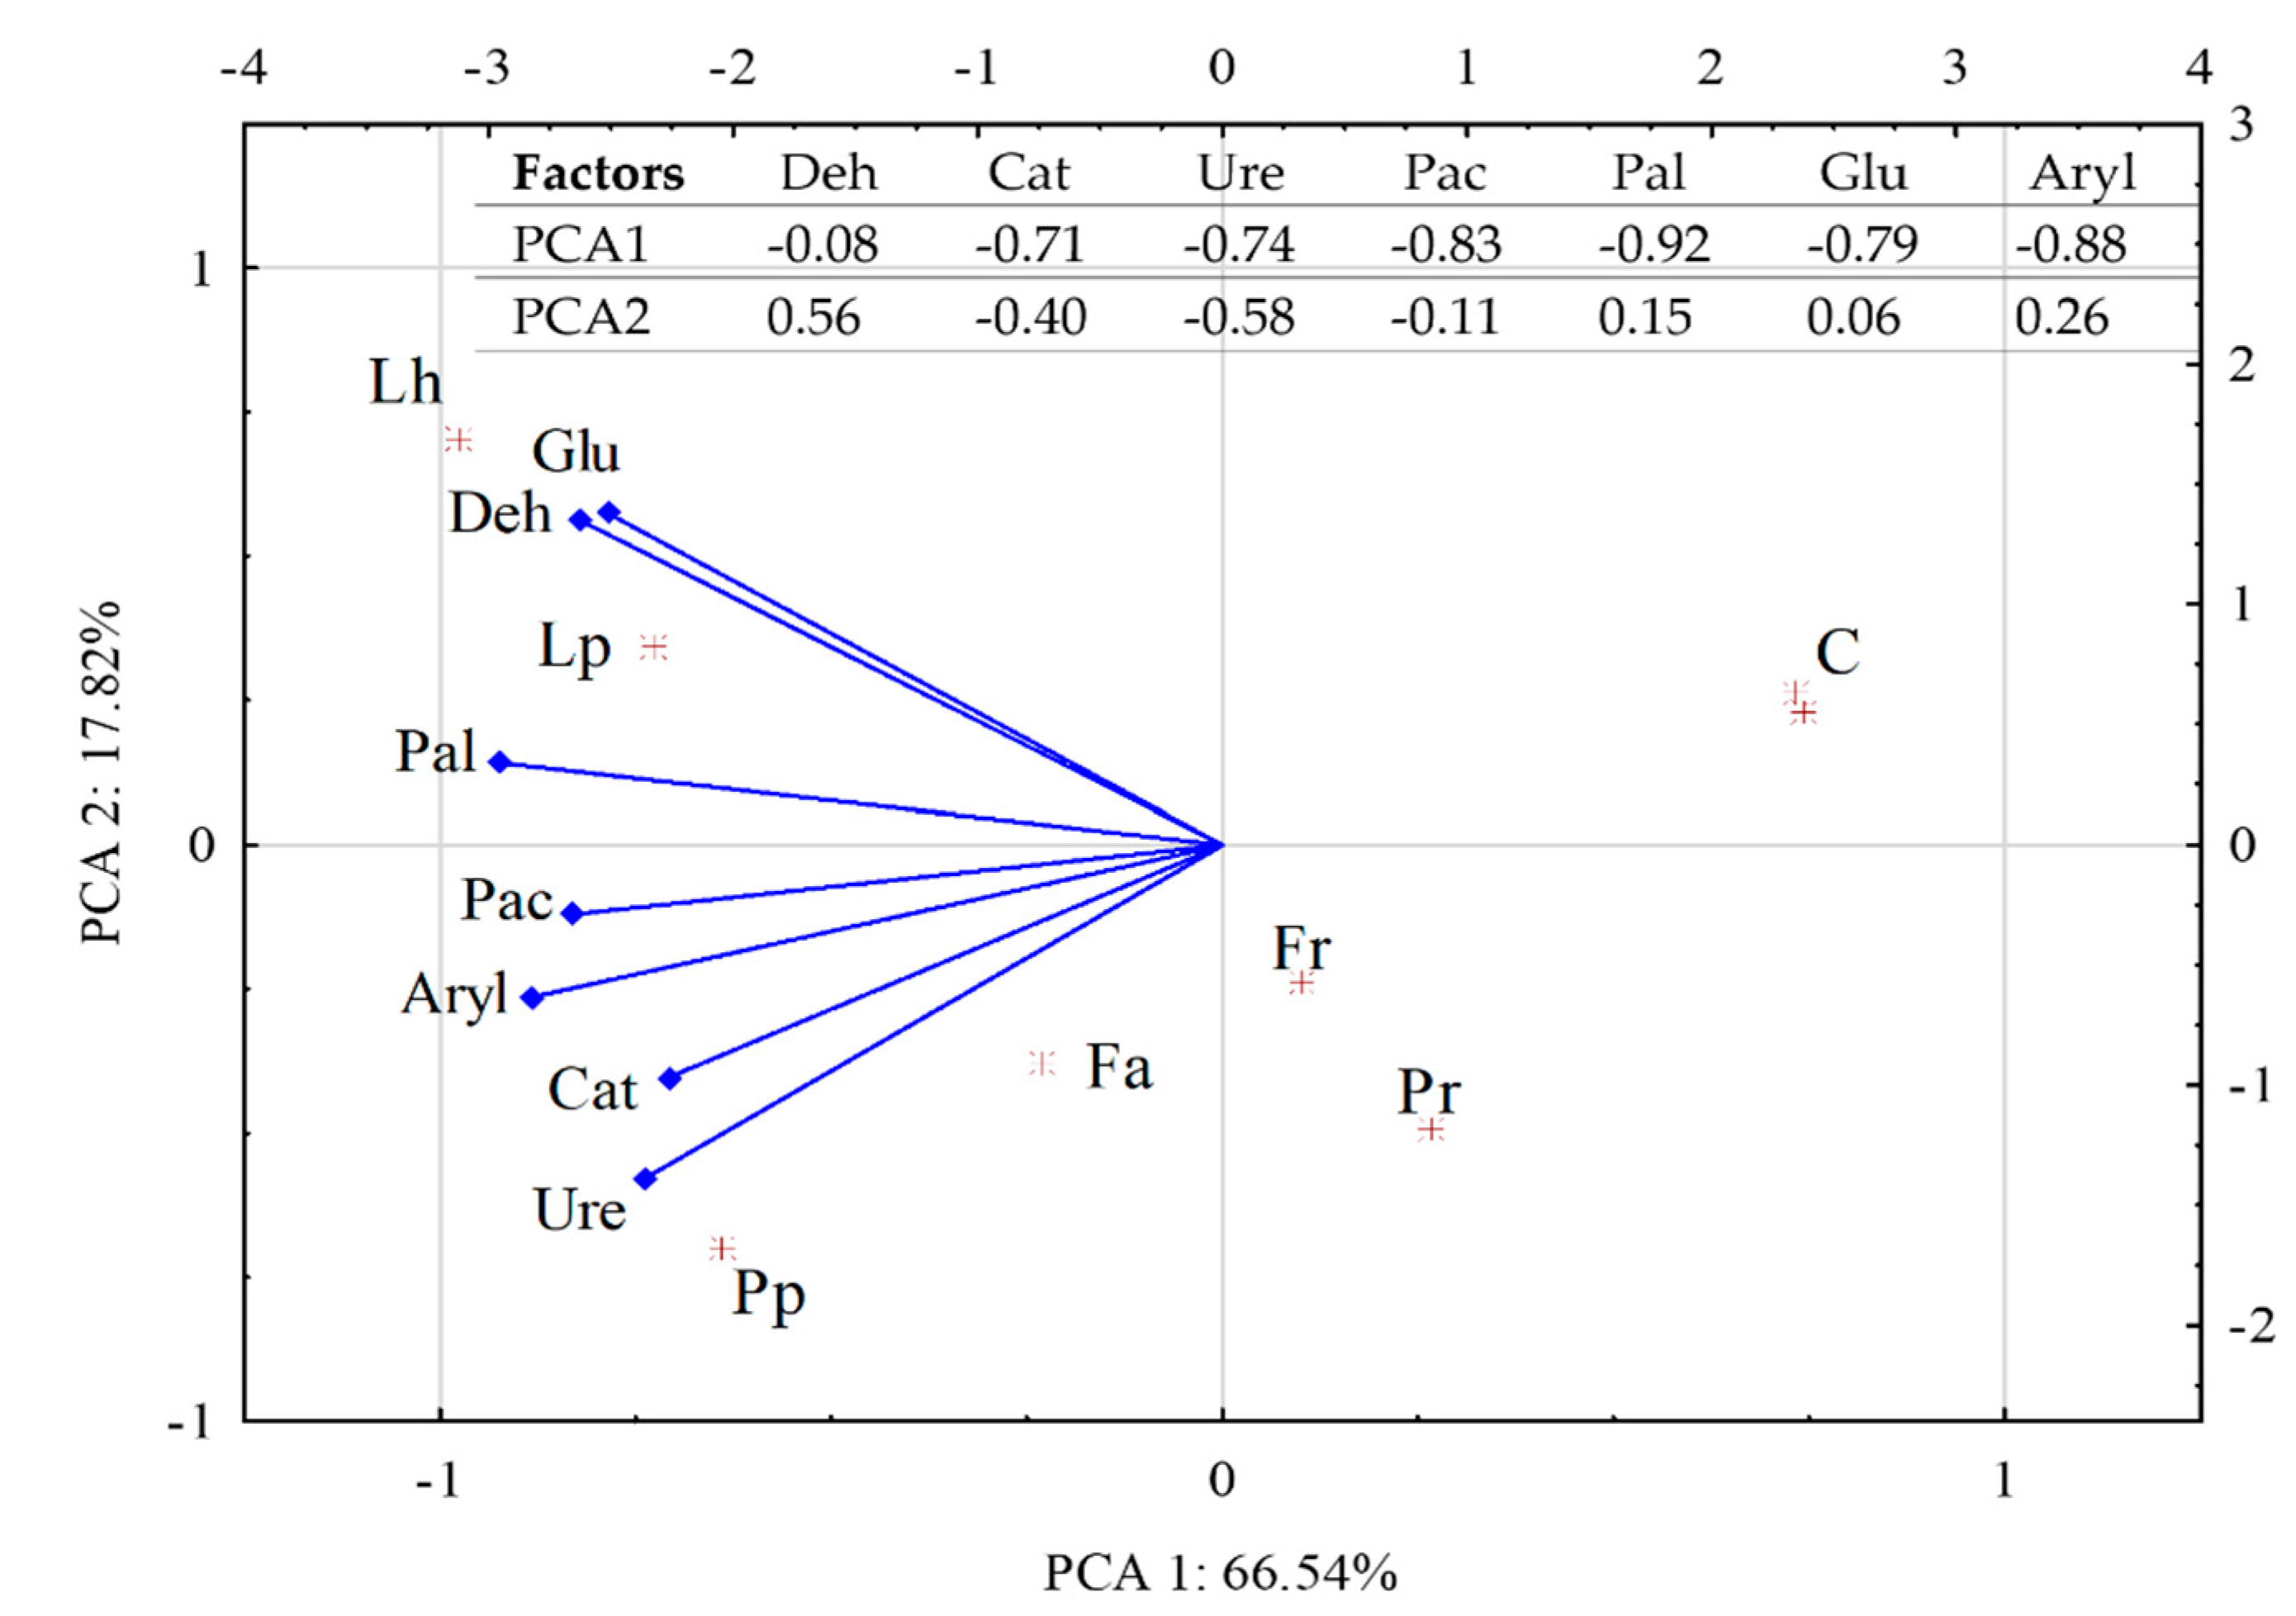
Study results demonstrated the highest enzymatic activity in the soil sown with Lh and Lp (Table 5, Figure 10), and the lowest one in the control soil. Activities of all enzymes were expressed in activity units per dry matter of 1 kg of soil within 1 h, and so the activity of dehydrogenases ranged from 10.292 μmol TFF (triphenyl formazan) in the soil sown with Lh to 0.654 μmol TFF with Pr; that of catalase, from 0.205 mol O2 in the soil sown with Pr to 0.091 mol O2 in the control soil; that of urease, from 0.880 mmol N-NH4 in the soil sown with Pp to 0.302 in the control soil; that of acid phosphatase, from 1.302 mmol PNP (p-nitrophenyl) in the soil sown with Lp to 0.785 mmol PNP in the control soil; that of alkaline phosphatase, from 0.397 mmol PNP in the soil sown with Lh to 0.138 mmol PNP in the soil sown with Fr; that of β-glucosidase, from 0.348 mmol PNP in the soil sown with Lh to 0.298 mmol PNP in the soil sown with Pr; and that of arylsulfatase, from 0.164 mmol PNP in the soil sown with Pp to 0.082 mmol PNP in the control soil. The average enzymatic activity of soil sown with fodder grasses was 161% higher than in nonsown soil, and of soil sown with lawn grasses was 83% higher than in nonsown soil. Generally, the enzymatic activity of soils sown with fodder grasses was higher (by 30%) than that of the soils overgrown with the lawn grasses. The lowest enzymatic activity was determined in the control soil not sown with grasses (Figure 10); there was a significantly higher one in the soils sown with Pr, Fr, and Fa; and the highest one was in the soils sown with Lh, Lp, and PP.

4. Discussion

4.1. Grass Yield

The genotype of grasses turned out to be the main factor which differentiated their yield. Conditions mentioned by Broadbent et al. [69] that model plant growth and development, such as, climatic zone, fraction size, composition of soil, nutrients content in soil, as well as climatic and anthropogenic stresses, could not affect grass growth and development because the pot experiment was performed under controlled conditions. In addition, mineral fertilization was the same for all grass species; therefore this was the genotype that determined the higher biomass produced by the fodder than by the lawn grasses. According to Shukla et al. [70], plants used in agriculture are often grown for green forage and energetic biomass, hence they are increasingly exploited for other purposes than feeds.

4.2. Counts and Diversity of Soil Bacteria

The present study demonstrated that the analyzed grass species modified the soil bacteriobiome to various extents, which was mainly due to the development of their root system [71,72,73] and chemical composition of their root secretions [13]. According to Berg and Smalla [74] and to Murphy [75], plants may contribute to the establishment of unique communities of soil microorganisms. Among all analyzed grass species, Lolium x hybridum Hausskn (Lh) contributed to the greatest increase in the population number of organotrophic bacteria compared to the control soil, whereas Poa pratensis (Pr), Lolium perenne (Lp), Phleum pratense (Pp), and Festuca rubra (Fr) significantly suppressed their proliferation. The analysis of study results demonstrates that the fodder grasses had a more beneficial effect on the proliferation of organotrophic bacteria and actinobacteria than the lawn grasses had. As reported by Deru et al. [71] and Saleh et al. [73], this could be due to the genetic determinants of individual grass species, which affect development of their root system; whereas the root system influences the development of rhizosphere microbiome by the mineral and organic compounds it secretes [13,74]. Singh et al. [76] emphasized that greater amounts of root secretions produced by young plants contribute to a better availability of carbon and energy sources to microorganisms. In addition, these secretions facilitate rhizosphere colonization by microorganisms [77]. This, in turn, leads to cooperation between the plant and the bacteriobiome, because part of rhizospheric bacteria penetrate inside plant tissues through damaged tissue or due to the release of enzymes capable of increasing solubility of nonabsorbable elements [73].
Although fodder and lawn grasses sown onto the soil elicited changes in the counts of organotrophs and actinobacteria, they did not improve their ecophysiological diversity index (EP). A shift could, however, be noticed in bacteria development towards the k strategists, i.e., slow-growing bacteria, which was indicated by decreased values of the colony development index (CD) caused by both fodder and lawn grasses. These results confirm earlier findings reported by De Leij et al. [61], and Murphy et al. [75], who also observed that the microbiome of the rhizosphere of plants changes along with the prolonging growing season, and that the population of r-strategists turns into k-strategists. Marschner et al. [78], Murphy et al. [75], and Kielak et al. [79] demonstrated that bacterial communities of the rhizosphere are initially predominated by Proteobacteria r-strategists. Also in our study, the Proteobacteria and Actinobacteria were the prevailing phyla on all pots; whereas the prevailing classes included: Alphaproteobacteria and Actinobacteria; the prevailing orders were: Actinomycetales, Sphingomycetales, and Rhizobiales; the prevailing families included: Sphingomonadaceae and Hyphomicrobiaceae; and the predominating genera were: Kaistobacter, Rhodoplanes, Teracoccus, and Flavobacterium. These results correspond with literature data [22,33,80,81,82,83]. In general, a richer bacteriobiome in terms of diversity was demonstrated in the soils sown with grasses than in the control soil without grasses. In the case of the fodder grasses, the greatest diversity occurred in the rhizosphere of Poa pratensis (Pr), whereas, in the case of lawn grasses, it was in the rhizosphere of Phleum pratense (Pp).
The response of Proteobacteria and Actinobacteria to sowing grasses onto soil varied. Greater OTUs of Proteobacteria were demonstrated in the soils sown with grasses, regardless of their functional type, than in the control soil, whereas the OTU number of Actinobacteria in the soil was reduced by both groups of grasses. Changes at the level of phylum and other taxonomic units in the soil sown with various species of legumes and grasses were also observed by Zhou et al. [47] and Singh et al. [76]. A special trait of Actinobacteria is their resistance to extreme environmental conditions [22,33,82]. This phylum was described as a promising taxon of plant growth promoters [83].
According to Delgado-Baquerizo et al. [80], the most abundant class of bacteria in soils of the world is Alphaproteobacteria, which includes Bradyrhizobium, Sphingomonas, Rhodoplanes, Devosia, and Kaistobacter genera; whereas among Actinobacteria, there are the Streptomyces, Salinibacterium, and Mycobacterium genera. In our study also, the Kaistobacter and Rhodoplanes genera were found to prevail, but other major genera included Terracoccus, Candidatus Koribacter, and Devosia.
Both the results of this study and literature data [21,22,33,80,82] indicate that investigations addressing the genetic biodiversity of bacteria should be continued in various soil ecosystems.

4.3. Activity of Soil Enzymes

Being sensitive indicators of soil quality, enzymes are strongly associated with the microbiological activity and species colonization of plants [4,84]. In the present study, grasses stimulated the biochemical activity of soil. This is due to their beneficial effect on the soil bacteriobiome, as indicated by results of this study and by literature data [51,52,84,85,86]. The association between the activity of soil enzymes and microbiome quality is due to the origin of enzymes [38,50,53,84]. In soil ecosystems, they are mainly derived from microorganisms and, to a lesser extent, from plants and other soil organisms [87,88,89,90]. The positive correlation between the activity of soil enzymes and the activity of microorganisms has been demonstrated by many experts in soil science [91,92,93]. In our own research, the higher activity of soil enzymes in soil sown with fodder grass is mainly associated with a greater diversity of bacteria at the family and genus level in soil from below these plants than in soil from below lawn grasses. The values of the Shannon-Wiener and Simpson indicators prove this. Nevertheless, the more beneficial effect elicited by the fodder than by the lawn grasses on the biochemical properties of soil proves that, by activating the microbiome, the plants can intermediately affect enzymatic activity. This hypothesis was corroborated by other authors [3,86,91,92,93,94].

5. Conclusions

The analyzed grass species from the family Poacea had a beneficial effect on soil microbiome and activity of soil enzymes. The intensity of their effect was determined by both their species and their functional type. More favorable conditions for the growth and development of soil bacteria, and thereby for the enhanced enzymatic activity, were offered by the fodder than by the lawn grasses. Among the fodder grasses, the greatest bacteriobiome diversity was demonstrated in the soil sown with Poa pratensis (Pp), whereas, among the lawn grasses, it was in soil sown with Phleum pretense (Pr). The highest enzymatic activity was determined also. Considering the fodder grasses, this was in the soil with Lolium x hybridum Hausskn (Lh), and in the soil with Lolium perenne (Lp) in the case of lawn grasses. The sowing of soils with grasses caused the succession of bacterial communities from r strategy to k strategy. In all pots, the prevailing phyla included Proteobacteria and Actinobacteria; the prevailing classes were Alphaproteobacteria and Actinobacteria; the prevailing orders included Actinomycetales, Sphingomycetales, and Rhizobiales; the prevailing families were Sphingomonadaceae and Hyphomicrobiaceae; and the prevailing genera included Kaistobacter, Rhodoplanes, Teracoccus, and Flavobacterium.

Supplementary Materials

The following are available online at https://www.mdpi.com/1424-2818/12/6/212/s1, Table S1: One-way significance tests carried out using the analysis of variance (ANOVA), Figure S1: The relative abundance of dominant phylum bacteria in soil. Data on the number of readings greater than 1% of all OTUs, Figure S2: The relative abundance of dominant class bacteria in soil. Data on the number of readings greater than 1% of all OTUs, Figure S3: The relative abundance of dominant order bacteria in soil. Data on the number of readings greater than 1% of all OTUs, Figure S4: The relative abundance of dominant family bacteria in soil. Data on the number of readings greater than 1% of all OTUs.

Author Contributions

A.B. conceived and designed the ideas and. wrote the manuscript with the help of J.W. and J.K.; A.B. conducted the experiments, collected and analyzed the data, conducted the bioinformatic analysis and visualization of data; all authors contributed to the final version of this manuscript. All authors have read and agreed to the published version of the manuscript.

Funding

This study was supported by the Ministry of Science and Higher Education funds for statutory activity. Project financially supported by Minister of Science of Higher Education in the range of the program entitled “Regional Initiative of Excellence” for the years 2019–2022, Project No. 010/RID/2018/19, amount of funding 12,000,000 PLN.

Conflicts of Interest

The authors declare no conflict of interest. The funders had no role in the design of the study; in the collection, analyses, or interpretation of data; in the writing of the manuscript, or in the decision to publish the results.

References

  1. Berendsen, R.L.; Pieterse, C.M.J.; Bakker, P.A.H.M. The rhizosphere microbiome and plant health. Trends Plant Sci. 2012, 17, 478–486. [Google Scholar] [CrossRef] [PubMed]
  2. Naylor, D.; Coleman-Derr, D. Drought Stress and Root-Associated Bacterial Communities. Front. Plant Sci. 2018, 8, 2223. [Google Scholar] [CrossRef] [PubMed]
  3. Xavier, C.V.; Moitinho, M.R.; De Bortoli Teixeira, D.; André de Araújo Santos, G.; de Andrade Barbosa, M.; Bastos Pereira Milori, D.M.; Rigobelo, E.; Corá, J.E.; La Scala Júnior, N. Crop rotation and succession in a no-tillage system: Implications for CO2 emission and soil attributes. J. Environ. Manag. 2019, 1, 8–15. [Google Scholar] [CrossRef] [PubMed]
  4. Vives-Peris, V.; de Ollas, C.; Gómez-Cadenas, A.; Pérez-Clemente, R.M. Root exudates: From plant to rhizosphere and beyond. Plant Cell Rep. 2019, 25. [Google Scholar] [CrossRef]
  5. Evans, S.E.; Wallenstein, M.D. Climate change alters ecological strategies of soil bacteria. Ecol. Lett. 2013, 17, 155–164. [Google Scholar] [CrossRef]
  6. Fierer, N. Embracing the unknown: Disentangling the complexities of the soil microbiome. Nat. Rev. Microbiol. 2017, 15, 579–590. [Google Scholar] [CrossRef]
  7. Singh, B.K.; Bardgett, R.D.; Smith, P.; Reay, D.S. Microorganisms and climate change: Terrestrial feedbacks and mitigation options. Nat. Rev. Microbiol. 2010, 8, 779–790. [Google Scholar] [CrossRef]
  8. Nannipieri, P.; Ascher, J.; Ceccherini, M.T.; Landi, L.; Pietramellara, G.; Renella, G.; Valori, F. Effects of Root Exudates in Microbial Diversity and Activity in Rhizosphere Soils. In Molecular Mechanisms of Plant and Microbe Coexistence; Nautiyal, C.S., Dion, P., Eds.; Springer: Berlin/Heidelberg, Germany, 2008; Volume 15, pp. 339–365. [Google Scholar] [CrossRef]
  9. Candan, N.; Cakmak, I.; Ozturk, L. Zinc-biofortified seeds improved seedling growth under zinc deficiency and drought stress in durum wheat. J. Plant Nutr. Soil Sci. 2018, 181, 388–395. [Google Scholar] [CrossRef]
  10. Dubey, R.K.; Tripathi, V.; Prabha, R.; Chaurasia, R.; Singh, D.P.; Rao, C.S.; El-Keblawy, A.; Abhilash, P.C. Belowground Microbial Communities: Key Players for Soil and Environmental Sustainability. In Unravelling the Soil Microbiome. Springer Briefs in Environmental Science; Springer: Cham, Switzerland, 2020; Volume 2, pp. 5–22. [Google Scholar] [CrossRef]
  11. Schloter, M.; Nannipieri, P.; Sørensen, S.J.; van Elsas, J.D. Microbial indicators for soil quality. Biol. Fertil. Soils 2018, 54, 1–10. [Google Scholar] [CrossRef] [Green Version]
  12. Lau, J.A.; Lennon, J.T. Rapid responses of soil microorganisms improve plant fitness in novel environments. Proc. Natl. Acad. Sci. USA 2012, 109, 14058–14062. [Google Scholar] [CrossRef] [Green Version]
  13. Walker, T.S. Root Exudation and Rhizosphere Biology. Plant Physiol. 2003, 132, 44–51. [Google Scholar] [CrossRef] [PubMed] [Green Version]
  14. Wu, B.; Wang, Z.; Zhao, Y.; Gu, Y.; Wang, Y.; Yu, J.; Xu, H. The performance of biochar-microbe multiple biochemical material on bioremediation and soil micro-ecology in the cadmium aged soil. Sci. Total Environ. 2019, 686, 719–728. [Google Scholar] [CrossRef] [PubMed]
  15. Hammerbacher, A.; Coutinho, T.A.; Gershenzon, J. Roles of plant volatiles in defence against microbial pathogens and microbial exploitation of volatiles. Plant Cell Environ. 2019, 1–17. [Google Scholar] [CrossRef] [PubMed] [Green Version]
  16. Van de Wouw, A.P.; Idnurm, A. Biotechnological potential of engineering pathogen effector proteins for use in plant disease management. Biotechnol. Adv. 2019, 37, 107387. [Google Scholar] [CrossRef] [PubMed]
  17. Ponge, J.F. Humus forms in terrestrial ecosystems: A framework to biodiversity. Soil Biol. Biochem. 2003, 35, 935–945. [Google Scholar] [CrossRef] [Green Version]
  18. Ponge, J.F. Plant–soil feedbacks mediated by humus forms: A review. Soil Biol. Biochem. 2013, 57, 1048–1060. [Google Scholar] [CrossRef] [Green Version]
  19. Rousk, J.E.; Bääth, P.C.; Brookes, C.L.; Lauber, C.; Lozupone, J.G.; Caporaso, R.; Knight, R.; Fierer, N. Soil bacterial and fungal communities across a pH gradient in an arable soil. ISME J. 2010, 4, 10, 1340–1351. [Google Scholar] [CrossRef]
  20. Rillig, M.; Muller, L.; Lehmann, A. Soil aggregates as massively concurrent evolutionary incubators. ISME J. 2017, 11, 1943–1948. [Google Scholar] [CrossRef]
  21. Shi, Y.; Li, Y.T.; Xiang, X.J.; Sun, R.B.; Yang, T.; He, D.; Zhang, K.P.; Ni, Y.Y.; Zhu, Y.G.; Adams, J.M.; et al. Spatial scale affects the relative role of stochasticity versus determinism in soil bacterial communities in wheat fields across the North China Plain. Microbiome 2018, 6, 27. [Google Scholar] [CrossRef]
  22. Shi, Y.; Li, Y.; Yuan, M.; Adams, J.M.; Pan, X.; Yang, Y.; Chu, H. A biogeographic map of soil bacterial communities in wheats field of the North China Plain. Soil Ecol. Lett. 2019, 1, 50–58. [Google Scholar] [CrossRef] [Green Version]
  23. Barrios, E. Soil biota, ecosystem services and land productivity. Ecol. Econom. 2007, 64, 269–285. [Google Scholar] [CrossRef]
  24. Nannipieri, P.; Ascher, J.; Ceccherini, M.T.; Landi, L.; Pietramellara, G.; Renella, G. Microbial diversity and soil functions. Eur. J. Soil Sci. 2017, 68, 12–26. [Google Scholar] [CrossRef]
  25. Borowik, A.; Wyszkowska, J. Soil moisture as a factor affecting the microbiological and biochemical activity of soil. Plant Soil Environ. 2016, 62, 250–255. [Google Scholar] [CrossRef]
  26. Borowik, A.; Wyszkowska, J. Impact of temperature on the biological properties of soil. Int. Agrophys. 2016, 30, 1–8. [Google Scholar] [CrossRef]
  27. Nannipieri, P.; Trasar-Cepeda, C.; Dick, R.P. Soil enzyme activity: A brief history and biochemistry as a basis for appropriate interpretations and meta-analysis. Biol. Fertil. Soils 2017, 54, 11–19. [Google Scholar] [CrossRef]
  28. VCU 2019, Value for Cultivation and Use (VCU) BSPB Plant Breeding Matters. Available online: http://plantbreedingmatters.com/evaluation.php (accessed on 3 February 2020).
  29. Raman, J.K.; Alves, C.M.; Gnansounou, E. A review on moringa tree and vetiver grass—Potential biorefinery feedstocks. Bioresour. Technol. 2018, 249, 1044–1051. [Google Scholar] [CrossRef]
  30. Peeters, A. Importance, evolution, environmental impact and future challenges of grasslands and grassland-based systems in Europe. Grassl. Sci. 2009, 55, 113–125. [Google Scholar] [CrossRef]
  31. EEA (European Environment Agency). 2019. Available online: https://www.eea.europa.eu/data-and-maps/indicators/progress-in-management-of-contaminated-sites-3 (accessed on 20 February 2020).
  32. European Commission. 2019. Available online: www.ec.europa.eu/environment/soil/index_en.htm (accessed on 20 February 2020).
  33. Zhang, X.; Xu, S.; Li, C.; Zhao, L.; Feng, H.; Yue, G.; Ren, Z.; Cheng, G. The soil carbon/nitrogen ratio and moisture affect microbial community structures in alkaline permafrost-affected soils with different vegetation types on the Tibetan plateau. Res. Microbiol. 2014, 165, 128–139. [Google Scholar] [CrossRef]
  34. Borowik, A.; Wyszkowska, J. Bioaugmentation of soil contaminated with diesel oil. J. Elem. 2018, 23, 1161–1178. [Google Scholar] [CrossRef]
  35. Chikere, C.B.; Okpokwasili, G.C.; Chikere, B.O. Monitoring of microbial hydrocarbon remediation in the soil. 3 Biotech. 2011, 1, 3. [Google Scholar] [CrossRef] [Green Version]
  36. Lipińska, A.; Wyszkowska, J.; Kucharski, J. Diversity of organotrophic bacteria, activity of dehydrogenases and urease as well as seed germination and root growth Lepidium sativum, Sorghum saccharatum and Sinapis alba under the influence of polycyclic aromatic hydrocarbons. Environ. Sci. Pollut. Res. Int. 2015, 22, 18519–18530. [Google Scholar] [CrossRef] [PubMed] [Green Version]
  37. Telesiński, A.; Krzyśko-Łupicka, T.; Cybulska, K.; Wróbel, J. Response of soil phosphatase activities to contamination with two types of tar oil. Environ. Sci. Pollut. Res. 2018, 25, 28642–28653. [Google Scholar] [CrossRef] [PubMed]
  38. Xu, X.; Liu, W.; Tian, S.; Wang, W.; Qi, Q.; Jiang, P.; Gao, X.; Li, F.; Yu, H. Petroleum hydrocarbon-degrading bacteria for the remediation of oil pollution under aerobic conditions: A perspective analysis. Front. Microbiol. 2018, 9, 2885. [Google Scholar] [CrossRef] [PubMed]
  39. Zaborowska, M.; Kucharski, J.; Wyszkowska, J. Biochemical and microbiological activity of soil contaminated with o-cresol and biostimulated with Perna canaliculus mussel meal. Environ. Monit Assess. 2018, 190, 602. [Google Scholar] [CrossRef] [PubMed] [Green Version]
  40. Kucharski, J.; Wieczorek, K.; Wyszkowska, J. Changes in the enzymatic activity in sandy loam soil exposed to zinc pressure. J. Elem. 2011, 16, 577–589. [Google Scholar] [CrossRef]
  41. Wyszkowska, J.; Boros-Lajszner, E.; Borowik, A.; Baćmaga, M.; Kucharski, J.; Tomkiel, M. Implication of zinc excess on soil health. J. Environ. Sci. Health B 2016, 51, 261–270. [Google Scholar] [CrossRef]
  42. Zaborowska, M.; Kucharski, J.; Wyszkowska, J. Biological activity of soil contaminated with cobalt, tin and molybdenum. Environ. Monit. Assess. 2016, 188, 398. [Google Scholar] [CrossRef] [Green Version]
  43. Huang, Y.; Xiao, L.; Li, F.; Xiao, M.; Lin, D.; Long, X.; Wu, Z. Microbial degradation of pesticide residues and an emphasis on the degradation of cypermethrin and 3-phenoxy benzoic acid: A review. Molecules 2018, 23, 2313. [Google Scholar] [CrossRef] [Green Version]
  44. Niewiadomska, A.; Sulewska, H.; Wolna-Maruwka, A.; Waraczewska, Z.; Budka, A.; Ratajczak, K. An assessment of the influence of selected herbicides on the microbial parameters of soil in maize (Zea mays) cultivation. Appl. Ecol. Env. Res. 2018, 16, 4735–4752. [Google Scholar] [CrossRef]
  45. Tomkiel, M.; Baćmaga, M.; Borowik, A.; Kucharski, J.; Wyszkowska, J. Effect of a mixture of flufenacet and isoxaflutole on population numbers of soil-dwelling microorganisms, enzymatic activity of soil, and maize yield. J. Environ. Sci. Health B 2019, 1, 11. [Google Scholar] [CrossRef]
  46. Borowik, A.; Wyszkowska, J. Response of Avena sativa L. and the soil microbiota to the contamination of soil with shell diesel oil. Plant Soil Environ. 2018, 64, 102–107. [Google Scholar] [CrossRef] [Green Version]
  47. Zhou, Y.; Qin, Y.; Liu, X.; Feng, Z.; Zhu, H.; Yao, Q. Soil bacterial function associated with stylo (Legume) and bahiagrass (grass) is affected more strongly by soil chemical property than by bacterial community composition. Front. Microbiol. 2019, 10, 798. [Google Scholar] [CrossRef] [PubMed] [Green Version]
  48. Borowik, A.; Wyszkowska, J.; Oszust, K. Functional diversity of fungal communities in soil contaminated with diesel oil. Front. Microbiol. 2017, 8, 1862. [Google Scholar] [CrossRef]
  49. Tshikantwa, T.S.; Ullah, M.W.; He, F.; Yang, G. Current trends and potential applications of microbial interactions for human welfare. Front. Microbiol. 2018, 9, 1156. [Google Scholar] [CrossRef] [PubMed] [Green Version]
  50. Bell, C.W.; Fricks, B.E.; Rocca, J.D.; Steinweg, J.M.; McMahon, S.K.; Wallenstein, M.D. High-throughput fluorometric measurement of potential soil extracellular enzyme activities. J. Vis. Exp. 2013, e50961. [Google Scholar] [CrossRef] [PubMed]
  51. Moeskops, B.; Buchan, D.; Sleutel, S.; Herawaty, L.; Husen, E.; Saraswati, R.; Setyorini, D.; De Neve, S. Soil microbial communities and activities under intensive organicand conventional vegetable farming in west java, Indonesia. Appl. Soil Ecol. 2010, 45, 112–120. [Google Scholar] [CrossRef]
  52. Zhan, X.; Wu, W.; Zhou, L.; Liang, J.; Jiang, T. Interactive effect of dissolved organic matter and phenanthrene on soil enzymatic activities. J. Environ. Sci. 2010, 22, 607–614. [Google Scholar] [CrossRef]
  53. Knight, T.R.; Dick, R.P. Differentiating microbial and stabilized β-glucosidase activity relative to soil quality. Soil Biol. Biochem. 2004, 36, 2089–2096. [Google Scholar] [CrossRef]
  54. Wyszkowska, J.; Wyszkowski, M. Activity of soil dehydrogenases, urease and acid and alkaline phosphatase in soil polluted with petroleum. J. Toxicol. Environ. Health Part A 2010, 73, 1202–1210. [Google Scholar] [CrossRef]
  55. Vong, P.C.; Piutti, S.; Slezack-Deschaumes, S.; Beniziri, E.; Guckert, A. Sulphur immobilization and arylsulphatase activity in two calcareous arable and fallow soils as affected by glucose additions. Geoderma 2008, 148, 79–84. [Google Scholar] [CrossRef]
  56. World Reference Base for Soil Resources. International Soil Classification System for Naming Soils and Creating Legends for Soil Maps; World Soil Resources Reports No. 106; FAO: Rome, Italy, 2014. [Google Scholar]
  57. Borowik, A.; Wyszkowska, J.; Wyszkowski, M. Resistance of aerobic microorganisms and soil enzyme response to soil contamination with Ekodiesel Ultra fuel. Environ. Sci. Pollut. Res. 2017, 24, 24346–24363. [Google Scholar] [CrossRef] [Green Version]
  58. Wyszkowska, J.; Borowik, A.; Olszewski, J.; Kucharski, J. Soil bacterial community and soil enzyme activity depending on the cultivation of Triticum aestivum, Brassica napus, and Pisum sativum ssp. arvense. Diversity 2019, 11, 246. [Google Scholar] [CrossRef] [Green Version]
  59. Bunt, J.S.; Rovira, A.D. Microbiological studies of some subantarctic soils. J. Soil Sci. 1955, 6, 119–128. [Google Scholar] [CrossRef]
  60. Parkinson, D.; Gray, F.R.G.; Williams, S.T. Methods for Studying the Ecology of Soil Microorganism; IBP Handbook 19; Blackwell Scientific Publication: Oxford, UK, 1971. [Google Scholar]
  61. De Leij, F.A.A.M.; Whipps, J.M.; Lynch, J.M. The use of colony development for the charactization of bacterial communities in soil and on roots. Microb. Ecol. 1994, 27, 81–97. [Google Scholar] [CrossRef] [PubMed]
  62. Öhlinger, R. Dehydrogenase Activity with the Substrate TTC. In Methods in Soil Biology; Schinner, F., Ohlinger, R., Kandler, E., Margesin, R., Eds.; Springer: Berlin, Germany, 1996; pp. 241–243. [Google Scholar]
  63. Johnson, J.I.; Temple, K.L. Some variables affecting the measurement of catalase activity in soil. Soil Sci. Soc. Am. J. 1964, 28, 207–216. [Google Scholar] [CrossRef]
  64. Alef, K.; Nannipieri, P. Methods in Applied Soil Microbiology and Biochemistry; Alef, K., Nannipieri, P., Eds.; Academic London: London, UK, 1988; pp. 316–365. [Google Scholar]
  65. De Santis, T.Z.; Hugenholtz, P.; Larsen, N.; Rojas, M.; Brodie, E.L.; Keller, K.; Huber, T.; Dalevi, D.; Hu, P.; Andersen, G.L. Greengenes, a chimera-checked 16S rRNA gene database and workbench compatible with ARB. Appl. Environ. Microbiol. 2006, 72, 5069–5072. [Google Scholar] [CrossRef] [Green Version]
  66. Dell Inc. Dell Statistica (Data Analysis Software System), Version 13.1; Dell Inc.: Tulsa, OK, USA, 2016. [Google Scholar]
  67. Parks, D.H.; Tyson, G.W.; Hugenholtz, P.; Beiko, R.G. STAMP: Statistical analysis of taxonomic and functional profiles. Bioinformatics 2014, 30, 3123–3124. [Google Scholar] [CrossRef] [Green Version]
  68. Krzywinski, M.I.; Schein, J.E.; Birol, I.; Connors, J.; Gascoyne, R.; Horsman, D.; Jones, S.J.; Marra, M.A. Circos: An information aesthetic for comparative genomics. Genome Res. 2009, 19, 1639–1645. [Google Scholar] [CrossRef] [Green Version]
  69. Broadbent, A.A.D.; Stevens, C.J.; Ostle, N.J.; Orwin, K.H. Biogeographic differences in soil biota promote invasive grass response to nutrient addition relative to co-occurring species despite lack of belowground enemy release. Oecologia 2018, 186, 611–620. [Google Scholar] [CrossRef] [Green Version]
  70. Shukla, P.; Chaurasia, P.; Younis, K.; Qadri, O.S.; Faridi, S.A.; Srivastava, G. Nanotechnology in sustainable agriculture: Studies from seed priming to post-harvest management. Nanotechnol. Environ. Eng. 2019, 4, 1. [Google Scholar] [CrossRef]
  71. Deru, J.; Schilder, H.; Van der Schoot, J.R.; Van Eekeren, N. No Trade-off between Root Biomass and Aboveground Production in Lolium perenne. In Breeding in a World of Scarcity; Roldán-Ruiz, I., Baert, J., Reheul, D., Eds.; Springer: Cham, Switzerland, 2016; Volume 43, pp. 289–292. [Google Scholar] [CrossRef]
  72. Raaijmakers, J.M.; Paulitz, C.T.; Steinberg, C.; Alabouvette, C.; Moenne-Loccoz, Y. The rhizosphere: A playground and battlefield for soilborne pathogens and beneficial microorganisms. Plant Soil 2009, 321, 341–361. [Google Scholar] [CrossRef] [Green Version]
  73. Saleh, D.; Jarry, J.; Rani, M.; Aliferis, K.; Seguin, P.; Jabaji, S.H. Diversity, distribution and multi-functional attributes of bacterial communities associated with the rhizosphere and endosphere of timothy (Phleum pratense L.). J. Appl. Microbiol. 2019, 127, 794–811. [Google Scholar] [CrossRef] [PubMed]
  74. Berg, G.; Smalla, K. Plant species and soil type cooperatively shape the structure and function of microbial communities in the rhizosphere. FEMS Microbiol. Ecol. 2009, 68, 1–13. [Google Scholar] [CrossRef] [PubMed] [Green Version]
  75. Murphy, C.A.; Foster, B.L.; Gao, C. temporal dynamics in rhizosphere bacterial communities of three perennial grassland species. Agronomy 2016, 6, 17. [Google Scholar] [CrossRef] [Green Version]
  76. Singh, B.K.; Munro, S.; Potts, J.M.; Millard, P. Influence of grass species and soil type on rhizosphere microbial structure in grassland soils. Appl. Soil Ecol. 2007, 36, 147–155. [Google Scholar] [CrossRef]
  77. Chen, K.; Chang, Y.; Chiou, W. Remediation of diesel-contaminated soil using in situ chemical oxidation (ISCO) and the effects of common oxidants on the indigenous microbial community: A comparison study. J. Chem. Technol. Biotechnol. 2016, 91, 1877–1888. [Google Scholar] [CrossRef]
  78. Marschner, P.; Neumann, G.; Kania, A.; Weiskopf, L.; Lieberei, R. Spatial and temporal dynamics of the microbial community structure in the rhizosphere of cluster roots of white lupin (Lupinus albus L.). Plant Soil 2002, 246, 167–174. [Google Scholar] [CrossRef]
  79. Kielak, A.; Pijl, A.S.; van Veen, J.A.; Kowalchuk, G.A. Differences in vegetation composition and plant species identity lead to only minor changes in soil-borne microbial communities in a former arable field. FEMS Microbiol. Ecol. 2008, 63, 372–382. [Google Scholar] [CrossRef] [Green Version]
  80. Delgado-Baquerizo, M.; Oliverio, A.M.; Brewer, T.E.; Benavent-González, A.; Eldridge, D.J.; Bardgett, R.D.; Maestre, F.T.; Singh, B.K.; Fierer, N. A global atlas of the dominant bacteria found in soil. Science 2018, 359, 320–325. [Google Scholar] [CrossRef] [Green Version]
  81. Ghuneim, L.-A.J.; Jones, D.L.; Golyshin, P.N.; Golyshina, O.V. Nano-sized and filterable bacteria and archaea: Biodiversity and function. Front. Microbiol. 2018, 9, 1971. [Google Scholar] [CrossRef] [Green Version]
  82. Chu, H.; Sun, H.; Tripathi, B.M.; Adams, J.M.; Huang, R.; Zhang, Y.; Shi, Y. Bacterial community dissimilarity between the surface and subsurface soils equals horizontal differences over several kilometers in the western Tibetan Plateau. Environ. Microbiol. 2016, 18, 1523–1533. [Google Scholar] [CrossRef] [PubMed]
  83. Hamedi, J.; Mohammadipanah, F. Biotechnological application and taxonomical distribution of plant growth promoting actinobacteria. J. Ind. Microbiol. Biotechnol. 2015, 42, 157–171. [Google Scholar] [CrossRef] [PubMed]
  84. Alkorta, I.; Aizpurua, A.; Riga, P.; Albizu, I.; Amézaga, I.; Garbisu, C. Soil enzyme activities as biological indicators of soil health. Rev. Environ. Health 2003, 18, 1. [Google Scholar] [CrossRef] [PubMed]
  85. Das, N.; Chandran, P. Microbial degradation of petroleum hydrocarbon contaminants: An overview. Biotechnol. Res. Int. 2011, 2011, 941810. [Google Scholar] [CrossRef] [Green Version]
  86. Borowik, A.; Wyszkowska, J.; Kucharski, M.; Kucharski, J. Implications of soil pollution with diesel oil and BP petroleum with ACTIVE Technology for soil health. Int. J. Environ. Res. Public Health 2019, 16, 2474. [Google Scholar] [CrossRef] [PubMed] [Green Version]
  87. Caldwell, B.A. Enzyme activities as a component of soil biodiversity: A review. Pedobiologia 2005, 49, 637–644. [Google Scholar] [CrossRef]
  88. Niewiadomska, A.; Sulewska, H.; Wolna-Maruwka, A.; Ratajczak, K.; Waraczewska, Z.; Budka, A.; Głuchowska, K. The influence of biostimulants and foliar fertilisers on the process of biological nitrogen fixation and the level of soil biochemical activity in soybean (Glycine Maxl.) cultivation. Appl. Ecol. Environ. Res. 2019, 17, 12649–12666. [Google Scholar] [CrossRef]
  89. Oleszczuk, P.; Jośko, I.; Futa, B.; Pasieczna-Patkowska, S.; Pałys, E.; Kraska, P. Effect of pesticides on microorganisms, enzymatic activity and plant in biochar-amended soil. Geoderma 2014, 214—215, 10–18. [Google Scholar] [CrossRef]
  90. Zhao, F.Z.; Ren, C.J.; Han, X.H.; Yang, G.H.; Wang, J.; Doughty, R. Changes of soil microbial and enzyme activities are linked to soil C, N and P stoichiometry in afforested ecosystems. For. Ecol. Manag. 2018, 427, 289–295. [Google Scholar] [CrossRef]
  91. Wang, X.; Song, D.; Liang, G.; Zhang, Q.; Ai, C.; Zhou, W. Maize biochar addition rate influences soil enzyme activity and microbial community composition in a fluvo-aquic soil. Appl. Soil Ecol. 2015, 96, 265–272. [Google Scholar] [CrossRef]
  92. Li, J.; Zhou, X.; Yan, J.; Li, H.; He, J. Effects of regenerating vegetation on soil enzyme activity and microbial structure in reclaimed soils on a surface coal mine site. Appl. Soil Ecol. 2015, 87, 56–62. [Google Scholar] [CrossRef]
  93. Raiesi, F.; Beheshti, A. Microbiological indicators of soil quality and degradation following conversion of native forests to continuous croplands. Ecol. Indic. 2015, 50, 173–185. [Google Scholar] [CrossRef]
  94. García-Gaytán, V.; Hernández-Mendoza, F.; Coria-Téllez, A.; García-Morales, S.; Sánchez-Rodríguez, E.; Rojas-Abarca, L.; Daneshvar, H. Fertigation: Nutrition, Stimulation and Bioprotection of the Root in High Performance. Plants 2018, 7, 88. [Google Scholar] [CrossRef] [PubMed] [Green Version]
Figure 1. The yield of grasses in g dry matter (d.m.) per pot. T1—fodder grasses; T2—lawn grasses; homogeneous groups denoted with letters (a–d) were calculated separately for every cutting; Lh—Lolium x hybridum Hausskn; Fa—Festuca arundinacea; Pp—Phleum pratense, Lp—Lolium perenne, Pr—Poa pratensis; Fr—Festuca rubra.
Diversity 12 00212 g001
Figure 2. Count of soil organotrophic bacteria (Org) and actinobacteria (Act), cfu 109 kg−1 d.m. of soil: (A) depending on the species of grass, (B) depending on grass type (fodder or lawn). Homogeneous groups denoted were calculated separately for each microorganisms, groups denoted with letters (a–d) were calculated for the species of grass and groups denoted with letters (x–y) were calculated for the type of grass. C—unsown soil; Lh—Lolium x hybridum Hausskn; Fa—Festuca arundinacea; Pp—Phleum pratense, Lp—Lolium perenne, Pr—Poa pratensis; Fr—Festuca rubra.
Diversity 12 00212 g002
Figure 3. Ecophysiological diversity index (EP) of organotrophic bacteria (Org) and actinobacteria (Act): (A) depending on the species of grass, (B) depending on grass type (fodder or lawn). Homogeneous groups denoted were calculated separately for each microorganisms, groups denoted with letters (a–c) were calculated for the species of grass and groups denoted with letters (x) were calculated for the type of grass. C—unsown soil; Lh—Lolium x hybridum Hausskn; Fa—Festuca arundinacea; Pp—Phleum pratense, Lp—Lolium perenne, Pr—Poa pratensis; Fr—Festuca rubra.
Diversity 12 00212 g003
Figure 4. Colony development index (CD) of organotrophic bacteria (Org) and actinobacteria (Act): (A) depending on the species of grass, (B) depending on grass type (fodder or lawn). Homogeneous groups denoted were calculated separately for each microorganisms, groups denoted with letters (a–d) were calculated for the species of grass and groups denoted with letters (x–y) were calculated for the type of grass. C—unsown soil; Lh—Lolium x hybridum Hausskn; Fa—Festuca arundinacea; Pp—Phleum pratense, Lp—Lolium perenne, Pr—Poa pratensis; Fr—Festuca rubra.
Diversity 12 00212 g004
Figure 5. Bacterial communities at the phylum level (A) depending on the species of grass, (B) depending on grass type (fodder or lawn). Abundances <1% are gathered into the category “other”. C—unsown soil; T1—average bacteria abundance in soils sown with fodder grasses; T2—average bacteria abundance in soils sown with lawn grasses. Lh—Lolium x hybridum Hausskn; Fa—Festuca arundinacea; Pp—Phleum pratense, Lp—Lolium perenne, Pr—Poa pratensis; Fr—Festuca rubra.
Diversity 12 00212 g005
Figure 6. Bacterial communities at the class level (A) depending on the species of grass, (B) depending on grass type (fodder or lawn). Abundances <1% are gathered into the category “other”. C—unsown soil; T1—average bacteria abundance in soils sown with fodder grasses; T2—average bacteria abundance in soils sown with lawn grasses. Lh—Lolium x hybridum Hausskn; Fa—Festuca arundinacea; Pp—Phleum pratense, Lp—Lolium perenne, Pr—Poa pratensis; Fr—Festuca rubra.
Diversity 12 00212 g006
Figure 7. Bacterial communities at the order level (A) depending on the species of grass, (B) depending on grass type (fodder or lawn). Abundances <1% are gathered into the category “other”. C—unsown soil; T1—average bacteria abundance in soils sown with fodder grasses; T2—average bacteria abundance in soils sown with lawn grasses. Lh—Lolium x hybridum Hausskn; Fa—Festuca arundinacea; Pp—Phleum pratense, Lp—Lolium perenne, Pr—Poa pratensis; Fr—Festuca rubra.
Diversity 12 00212 g007
Figure 8. Bacterial communities at the family level (A) depending on the species of grass, (B) depending on grass type (fodder or lawn). Abundances <1% are gathered into the category “other”. C—unsown soil; T1—average bacteria abundance in soils sown with fodder grasses; T2—average bacteria abundance in soils sown with lawn grasses. Lh—Lolium x hybridum Hausskn; Fa—Festuca arundinacea; Pp—Phleum pratense, Lp—Lolium perenne, Pr—Poa pratensis; Fr—Festuca rubra.
Diversity 12 00212 g008
Figure 9. The operational taxonomic units (OTUs) structure of identified genus of bacteria in the total number of OTUs. C—unsown soil; T1—fodder grasses; T2—lawn grasses. Lh—Lolium x hybridum Hausskn; Fa—Festuca arundinacea; Pp—Phleum pratense, Lp—Lolium perenne, Pr—Poa pratensis; Fr—Festuca rubra.
Diversity 12 00212 g009
Figure 10. Activity of soil enzymes presented with the principal component analysis (PCA) method. Deh—dehydrogenases; Cat—catalase, Ure—urease; Pac—acid phosphatase; Pal—alkaline phosphatase; Glu—β-glucosidase; Aryl—arylsulfatase. C—unsown soil; Lh—Lolium x hybridum Hausskn; Fa—Festuca arundinacea; Pp—Phleum pratense, Lp—Lolium perenne, Pr—Poa pratensis; Fr—Festuca rubra.
Diversity 12 00212 g010
Table 1. Physicochemical and chemical soil properties.
pHKClHACEBCCECBS %ContentAvailable FormsInterchangeable Forms
mmol (+) kg−1 d.m. of Soil NtotalCtotalPKMgKCaNaMg
g kg−1 d.m. of Soilmg kg−1 d.m. of Soil
6.7011.4049.0060.4081.100.629.3093.68141.1042.00156.00623.5040.0059.50
HAC—hydrolytic activity, EBC—exchangeable base cations, CEC—cation exchange capacity, BS—base saturation, d.m.—dry matter.
Table 2. Characteristics of grasses used in the study.
Grasses KindCommon NameBotanical NameAbbreviationVarietyPhotosynthesis Kind
FodderHybrid ryegrassLolium x hybridum HaussknLhGalaC3
Tall fescueFestuca arundinaceaFaRahelaC3
TimothyPhleum pratensePpKabaC3
LawnPerennial ryegrassLolium perenneLpBajkaC3
Smooth-stalked meadowgrassPoa pratensisPrSójkaC3
Red rescueFestuca rubraFrDarkC3
Table 3. Parameters for determining the number of organotrophic bacteria and actinobacteria, calculating colony development index and ecophysiological diversity index, and determining enzyme activity.
Tested FeatureMedium/Formula/SubstratReferences
Medium
Organotrophic bacteria (Org)peptone 1.0 g, yeast extract 1.0 g, (NH4)2SO4 0.5 g, CaCl2, K2HPO4 0.4 g, MgCl2 0,2 g, MgSO4 7H2O 0.5 g, salt Mo 0.03 g, FeCl2 0.01 g, agar 20.0 g, soil extract 250 cm3, distilled water 750 cm3, pH 6.6–7.0[59]
[58]
Actinobacteria (Act)soluble starch 10.0 g; casein 0.3 g; KNO3 2.0 g; NaCl 2.0 g; K2HPO4 2.0 g; MgSO4⋅7H2O 0.05 g; CaCO3 0.02 g; FeSO4 0.01 g; agar 20.0 g; H2O 1 dm3; 50 cm3 aqueous solution of nystatin 0.05%; 50 cm3 aqueous solution of actidione 0.05%; pH 7.0[60]
[58]
Formula
Colony development index (CD)CD = [N1/1 + N2/2 + N3/3 +…+ N10/10] × 100, where: N1, N2, N3,..., N10—the sum of ratios of the number of colonies of microorganisms identified in particular days (1, 2, 3,..., 10) to the total number of colonies identified throughout the study period[61]
Ecophysiological diversity index (EP)EP = −Σ(pi·log10 pi), where: pi—the ratio of the number of colonies of microorganisms identified in particular days to the total number of colonies identified throughout the study period.
Substrat
Dehydrogenases (Deh)C19H15ClN4[62]
Catalase (Cat)H2O2[63]
Urease (Ure)CON2H4[64]
β-glucosidase (Glu)C12H15NO8
Acid phosphatase (Pac)O2NC6H4OP(O)(ONa)2 6H2O
Alkaline phosphatase (Pal)
Aryosulphatase (Aryl)NO2C6H4OSO2OK
Table 4. Shannon and Simpson indices calculated from abundance of OTU.
TaxonCLhFaPpLpPrFrCT1T2
Shannon-Wiener index
phylum2.05 ab1.86 d1.92 cd2.10 ab1.90 d2.12 a2.01 ac2.05 x1.96 x2.01 x
class2.81 bc2.67 c2.80 bc2.97 a2.82 abc2.96 ab2.90 ab2.81 x2.81 x2.89 x
order2.77 b2.75 b2.90 a2.91 a2.81 ab2.79 ab2.93 a2.77 x2.86 x2.84 x
family2.00 d2.49 a2.43 ab2.23 c2.34 bc2.04 d2.26 c2.00 z2.38 x2.21 y
genus0.76 c0.97 a0.86 b0.87 b0.87 b0.74 c0.78 c0.76 z0.90 x0.80 y
Simpson index
phylum0.84 ab0.78 c0.78 c0.83 ab0.80 b0.85 a0.82 ab0.84 x0.80 x0.82 x
class0.92 ab0.89 b0.92 ab0.93 a0.92 ab0.94 a0.93 a0.92 x0.91 x0.93 x
order0.94 ab0.91 b0.94 ab0.96 a0.92 b0.95 a0.95 a0.94 x0.94 x0.94 x
family0.67 ef0.82 a0.78 ab0.70 de0.75 bc0.66 f0.72 cd0.67 y0.77 x0.71 y
genus0.28 cd0.36 a0.32 b0.30 c0.31 b0.26 d0.28 cd0.28 y0.33 x0.28 y
Homogeneous groups denoted were calculated separately for each taxon groups denoted with letters (a–f) were calculated for the species of grass and groups denoted with letters (x–z) were calculated for the type of grass. C—unsown soil; Lh—Lolium x hybridum Hausskn; Fa—Festuca arundinacea; Pp—Phleum pratense; Lp—Lolium perenne, Pr—Poa pratensis; Fr—Festuca rubra.
Table 5. Enzymatic activity in 1 kg d.m. of soil per 1 h.
Grass SpeciesDeh
μmol TFF
Cat
mol O2
Ure
mmol N-NH4
PacPalGluAryl
mmol PNP
C1.38 e0.09 e0.30 b0.79 d0.16 c0.30 b0.08 d
Lh10.29 a0.18 b0.47 ab1.20 ab0.40 a0.35 a0.15 a
Fa2.38 d0.14 c0.60 ab1.18 ab0.32 b0.30 b0.14 ab
Pp3.25 c0.19 ab0.88 a1.08 bc0.33 b0.31 b0.16 a
Lp6.87 b0.15 c0.68 ab1.30 a0.35 ab0.34 a0.11 bc
Pr0.65 f0.21 a0.48 ab0.98 c0.17 c0.30 b0.09 cd
Fr1.74 de0.11 d0.63 ab1.27 a0.14 c0.31 b0.11 cd
C1.38 z0.09 z0.30 y0.79 y0.16 z0.30 y0.08 y
T15.31 x0.17 x0.65 x1.15 x0.35 x0.32 x0.15 x
T23.09 y0.16 y0.60 x1.18 x0.22 y0.32 x0.10 y
Homogeneous groups were calculated separately for each enzyme groups denoted with letters (a–f) were calculated for the species of grass and groups denoted with letters (x–z) were calculated for the type of grass. C—unsown soil; Lh—Lolium x hybridum Hausskn; Fa—Festuca arundinacea; Pp—Phleum pratense, Lp—Lolium perenne, Pr—Poa pratensis; Fr—Festuca rubra.