Article

Bat Ensembles Differ in Response to Use Zones in a Tropical Biosphere Reserve

1
Durrell Institute of Conservation and Ecology, University of Kent, Canterbury CT2 7NZ, UK
2
Department of Biological Sciences, Texas Tech University, Lubbock, TX 79409, USA
3
Southeast Asian Bat Conservation Research Unit, Lubbock, TX 79409, USA
4
Institute of Borneo Studies, University College Sabah Foundation, Sembulan, 88100 Kota Kinabalu, Malaysia
5
Department of Biology, University of Missouri, St. Louis, MO 63121, USA
6
Institute for Tropical Biology and Conservation, Universiti Malaysia Sabah, Jalan UMS, 88400 Kota Kinabalu, Malaysia
7
Biotechnology Research Institute, Universiti Malaysia Sabah, Jalan UMS, 88400 Kota Kinabalu, Malaysia
*
Author to whom correspondence should be addressed.
These authors contributed equally to the work.
Diversity 2020, 12(2), 60; https://doi.org/10.3390/d12020060
Submission received: 27 December 2019 / Revised: 30 January 2020 / Accepted: 31 January 2020 / Published: 4 February 2020
(This article belongs to the Special Issue Land-Use Change Impacts on Tropical Vertebrates)

Abstract

:
Biosphere reserves, designated under The United Nations Education, Scientific and Cultural Organization’s (UNESCO) Man and Biosphere Programme, aim to sustainably integrate protected areas into the biological and economic landscape around them by buffering strictly protected habitats with zones of limited use. However, the effectiveness of biosphere reserves and the contribution of the different zones of use to protection is poorly known. We assessed the diversity and activity of bats in the Crocker Range Biosphere Reserve (CRBR) in Sabah, Malaysia, using harp traps, mist nets and acoustic surveys in each zone—core, buffer, transition and in agricultural plots outside of the reserve. We captured 30 species, bringing the known bat fauna of CRBR to 50 species, half of Borneo’s bat species. Species composition and acoustic activity varied among zones and by foraging ensemble, with the core and buffer showing particular importance for conserving forest-dependent insectivorous bats. Frugivorous bats were found in all zones but were the most abundant and most species-rich ensemble within agricultural sites. Although sampling was limited, bat diversity and activity was low in the transition zone compared to other zones, indicating potential for management practices that increase food availability and enhance biodiversity value. We conclude that, collectively, the zones of the CRBR effectively protect diversity, but the value of the transition zone can be improved.

1. Introduction

Tropical forests represent ~10% of total land cover yet support approximately two-thirds of global terrestrial diversity [1,2]. Tragically, this diversity is under threat from the conversion of forests to agriculture and pasture, which remains the dominant driver of land-use change in the tropics today [3]. This has instigated an increase in the extent and quantity of protected areas in the tropics to conserve remaining biodiversity [4,5]. However, human activity at the periphery of a protected area can affect its functionality for conserving biodiversity [5]. This is a growing concern for tropical forest protected areas, which are becoming increasingly isolated within agricultural landscapes [6]. Moreover, protected areas themselves are not void of anthropogenic activity as ~70% of protected areas in the tropics are occupied by human communities [7]. For these and additional reasons [8], the success of a protected area is considered dependent on its integration into the wider landscape [9].
Biosphere reserves promote the integration and management of protected areas in a landscape context by buffering strictly protected habitats with zones of limited use. They are designated by The United Nations Education, Scientific and Cultural Organization (UNESCO), as part of the Man and Biosphere (MAB) Programme, launched in 1971 [10]. The programme currently lists 669 reserves, including 701 sites, across 124 countries [11,12]. Biosphere reserves are comprised of three functional zones: the core area(s), the buffer zone, and the transition area, ranging in their accessibility for human land-use [11,13]. The core area is strictly protected, limiting human disturbance to an ecosystem. Its primary function is to conserve biodiversity and protect ecosystem services. Limited low-impact human activities, such as non-destructive research and environmental education, are permitted where they complement conservation goals. The buffer zone surrounds or adjoins the core area, providing an intermediary buffer between the core and transition zone. The buffer permits greater human use, including activities such as environmental education, recreation, ecotourism, and applied research, that are compatible with sound ecological practices. At the landscape level, buffers help maintain connectivity for biodiversity components residing in core areas. The primary function of the transition zone is for sustainable development. Development may include agriculture, settlements, and other developments that improve an area’s resources. Stakeholders in such development should include local communities, non-governmental organisations, and management agencies. Activities in this zone must be socioculturally and ecologically sustainable. The functions of these zones are designed to be complementary with goals to maintain anthropogenic, biological and cultural diversity [11,12]. Currently, the Southeast Asia Biosphere Reserve Network (SeaBRnet) consists of 35 reserves governing < 30 mn hectares [14].
With over 1400 species distributed globally, bats make up the second largest mammalian order and provide key ecosystem services as seed dispersers, pollinators, and as agents of pest suppression [15]. Many economically valued crops, such as durian in Southeast Asia [16] and agave in the Americas [17], are primarily pollinated by bats. Additionally, they can serve as bioindicators of ecosystem health due to their sensitivity to changes in the environment, climate change, water loss, and noise pollution [18]. Unfortunately, bats are proving highly vulnerable to human activities [19,20], with 21% of species assessed as threatened (EX, CR, EN, VU) or nearly so (NT) by the IUCN [21] and, globally, four out of five bat populations are declining [22].
Bat diversity peaks in tropical regions, particularly tropical rainforests [23], but these habitats are rapidly being degraded and converted to other land-uses, with negative consequences for bat populations worldwide [20,24,25]. Southeast Asian tropical forests suffered the highest rates of deforestation amongst all tropical regions during the 1990s [26], and only half of Borneo’s forest cover remains as a result of agriculture, intensive logging, and palm and pulp plantations [27,28,29]. Bats make up 40% of the island’s terrestrial mammal diversity [30], and approximately one-third of the 98 species are dependent on large tracts of unmodified forests [31]. Forest conversion to agriculture in Singapore resulted in bat extinction rates estimated to range from 33–72%, depending on the group, and it is estimated that if current deforestation rates persist across Southeast Asia, as many as 40% of species may be lost from the region by the end of the century [32].
Bats do not respond uniformly to land-use change and their response varies between foraging ensembles and species. Old-World bats can be divided into four broad foraging ensembles. Plant-visiting bats, members of the family Pteropodidae, are primarily frugivorous, with a few species specialized for nectarivory. All of the other eight families found on Borneo are insectivorous and fall in to one of three foraging ensembles, based on where they forage relative to background vegetation: (1) “open space bats” forage in the open spaces above forests or cleared/agricultural land; (2) “edge or gap” bats hunt insects along the edge of vegetation stands or in small clearings within forest or over water; and (3) “forest interior bats” are able to detect and pursue prey within the vegetatively cluttered habitats of the forest [33]. Each ensemble is associated with a combination of wing and echolocation traits that maximize performance in their preferred foraging habitat, but greatly constrain performance in other habitats [33,34,35,36,37], therefore resulting in differences amongst responses to land-use change.
Forest interior bats are proving particularly susceptible to forest loss and degradation [33,38]. Foraging in the vegetatively complex forest interior requires slow, maneuverable flight [37] and clutter-tolerant echolocation, but these adaptations compromise performance in the more open habitats that result from land-use change. Slow flight can be energetically costly, and clutter-tolerant echolocation often has a limited range. Moreover, many species rely on roosts that are only available in numbers able to support populations in relatively unmodified forest (e.g., hollows in large standing or fallen trees). Reduction in native forest cover has particularly impacted bats found in the families Hipposideridae, Rhinolophidae, Megadermatidae, Nycteridae, as well as the Kerivoulinae and Murininae subfamilies of the Vespertilionidae [23,33,39].
Although the MAB Programme has been in operation for nearly 50 years, the effectiveness of biosphere reserves in protecting bat diversity is poorly documented, particularly in the wet tropics where bat diversity is greatest. Studies in tropical dry forests and grasslands of South Africa and Mexico suggest that, although core zones protect more species, buffers support a significant proportion of core diversity [40,41,42,43], but forests in these habitats are less structurally complex and support fewer species than tropical rainforest. Crocker Range Biosphere Reserve (CRBR) was established as a UNESCO site under the MAB Programme in Sabah, Malaysia Borneo in 2014. It consists mainly of hill and lower montane tropical forests, and, as home to approximately 101 mammal, 259 bird, 47 reptile, 63 amphibian, and over 300 plant species, the reserve and its surroundings are considered a refuge for much of Borneo’s biodiversity [13,44,45], including bats. The last inventory of bat diversity in Crocker Range was conducted in 1999 [44,46], prior to the Range’s entry into the MAB Programme. Forty-one species were reported from the survey and the prior literature [46], representing at least 40% of Borneo’s total bat diversity and indicating the importance of CRBR to regional bat conservation.
The goal of this study was to determine the effectiveness of CRBR in protecting bat diversity. Specifically, we evaluated how diversity and activity vary among the biosphere zones and foraging ensembles, and contrast with neighbouring extralimital agriculture. Using a mix of harp traps, mist nets and acoustic surveys, we surveyed bats in each zone and the surrounding extralimital agriculture. We added eight confirmed species to the known bat fauna for CRBR and conclude that CRBR is an effective reserve, protecting half of Borneo’s bat diversity. Species composition and activity varied among zones, with the core and buffer particularly important for conserving forest-interior insectivores.

2. Materials and Methods

2.1. Study Sites

Bat surveys were conducted in the Crocker Range Biosphere Reserve (CRBR), also known as Crocker Range Park, from 19–22 July 2017, 24 June–26 July 2018 and 14 June–18 July 2019. CRBR comprises more than 350,000 hectares of forested area, ranging from lowland to montane forest up to 2350 m a.s.l. [47]. The reserve is characterized by three different protection zones: the core zone, the buffer zone, and the transition zone [11] (Figure 1). The buffer and transition zone of CRBR is occupied by approximately 400 communities surrounded by natural hills with lower montane forest, secondary forest and mixed agriculture such as oil palm, rubber, paddy field and commercial crops [12]. Live trapping and acoustic surveys were conducted at 17 sites covering different protection zones within the reserve, and eight sites within the extralimital zone on the north-east edge of the reserve.
Survey sites in the north-east corner of CRBR were accessed from Mahua Substation and Malungung Control Post in 2017 and 2018, and through Inobong Substation in the north-west edge of the reserve in 2019. Most of the natural vegetation where bats were sampled from the three distinct protection zones is hill dipterocarp forest, occurring between 500 m a.s.l. to about 1000 m a.s.l. The average temperature is between 24–27 °C, and the average annual precipitation is between 1880–2621 mm [48]. The extralimital zones are mostly agriculture plots, with associated commercial crops including banana (Musa spp.), rambutan (Nephelium lappaceum), soursop (Annona spp.), mango (Mangifera spp.), rubber trees (Hevea brasiliensis), oil palm (Elaeis guineensis), and durian (Durio spp.). Full details of each site are given in Supplementary Table S1.

2.2. Species Capture and Identification

Bats were captured at each site using four-bank harp traps [49] positioned across trails or small streams. Ground polyester mist nets (9 m; 36 mm mesh size; four shelves) and double stacked nets (eight shelves) were positioned across established trails, at forest edges, and across small ponds and streams. Mist nets were checked every 15–30 min from 1800–2300 h, or until bat activity declined. Meanwhile, harp traps were checked several times in the evening, and once after times of peak activity in the morning. Bat sampling was avoided during periods of heavy rain. Hand nets were occasionally used to capture low flying bats in open areas and bats at roosts.
Captured bats were identified as the following [31,50,51]. Forearm length (mm) and body mass (g) were recorded for each individual. Juveniles were distinguished from adults by examining the epiphyseal fusion of phalanges [52]. The reproductive status of females was determined by examining the mammary glands and the surrounding area, and was categorized as non-reproductive, pregnant, lactating and post-lactating [50]. Each captured individual was released at the point of capture within six hours. Occasional voucher specimens were collected to confirm the identification of uncertain records and were deposited at the Institute of Tropical Biology and Conservation, Universiti Malaysia Sabah.
The procedures followed animal care and use guidelines of Texas Tech University’s Institutional Animal Care and Use Committee and were approved as protocol 17026-07 category C. This project was also approved by the Sabah Biodiversity Council and conducted under access license JKM/MBS.1000-2/2 JLD.6 (53).

2.3. Acoustic Sampling and Analysis

Anabat Walkabout Bat Detectors v1.2 [53] with model-specific microphone adapters were used to record bat activity along 2 km transects. The adapters improve the directionality and the quality of recordings in tropical environments where there are high volumes of insect noise and where bat species produce echolocation calls at high frequencies (<150 kHz). Transects consisted of six sample points situated 200 m apart to ensure independence. The detectors were programmed to record continuously for ten minutes at each point, each of which was sampled twice per survey. Detectors recorded activity in real-time with a full spectrum resolution of 16-bit and a sampling rate of 500 kHz. Files were recorded in 15 second sections. Where possible, surveys were conducted in the evening, commencing at 18:30 and concluding before 21:00. However, if this was not possible due to weather restrictions, dawn surveys were conducted, commencing at 5:00.
For sites A.E.1:5, A.T.1:2, and A.B.1:2, two surveyors simultaneously started at sample point one and sample point six and recorded along the transect in alternate directions, such that each point was surveyed twice per night. These sites were surveyed once each. Surveys at sites A.T.3:5, A.B.3:4, A.C.1:2 commenced from one starting point (either sample point one or sample point six) and surveyors retraced their steps for the second sample of the night. Consequently, the recording period for these sites was longer. Transects A.T.3:5, A.B.3, and A.C.1 were repeated three times, and A.C.2 and A.B.4 twice for replication. As there was a significant relationship between bat activity and time of surveying (Supplementary Figure S1, Table S2), only recordings from the first sample of each point were used to compare activity between the different zones to minimize temporal bias.
The number of pulses was used as a sample unit for calculating bat activity. Fifteen second recordings were filtered using Kaleidoscope V5.1 (Wildlife Acoustics Inc, USA) for those with two or more search-phase pulses. Once filtered, Anabat Insight [54] was used to automatically extract call characteristics and calculate total activity (no. of pulses) per sample point, between 15–500 kHz with a smoothness five. Call characteristics included: characteristic frequency (Fc), characteristic slope (Sc), duration (Dur), maximum frequency (Fmax), minimum frequency (Fmin), mean frequency (Fmean), time between calls (TBC), frequency of knee (Fk), time from the start of the call to the knee (Tk), average call smoothness (Quality), the slope of the first five points in a pulse (S1), and time from start to the characteristic component (Tc). The data were then cleaned of any pulses with a peak frequency (Fmean) < 20 kHz to remove false positives/noise, which removed 44,657 records. Species identification was not conducted for this study, and therefore activity represents total bat activity for all species.

2.4. Statistical Analysis

To compare acoustic activity, activity per transect was calculated as the sum of activity per corresponding sample point per night divided by sampling effort (minutes of recording). A Kruskal–Wallis H test was then conducted to determine if there was a difference in bat activity between the different zones and the extralimital agriculture. Pairwise comparisons were also conducted between the mean bat activity of each zone and extralimital agriculture using nonparametric, bootstrapped 95% confidence intervals. Principal component analysis (PCA) in R (packages “stats v3.6.1” and “factoextra v1.0.5”) [55] was also employed to investigate the similarity between the call structure of the acoustic activity observed between the different zones. In order to assess survey completeness and compare species richness of sites, rarefaction analyses for each site were done based on sampling effort in iNEXT v2.0.19 [56,57]. We performed separate analyses for individuals captured in harp traps and mist nets. Species richness was rarefied by sample units then rescaled to individuals. For harp traps, sample units were one harp trap night, and for mist nets sample units were one mist net meter/hour.

3. Results

3.1. Bat Assemblage

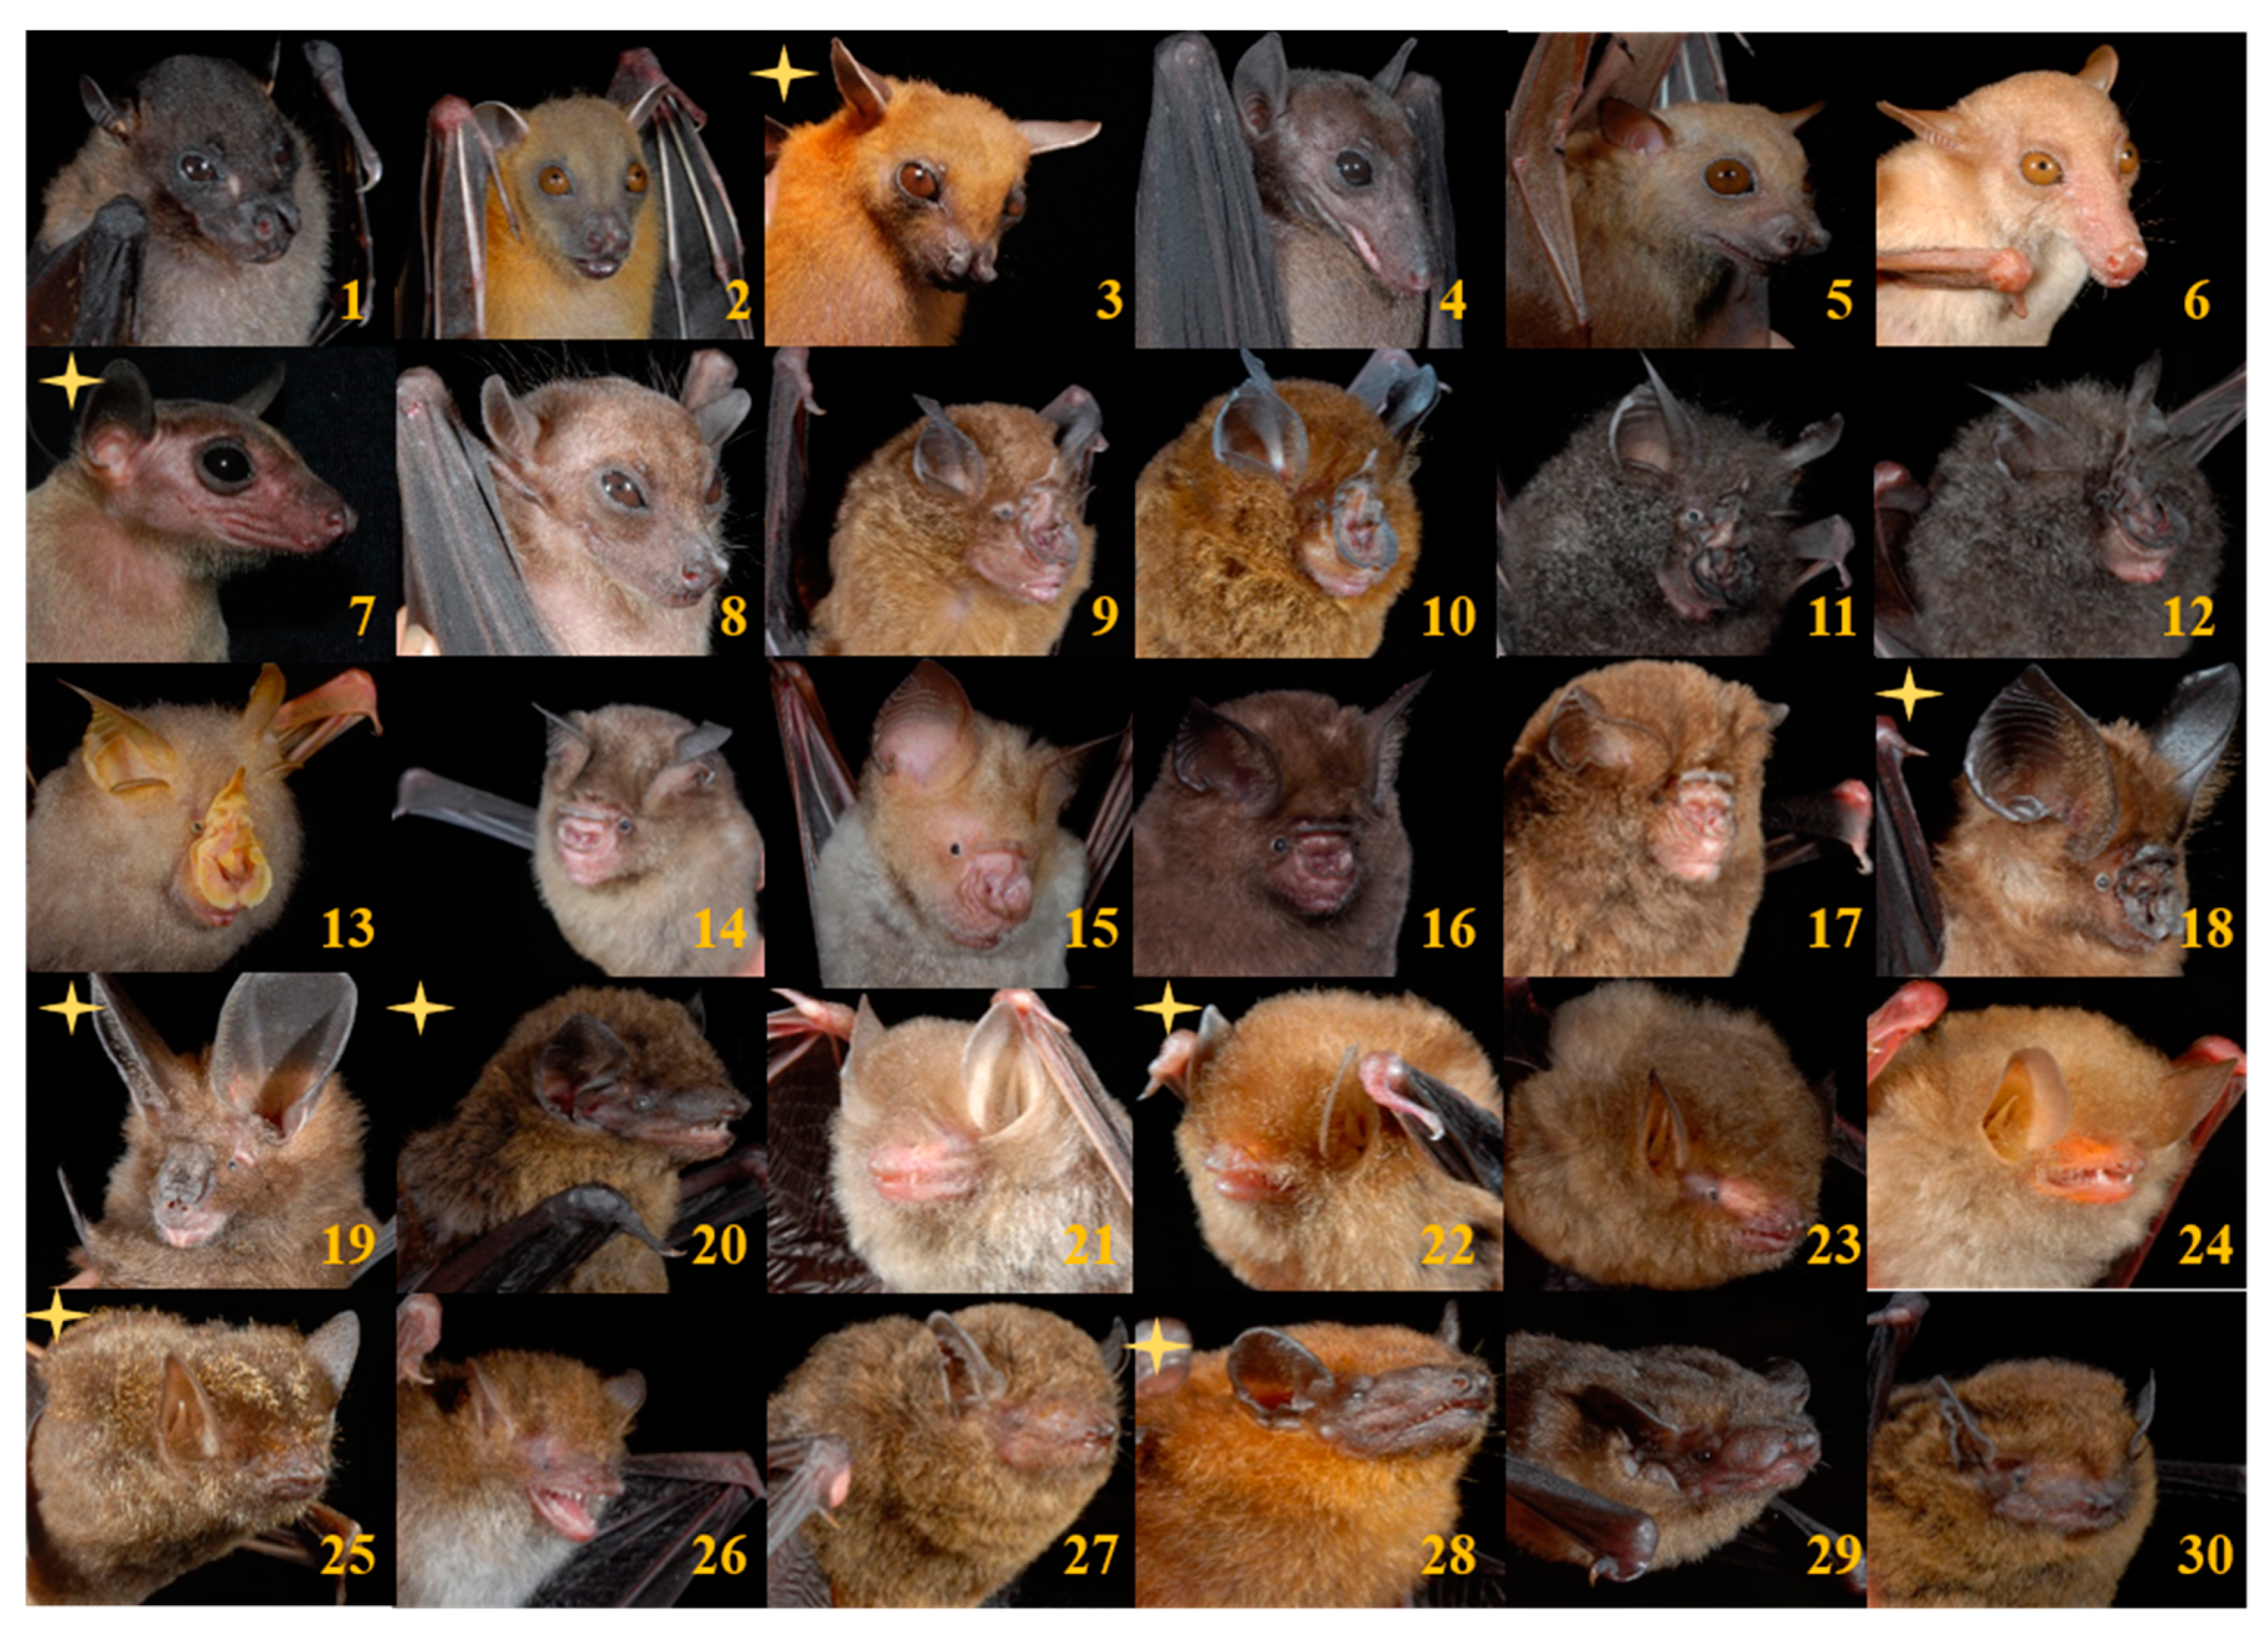
A total of 260 individuals of 30 species was captured, belonging to five families (Table 1 and Table 2, Figure 2). An additional species, Hipposideros doriae/Coelops robinsoni, was identified acoustically, bringing the total to 31 species. Crocker Range was last surveyed for bats in 1999 [46]. That preliminary study used mist-nets, harp traps, and museum inventories to document 41 bat species from the area. Comparing species inventories, our study recorded eight new species in Crocker Range (Cynopterus minutus, Rousettus amplexicaudatus, Hipposideros ridleyi, Hypsugo cf kitcheneri, Kerivoula intermedia, Phoniscus atrox, Tylonycteris pachypus, Nycteris tragata) and H. doriae/C. robinsoni), bringing the new total to 50 species for CRBR.
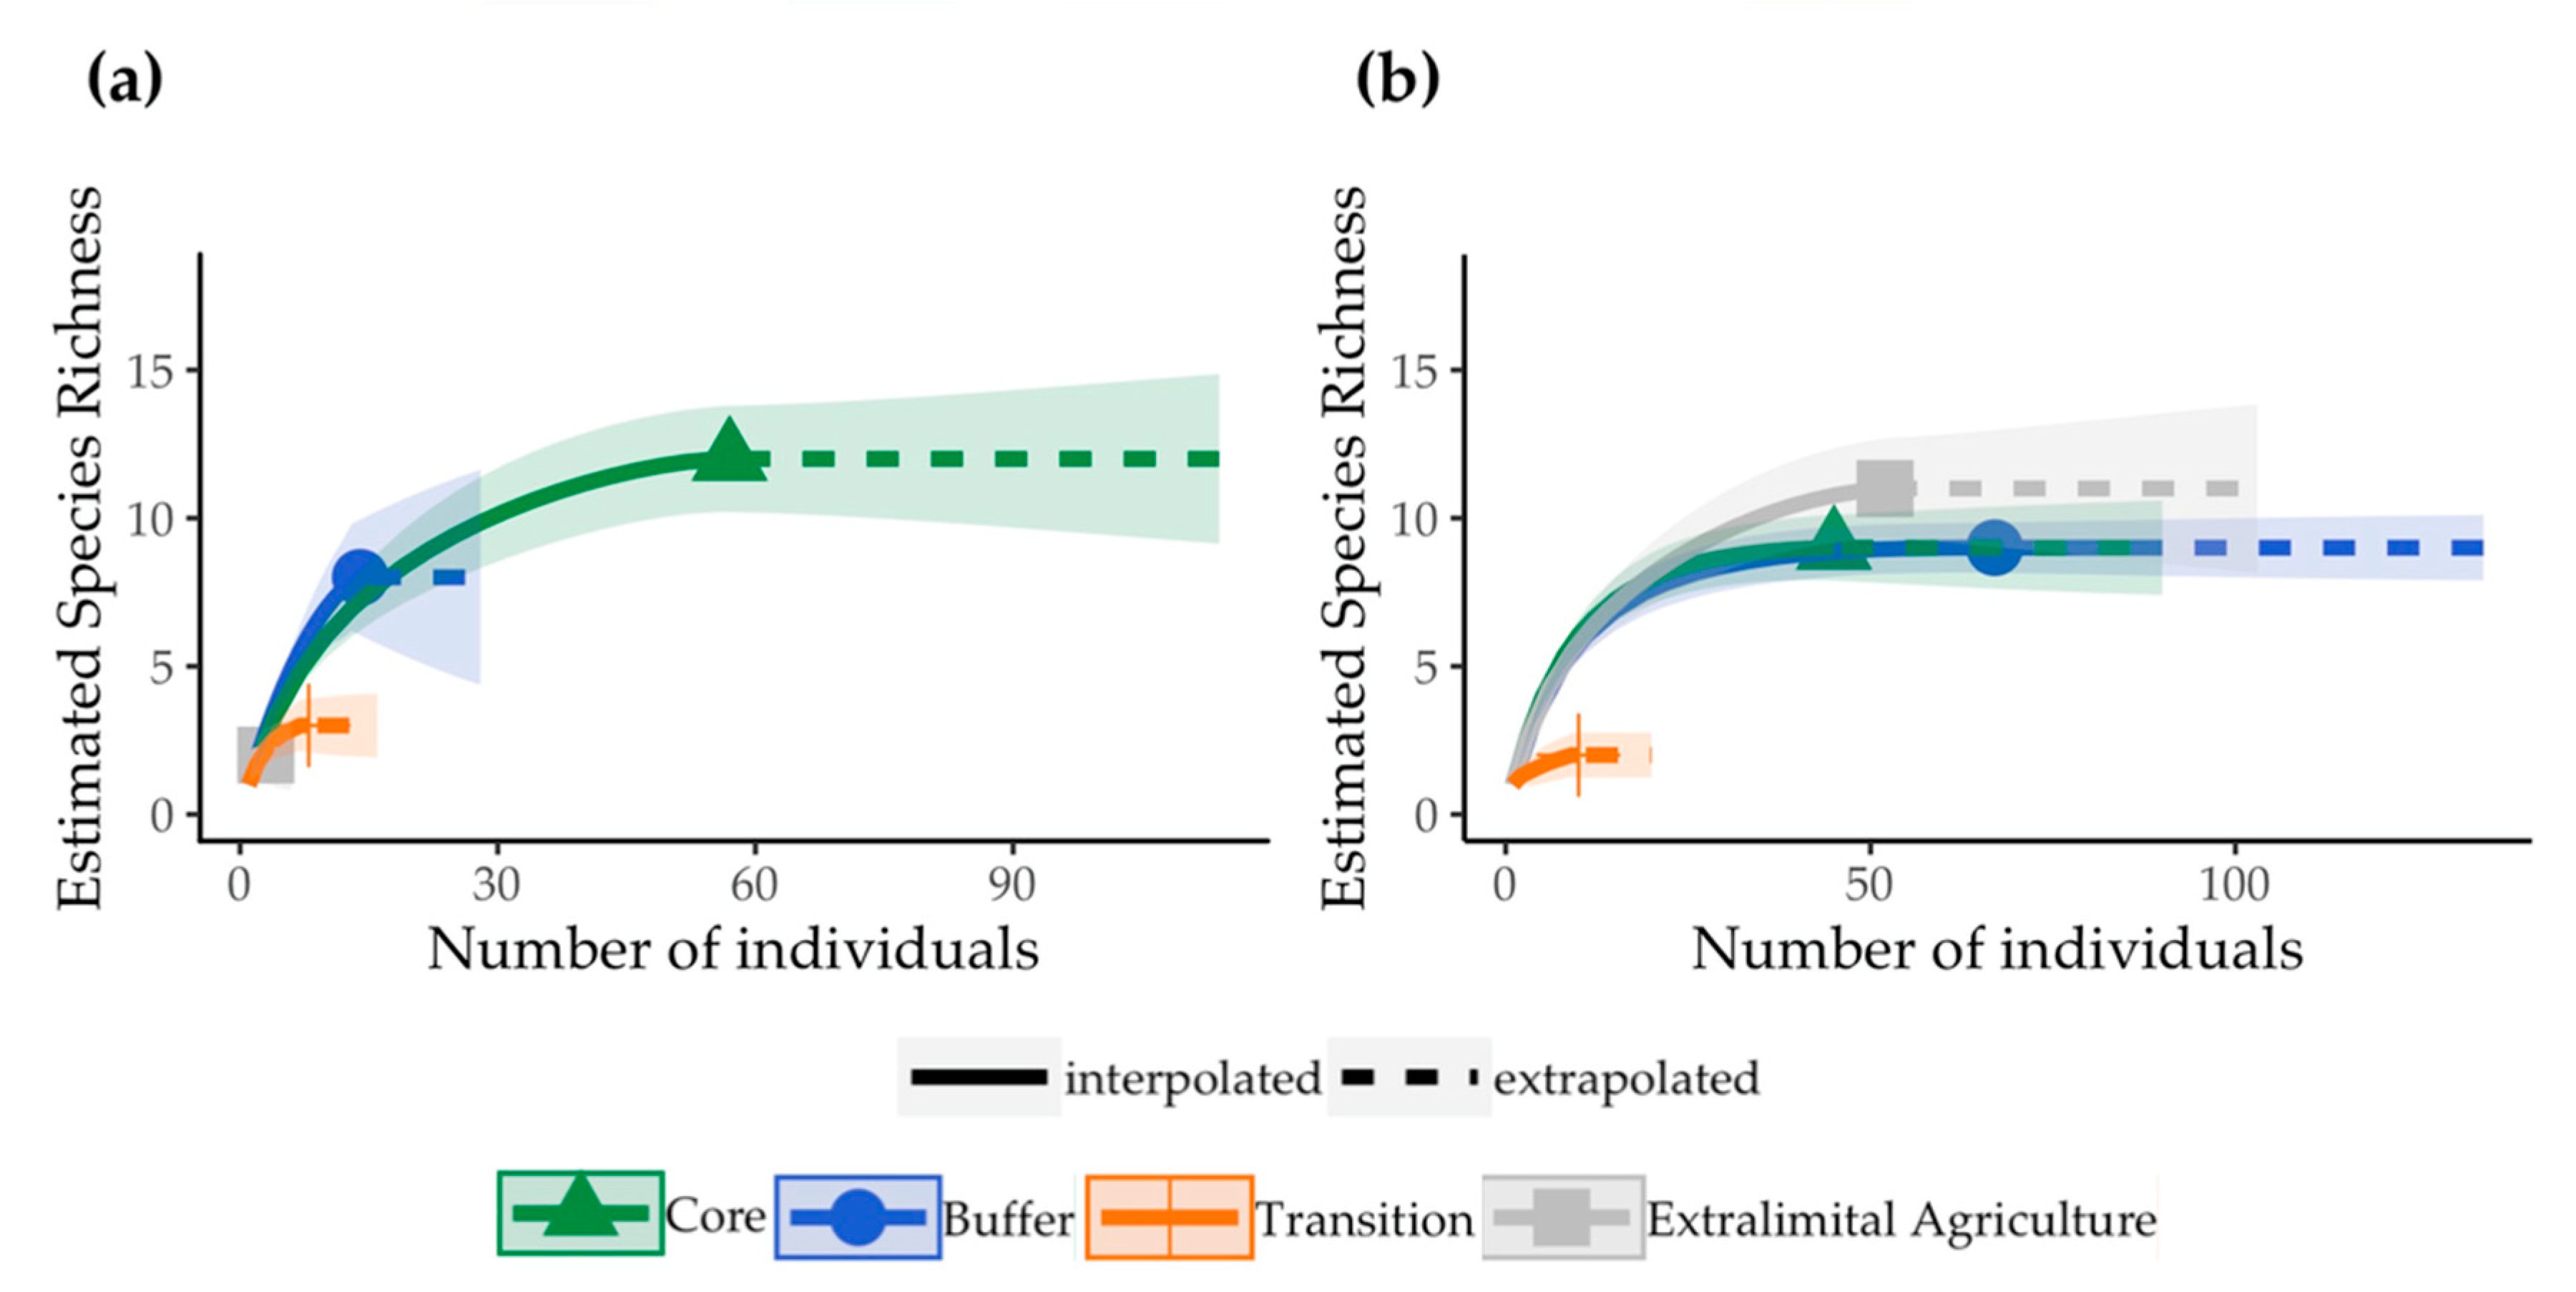
More species were recorded in the forested zones of the core (16 species) and buffer (18 species) than in the transition (six species) and extralimital (13 species) zones (Table 1). Estimated species richness based on harp traps was similarly greater in the forested zones (Figure 3), but rarefaction curves from mist net captures suggest the greatest richness in extralimital agriculture, although there were no significant differences among core, buffer or extralimital agriculture (Figure 3b). Capture effort was low in the transition zone, but both richness curves appeared to level off at low values (< 4 species).
Thirteen of the 23 species captured in core and buffer zones were exclusively captured in those zones. All five species of Hipposideros were caught exclusively in core and buffer zones. Cynopterus brachyotis and Glischropus tylopus were found in all four zones. Rhinolophus trifoliatus, Macroglossus minimus, Rhinolophus sedulus, and Kerivoula hardwickii were found in every zone except for the transition zone. Rousettus amplexicaudatus, Kerivoula pellucida and Rhinolophus luctus were captured only in the transition zone.
T. robustula and G. tylopus were the most abundant species, representing a third of overall captures (n = 87). In the buffer zone, they represented 58% of captures, largely because of the success of a single mist net placed over a small shallow pond (site L.B.2). In the core (L.C.1), mist nets placed near bamboo stands captured large numbers of individuals leaving roosts. T. robustula was not captured in transition and extralimital agriculture, and only three individuals of G. tylopus were captured in the transitional zone and only four in the extralimital agriculture.
A single individual of Hypsugo kitcheneri (Thomas, 1915), one of the Borneo endemic bat species, was captured from the hostel at Mahua Substation. This species has been recorded in several localities in Borneo. The holotype of H. kitcheneri was collected from Buntok, Barito River in South Kalimantan [58]. Subsequently, one specimen was collected from Laham, East Kalimantan, and two specimens were collected from Sandakan, Sabah. However, the specimens from Sandakan have not been found since collection [58,59,60]. The specimen from this survey was deposited at the Institute of Tropical Biology and Conservation, Universiti Malaysia Sabah.

3.2. Acoustic Surveys

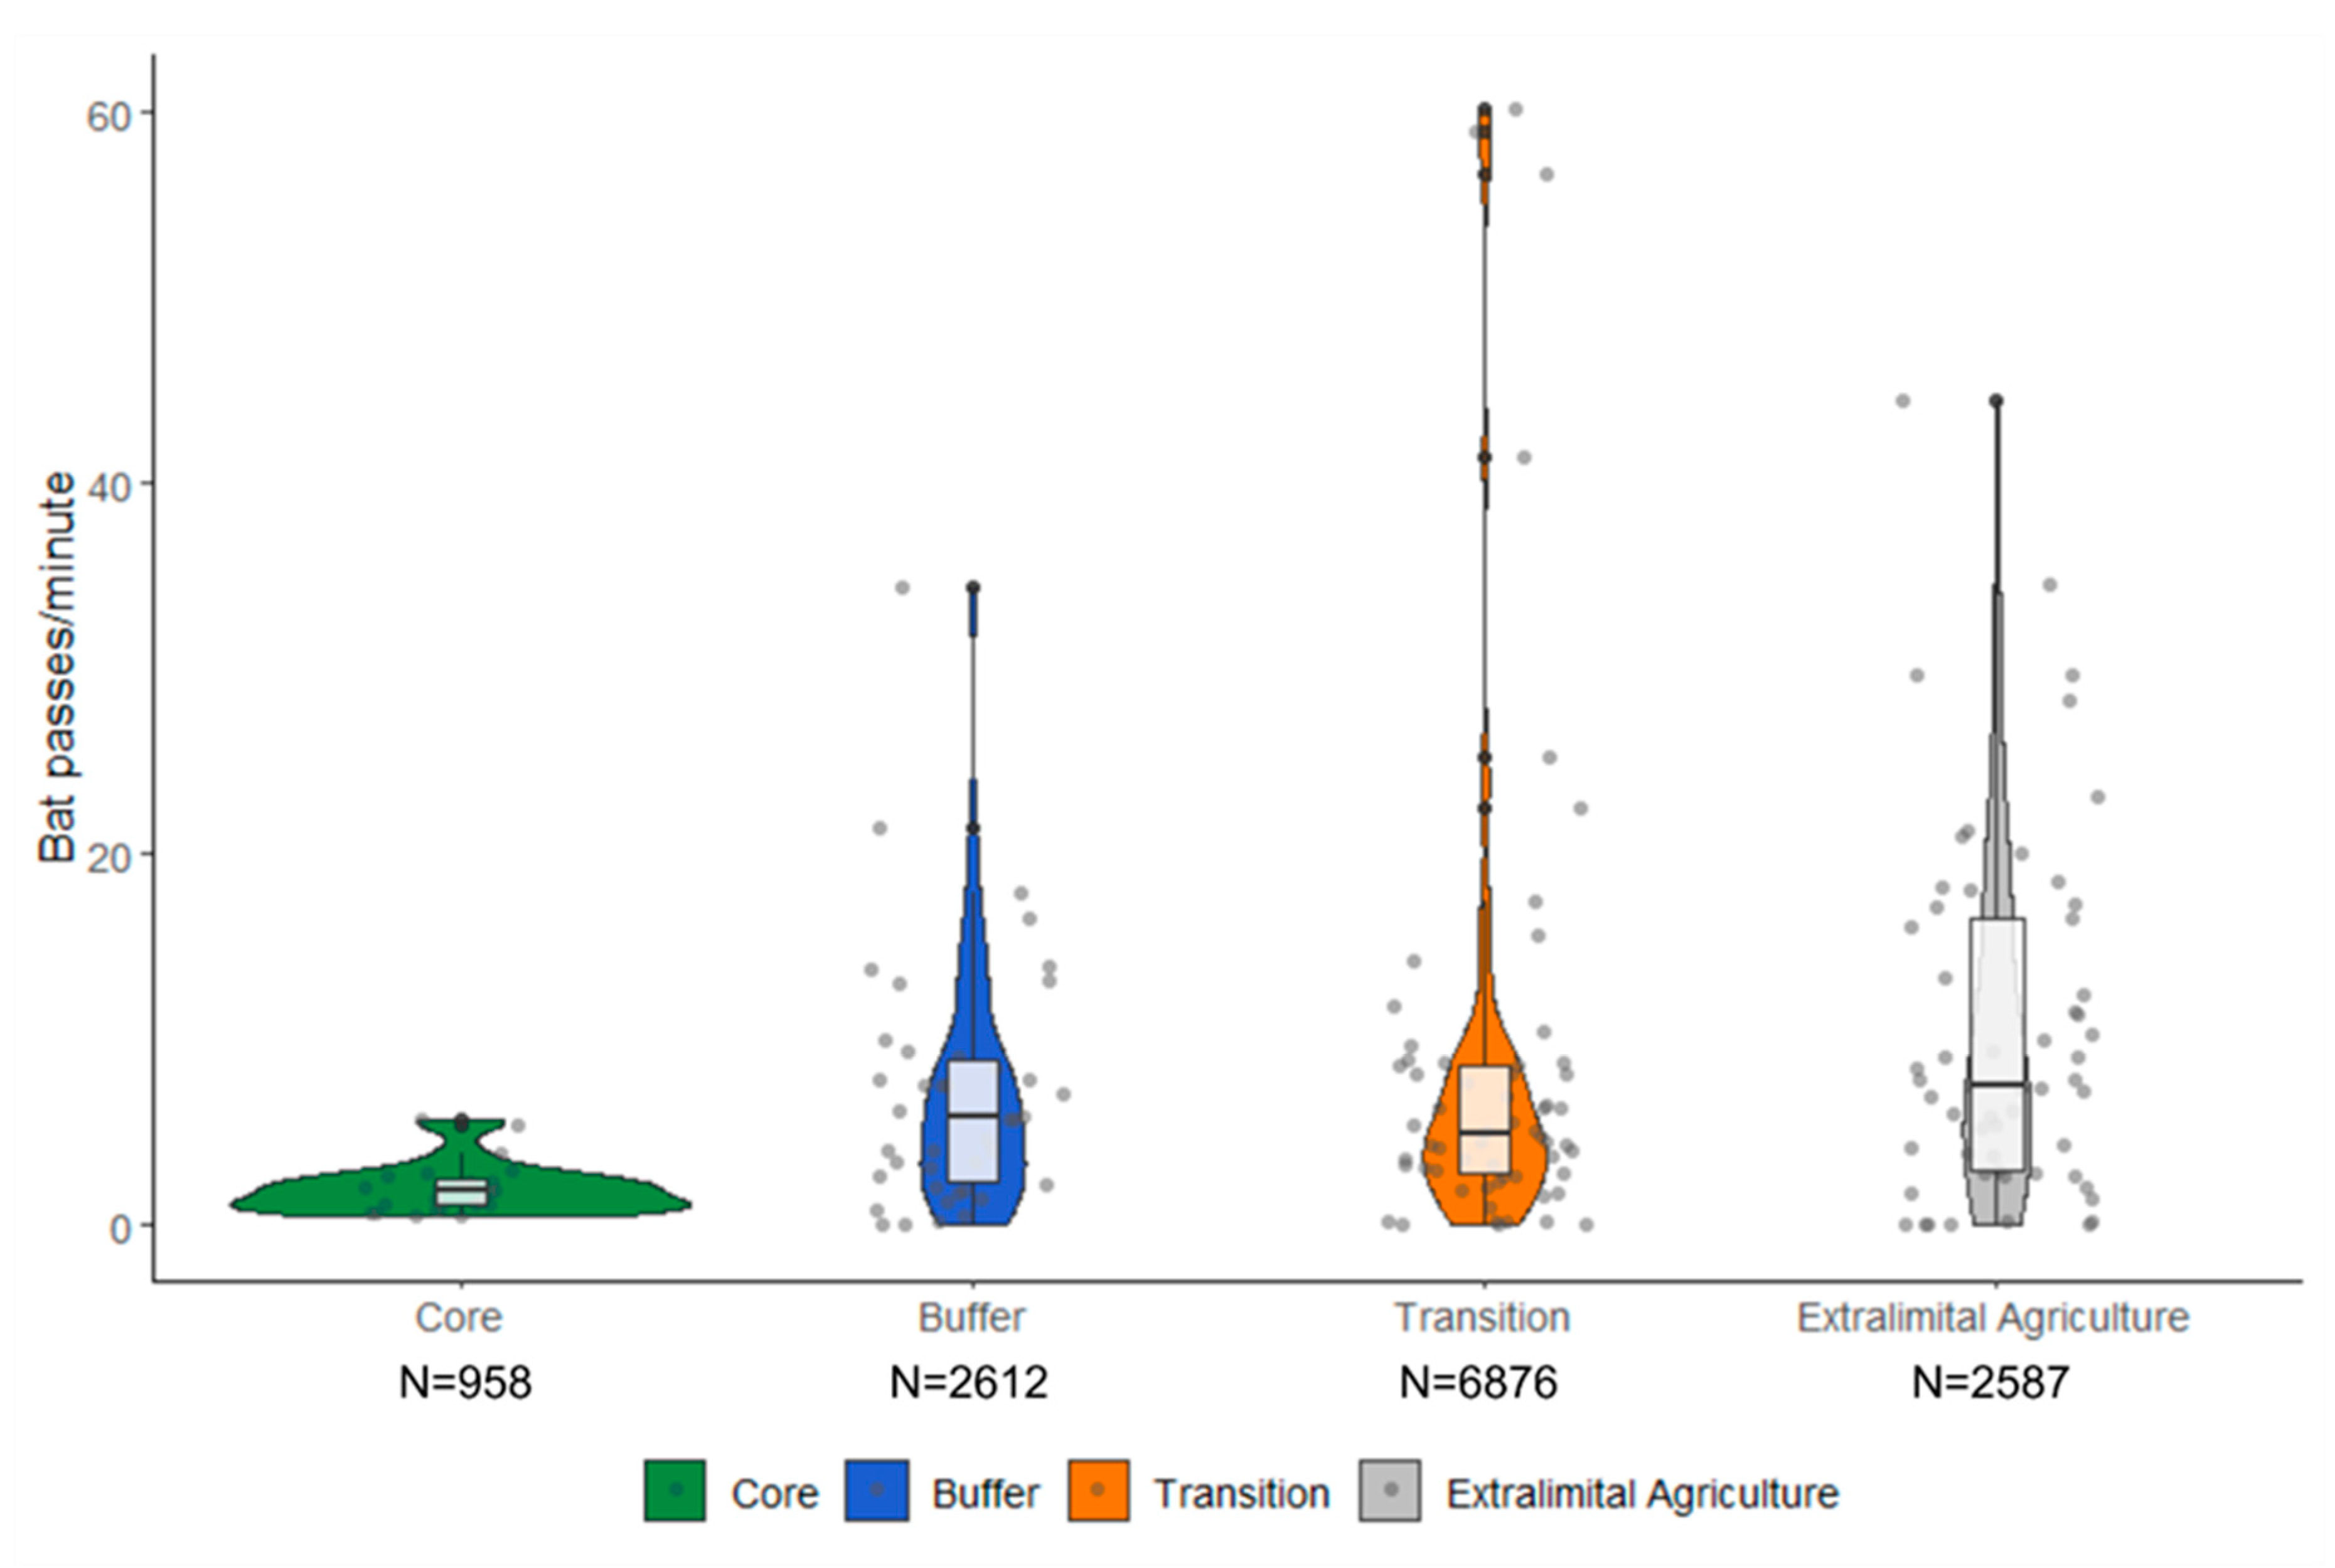
In total, 339,422 pulses were extracted from the recordings across 2018–2019. Of these 208,523 were recorded during the first sample of each point. Peak frequencies of pulses ranged 20–217 kHz. The minimum acoustic threshold post-filtering was 20 kHz. Acoustic activity was significantly different across the four habitat types (H = 15.093, df = 3, p-value = 0.002; Figure 4). Acoustic activity was lowest in the core zone but comparable across the buffer zone, transition zone, and extralimital agriculture. This is supported by the pairwise comparisons (Supplementary Figure S2).
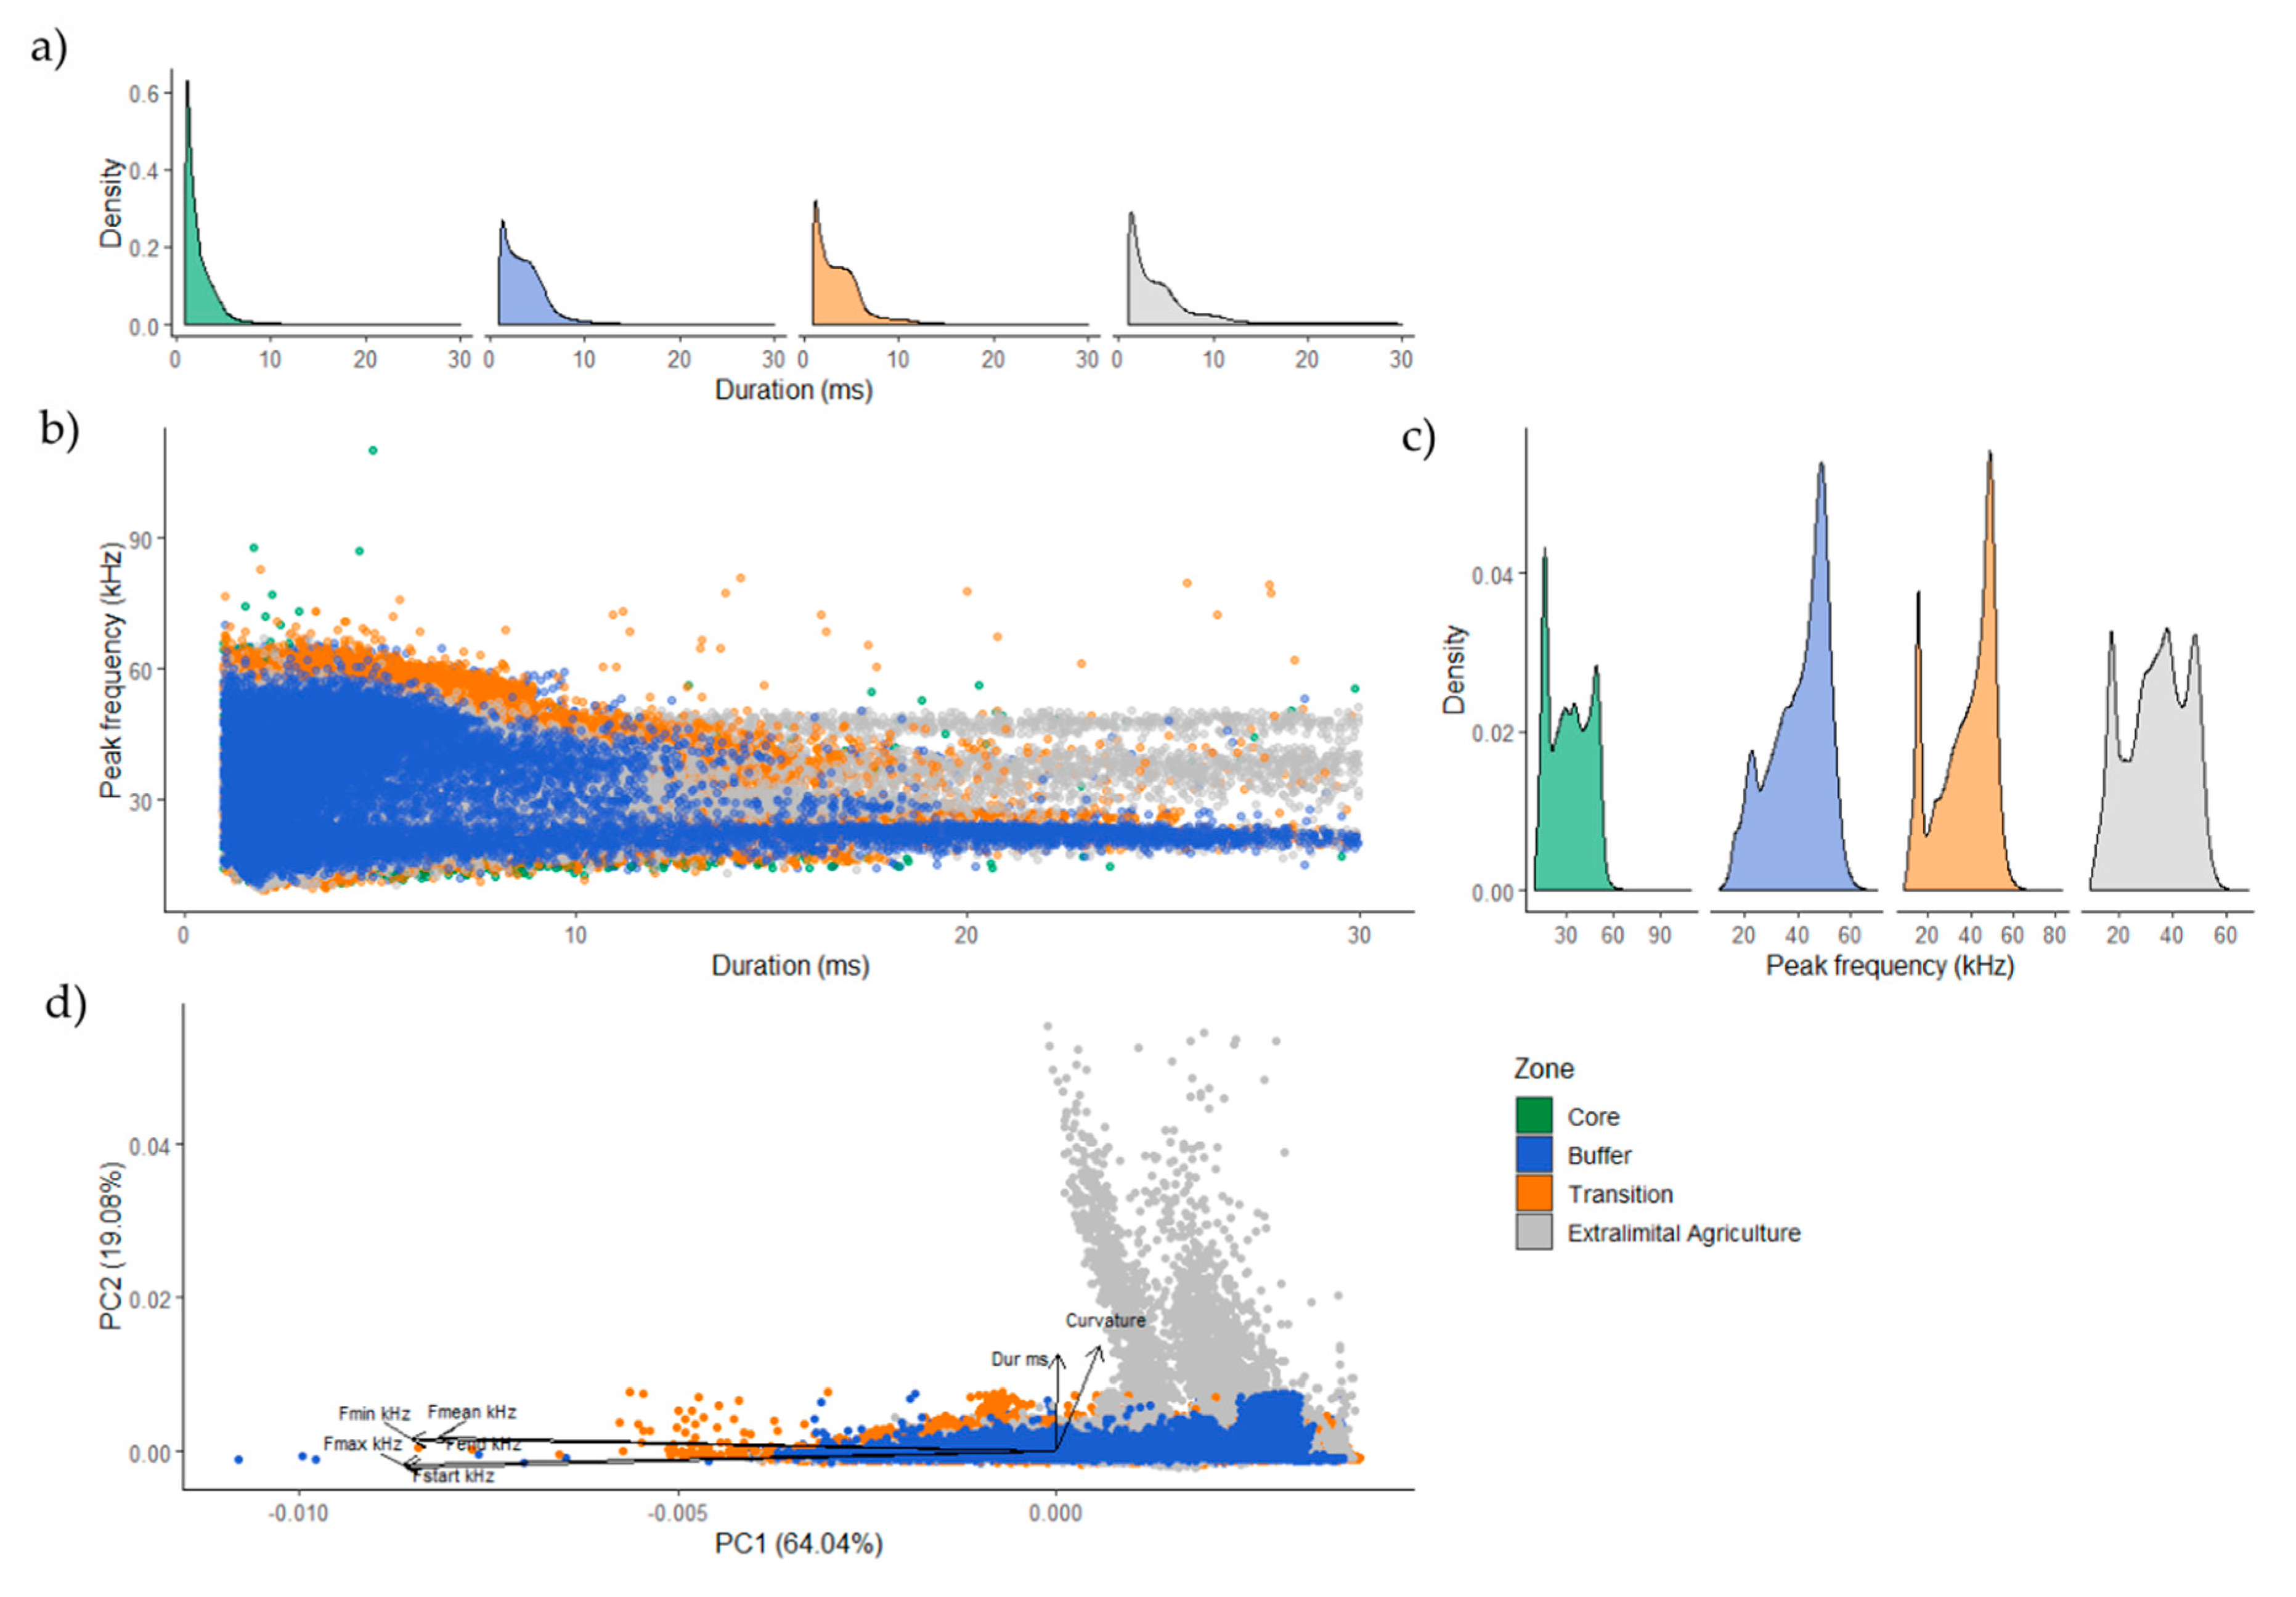
Although there was overlap in the structure of the acoustic activity recorded across zones, there were identifiable differences in call duration, start and maximum frequency, and the curvature of calls between zones (Figure 5). Longer calls were observed in the extralimital agriculture as identified by the PCA, scoring high values on PCA2. PCA-loading contributions to PCA2 were dominated by curvature and call duration (ms), whereas PC1 was dominated by Fmax (kHz) and Fstart (kHz) (Supplementary Figure S3). The range of call curvature was greatest in the extralimital zone and lowest in the core zone. Calls in the core zone were typically short and high frequency. There was substantial variability in call structure in the buffer zone, where the greatest range of call duration and peak frequencies were recorded. However, whereas there were three distinct peaks in peak frequency recorded in extralimital agriculture (~20 kHz, ~40 kHz, and ~55 kHz), a singular peak, concentrated at ~55 kHz, was recorded in the buffer zone. Call structure in the transition zone reflects that of the buffer zone but demonstrates lower variability in call duration and higher variability in peak frequency. It also demonstrates a peak in peak frequency at ~55 kHz, as well as another at ~20 kHz. Using corresponding peaks across zones, the acoustic surveys suggest certain species are more active in the transition than in forest zones.
Constant-frequency echolocation calls with a peak frequency of ~217 kHz were recorded in the core zone at site A.C.2. (5°50.486’ N, 116°08.717’ E) at 700 m (Supplementary Figure S4). Due to its high frequency, this hipposiderid is most likely to be H. doriae, or C. robinsoni (T. Kingston & J. Chun-Chia Huang, pers. obs.). H. doriae is considered one of the rarest hipposiderids in Borneo and is known in Crocker Range [31], whereas C. robinsoni has only previously been documented in Sarawak and Kalimantan [31,61]. It is also possible that the call is that of an undescribed, very small hipposiderid.

4. Discussion

The Crocker Range Biosphere Reserve effectively protects bat diversity, with more than half of Borneo’s bat species now reported for the reserve. Notably, 16 of the 28 species captured in the CRBR in this study were not recorded in neighbouring extralimital agriculture. On a wider scale, the CRBR represents an area of relatively high value for bats compared to other protected areas within the Heart of Borneo (HoB) initiative [61].
Species composition and activity varied among MAB zones, with the core and buffer particularly important for conserving forest-interior insectivores. Thirteen species were captured exclusively in the core and buffer zone, including all species of Hipposideridae. The highest species richness for both edge/gap insectivores and forest interior insectivores was recorded in the buffer zone, however, six forest interior species were only recorded in the core zone. Similarly, acoustic activity in the core zone was dominated by short (<3 ms), high-frequency calls typical of forest interior species of Vespertilionidae (subfamilies Kerivoulinae and Murininae) and Hipposideridae [36,62,63]. In contrast, the peak of activity observed at ~55 kHz within the buffer, transition, and agriculture is indicative of several edge-foraging species of Vespertilionidae, including Myotis muricola and T. pachypus [64,65]. This is likely to be T. pachypus, an edge/gap insectivore with intermediate length calls (e.g., 3–10 ms), which was captured abundantly across our study and was observed roosting in the core zone. Acoustic activity in the transition zone and agriculture was dominated by long calls with a low peak frequency of 20 kHz, characteristic of open-space aerial foragers. This is likely to represent molossid species, such as Mops mops (peak frequency 18.5–23.3 kHz [23]). However, in the agricultural sites, calls exhibited increased curvature and a greater range of low and mid-range peak frequencies, suggesting that the diversity of open-space aerial foragers was greater in the agriculture zone than the transition zone. The peak in the activity of long calls at 30–40 kHz is likely to represent molossids (such as Chaerephon plicatus), or emballonurids (such as Saccolaimus saccolaimus; [64,66]).
The decrease in forest-interior species within the transition and extralimital agriculture indicates a negative response to land-use change for this ensemble. Vegetation simplification is a consequence of agricultural intensification [67,68] and ecomorphological traits characteristic of forest-dependent species [23] are a limitation to forest ensembles persisting in these simplified, open spaces. Mechanisms for this decline in bats include reduced roost availability for plant-roosting species [67,69,70], degraded roost quality [71], and reduced foraging success. If a species cannot persist in a matrix, connectivity between forest fragments is greatly reduced [72].
Bats of the plant-visiting family Pteropodidae were captured in all four zones but dominated captures in the extralimital agriculture. Unlike forest-dependent insectivores, the plant-visiting pteropodids can travel larger distances [73,74] as well as exploit the abundance of plant food resources available in the transition zone and extralimital agriculture [75,76]. This may explain the higher diversity and abundance of these species observed outside of the reserve in our study. Cave-roosting insectivores are also considered more tolerant of anthropogenic disturbance than forest-dependent species [23,33,70]. Their low abundance across our study reflects the lack of available cave systems nearby rather than portraying a true response to disturbance.
Our findings support previous studies suggesting that the core and buffer zones are the most important zones for conserving bats in biosphere reserves [40,42], although our study differed in that species richness was comparable in the buffer and core. In both the Vhembe Biosphere Reserve in South Africa and La Michilía Biosphere Reserve in Mexico, more species were found in the core than in the buffer [41,42,43]. The core zone has also been shown to provide important resources for species persisting across multiple zones. In Calakmul Biosphere reserve, Mexico, Sturnira lilium is a common species in the buffer and core but is reliant on the primary forest in the core zone for roosting [77]. We observed bamboo bats (Tylonycteris spp.) roosting within the core but foraging across multiple zones. Therefore, the core zone may provide roosting opportunities that help support greater populations of plant-roosting species in neighbouring MAB zones than may otherwise be possible.
Zoning provided by biosphere reserves has proved relevant to the conservation of other mammals, although the value of the core zone compared to the buffer zone differs across species. Similar to bats, forest-dependent species, including sun bear (Helarctos malayanus), clouded leopard (Neofelis diardi), and marbled cat (Pardofelis marmorata) were only found in the core zone of Giam Siak Kecil-Bukit Batu Biosphere Reserve, Indonesia, whereas the generalist palm civet (Paradoxurus hermaphroditus) was only found in the buffer zone [78]. Elsewhere, there appears to be no effect of the management zones on mammal richness and distribution in the reserve (e.g., [79,80]), or even greater species richness outside the reserve [81], but studies providing a robust comparison across zones and extralimital habitats remain few.
Land-use change is the primary threat to bats in Southeast Asia [33], but our results support previous studies that show that ensembles are not equally affected by disturbance. Ecological characteristics such as roost type, foraging ensemble, and body size differentially confer vulnerability or resilience [25]. For example, different roost ensembles are affected by different drivers of disturbance. Foliage roosting species are affected by a reduction in roosting opportunities whereas cave-dwelling species are affected by both disturbance at the roost and greater commuter costs as foraging habitats are fragmented [38,82]. Body mass is positively correlated with resilience to disturbance, whereas smaller species that emit higher peak frequencies responded negatively [67,83]. Mean body mass of the species recorded in our study was twice as high in the extralimital agriculture (26.44 g) than in the core zone (13.11 g; Table 2), however this does not consider the relative abundance of each species.
Insectivores are also known to exhibit a higher sensitivity to disturbance than herbivorous species [84]. Our results highlighted a compositional shift from a dominant insectivorous bat assemblage in the core to one dominated by frugivorous species in extralimital agriculture. This may be the result of reduced prey availability, as land-use change alters insect communities [85] and reduces insect biomass, with consequences for bat diversity and activity (e.g., [71]). However, this compositional shift in the bat fauna was not observed within the transition zone. The transition zone sites were floristically less diverse than those in the extralimital agricultural (see site descriptions) and predominantly comprised rubber and oil palm, therefore we suspect they did not provide abundant fruit resources necessary to support more frugivorous species. Along a disturbance gradient from primary forest to oil palm in lowland Borneo, capture rates were lowest in oil palm [86]. This suggests potential to improve the biodiversity value of transition habitats of CRBR, perhaps by implementing agroforestry crop systems that increase fruit and nectar resources. More diverse agroforestry, as well as an increase in patches of native vegetation, would also increase vegetative complexity, and hence insect diversity and abundance important for edge and open space insectivorous bats.
Our results should be considered in the light of some limitations, particularly that sampling was not even across the reserve or the wider landscape. Differences in sampling effort relate to differing trap efforts between the different zones, access, and sampling efficiency between habitats. Whilst we were not able to ensure equal trap effort across zones, the species accumulation curves suggest inadequate sampling was limited to the transition zone for mist-netting and harp-trapping and the buffer zone for harp trapping. Therefore, it is possible that our results underestimate the overall diversity and abundance of bats utilizing the transition zone, and the diversity and abundance of forest-interior insectivores in the buffer zone. Our sampling was also restricted due to difficult terrain, and greater access was available at higher elevations. Elevation is known to negatively correlate with bat species richness [87], therefore it may have contributed to non-uniform capture rates across sites at differing elevations, rather than the effect being solely driven by land-use change. As our sampling was restricted to the wet season, seasonality may also have had a negative effect on capture rates [72]. Future survey efforts should aim to isolate these surveying co-variates as random effects. Within the MAB zones, there is geographic variability in land-use practices and compliance with UNESCO legislation. Whilst we aimed to include a diversity of these practices in our study (e.g., oil palm, rubber, agriculture in transition zone), we did not investigate how specific practices, or how landscape-scale characteristics more broadly differed in their importance for protecting bat species within the reserve. Finally, the buffer zone is not continuous in CRBR, and in some areas the core abuts the transition zone. The buffer zone is designed as a low-contrast intermediary zone between the core and transition zones, thereby limiting edge effects related to the boundary between these two zones [10,11]. We therefore predict that the species richness and abundance of bat species would be lower where the core zone neighbours the transition zone directly, due to greater disturbance. However, in our study we did not compare areas of the MAB reserve with and without this buffer, thus future research is needed to validate whether the zone is fulfilling this role.
Trap efficacy and call detectability are also dependent on ensemble and habitat structure [33,72]. As expected within our study, a higher species richness was observed using harp traps compared to mist-nets within the core and buffer zones (e.g., forested zones) and higher species richness using mist-nets in extralimital agriculture (e.g., open spaces). Live trapping is also considered to be less effective in open spaces such as transition and agriculture, where bats are less likely to encounter a trap. High-frequency calls are more easily attenuated by the atmosphere than low-frequency calls, and the quantity of environmental clutter negatively correlates with the range of call detectability [72]. For both these reasons, forest-interior insectivores such as K. hardwickii are more difficult to detect acoustically than edge/open space insectivores, and this is likely to explain why the acoustic activity was higher in all zones compared to core forest. By using live trapping and acoustic sampling as complementary techniques, we aimed to limit these biases. It is difficult to extrapolate robust conclusions from the acoustic data as it is not possible to calculate abundance or differentiate between species. Manual identification of calls within this study was not possible, due to time constraints and the lack of a call library. Further development of automated or semi-automated classifiers for the region will improve the capacity of acoustic sampling for monitoring bat populations within Southeast Asia. Despite this, the acoustic data aided in identifying areas where activity was inadequately represented by live-captures.
There were several unexpected findings within our study. Three species, Kervioula papillosa, Rhinolophus borneensis, and Rhinolophus acuminatus, were all recorded in transition despite being characterized as forest-specialists. However, all these records were from only one site (5°47’53.20”, 116°24′17.93”), which is uncharacteristic of the transition zone as it is densely forested and neighbours the core forest directly. Therefore, we do not believe these records are representative of wider transition zone. Similarly, Rousettus amplexicaudatus, a cave-roosting species [31], was captured within extralimital agriculture. However, as we only caught one individual and the species is capable of commuting 50 km nightly to find fruit resources [21], it is likely to be a transient individual rather than being locally common, as it is elsewhere in Sabah [31].
Although we added eight species to the list for CRBR, we did not catch 20 species previously reported [46]. This is most likely a consequence of our limited sampling effort and the survey methods used. Many of the species absent from our list are difficult to capture in nets or harp traps unless they are positioned close to a roost or established flyway (e.g., Pipistrellus spp., Taphozous longimanus, Saccolaimus saccolaimus). These species might ultimately be identified in the acoustic recordings, subject to further development of call classifiers and library development in the region. However, it is worth noting that several species that we did not catch commonly roost in large caves (e.g., Miniopterus spp., S. saccolaimus, T. longimanus, Eonycteris spelaea) or large tree hollows (e.g., Dyacopterus spadiceus, Cheiromeles torquatus), suggesting that disturbance at caves and land-use change may play a role. In a similar vein, some species are known to be declining (C. torquatus, P. vampyrus) [21] and may have been lost from the landscape.

5. Conclusions

In summary, the results of this study demonstrate that MAB programmes can be effective at promoting diversity in cooperation with human activity. The buffer zone provided adequate habitat for several forest-dependent and threatened species but not all. Therefore, it remains pivotal to ensure areas of primary forest are preserved. Nonetheless, buffer zones do help alleviate the effects of land-use change by reducing the contrast between protected areas and agriculture for many species. Our study did not demonstrate any additional conservation value of the transition zone compared to neighbouring agriculture, suggesting potential for agroforestry interventions that enhance vegetative complexity and retain patches of natural forest to improve the biodiversity value of the transition zone. Evaluations such as this are important to ensure protected area schemes are functioning effectively. We conclude that collectively UNESCO Biosphere zones can provide a valuable habitat for conserving bat diversity in the Southeast Asian tropics.

Supplementary Materials

The following are available online at https://www.mdpi.com/1424-2818/12/2/60/s1, Table S1: Detailed site description for sampling localities within CRBR GPS coordinates, the abbreviations used to identify them in figure, their zones and sampling duration, Table S2: Relationship between bat activity and time of surveying, Figure S1: Temporal variation in acoustic bat activity, Figure S2: Mean bat activity recorded within the four zones, Figure S3: Contribution of acoustic variables to PCA, Figure S4: Sonogram of high frequency Hipposideros species.

Author Contributions

Conceptualization, T.K., N.Y., K.V.F., I.A., and A.M.; Methodology, T.K., N.Y., A.M., and I.A.; Software, N.Y.; Validation, T.K., N.Y., and R.Y.; Formal analysis, N.Y. and R.Y.; Investigation, T.K., N.Y., K.V.F., I.A., R.Y., A.M., and T.S.-B.; Resources, T.K. and A.M.; Data Curation N.Y., K.V.F., T.K., R.Y., and T.S.-B.; Writing—Original Draft Preparation, T.K., N.Y., R.Y., K.V.F., and I.A.; Writing—Review and Editing, T.K.; Visualization, N.Y., T.S.-B., R.Y., and K.V.F.; Supervision, T.K.; Project Administration—T.K., A.M., and I.A.; Funding Acquisition, T.K. and A.M.

Funding

This research was funded by the Nationals Science Foundation, award number 165871. In addition, I.A. was funded by University College Sabah Foundation, N.Y. by a Natural Environmental Research Council EnvEast DTP scholarship (grant number NE/L002582/1), T.S.-B. by the State University of New York Oswego’s Possibility Scholarship Program.

Acknowledgments

We are grateful to the Sabah Biodiversity Council for granting the access license (permit JKM/MBS.1000-2/2 JLD.6 (53)), and Sabah Parks for permission to work in the CRBR. Specifically, Madam Rimi Repin, Deputy Director (Research and Education) of Sabah Parks, Thomas Yussop, Park Manager of Crocker Range Park, Yassin Miki, Park Manager of Kinabalu Park and Simun Limbawang, Head of Inobong Research Station (Kinabalu Park). We thank the District of Tambunan for cooperation in surveying outside the CRBR in the Tambunan Valley and are grateful to Anastasius Peter Modi, Angelo Asis, Helen Gotonis, and Amry Sorop for access to their land for surveys. We thank James Jupikely, Universiti Malaysia Sabah (UMS) Faculty of Sustainable Agriculture, Monica Suleiman, Director of Institute for Tropical Biology and Conservation, UMS, Jaya Seelan, UMS, Kalsum Yusah, UMS Michael Farmer, Texas Tech University, Sarah Fritts of Texas State University for logistical and participatory support of the project. Additional students participated in the fieldwork and we thank them for their contribution: Amirah Amat, Ummu Safiyyah Daud, Nurhani Adila Abdul Halim, Su Suzaine Sukiman and Nurkujayati Martin, Alex Troutman and Tyler Test. We are grateful to Joe Chun-Chia Huang for reviewing the high-frequency CF call and sharing his opinion on species identity and to two anonymous reviewers for the constructive comments. One reviewer very kindly shared some R code.

Conflicts of Interest

The authors declare no conflict of interest. The funders had no role in the design of the study; in the collection, analyses, or interpretation of data; in the writing of the manuscript, or in the decision to publish the results.

References

  1. Giam, X. Global biodiversity loss from tropical deforestation. PNAS USA 2017, 114, 5775–5777. [Google Scholar] [CrossRef] [Green Version]
  2. Raven, P.H. Our Diminishing Tropical Forests. In Biodiversity; Wilson, E.O., Peter, F.M., Eds.; National Academies Press (US): Washington, DC, USA, 1988; pp. 119–129. [Google Scholar]
  3. Song, X.-P.; Hansen, M.C.; Stehman, S.V.; Potapov, P.V.; Tyukavina, A.; Vermote, E.F.; Townshend, J.R. Global land change from 1982 to 2016. Nature 2018, 560, 639–643. [Google Scholar] [CrossRef]
  4. Jenkins, C.N.; Joppa, L. Expansion of the global terrestrial protected area system. Biol. Conserv. 2009, 142, 2166–2174. [Google Scholar] [CrossRef]
  5. DeFries, R.; Hansen, A.; Turner, B.L.; Reid, R.; Liu, J. Land use change around protected areas: Management to balance human needs and ecological function. Ecol. Appl. 2007, 17, 1031–1038. [Google Scholar] [CrossRef]
  6. Curran, L.M.; Trigg, S.N.; McDonald, A.K.; Astiani, D.; Hardiono, Y.M.; Siregar, P.; Caniago, I.; Kasischke, E. Lowland forest loss in protected areas of Indonesian Borneo. Science 2004, 303, 1000–1003. [Google Scholar] [CrossRef] [Green Version]
  7. Terborgh, J.; Peres, C. The Problem of People in Parks. In Making Parks Work: Strategies for Preserving Tropical Nature; Terborgh, J., van Schaik, C., Davenport, L., Rao, M., Eds.; Island Press: Washington, DC, USA, 2002; pp. 307–319. [Google Scholar]
  8. Hill, J.L.; Curran, P.J. Area, shape and isolation of tropical forest fragments: Effects on tree species diversity and implications for conservation. J. Biogeogr. 2003, 30, 1391–1403. [Google Scholar] [CrossRef] [Green Version]
  9. Laurance, W.F.; Useche, D.C.; Rendeiro, J.; Kalka, M.; Bradshaw, C.J.A.; Sloan, S.P.; Laurance, S.G. Averting Biodiversity Collapse in Tropical Forest Protected Areas. Nature 2012, 489, 290–294. [Google Scholar] [CrossRef] [Green Version]
  10. Ishwaran, N.; Persic, A.; Nguyen, H.T. Concept and practice: The case of UNESCO biosphere reserves. IJESD 2008, 7, 118–131. [Google Scholar] [CrossRef]
  11. Reed, M.G. The contributions of UNESCO man and biosphere programme and biosphere reserves to the practice of sustainability science. Sustain. Sci. 2019, 14, 809–821. [Google Scholar] [CrossRef]
  12. UNESCO. Biosphere Reserves—Learning Sites for Sustainable Development. 2017. Available online: http://www.unesco.org/new/en/natural-sciences/environment/ecological-sciences/biosphere-reserves/ (accessed on 8 October 2019).
  13. UNESCO. Crocker Range. 2014. Available online: http://www.unesco.org/new/en/natural-sciences/environment/ecological-sciences/biosphere-reserves/asia-and-the-pacific/malaysia/crocker-range/ (accessed on 16 December 2019).
  14. UNESCO. Southeast Asian Biosphere Reserve Network. 2019. Available online: http://www.unesco.org/new/en/natural-sciences/environment/ecological-sciences/man-and-biosphere-programme/networks/seabrnet/ (accessed on 8 October 2019).
  15. Kunz, T.H.; de Torrez, E.B.; Bauer, D.; Lobova, T.; Fleming, T.H. Ecosystem services provided by bats. Ann. N. Y. Acad. Sci. 2011, 1223, 1–38. [Google Scholar] [CrossRef]
  16. Sheherazade; Ober, H.K.; Tsang, S.M. Contributions of bats to the local economy through durian pollination in Sulawesi, Indonesia. Biotropica 2019, 51, 913–922. [Google Scholar] [CrossRef]
  17. Fleming, T.H.; Holland, J.N. Nectar bat-plant interactions in North American deserts. Hystrix 2018, 29, 33–39. [Google Scholar]
  18. Jones, G.; Jacobs, D.S.; Kunz, T.H.; Willig, M.R.; Racey, P.A. Carpe noctem: The importance of bats as bioindicators. Endang. Species Res. 2009, 8, 93–115. [Google Scholar] [CrossRef] [Green Version]
  19. Voigt, C.; Kingston, T. Bats in the Anthropocene: Conservation of Bats in a Changing World; Springer International Publishing: Cham, Switzerland, 2016; p. 606. [Google Scholar]
  20. Frick, W.F.; Kingston, T.; Flanders, J. A review of the major threats and challenges to global bat conservation. Ann. N. Y. Acad. Sci. 2019, 1–21. [Google Scholar] [CrossRef] [PubMed]
  21. IUCN Red List of Threatened Species. Available online: http://www.iucnredlist.org. (accessed on 20 December 2019).
  22. Welch, J.N.; Beaulieu, J.M. Predicting extinction risk for data deficient bats. Diversity 2018, 10, 63. [Google Scholar] [CrossRef] [Green Version]
  23. Kingston, T.; Francis, C.M.; Zubaid, A.; Kunz, T.H. Species richness in an insectivorous bat assemblage from Malaysia. J. Trop. Ecol. 2003, 19, 67–79. [Google Scholar] [CrossRef]
  24. García-Morales, R.; Badano, E.I.; Moreno, C.E. Response of Neotropical bat assemblages to human land use. Conserv. Biol. 2013, 27, 1096–1106. [Google Scholar] [CrossRef]
  25. Meyer, C.F.J.; Struebig, M.J.; Willig, M.R. Responses of tropical bats to habitat fragmentation, logging, and deforestation. In Bats in the Anthropocene: Conservation of Bats in A Changing World; Springer International Publishing: Cham, Switzerland, 2016; pp. 63–103. [Google Scholar]
  26. Miettinen, J.; Shi, C.; Liew, S.C. Deforestation rates in insular Southeast Asia between 2000 and 2010. Glob. Chang. Biol. 2011, 17, 2261–2270. [Google Scholar] [CrossRef]
  27. Fitzherbert, E.B.; Struebig, M.; Morel, A.; Danielsen, F.; Brühl, A.C.; Donald, P.F.; Phalan, B. How will oil palm expansion affect biodiversity? Trends Ecol. Evol. 2008, 23, 538–545. [Google Scholar] [CrossRef]
  28. Struebig, M.J.; Bożek, J.; Hildebrand, M.; Rossiter, J.; Lane, S. Bat diversity in the lowland forests of the Heart of Borneo. Biodivers. Conserv. 2012, 21, 3711–3727. [Google Scholar] [CrossRef]
  29. Gaveau, D.L.A.; Kshatriya, M.; Sheil, D.; Sloan, S.; Molidena, E.; Wijaya, A.; Wich, S.; Ancrenaz, M.; Hansen, M.; Broich, M.; et al. Reconciling Forest Conservation and Logging in Indonesian Borneo. PLoS ONE 2013, 8, e69887. [Google Scholar] [CrossRef] [PubMed] [Green Version]
  30. Payne, J.; Francis, C.M.; Phillips, K.; Kartikasari, S.N. Mamalia di Kalimantan, Sabah, Sarawak dan Brunei Darussalam; Sabah Society: Kota Kinabalu, Malaysia, 1985; p. 386. [Google Scholar]
  31. Phillipps, Q.; Phillipps, K. Phillipps’ Field Guide to the Mammals of Borneo and Their Ecology, 2nd ed.; John Beaufoy Publishing Ltd.: Oxford, UK, 2018; p. 400. [Google Scholar]
  32. Lane, D.; Kingston, T.; Lee, B. Dramatic decline in bat species richness in Singapore, with implications for Southeast Asia. Biol. Conserv. 2006, 131, 584–593. [Google Scholar] [CrossRef]
  33. Kingston, T. Response of Bat Diversity to Forest Disturbance in Southeast Asia: Insights from Long-Term Research in Malaysia. In Bat Evolution, Ecology, and Conservation; Adams, R.A., Pedersen, S.C., Eds.; Springer New York: New York, NY, USA, 2013; pp. 169–185. ISBN 9781461473978. [Google Scholar]
  34. Norberg, U.M.; Rayner, J.M.V. Ecological morphology and flight in bats: Wing adaptations, flight performance, foraging strategy and echolocation. Philos. Trans. R. Soc. Lond. B Biol. Sci. 1987, 316, 335–427. [Google Scholar]
  35. Schnitzler, H.U.; Denzinger, A. Auditory fovea and doppler shift compensation: Adaptations for flutter detection in echolocating bats using CF-FM signals. J. Comp. Physiol. A 2011, 197, 541–599. [Google Scholar] [CrossRef]
  36. Schmieder, D.A.; Kingston, T.; Hashim, R.; Siemers, B.M. Sensory constraints on prey detection performance in an ensemble of vespertilionid understorey rain forest bats. Funct. Ecol. 2012, 26, 1043–1053. [Google Scholar] [CrossRef] [Green Version]
  37. Senawi, J.; Kingston, T. Clutter negotiating ability in an ensemble of forest interior bats is driven by body mass. J. Exp. Biol. 2019, 222, jeb203950. [Google Scholar] [CrossRef]
  38. Struebig, M.J.; Kingston, T.; Akbar, Z.; Mohd-Adnan, A.; Rossiter, S.J. Conservation value of forest fragments to Paleotropical bats. Biol. Conserv. 2008, 141, 2112–2126. [Google Scholar] [CrossRef]
  39. Huang, J.C.-C.; Jazdzyk, E.L.; Nusalawo, M.; Maryanto, I.; Maharadatunkamsi; Wiantoro, S.; Kingston, T. A recent bat survey reveals Bukit Barisan Selatan landscape as a chiropteran diversity hotspot in Sumatra. Acta Chiropt. 2014, 16, 413–449. [Google Scholar] [CrossRef]
  40. Taylor, P.J.; Sowler, S.; Schoeman, M.C.; Monadjem, A. Diversity of bats in the Soutpansberg and Blouberg Mountains of northern South Africa: Complementarity of acoustic and no-acoustic survey methods. S. Afr. J Wildl Res. 2013, 43, 12–26. [Google Scholar] [CrossRef] [Green Version]
  41. Linden, V.M.G.; Weier, S.M.; Gaigher, I.; Kuipers, H.J.; Weterings, M.J.A.; Taylor, P.J. Changes of bat activity, species richness, diversity and community composition over an altitudinal gradient in Soutpansberg Range, South Africa. Acta Chiropt. 2014, 16, 27–40. [Google Scholar] [CrossRef]
  42. López-González, C.; Gómez-Ruiz, E.P.; Lozano, A.; López-Wilchis, R. Activity of insectivorous bats associated with cattle ponds at La Michilía Biosphere Reserve, Durango, Mexico: Implications for conservation. Acta Chiropt. 2015, 17, 117–129. [Google Scholar] [CrossRef]
  43. Weier, S.N.; Linden, V.M.G.; Gaigher, I.; White, P.J.C.; Taylor, P.J. Changes of bat species composition over altitudinal gradients on northern and southern aspects of the Soutpansberg mountain range. S. Afr. Mammal. 2017, 81, 1–12. [Google Scholar] [CrossRef] [Green Version]
  44. Yasuma, S.; Andau, M.; Apin, L.; Yu, F.T.Y.; Kimsui, L. Identification Keys to the Mammals of Borneo; Park Management Component BBEC Programme; Sabah Parks and JICA: Kota Kinabalu, Malaysia, 2003; pp. 1–85. [Google Scholar]
  45. Das, I. Crocker Range National Park, Sabah, as a refuge for Borneo’s montane herpetofauna. Amphib. Reptile Conserv. 2006, 4, 2–11. [Google Scholar]
  46. Tuen, A.A.; Rahman, M.A.; Salleh, M.A. Preliminary Survey of Mammals at Crocker Range Park, Sabah, Malaysia; ARBEC—ASEAN Review of Biodiversity and Environmental Conservation; ARBEC: Selangor, Malaysia, 2002. [Google Scholar]
  47. Kitayama, K. An Altitudinal Transect Study of the Vegetation on Mount Kinabalu, Borneo. Vegetatio 1992, 102, 149–171. [Google Scholar] [CrossRef]
  48. Weatherbase. Available online: http://www.weatherbase.com/weather/weather.php3?s=131694&cityname=Tambunan-Sabah-Malaysia&units=metric (accessed on 3 October 2019).
  49. Francis, C.M. A Comparison of mist nets and two types of harp traps for capturing bats. J. Mammal. 1989, 70, 865–870. [Google Scholar] [CrossRef]
  50. Kingston, T.; Lim, B.L.; Akbar, Z. Bats of Krau Wildlife Reserve; Universiti Kebangsaan Malaysia Publisher: Bangi, Malaysia, 2006. [Google Scholar]
  51. Payne, J.; Francis, C.M.; Philipps, K. A Field Guide to the Mammals of Borneo; Sabah Society and World Wildlife Fund: Kota Kinabalu, Malaysia, 1985; p. 332. [Google Scholar]
  52. Anthony, E.L.P. Age Determination in Bats. In Ecological and Behavioural Methods for the Study of Bats; Kunz, T.H., Ed.; Smithsonian Institute Press: Washington, DC, USA, 1988; pp. 47–58. [Google Scholar]
  53. Broken-Brow, J.; Thompson, D. Anabat Walkabout (Version 1.4). 2017. Available online: https://www.titley-scientific.com/uk/downloads/dl/file/id/18/product/0/anabat_walkabout_user_manual_v1_4.pdf (accessed on 1 January 2020).
  54. Broken-Brow, J. Anabat Insight Analysis Software (Version 1.7). 2018. Available online: https://www.titley-scientific.com/uk/downloads/dl/file/id/51/product/0/anabat_insight_user_manual_v1_7.pdf (accessed on 1 January 2020).
  55. R Core Team. R: A Language and Environment for Statistical Computing; R Foundation for Statistical Computing: Vienna, Austria, 2017. [Google Scholar]
  56. Chao, A.; Gotellie, N.J.; Hsieh, T.C.; Sander, E.L.; Ma, K.H.; Colwell, R.K.; Ellison, A.M. Rarefaction and extrapolation with Hill numbers: A framework for sampling and estimation in species diversity studies. Ecol. Monogr. 2014, 84, 45–67. [Google Scholar] [CrossRef] [Green Version]
  57. Hsieh, T.C.; Ma, K.H.; Chao, A. iNEXT: An R package for interpolation and extrapolation of speices diversity (Hill Numbers). Methods Ecol. Evol. 2016, 7, 1451–1456. [Google Scholar] [CrossRef]
  58. Francis, C.M.; Hill, J.E. A review of the Bornean Pipistrellus (Mammalia: Chiroptera). Mammalia 1986, 50, 43–56. [Google Scholar] [CrossRef]
  59. Medway, L. Mammals of Borneo. Field keys and an annotated checklist. Mon. Malay. Brch. R. Asiat. Soc. 1977, 7, 1–72. [Google Scholar]
  60. Wilson, D.E.; Mittermeier, R.A. (Eds.) Handbook of the Mammals of the World. Vol. 9. Bats; Lynx Edicions: Barcelona, Spain, 2013; pp. 1–1008. [Google Scholar]
  61. Struebig, M.J.; Christy, L.; Pio, D.; Meijaard, E. Bats of Borneo: Diversity, distributions and representation in protected areas. Biodivers. Conserv. 2010, 19, 449–469. [Google Scholar] [CrossRef]
  62. Kingston, T.; Jones, G.; Akbar, Z.; Kunz, T.H. Echolocation signal design in Kerivoulinae and Murininae (Chiroptera: Vespertilionidae) from Malaysia. J. Zool. Lond. 1999, 249, 359–374. [Google Scholar] [CrossRef]
  63. Kingston, T.; Jones, G.; Akbar, Z.; Kunz, T.H. Resource partitioning in rhinolophoid bats revisited. Oecologia 2000, 124, 332–342. [Google Scholar] [CrossRef]
  64. Hughes, A.C.; Satasook, C.; Bates, P.J.J.; Soisook, P.; Sritongchuay, T.; Jones, G.; Bumrungsri, S. Using echolocation calls to identify Thai bat species: Vespertilionidae, Emballonuridae, Nycteridae and Megadermatidae. Acta Chiropt. 2011, 13, 447–455. [Google Scholar] [CrossRef]
  65. Collen, A.L. The Evolution of Echolocation in Bats: A Comparative Approach. Ph.D. Thesis, University College London, London, UK, 2012. [Google Scholar]
  66. Kusuminda & Kappa. First record of a Wrinkle-lipped Free-tailed Bat Chaerephon plicatus Buchannan, 1800 (Mammalia: Chiroptera: Molossidae) colony in Sri Lanka, with notes on echolocation calls and taxonomy. J. Threat Taxa 2017, 9, 10115–10120. [Google Scholar] [CrossRef] [Green Version]
  67. Huang, J.C.-C.; Rustiati, E.L.; Nusalawo, M.; Kingston, T. Echolocation and roosting ecology determine sensitivity of forest-dependent bats to coffee agriculture. Biotropica 2019, 51, 757–768. [Google Scholar] [CrossRef]
  68. Wordley, C.F.R.; Sankaran, M.; Mudappa, D.; Altringham, J.D. Bats in the Ghats: Agricultural intensification reduces functional diversity and increases trait filtering in a biodiversity hotspot in India. Biol. Conserv. 2017, 210, 48–55. [Google Scholar] [CrossRef]
  69. Cortés-Delgado, N.; Sosa, V.J. Do bats roost and forage in shade coffee plantations? A perspective from the frugivorous bat Sturnira hondurensis. Biotropica 2014, 26, 624–632. [Google Scholar] [CrossRef]
  70. Struebig, M.J.; Turner, A.; Giles, E.; Lasmana, F.; Tollington, S.; Bernard, H.; Bell, D. Quantifying the biodiversity value of repeatedly logged rainforests: Gradient and comparative approaches from Borneo. Adv. Ecol. Res. 2013, 48, 183–224. [Google Scholar]
  71. Phommexay, P.; Satasook, C.; Bates, P.; Pearch, M.; Bumrungsri, S. The impact of rubber plantations on the diversity and activity of understorey insectivorous bats in souther Thailand. Biodivers. Conserv. 2011, 20, 1441–1456. [Google Scholar] [CrossRef]
  72. Meyer, C.F.J. Methodological challenges in monitoring bat population- and assemblage-level changes for anthropogenic impact assessment. Mammal. Biol. 2015, 80, 159–169. [Google Scholar] [CrossRef]
  73. Start, A.N. The Feeding Biology in Relation to Food Sources of Nectarivorous Bats (Chiroptera: Macroglossinae) in Malaysia. Ph.D. Thesis, University of Aberdeen, Aberdeen, Scotland, 1975. [Google Scholar]
  74. Wordley, C.F.R.; Sankaran, M.; Mudappa, D.; Altringham, J.D. Heard but not seen: Comparing bat assemblages and study methods in a mosaic landscape in the Western Ghats of India. Ecol. Evol. 2017, 8, 3883–3894. [Google Scholar] [CrossRef]
  75. Furey, N.M.; Mackie, I.J.; Racey, P.A. Bat diversity in Vietnamese limestone karst areas and the implications of forest degradation. Biodivers. Conserv. 2010, 19, 1821–1838. [Google Scholar] [CrossRef]
  76. Acharya, P.R.; Racey, P.A.; Sotthibandhu, S.; Bumrungsri, S. Feeding behavior of the dawn bat (Eonycteris spelaea) promotes cross pollination of economically important plants in Southeast Asia. J. Pollinat. Ecol. 2015, 15, 44–50. [Google Scholar]
  77. Evelyn, M.J.; Stiles, D.A. Roosting Requirements of Two Frugivorous Bats (Sturnira lilium and Artibeus intermedius) in Fragmented Neotropical Forest. Biotropica 2003, 35, 405–418. [Google Scholar] [CrossRef]
  78. Motoko, F.; Irham, M.; Samejima, H.; Wijamukti, S.; Haryadi, D.S.; Muhammad, A. Mammals & Birds of Bukit Batu Area of Giam Siak Kecil-Bukit Batu Biosphere Reserve, Riau, Indonesia; Kyoto Working Papers on Area Studies (G-COE Series); Center of Southeast Asia Studies: Ann Arbor, MI, USA, 2012. [Google Scholar]
  79. Licona, M.; McCleery, R.; Collier, B.; Brightsmith, D.J.; Lopez, R. Using ungulate occurrence to evaluate community-based conservation within a biosphere reserve model: Ungulate occurrence in Amazon. Anim. Conserv. 2011, 14, 206–214. [Google Scholar] [CrossRef]
  80. Woldegeorgis, G.; Wube, T. A survey on mammals of the Yayu forest in Southwest Ethiopia. Ethiop. J. Sci. 2012, 35, 135–138. [Google Scholar]
  81. Tabeni, S.; Spirito, F.; Ojeda, R.A. Conservation of small and medium-sized mammals following native woodland regrowth: A case study in a long-term UNESCO Biosphere Reserve, Argentina. J. Arid. Environ. 2013, 88, 250–253. [Google Scholar] [CrossRef]
  82. Nurul-Ain, E.; Rosli, H.; Kingston, T. Resource availability and roosting ecology shape reproductive phenology of rain forest insectivorous bats. Biotropica 2017, 49, 382–394. [Google Scholar] [CrossRef]
  83. Phelps, K.; Jose, R.; Labonite, M.; Kingston, T. Assemblage and species threshold responses to environmental and disturbance gradients shape bat diversity in disturbed cave landscapes. Diversity 2018, 10, 55. [Google Scholar] [CrossRef] [Green Version]
  84. Boyles, J.G.; Storm, J.J. The perils of picky eating: Dietary breadth is related to extinction risk in insectivorous bats. PLoS ONE 2007, 2, e672. [Google Scholar] [CrossRef] [PubMed] [Green Version]
  85. Ewers, R.M.; Boyle, M.J.W.; Gleave, R.A.; Plowman, N.S.; Benedick, S.; Bernard, H.; Bishop, T.R.; Bakhtiar, E.Y.; Chey, V.K.; Chung, A.Y.C.; et al. Logging cuts the functional importance of invertebrates in tropical rainforest. Nat. Commun. 2015, 6, 6836. [Google Scholar] [CrossRef]
  86. Fukuda, D.; Tisen, O.B.; Momose, K.; Sakai, S. Bat diversity in the vegetation mosaic around a lowland dipterocarp forest of Borneo. Raffles B. Zool. 2009, 57, 213–221. [Google Scholar]
  87. Cisneros, L.M.; Burgio, K.R.; Dreiss, L.M.; Klingbeil, B.T.; Patterson, B.D.; Presley, S.J.; Willig, M.R. Multiple dimensions of bat biodiversity along an extensive tropical elevational gradient. J. Anim. Ecol. 2014, 83, 1124–1136. [Google Scholar] [CrossRef]
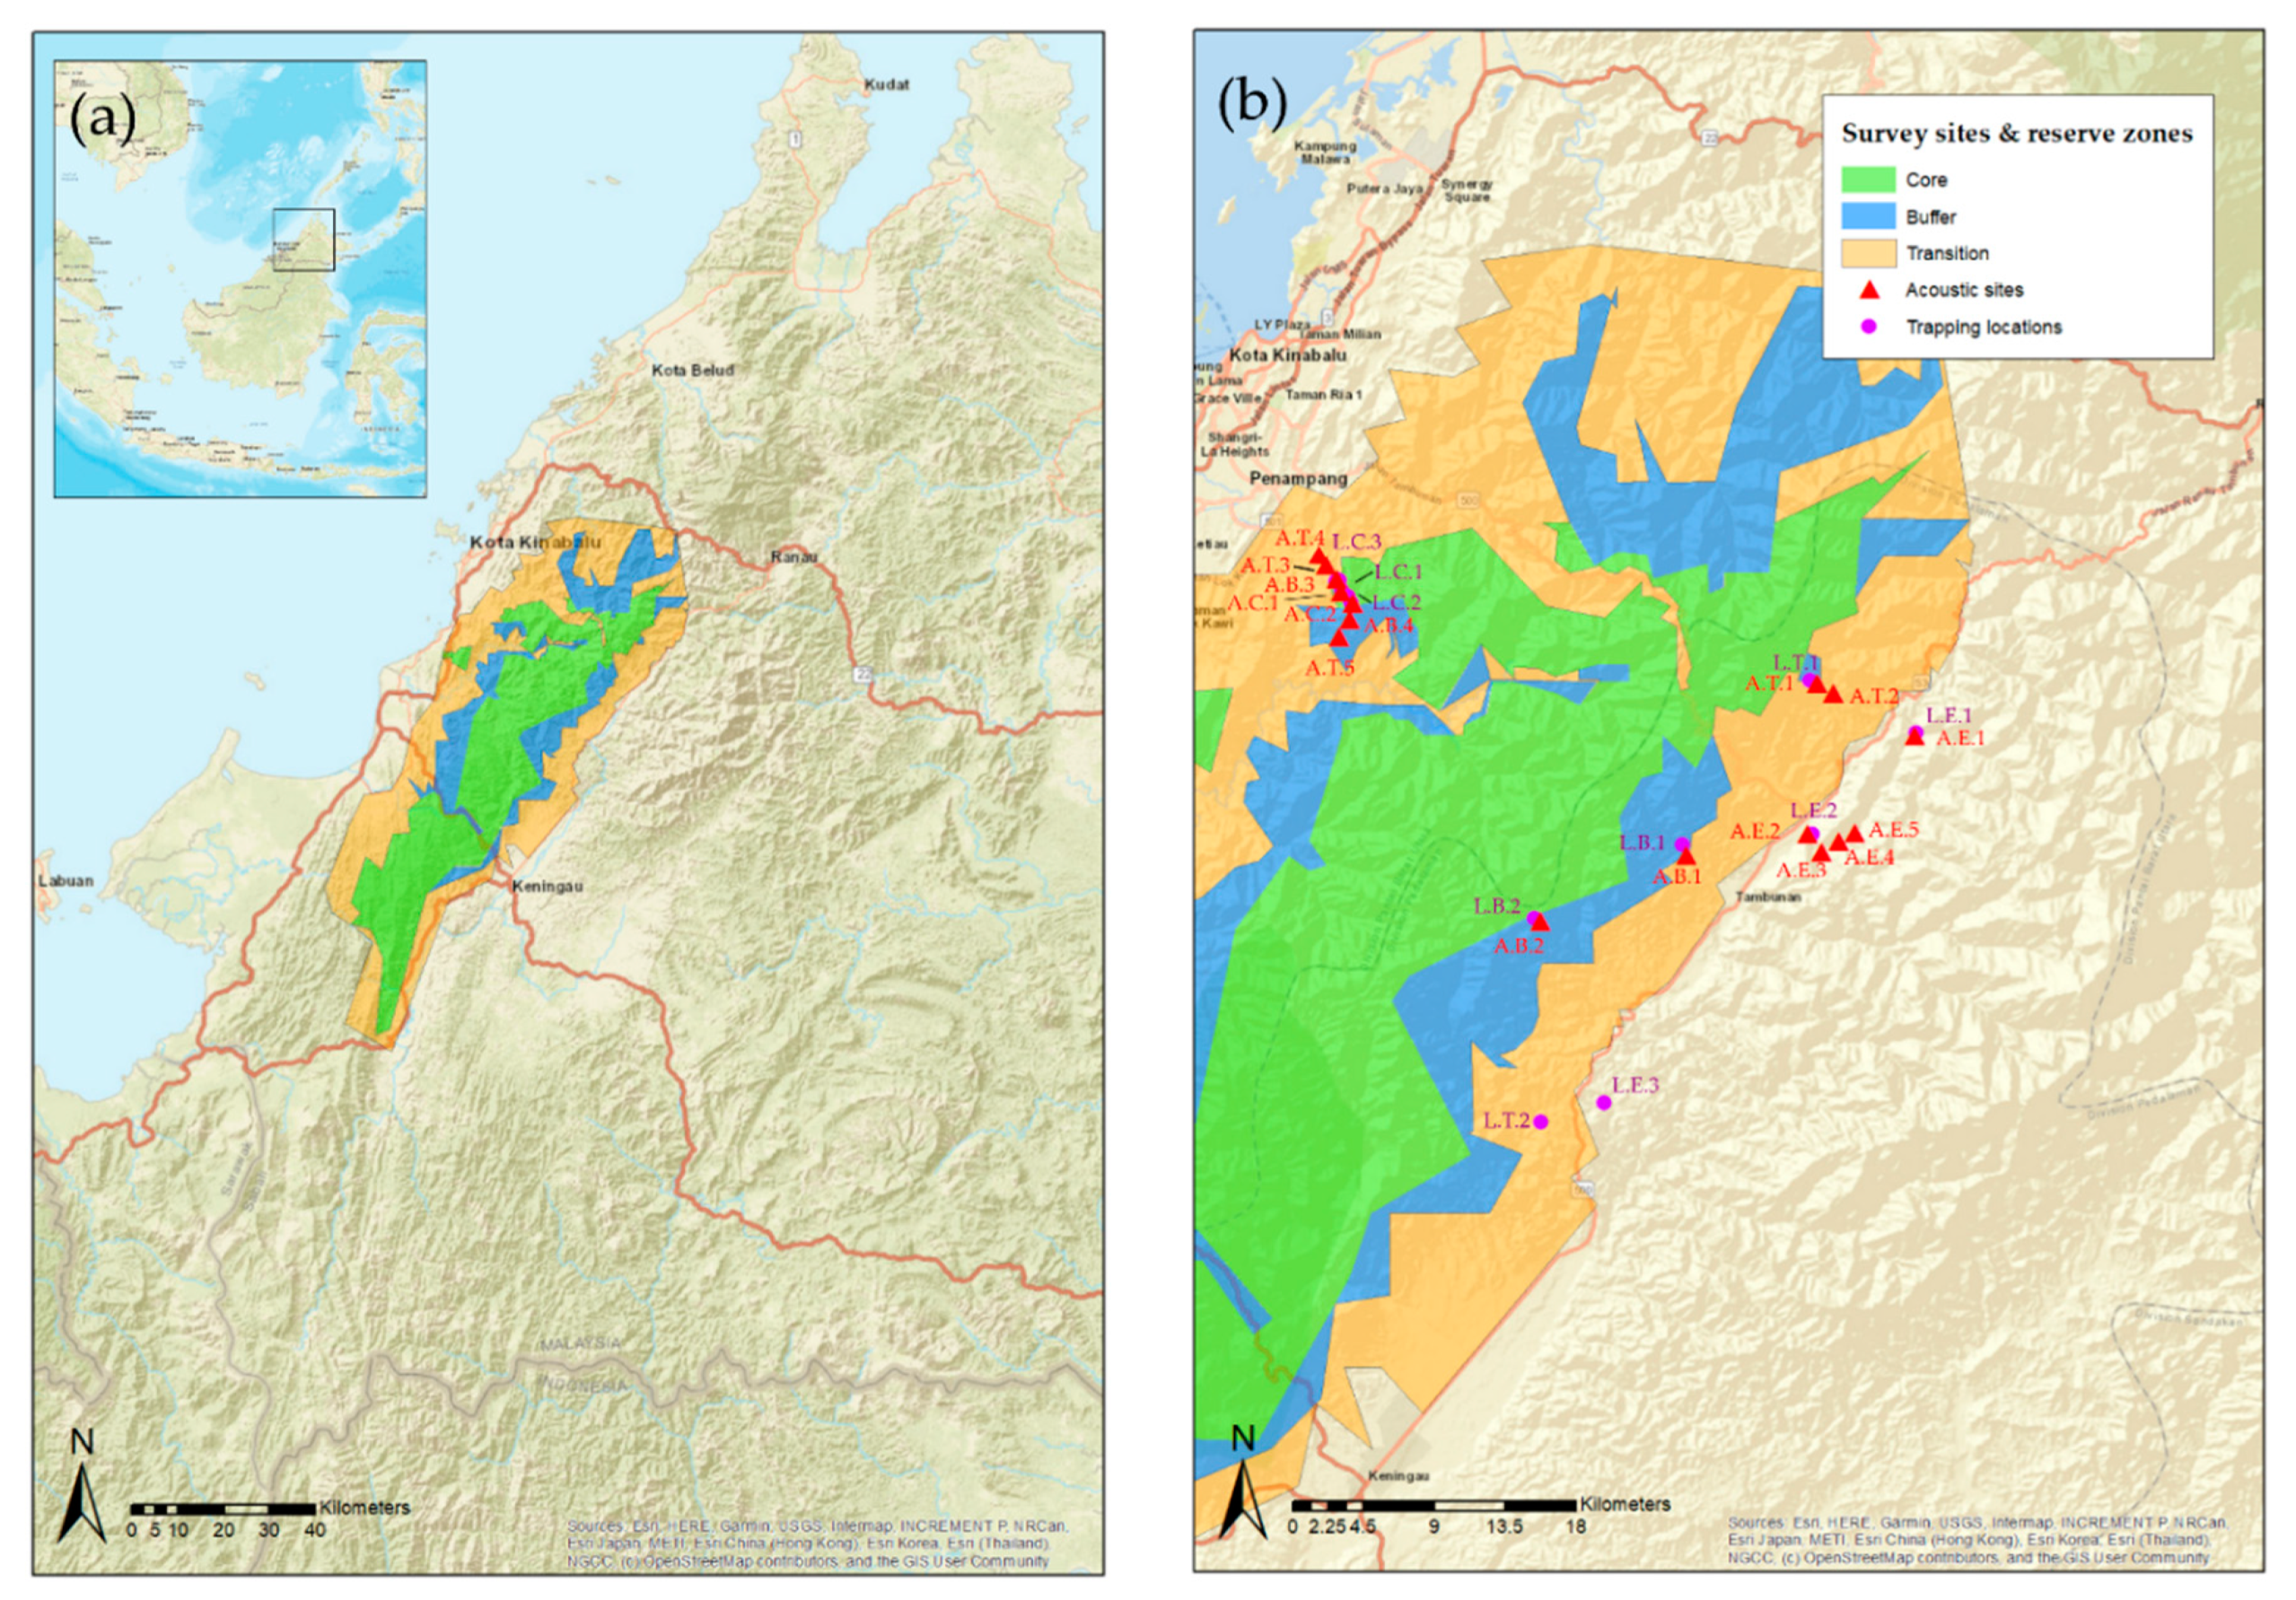
Figure 1. Map of study area in Crocker Range, Sabah, Malaysia. (a) Location of the Crocker Range Biosphere Reserve in Sabah, Malaysia showing the distribution of the MAB zones green—core, blue—buffer, yellow—transition. Inset illustrates the location of Sabah on Borneo. (b) Area of sampling sites, containing trapping and acoustic transect locations L—live trapping sites, A—acoustic sites, C—Core, B—Buffer, T—transition, E—extralimital agriculture.
Diversity 12 00060 g001
Figure 2. Photographic portraits of the 30 species captured in Crocker Range Biosphere Reserve (CRBR). New locality records in CRBR indicated by yellow star. (1) Balionycteris maculata (2) Cynopterus brachyotis (3) Cynopterus minutus (4) Eonycteris major (5) Megaerops ecuadatus (6) Macroglossus minimus (7) Rousettus amplexicaudatus (8) Penthetor lucasi (9) Rhinolophus acuminatus (10) Rhinolophus borneensis (11) Rhinolophus luctus (12) Rhinolophus sedulus (13) Rhinolophus trifoliatus (14) Hipposideros cervinus (15) Hipposideros diadema (16) Hipposideros dyacorum (17) Hipposideros galeritus (18) Hipposideros ridleyi (19) Nycteris tragata (20) Hypsugo cf kitcheneri (21) Kerivoula hardwickii (22) Kerivoula intermedia (23) Kerivoula papiliosa (24) Kerivoula pellucida (25) Phoniscus atrox (26) Murina suilla (27) Glyschropus tylopus (28) Tylonycterus pachypus (29) Tylonycterus robustula (30) Pipistrellus javanicus.
Diversity 12 00060 g002
Figure 3. Mao Tau (rarefaction) curves for species captured in harp traps (a) and mist nets (b). Species richness was rarefied by harp trap nights or mist net meter/hour and rescaled to individuals for the four zones of the Crocker Range Biosphere Reserve, Borneo, Malaysia. Colors and symbols indicate different MAB zones, with symbols marking the reference sample size. Interpolated lines are the rarefaction curves and extrapolated lines are estimates for double the reference sample size. Shaded areas are the 95% confidence intervals for each curve.
Diversity 12 00060 g003
Figure 4. Violin plots demonstrating the variation in acoustic bat activity recorded within the four zones of the Crocker Range Biosphere Reserve, Borneo, Malaysia. Colors and symbols indicate different Man and Biosphere (MAB) zones. N = total number of pulses recorded per zone.
Diversity 12 00060 g004
Figure 5. Differences in call structure between the acoustic bat activity recorded across the four zones of the Crocker Range Biosphere Reserve, Borneo, Malaysia. (a) Density plots showing the variability of call duration (ms) within each zone; (b) scatterplot showing the relationship between two call variables within each zone; (c) density plots showing variability in peak frequency (kHz) within each zone; and (d) principal component analysis of call structure observed in each zone using six call characteristics, where “Fstart kHz”, “Fmax kHz” and “Curvature” were the most heavily weighted components considering both dimensions.
Diversity 12 00060 g005
Table 1. Number of individual captures (from harp traps (HT), mist nets (MN) and stacked nets (SN)) of 30 bat species grouped into four zones in the Crocker Range Man and Biosphere Reserve and surrounding agriculture (see Figure 1). Effort determined by the number of hours actively trapping. Mist nets and stack net hours calculated by multiplying the net meter length with active netting hours (length (m) × hour).
TaxaFECore Buffer Transition Extralimital Grand Total
HTMN/SNTotal
Captures
HTMN/SNTotal
Captures
HTMN/SNTotal
Captures
HTMN/SNTotal
Captures
Captures
Effort (Hours) 6991569 2481307 100258 3321291
Pteropodidae
Balionycteris maculataP134 22 0 33 9
Cynopterus brachyotisP 1010 88 77 33 28
* Cynopterus minutusP 77 0 0 55 12
Eonycteris majorP 0 11 0 22 3
Megaerops ecuadatusP224 0 0 0 4
Macroglossus minimusP112 88 0 2929 39
Penthetor lucasiP 0 11 0 11 2
* Rousettus amplexicaudatusP 0 0 0 11 1
Hipposideridae
Coelops robinsoniF X 0 0
Hipposideros cervinusF9 9 0 0 0 9
Hipposideros diademaF/E 0 11 0 1
Hipposideros dyacorumF1 1 0 0 0 1
Hipposideros galeritusF 0 1 1 0 0 1
* Hipposideros ridleyiF 0 2 2 0 0 2
Rhinolophidae
Rhinolophus acuminatusF 0 0 1 1 0 1
Rhinolophus borneensisF 0 0 4 4 0 4
Rhinolophus luctusF/E 0 0 0 11 1
Rhinolophus sedulusF1 1 1 1 0 11 3
Rhinolophus trifoliatusF9110 1 1 0 11 12
Vespertilionidae
Glischropus tylopusE6311 ** 2424 33 44 42
* Hypsugo cf kitcheneriE 0 0 1 ** 0 1
* Kerivoula intermediaF 0 4 4 0 0 0
Kerivoula papillosaF 0 1 1 3 3 0 4
Kerivoula pellucidaF 0 0 0 1 1 1
Kerivoula hardwickiiF15 15 1 1 0 2 2 18
Murina suillaF 0 1 1 0 0 1
Pipistrellus javanicusE 0 11 0 0 1
* Phoniscus atroxF1 1 0 0 0 1
* Tylonycteris pachypusE 66 22 0 0 8
Tylonycteris robustulaE101020 22325 0 0 45
Nycteridae
* Nycteris tragataF1 1 0 0 0 1
Total Captures 5943102 146785 9319 35154 260
Species Richness 12916 9918 326 21113 31
* Indicates new species record in CRBR. ** Additional captures made with hand nets, X—identified from acoustic transect. Foraging Ensemble (FE) is coded as P—plant visiting, O—open-space insectivore, E—edge or gap insectivore, F—forest interior insectivore.
Table 2. Morphological data for 30 bat species from Crocker Range Biosphere Reserve. (Mean ± SD); Smallest value in data set, Min.; Largest value in data set, Max.; M, male; F, female, n = number of individuals.
TaxaMeasurements
Mean ± SD
Min–Max (n)
Forearm Length (mm) Body Mass (g)
MF MF
Pteropodidae
Balionycteris maculata 41.59 ± 2.28
36.9–44.6 (9)
14.89 ± 3.16
9.25–19 (9)
Cynopterus brachyotis58.79 ± 3.14
54.3–66.1 (12)
59.07 ± 2.49
53.6–64.7 (15)
28.93 ± 4.36
20–38.1 (13)
31.67 ± 5.92
25–44 (15)
Cynopterus minutus57.35 ± 0.56
56.7–58.1 (6)
56.73 ± 1.34
54. 1–57.7
24.33 ± 2.07
22–28
29.33 ± 6.35
19–37 (6)
Eonycteris major84.8 ± 3.25
82.5–87.1 (2)
76.5 (1) 120 (1)77 (1)
Megaerops ecuadatus53.4 (1)52.23 ± 1.05
51.2–53.3 (3)
23 (1)25.33 ± 4.16
22–30 (3)
Macroglossus minimus40.51 ± 1.63
37.9–44.3 (15)
40.56 ± 1.36
38.1–43.7 (20)
16.99 ± 2.99
10–20.5 (15)
17.49 ± 3.31
12.25–24 (19)
Penthetor lucasi60.2 (1)60.5 (1) 36 (1)42 (1)
Rousettus amplexicaudatus 68.4 (1) 44 (1)
Hipposideridae
Hipposideros cervinus50.1 ± 1.05
49.1–51.2 (3)
51.93 ± 1.19
50–53.7 (6)
10.5 ± 0.87
10–11.5 (3)
11.16 ± 1.21
9.5–12.5 (6)
Hipposideros diadema 88.7 (1) 51 (1)
Hipposideros dyacorum42.3 (1) 7 (1)
Hipposideros galeritus49.7 (1) 9.5 (1)49.7 (1)
Hipposideros ridleyi49.2 (1)48 (1) 8.25 (1)9.25 (1)
Rhinolophidae
Rhinolophus acuminatus 49.4 (1) 14.25 (1)
Rhinolophus borneensis40.25 ± 0.07
40.2–40.3 (2)
43.95 ± 0.5
43.6–44.3 (2)
9.5 (2)8.88 ± 0.53
8.5–9.25 (2)
Rhinolophus luctus64 (1) 29 (1)
Rhinolophus sedulus 46.97 ± 6.7
42.1–54.6 (3)
14.33 ± 5.77
11–21 (3)
Rhinolophus trifoliatus52.61 ± 2.3
48.7–54.9 (7)
53.16 ± 1.87
49.9–54.6 (5)
14.61 ± 1.98
12.5–17.25 (5)
16.65 ± 1.90
14.25–19 (7)
Nycteridae
Nycteris tragata 51.6 (1) 17.5 (1)
Vespertilionidae
Glischropus tylopus30.44 ± 0.84
28.7–31.9 (20)
30.70 ± 2.2
22.2–33.3 (22)
4.44 ± 0.43
3–5 (20)
4.46 ± 0.72
3.4–6.5 (22)
Hypsugo cf. kitcheneri35 (1) 5.75 (1)35 (1)
Kerivoula intermedia28.75 ± 0.31
28.4–29.1 (4)
2.88 ± 0.14
2.75–3 (4)
28.75 ± 0.31
28.4–29.1 (4)
Kerivoula papillosa38.4 ± 8.1
29.1–43.9 (3)
37.1 (1) 8.75 ± 3.46
4.75–10.75 (3)
6 (1)
Kerivoula pellucida 31.1 (1) 5.5 (1)
Kerivoula hardwickii31.95 ± 1.09
30.1–33.5 (13)
33.12 ± 1.183
1.5–34.8 (5)
3.56 ± 0.41
2.5–4 (12)
4.65 ± 0.34
4.25–5 (5)
Murina suilla 31.4 (1) 4.75 (1)
Pipistrellus javanicus 34.3 (1) 6 (1)
Phoniscus atrox33.9 (1) 4.5 (1)
Tylonycteris pachypus25.36 ± 0.98
24.3–26.4 (5)
25.63 ± 0.97
24.8–26.7 (3)
3.35 ± 0.42
2.75–3.7 (5)
3.33 ± 0.58
3–4 (3)
Tylonycteris robustula28.96 ± 2.41
25.4–38.6 (22)
28.19 ± 3.15
18.3–38.3 (23)
7.39 ± 1.24
4.25–10 (22)
6.80 ± 1.0
4–9.5 (23)