Article

Prioritizing Areas for Land Conservation and Forest Management Planning for the Threatened Canada Warbler (Cardellina canadensis) in the Atlantic Northern Forest of Canada

by
Alana R. Westwood
1,*,
J. Daniel Lambert
2,
Leonard R. Reitsma
3 and
Diana Stralberg
1
1
Boreal Avian Modelling Project, Department of Renewable Resources, University of Alberta, 751 General Services Building, AB T6G 2H1, Canada
2
Northern Woodlands, P.O. Box 270, Lyme, NH 03768, USA
3
Department of Biological Sciences, Plymouth State University, 17 High Street, Plymouth, NH 03264, USA
*
Author to whom correspondence should be addressed.
Diversity 2020, 12(2), 61; https://doi.org/10.3390/d12020061
Submission received: 14 December 2019 / Revised: 28 January 2020 / Accepted: 30 January 2020 / Published: 4 February 2020
(This article belongs to the Special Issue Boreal Bird Ecology, Management and Conservation)

Abstract

:
Populations of Canada Warbler (Cardellina canadensis) are declining in Canada’s Atlantic Northern Forest. Land conservancies and government agencies are interested in identifying areas to protect populations, while some timber companies wish to manage forests to minimize impacts on Canada Warbler and potentially create future habitat. We developed seven conservation planning scenarios using Zonation software to prioritize candidate areas for permanent land conservation (4 scenarios) or responsible forest management (minimizing species removal during forest harvesting while promoting colonization of regenerated forest; 3 scenarios). Factors used to prioritize areas included Canada Warbler population density, connectivity to protected areas, future climate suitability, anthropogenic disturbance, and recent Canada Warbler observations. We analyzed each scenario for three estimates of natal dispersal distance (5, 10, and 50 km). We found that scenarios assuming large dispersal distances prioritized a few large hotspots, while low dispersal distance scenarios prioritized smaller, broadly distributed areas. For all scenarios, efficiency (proportion of current Canada Warbler population retained per unit area) declined with higher dispersal distance estimates and inclusion of climate change effects in the scenario. Using low dispersal distance scenarios in decision-making offers a more conservative approach to maintaining this species at risk. Given the differences among the scenarios, we encourage conservation planners to evaluate the reliability of dispersal estimates, the influence of habitat connectivity, and future climate suitability when prioritizing areas for conservation.

1. Introduction

Canada Warbler (Cardellina canadensis) is a Neotropical migratory songbird that breeds in forests of the eastern U.S. and across Canadian forests from Nova Scotia to the Yukon [1]. Due to ongoing population declines (71% decline reported from 1970–2010 [2]), it is listed as Threatened in Canada [3] and a Species of Greatest Conservation Need in nearly every U.S. state where it breeds (e.g., [4]). The Canada Warbler International Conservation Initiative (CWICI) has urged research and conservation actions to help reverse the population decline, including identification of suitable habitat and development of best management practices for the breeding grounds [5].
In the Atlantic Northern Forest (Bird Conservation Region (BCR) 14), Canada Warbler population declines from 1970–2017 have been much steeper than those observed in other BCRs by the Canadian Breeding Bird Survey [6]. Canada Warblers predominantly use wet forests [7,8,9,10] and post-harvest deciduous and mixed-wood forests approximately 10–30 years of age [11,12]. Management guidelines recently produced for BCR 14 [13] (see Supplementary Materials) describe two different approaches to promote recovery of this species: permanent land conservation (hereafter ‘land conservation’, or ‘LC’) and responsible forest management (hereafter ‘forest management’, or ‘FM’). These approaches were developed in tandem with, and designed for, two different user communities with distinct needs: (1) land conservancies and government agencies with a mandate to protect species and habitat in situ; and (2) forest industry staff and government agencies with a mandate to engage in sustainable development of forest resources while minimizing impacts to migratory birds and species at risk. LC scenarios (summarized in Westwood et al. [13]) (see Supplementary Materials) are intended to support conservation activities such as in-situ permanent protection of forested areas supporting Canada Warbler populations, forest blocks with low edge-to-interior ratios, and suitable habitat patches connected by forested corridors to other potential breeding sites to facilitate dispersal. FM scenarios are intended to support responsible forest management activities such as providing a continuous current supply of breeding habitat on the landscape, avoiding harvesting and road building in population centers and forested wetlands, and locating areas to implement silvicultural systems (such as shelterwood cutting) most likely to produce desired conditions for breeding habitat 12–20 years post-harvest, among other strategies [13] (see Supplementary Materials).
Forest fragmentation has been postulated as a cause of population declines for this species [14,15], so habitat connectivity on the breeding grounds is likely to play an important role in population recovery, especially given the high degree of conspecific attraction that has been documented [16]. Climate change is another important consideration for Canada Warbler, as its range is expected to retract under warming conditions [17]. Conservation planning software makes it possible to account for connectivity, climate change, and other factors when prioritizing areas for land conservation and forest management [18,19,20].
Most analyses using conservation planning software are designed to support the planning or evaluation of protected area networks (e.g., [21,22,23]). Other objectives include locating zones of interest for further study [24], evaluating trade-offs between land uses [25,26], or estimating the value of ecosystem services [27]. Conservation planning algorithms can be informed by estimates of dispersal, which is an important factor in wildlife habitat selection and response to climate change (i.e., the ability to move from current to future suitable habitats). For the Canada Warbler, published estimates of natal dispersal (distance from an individual’s birth site to their breeding site) are not available. Estimates of natal dispersal for other passerines are frequently based on small sample sizes with a great deal of uncertainty, and estimates for species of similar sizes to the Canada Warbler range widely [28,29,30,31]. Conservation planning exercises are typically based on single dispersal estimates, and the implications of uncertainty in these estimates are unknown. Furthermore, conservation planning algorithms often rely on species distribution models which predict habitat suitability, species occurrence, or population density across a landscape. However, these models are inherently more uncertain in under-sampled areas, and this uncertainty is also not always accounted for during conservation prioritization exercises.
Conservation prioritization exercises are most useful when they directly inform resource allocation decisions across landscapes [32]. Therefore, we consulted a variety of government, conservation, and forest industry stakeholders to develop regional scenarios for prioritization [33] (see Supplementary Materials). We then used the program Zonation [34] to evaluate priority areas for land conservation and forest management to support Canada Warbler populations in the Canadian portion of BCR 14. One set of scenarios was designed to prioritize areas for long-term land conservation (including future climate change and connectivity to protected areas) and another set of scenarios prioritized areas for forest management on tenured land managed by timber companies.
We evaluated three estimates of natal dispersal distance for each set of scenarios. We evaluated the impact of these factors on spatial outcomes and identified areas that were consistently prioritized. We also compared conservation efficiency (proportion of the species’ current estimated population protected per unit area) across scenario types and dispersal distance estimates. The resulting rankings of the landscape in BCR14 are intended to support decisions for maintaining and managing Canada Warbler habitat in this region by the two different user groups already described.

2. Materials and Methods

2.1. Study Area

The North American Bird Conservation Initiative (NABCI) defines BCRs as ecologically distinct regions that share similar bird communities, habitats, and resource management issues [35]. We selected the scale of the study as the Canadian portion of the Atlantic Northern Forest (BCR 14) for three reasons. First, BCRs are used by Canadian government agencies as planning and management units for other bird species at risk (e.g., [24,36]). Secondly, the Canada Warbler shows evidence of differential habitat selection across BCRs [37], and we wished to limit the modelling to a population with shared habitat requirements. Finally, limiting the scale of the study to the Canadian portion of the BCR allowed us to use interoperable data and take advantage of existing Canadian bird conservation and forestry networks comprised of government agencies, industry, and NGOs.
The Canadian portion of the Atlantic Northern Forest encompasses 20.4 million ha, including Nova Scotia, Prince Edward Island, New Brunswick, and the Gaspé Peninsula of Québec ([38]; Figure 1). This forest is within the Appalachian-Acadian Ecoregion, which also includes much of Maine and Vermont, and parts of New York and New Hampshire. Human activities in this area have influenced 98.2% of the land area [39].
The Atlantic Northern Forest is at the interface of two biomes, and includes tree species from the northern boreal forest (e.g., Black Spruce Picea mariana, Eastern White Pine Pinus strobus, Balsam Fir Abies balsamea) and southern temperate deciduous forest (e.g., Red Spruce Picea rubens, Red Maple Acer rubrum, Sugar Maple Acer saccharum). Land ownership is predominantly private, with the remainder under stewardship of the provinces. Known areas that are permanently protected from development in this region comprise 1.4 million ha (7% of the land area), including national and provincial parks, wilderness areas, and private protected landholdings [40]. Timberlands leased or owned by industrial forestry companies cover 6.7 million ha (33% of the land area). We did not include privately owned woodlots or timberlands in our analyses as we were unable to obtain a comprehensive land use map for such properties.

2.2. Scenario Development

Recent habitat guidelines for Canada Warbler in the Atlantic Northern Forest identified two types of stewardship approaches that could benefit this species: land conservation and forest management [13] (see Supplementary Materials). Based on solicited input from land trust representatives, agency and industrial forest managers, and scientists familiar with Canada Warbler ecology, we developed four scenarios for land conservation and three for forest management (Table 1; see [33] (see Supplementary Materials) for a description of stakeholder engagement and [13] (see Supplementary Materials) for specific details on recommended responsible forest management practices for maintaining Canada Warbler populations on the landscape).

2.3. Zonation Spatial Conservation Prioritization

2.3.1. Data layers and Pre-Processing

To develop the seven scenarios, we acquired input data in three categories: avian, landcover, and administrative boundaries (Table 2).
Our avian datasets were obtained from the Boreal Avian Modelling (BAM) Project [41,42,43]. The BAM project holds the largest dataset of boreal and hemiboreal observations of birds in North America and accounts for heterogeneity in survey protocols by correcting abundance estimates for detectability [42]. To determine suspected breeding locations, we divided point occurrences of Canada Warblers into two groups (CAWA presence 2005–2009 and CAWA presence 2010–2015) to capture areas showing persistent observations of Canada Warblers over time. Including recent presence information allows conservation planners to locate areas of high likelihood of extant Canada Warblers to consider for protection, and forest managers to avoid or operations in areas where they may harm, kill, or harass Canada Warbler or their nests or eggs (which are illegal activities under Canada’s Species At Risk Act, S.C. 2002). To predict Population density in a 1 km grid across the study area, we used a national-scale species distribution model for Canada Warbler based on landcover and disturbance data [44]. The standard deviation of the population density estimates across multiple data subsets was used to represent Model uncertainty. As Zonation uses an additive approach to discount cell values by uncertainty, we chose a measure of uncertainty in the same units as the population density estimates (standard deviation), rather than using a standardized measure such as coefficient of variation. We note that no data were available on productivity or occupancy for the Canada Warbler in this region, nor fine-scale data to describe habitat characteristics (e.g., Lidar).
To account for projected climate-induced shifts in abundance, we used 4 km population density predictions from models based on climate, land-use, and topography covariates as compared to the baseline population density (detailed description in [45]). CAWA climate baseline included predicted population density from 1961–1990. Future projections were for the 2041–2070 time period (CAWA climate 2050) based upon a high-end, business-as-usual emissions scenario (A2), averaged over an ensemble of four global climate models from the Coupled Model Intercomparison Project (CMIP3) dataset [46]. Although these future projections do not incorporate anticipated lags in vegetation responses to climate change [17], we considered them a reasonable representation of long-term future habitat suitability for this species, which in this region is projected to experience relatively moderate shifts in density, as opposed to wholesale range shifts [47].
Administrative boundary layers included political and administrative borders (Provinces/ states and BCR14), known forestry tenures (Working lands: lands owned or leased by forestry companies for the purpose of industrial development; [47]), and Protected areas meeting any of the International Union for the Conservation of Nature protected areas classifications I-IV (lands protected for long-term biological values, [40]).
Landcover layers included Water bodies derived from 1:10,000 aerial imagery and layers of Wet-poor habitat and Upland habitat (derived from the Northeastern Habitat Types Mapping Initiative; [48]). All spatial data were processed using ArcGIS 10.2.2 [49]. All input and output data layers were rasters in geotiff format with a cell size of 1000 × 1000 m, projected in Canada Lambert Conformal Conic.

2.3.2. Prioritization Analysis

We ran all analyses using Zonation 4.0 [18] with a mask of the land boundaries of the Atlantic Northern Forest (an inverse of the layer Water bodies) applied to eliminate oceans and lakes. Detailed run settings and input files are available at https://github.com/borealbirds/cawa-bcr-14. Zonation identifies areas with high concentrations of features, which are the items that are desirable to prioritize for the end use (e.g., population density, land ownership, etc.). Functions are used to apply rules to determine how the features interact and how connectivity between the features are prioritized or penalized [34].
Connectivity functions in Zonation rely on estimates of dispersal distance to determine whether features or populations are ‘connected.’ Due to scarce species-specific dispersal data, Carroll et al. [50] completed a prioritization analysis using an estimated dispersal distance (not specific to natal or breeding) of 10 km for landbird species. For Canada Warbler, there are no published natal dispersal estimates and only one known direct observation (10 km; L. Reitsma, unpublished data). Because natal dispersal distances of landbirds are correlated with wing length and body mass [29,30], the Canada Warbler’s average size (wing span = 20–22 cm, mass = 9.5–12.5 g; Reitsma et al. 2010) suggests a median dispersal distance of 50 km [30]. However, estimates for similar-sized species vary widely, from 0.5 km to 40 km [28,29,30,31]. Betts et al. [51] measured maximum breeding dispersal distances of 1–3 km for two species of forest-dwelling warblers whose ranges overlap that of Canada Warbler (the Black-throated Blue Warbler, Setophaga caerulescens, and the Blackburnian Warbler, Setophaga fusca). To account for the uncertainty regarding dispersal estimates for this species and capture the variation in dispersal estimates for similar species, we evaluated three different natal dispersal estimates for each scenario: low dispersal distance (LDD, 5 km), medium dispersal distance (MDD, 10 km), and high dispersal distance (HDD, 50 km).
Zonation uses three primary algorithms to prioritize raster cells for selection: core area zonation (CAZ), additive benefit function, and targets [18]. In this case we did not have an a priori conservation target, which is one reason we chose Zonation over the similar software Marxan [19], which requires proportional or area targets as inputs. We chose CAZ because it ensures that the most valuable areas for each feature (“core areas”) are prioritized, rather than allowing trade-offs between features, as is the case with additive benefit functions. In each iteration of the algorithm, CAZ chooses the cell with the lowest retention value as specified by the features and connectivity functions, discards it, and then recalculates the value of all remaining cells. In this way, each cell is ranked in order of its priority for selection, with the first cells selected being lowest priority and the last cells being highest priority [18].
For scenario LC1, we input the Population density feature (weight 1.0). In Zonation, features are generally given a standard weight of 1.0 unless they are to be discounted due to uncertainty (such as future climate projections) or increased in value due to particular management objectives [18]. We then applied the ‘Distribution Smoothing’ function to aggregate areas with cells of high population density connected by dispersal ability of Canada Warbler (dispersal kernel specified by α [18]; LDD = 5 km, α = 4 × 10⁻⁴; MDD = 10 km, α = 2 × 10⁻⁴ HDD = 50 km, α = 4 × 10⁻⁵). The ‘Species of Special Interest’ function was used to increase the value of cells overlapping with CAWA presence 2005–2009 and/or CAWA presence 2010–2015. Finally, we subtracted calculated Model uncertainty from all cells. After applying all features and functions, cells were prioritized for selection by the CAZ algorithm. LC2 included all features and functions from LC1. We then added Protected areas as a feature (weight 1.0) and used ‘Matrix Connectivity’ to prioritize selection of cells containing high Canada Warbler densities within 5 km of protected areas (distance specified by applying weighting factor = 0.1). The ‘Matrix Connectivity’ function multiplies the value of a cell based on its connectivity to other specified features, with features being considered connected if they fall within the specified dispersal distance [18].
LC3 included all features and functions from LC1 with the addition of the ‘Ecological Interactions’ function, which prioritizes areas based on connectivity between a pair of features [18]. We thus prioritized areas where high densities of Canada Warbler in both CAWA climate baseline (weight 0.75) and CAWA climate 2050 (weight 0.75) were connected based on dispersal distance over 36 years (dispersal ability kernel is represented by β [18]; LDD = 5 km dispersal/year, 180 km total, β = 1.1 × 10⁻⁵; MDD = 10 km dispersal/year, 360 km total, β = 5.56 × 10⁻⁶; HDD = 50 km dispersal/year, 1800 km total, β = 1.1 × 10⁻⁶). We weighted climate features at 0.75 because assumptions about the future are less certain than present estimates (Moilanen and Arponen 2011). LC4 included all features and functions from LC2, with the addition of the ‘Ecological Interactions’ function used in LC3, in order to prioritize areas connecting high current and future populations of Canada Warbler with each other and with Protected areas.
FM1 included all features and functions from LC1 and added the ‘Administrative Units’ function, which recognizes that conservation decisions can be limited by administrative boundaries [18]. Working lands were given a weight of 0.5 to prioritize these areas for selection while maintaining connectivity with outside areas. The ‘Matrix Connectivity’ function was used to prioritize areas connecting high population density and Wet-poor habitat. FM2 included all features and functions from LC1 while omitting the ‘Species of Special Interest’ function to avoid prioritizing cells with Canada Warbler occurrences. ‘Matrix Connectivity’ was added to prioritize areas connecting high population density and Upland habitat (weight = 0.5). This function is based on the assumption that upland areas have desirable timber value and a greater potential to support Canada Warbler populations in 10–30 years after harvest if connected to dispersal sources and managed appropriately [13] (see Supplementary Materials). We added a second ‘Matrix Connectivity’ function to disincentivize prioritization of areas connecting high population density with Wet-poor habitat (weight = −0.5), and a third ‘Matrix Connectivity’ function deterring prioritization of areas connecting high population density with Protected areas (weight = −0.5).
FM3 was not completed in Zonation, but rather was derived by subtracting the FM2 solution raster from the FM1 solution raster in ArcGIS. This was intended to identify areas for timber harvest with the lowest risk of harm to populations and maximum economic opportunity.

2.3.3. Scenario Comparisons

For scenarios LC1–4 and FM1–2, we plotted performance curves representing conservation efficiency (the proportion of current predicted Canada Warbler population protected as a function of area protected, or not harvested in the case of FM2, at each dispersal distance estimate). Because of the different objectives of the scenarios, and functions applied, it was not sensible to compare conservation efficiency of all scenarios. We compared efficiency curves for scenarios with and without climate change but with all other factors being equal (LC2 and LC4). We also compared FM1 and FM2. Finally, we compared mean differences in cell-level rankings for all land conservation scenarios and estimated dispersal distances.

3. Results

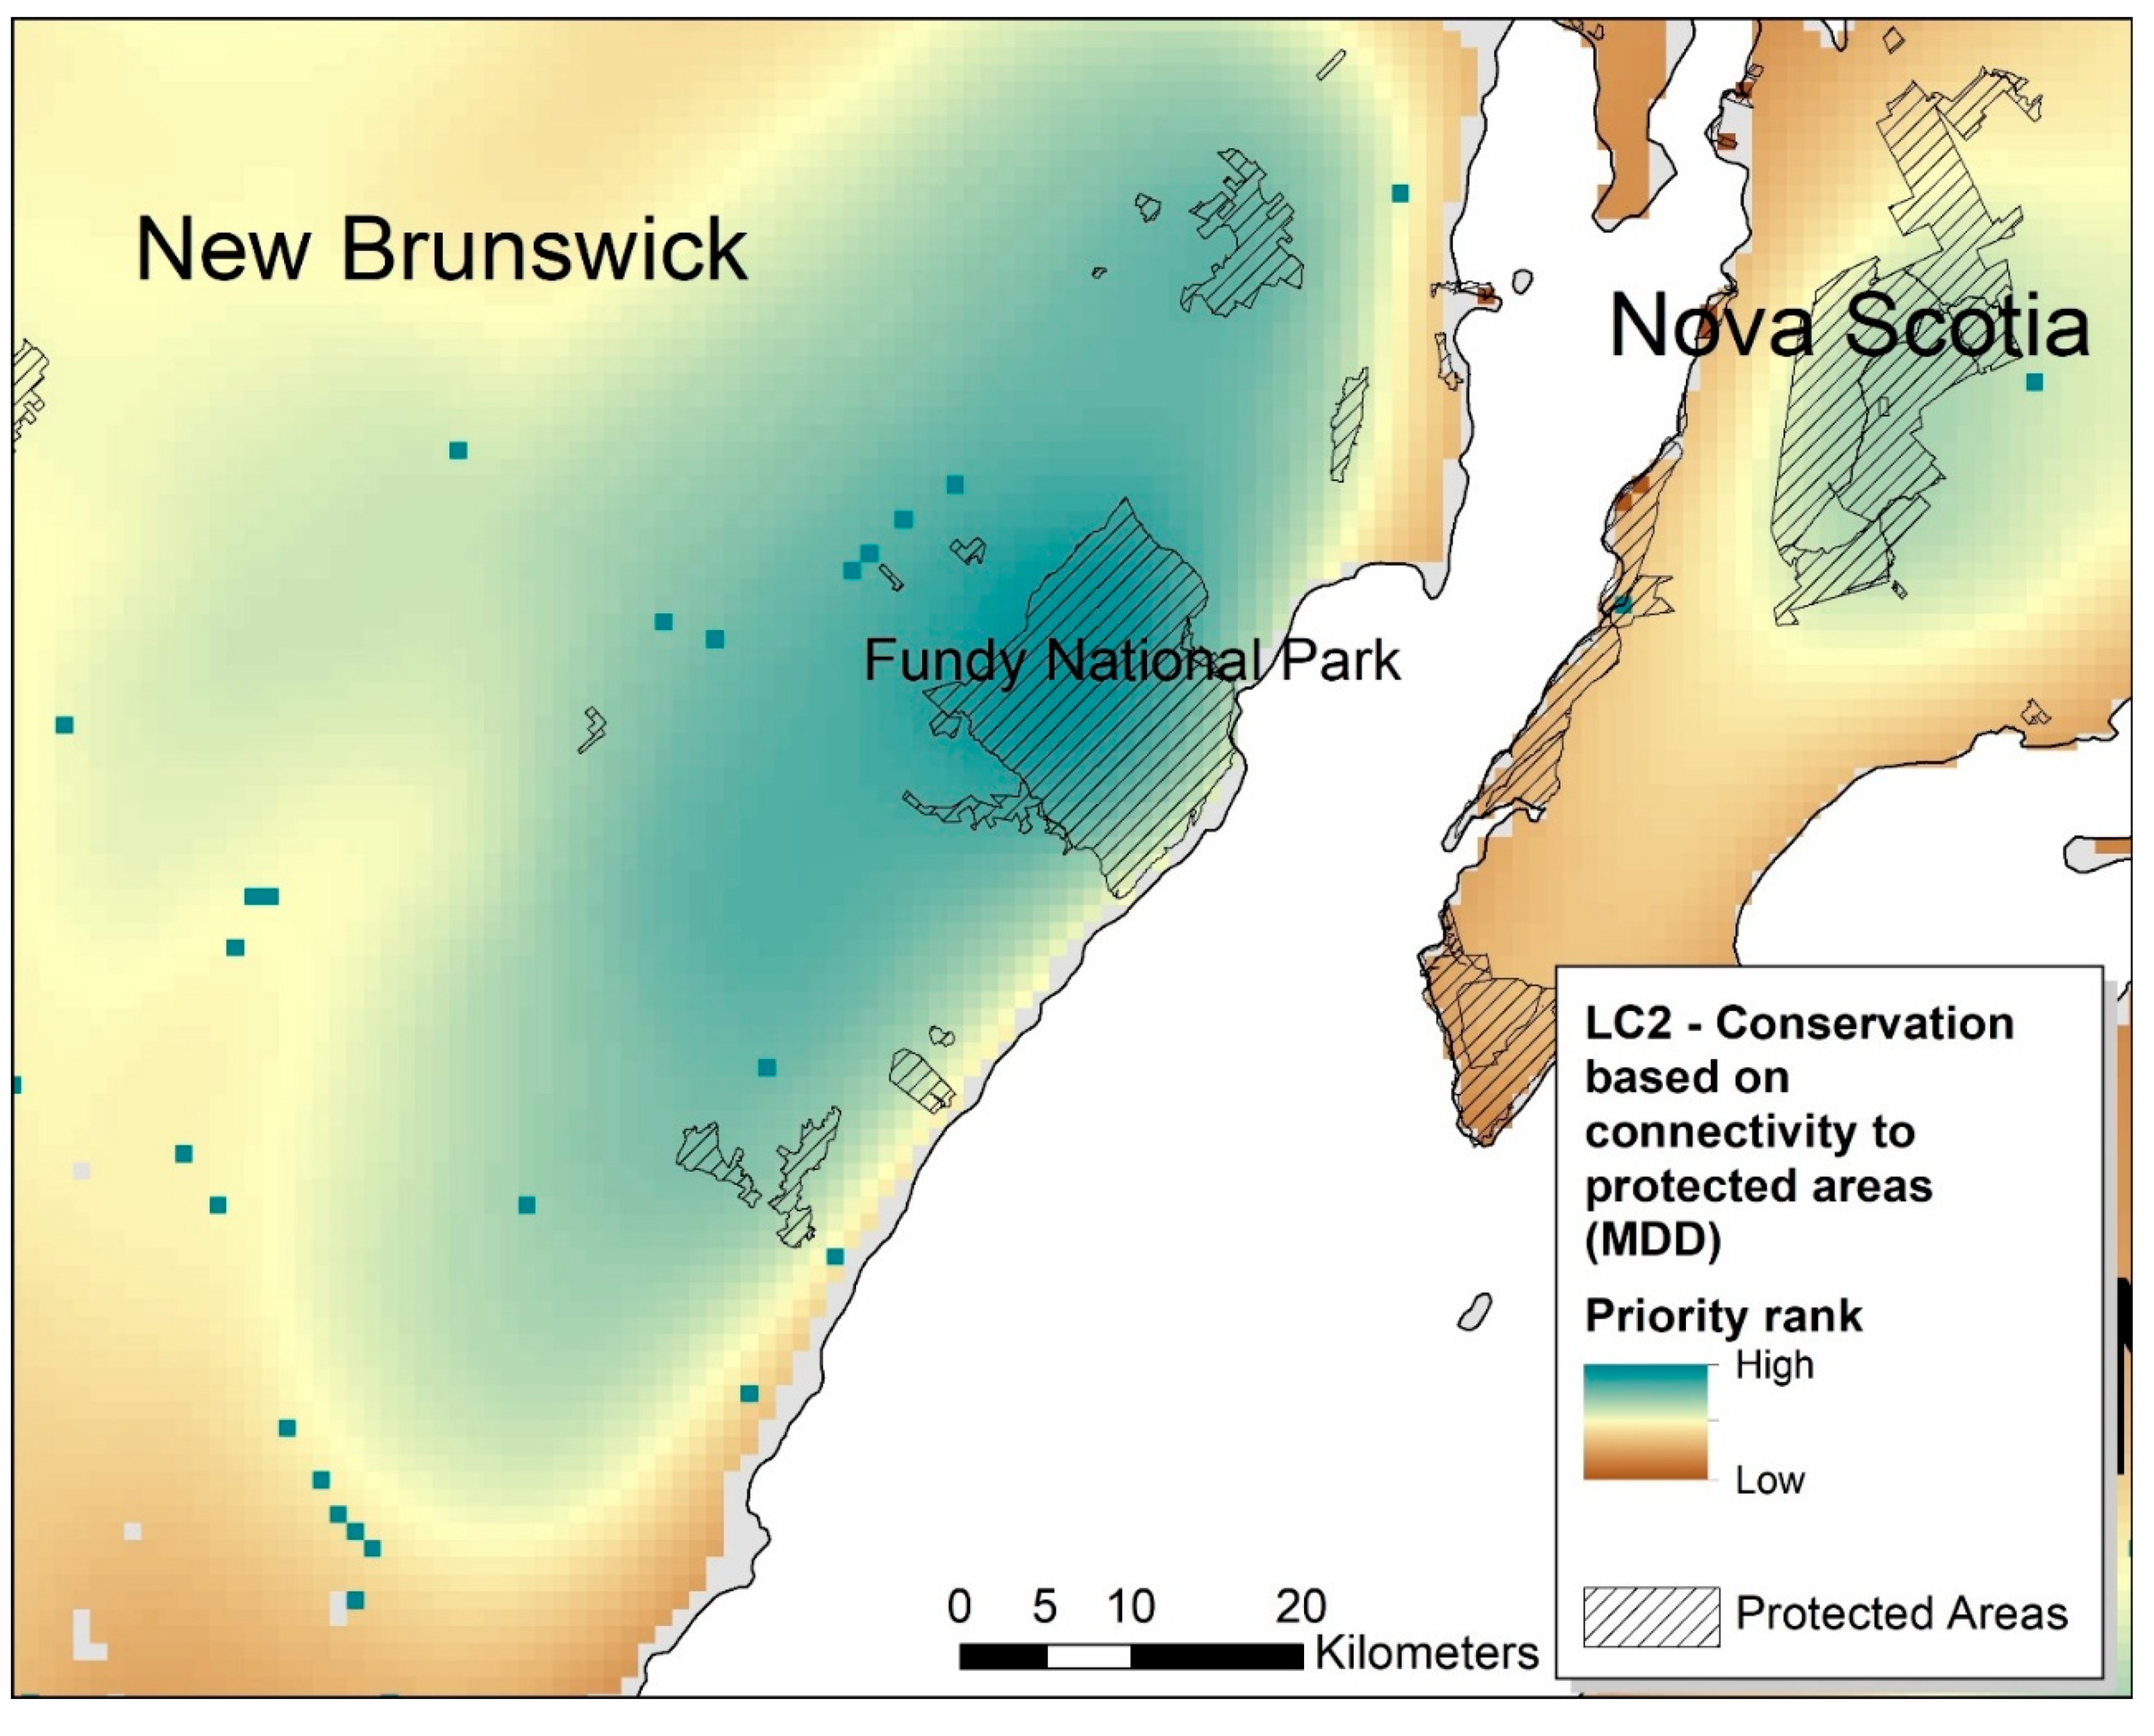
For high resolution maps and data for all scenarios, visit https://github.com/borealbirds/cawa-bcr-14. Of the land conservation scenarios (Figure 2), areas that were consistently prioritized in both current and future climate scenarios included lands in central New Brunswick and the southeastern part of Québec along the border with Maine. All land conservation scenarios prioritized cells with recent and repeated observations of Canada Warbler, but these cells had a minimal effect on conservation efficiency or overall distribution of priority areas (e.g., Figure 3). Relatively few areas in Nova Scotia were prioritized in both current and future climate scenarios, except for small areas close to two large national parks. Adding connectivity to protected areas had little impact on the geographic distribution of areas prioritized in the current climate scenario (LC2), but had a more dramatic effect in the future climate scenario (LC4).
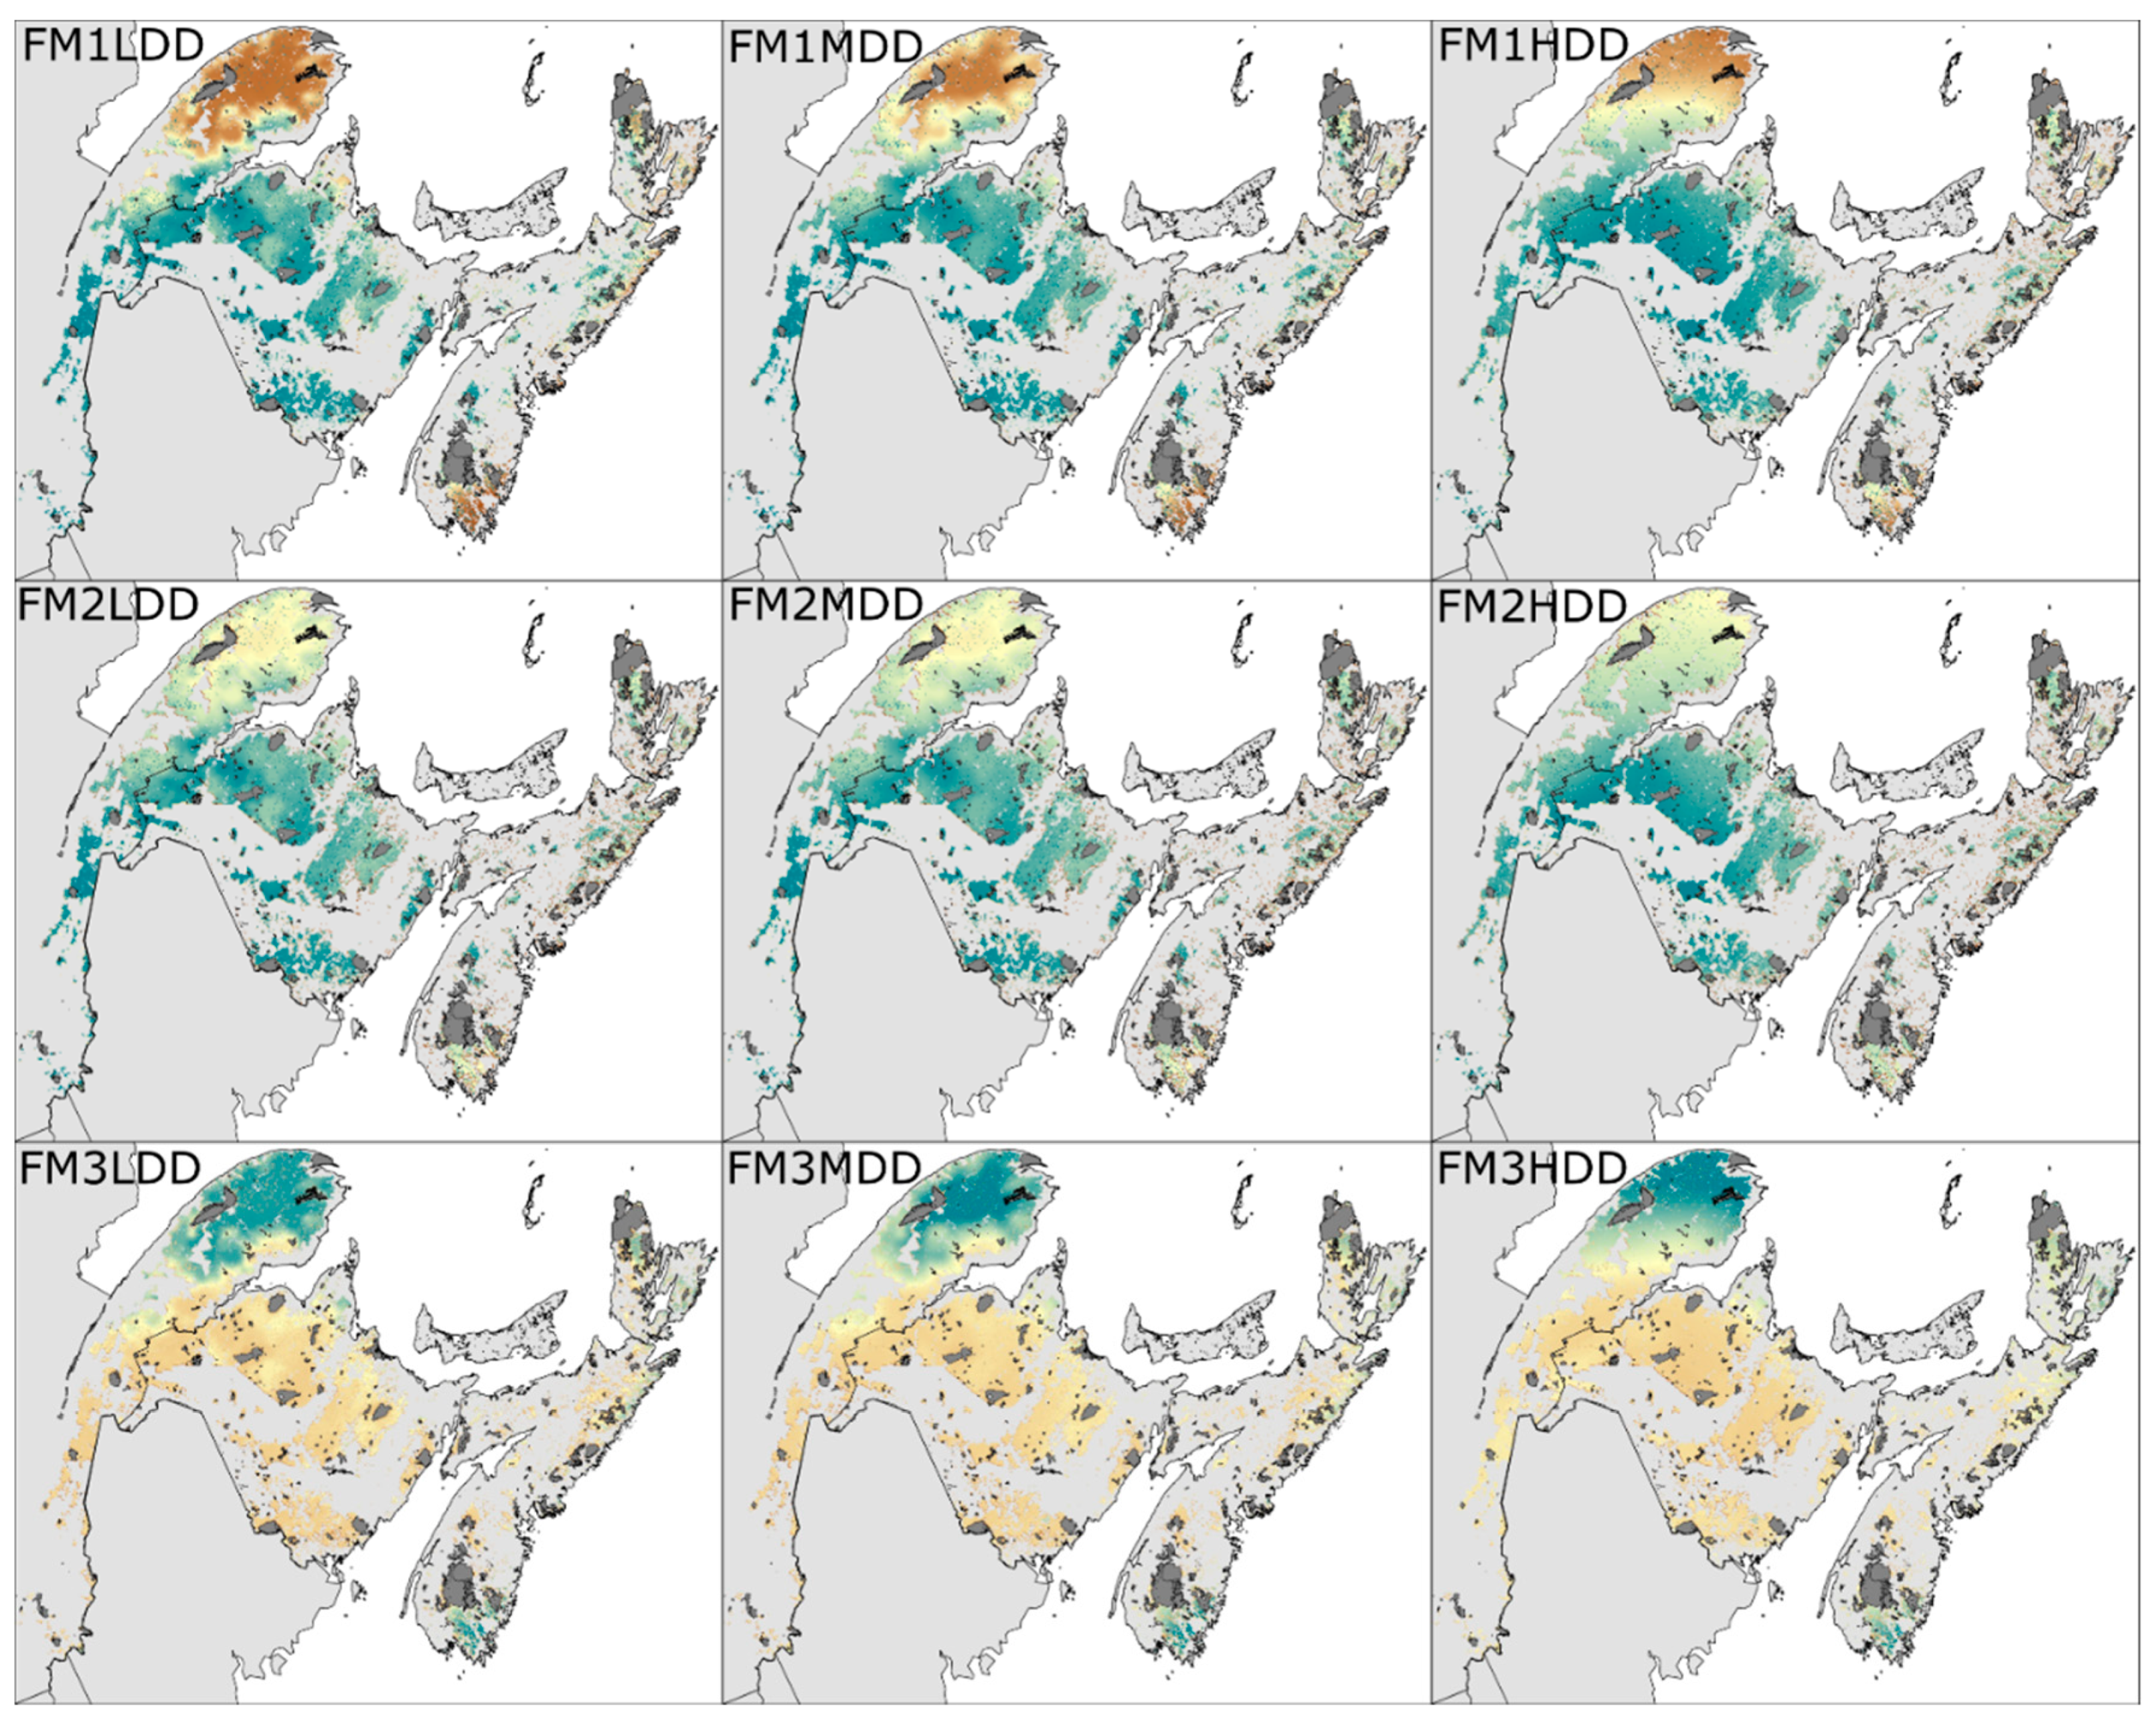
Increasing the dispersal distance estimate increased the aggregation of prioritized areas, with clusters of priority sites being larger and fewer in number for high dispersal distance scenarios, and smaller and more widely distributed for low dispersal distance scenarios (Figure 2). Overall, in the high dispersal distance scenarios, areas in Nova Scotia were rarely prioritized, with the largest aggregations of prioritized cells occurring in central New Brunswick, and to a lesser extent, southeastern Québec for current climate scenarios, and almost exclusively in Québec for future climate scenarios.
With the forest management scenarios (Figure 4), the emphasis was on forestry tenures; thus results are most appropriately applied by individual managers to compare the relative values of areas within those tenures when considering where to engage in responsible forest management practices (guidance is available in an accompanying technical report [33]) (see Supplementary Materials). Both FM1 and FM2 were affected by dispersal distance, shifting from many prioritized areas in Québec under LDD and MDD scenarios to prioritizing almost exclusively areas in New Brunswick under HDD scenarios.
When subtracting retention areas (FM1) from harvest priorities (FM2), the resulting scenario FM3 indicated that areas in the northern Gaspé Peninsula of Québec would be most effective at maximizing harvest value while minimizing potential loss of Canada Warbler. As with the land conservation scenarios, the prioritized areas were more aggregated with increased dispersal distance.

Scenario Comparison

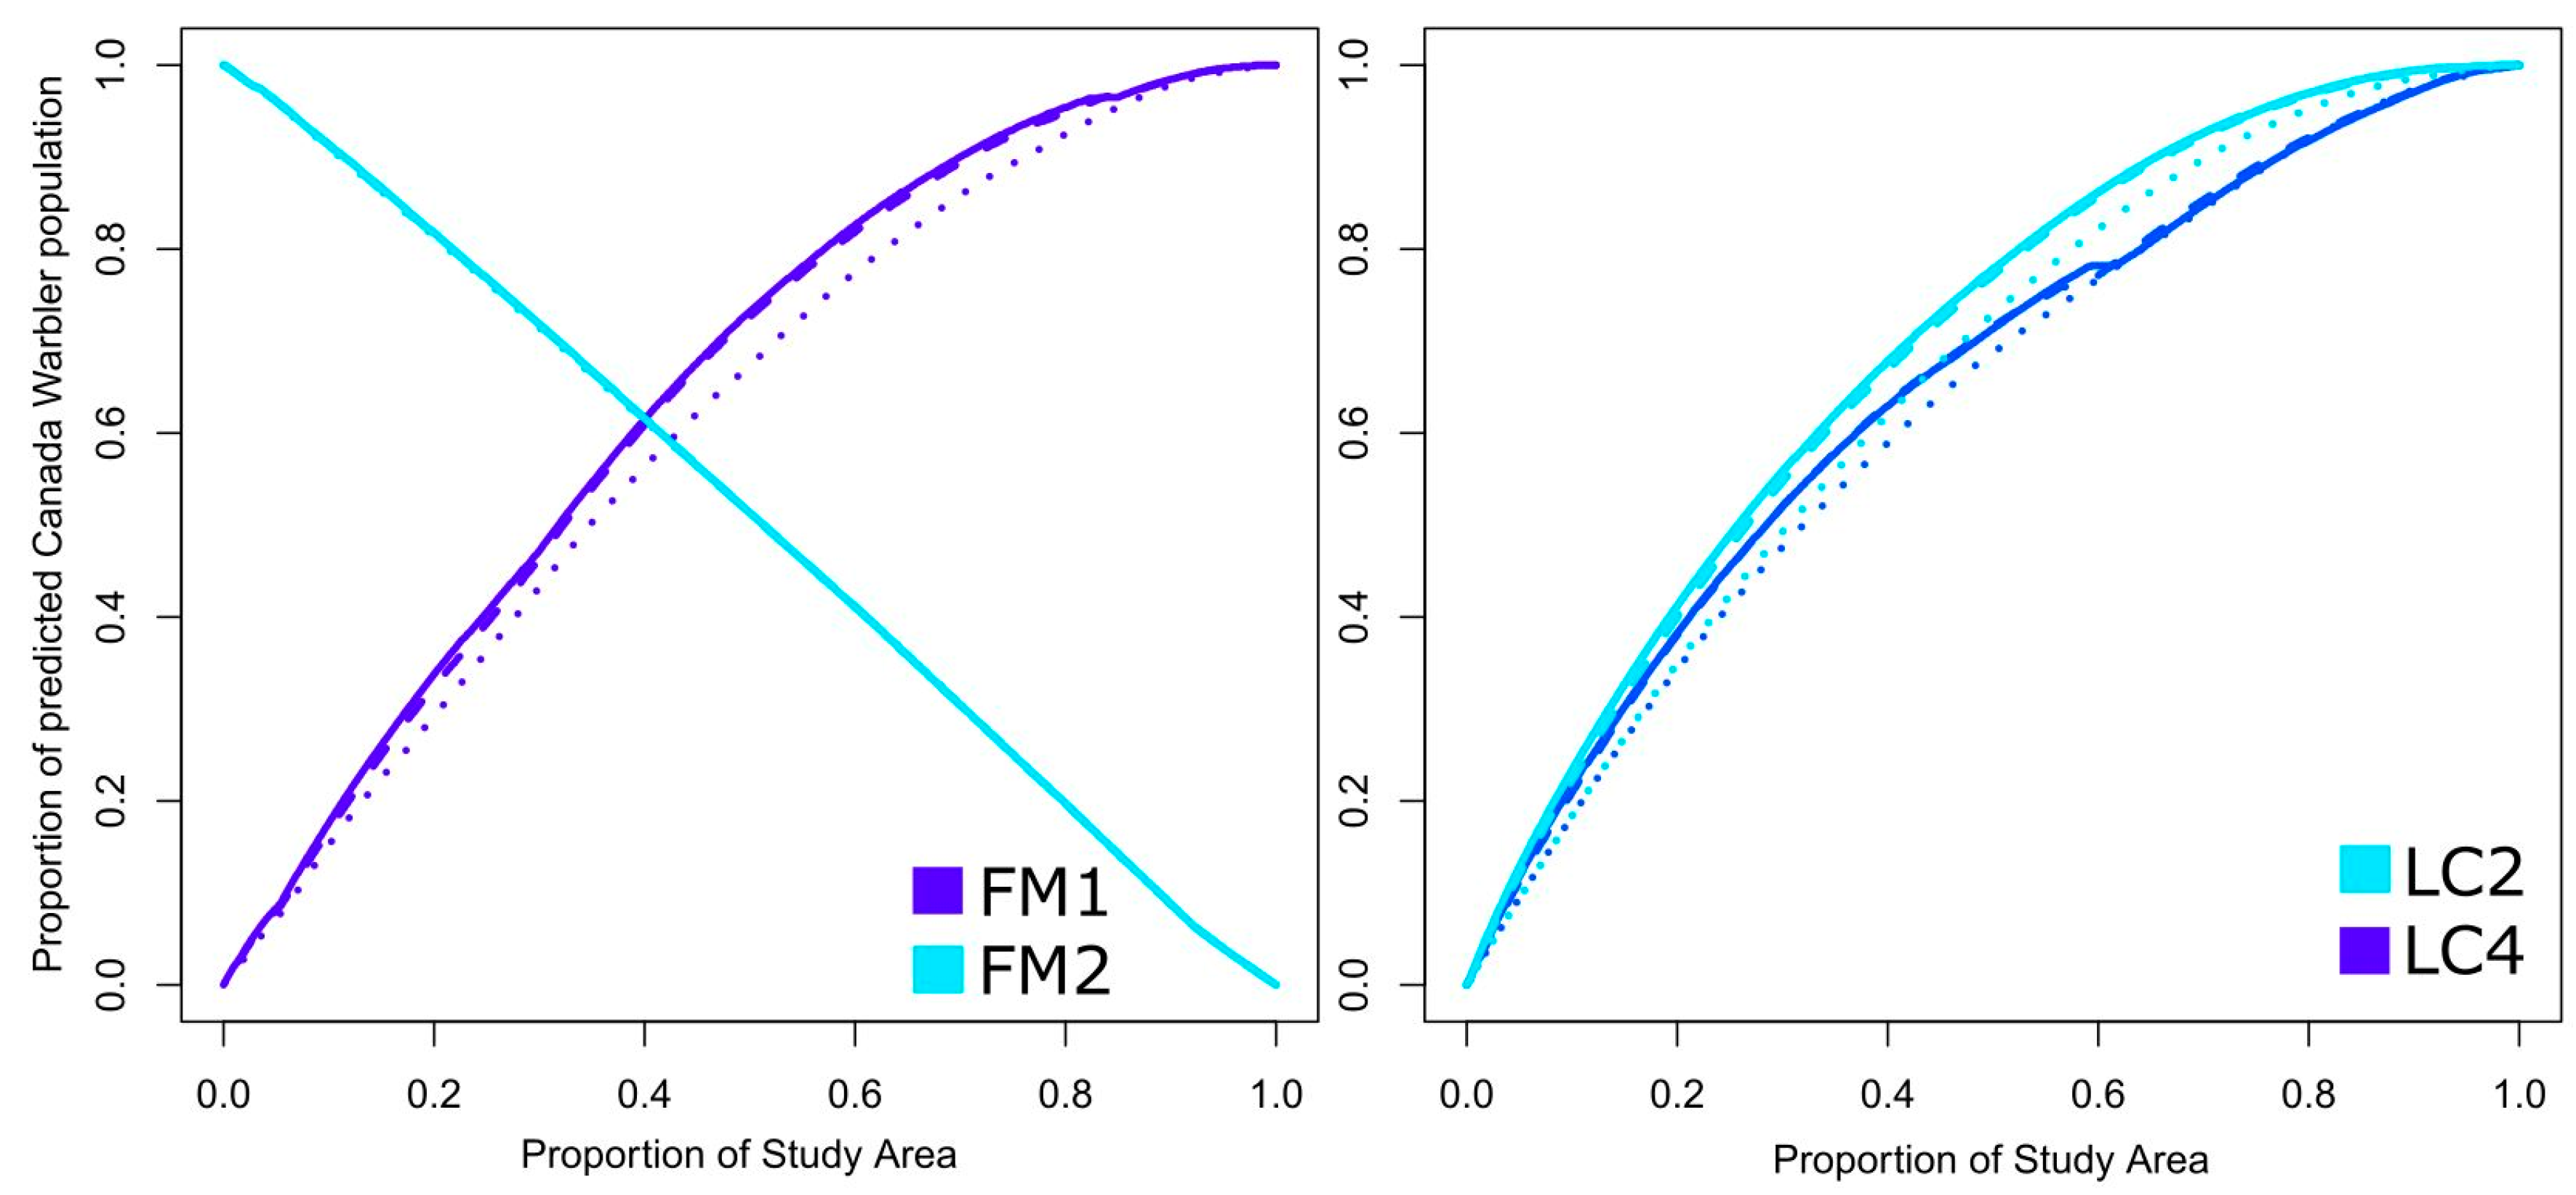
For all scenarios, efficiency (proportion of current predicted Canada Warbler population retained per unit area) declined with higher dispersal distance estimates. Including climate change reduced land conservation scenario efficiency with respect to the current population (Figure 5). Efficiency was not directly comparable between forest management and land conservation scenarios due to differing objectives, as evidenced by the inverted efficiency curves for FM1 and FM2 (Figure 5), the former of which was designed to prioritize areas to avoid during forest management with the latter prioritizing areas to target for harvesting.
For land conservation scenarios, cell-level rankings, which range from 0 to 1, differed more between MDD and HDD scenarios (mean = 0.10, SD = 0.90) than between LDD and MDD scenarios (mean = 0.04, SD = 0.04), with greater variation in differences also found between MDD and HDD (Table 3).

4. Discussion

We generated land conservation and forest management prioritization maps for the Canada Warbler in the Canadian portion of the Atlantic Northern Forest. This exercise identified several consistently prioritized areas for a range of stewardship objectives. In particular, central New Brunswick and southern Québec emerged as important areas for conservation and management under both current and future climate scenarios and when considering a range of possible dispersal distances. In general, areas farther from the coast were more frequently prioritized for conservation. Including projected effects of climate change on potential population density had dramatic effects in the scenarios, leading to almost no areas prioritized for conservation in Nova Scotia, and shifting priority areas northward. Within forest management tenures, the northern Gaspé Peninsula of Québec was consistently identified as the area where forest harvesting activities may be most practical while avoiding impacts to current Canada Warbler populations. This is consistent with Sólymos et al. [44], who predicted a lower average Canada Warbler population density in the Gaspé Peninsula compared to the rest of the study area.
Given this species’ high conservation concern, our single-species exercise has potential to aid the rapid implementation of conservation and recovery action. Our method was somewhat unique in that landscape prioritization exercises are typically used for the assessment of biodiversity at large scales considering many different species (e.g., [19,51]). For a given taxon, Zonation results that are produced using only survey data could be different from those using species distribution models [52] and including both as input features may offer benefits. Although in our case adding recent locations of Canada Warbler only had a small impact on the overall solution, important differences were apparent at the level of individual cells (1 km2). Including this element is critical for land managers making decisions on small scales, as they indicate land parcels with persistent occupancy by Canada Warblers. These areas can thus be targeted for permanent land conservation and avoided during forest harvesting.
Although our prioritization scenarios provide insight into possible locations to target conservation and management activities, the spatial resolution of the scenarios (1 km) is too coarse to identify specific habitat patches. While two finer-scale Canada Warbler species distribution models have been constructed in this region [10,53], their coverage does not include the entire study area. Prioritized areas should be regarded as suggestions that require more detailed investigation through comparison with satellite imagery and ground-truthing before being considered candidates for conservation or management activity. To maximize efficacy, our analysis should be repeated as finer-scale spatial data become available to support local management planning and to account for the small territory sizes of the Canada Warbler (average 1 ha; [16,54]).

4.1. Accounting for Uncertainty

The predictions made by species distribution models, frequently used as input features in conservation prioritization exercises, are inherently more uncertain in under-sampled areas [55,56]. We accounted for this uncertainty by discounting densities by the standard deviation of mean population density, and thus were able to focus priorities on areas of lower scenario uncertainty [24,57].
We also attempted to account for uncertainty about dispersal distances within Canada Warbler populations by evaluating each scenario using three different dispersal distance estimates. These estimates were intended to influence results by dictating the extent to which priority conservation and management areas were required to be in close proximity to protected areas and known Canada Warbler locations, and to influence the allowed distance between current and future projected Canada Warbler distributions. However, we also used dispersal distance estimates within Zonation’s ‘Distribution Smoothing’ function, which aggregates priority areas based on the assumption that fragmented solutions are undesirable [18], thereby yielding results that were increasingly spatially aggregated with larger dispersal distance estimates. This led to large differences in geographic priorities across scenarios, suggesting the need for careful consideration of habitat connectivity requirements for Canada Warbler and other species of conservation concern. Given that dispersal is a key parameter in spatial conservation prioritization [50], our findings highlight the importance of considering a range of dispersal assumptions. Future studies may benefit from multiple scenarios designed to isolate the different ways in which dispersal estimates can influence results.
The increased level of spatial aggregation in conservation priorities with higher dispersal estimates led to less efficient solutions in terms of the current predicted Canada Warbler population that would be conserved per unit area. However, conservation efficiency was influenced less by assumptions about dispersal distance than by assumptions about climate change effects on species’ distributions, due to the large discrepancies between predicted current and future suitable habitats for boreal species [17]. Our results are consistent with those of Stralberg et al. [24], who found that incorporating potential avian responses to climate change reduced conservation efficiency for current songbird populations. This supports the idea that planning to incorporate climate change increases the size required for protected areas to adequately conserve species [17,58,59].

4.2. Maintaining Viable Populations on the Landscape

Connectivity was important in identifying management opportunities through this prioritization effort because Canada Warblers cluster in multi-territory “neighborhoods” [16,60]. Canada Warblers use forest stands post-harvest more often if they are within 100 m of unharvested stands with conspecific breeders; in one study, the presence of conspecifics was found to be more important than habitat condition for predicting stand use [16]. Therefore, it is important to conserve or manage for areas of sufficient size to support a neighborhood, although the ideal size and configuration of such habitat patches is not yet known. It is also not known whether dispersal within and between such neighborhoods is important for Canada Warbler population viability, nor what barriers to functional connectivity [61] exist for this species in this region. However, observed population declines combined with stable breeding productivity [62] suggest that eastern populations may not be limited by quality or connectivity of breeding habitat.
Our scenarios that assumed a high dispersal distance (HDD) prioritized large areas in the northwest portion of the study region. In contrast, the low dispersal distance (LDD) scenarios prioritized more locations of smaller size across the Atlantic Northern Forest. Relying on the results from HDD scenarios alone could undermine the goals of individual provinces to maintain native species by favoring the conservation of fewer large populations rather than a larger number of small, spatially distributed populations. The latter may be preferable from the standpoint of maintaining genetic variability across the landscape [63]. Furthermore, our scenarios that considered future climate projections (particularly the HDD variants) assigned low priority to southern populations in Nova Scotia and southern Québec—areas that become less hospitable to Canada Warbler in a warmer climate. Thus, the LDD and current climate scenarios represent more conservative assumptions for conservation and management. This may be more appropriate for a species that is experiencing population declines, especially given range-wide projected increases in habitat suitability under climate change [17].
To guarantee long-term persistence of high-quality breeding areas for the Canada Warbler, information on the capacity of habitats to support viable populations through detailed spatial population viability analyses is critical [64]. Although Zonation uses connectivity of populations as a surrogate for viability [20], this may not be as relevant for passerines, who have greater mobility than taxa with small dispersal distances such as small mammals, plants, or colonial birds. By incorporating measures of connectivity and including recent and repeated observations of Canada Warblers to locate high priority areas, we may have been able to better prioritize the landscape for conservation of high-value habitat than what was accomplished by using species distribution models or survey data alone. We were not able to include data on habitat selection and reproductive success that may have given a more direct indicator of population viability, which is being used in ongoing studies (Burns & Reitsma, in revision; Amelie Roberto-Charron, pers. comm.; Junior Tremblay, pers. comm.). Future prioritization efforts should include results of assessments of reproductive success and population viability wherever possible in order to most accurately target areas to maintain population density on the landscape. Such data would be particularly valuable if comparing harvested and unharvested areas, to test the hypothesis of whether areas undergoing forest management represent ecological traps for this species [65].
The present study advances the understanding of conservation issues and management opportunities for Canada Warbler at a regional scale. Our results help to define priority areas for Canada Warbler land conservation and forest management, and in conjunction with the habitat guidelines for the Canadian portion of the Atlantic Northern Forest [13] (see Supplementary Materials), they provide a toolkit for managers to immediately locate areas for implementing conservation and management actions. We suggest that this approach, designed to support management objectives for a single species, be applied to other species. We particularly encourage managers to apply this prioritization approach to Canada Warbler populations in other BCRs in Canada and the U.S. to support persistence of the entire breeding population.

Supplementary Materials

The following are available online at https://www.mdpi.com/1424-2818/12/2/61/s1, file 1: Westwood et al—2017—Guidelines for managing Canada Warbler habitat.pdf; file 2: Westwood, Reitsma, Lambert—2017—Prioritizing areas for Canada Warbler conservation and management.pdf.

Author Contributions

Conceptualization, J.D.L., A.R.W., and L.R.R.; methodology—development, spatial analysis, and statistics, A.R.W. and D.S.; writing—original draft preparation, review and editing, A.R.W., J.D.L., L.R.R., and D.S.; funding acquisition, J.D.L. and A.R.W. All authors have read and agree to the published version of the manuscript.

Funding

This research was funded by Environment and Climate Change Canada (ECCC), the U.S. Fish and Wildlife Service (USFWS), and High Branch Conservation Services Ltd. Article Processing Charges were funded by [TBA].

Acknowledgments

We acknowledge our funders for their support through various components of this project. Thank you to Alaine Camfield and Sean LeMoine of ECCC who were highly involved in the preparation of associated technical reports. The associated technical reports acknowledge the names of the many professionals across sectors (government, industry, academia, and Indigenous communities) who responded to consultations and surveys associated with this project, and for whose time and expertise we are grateful. We acknowledge the BAM Project’s members, avian and biophysical data partners, and funding agencies, listed in full at www.borealbirds.ca/index.php/acknowledgements. The BAM project’s database includes Breeding Bird Survey data and provincial Breeding Bird Atlas data, and we acknowledge the hundreds of skilled volunteers in Canada who have participated in these surveys over the years, and those who have served as provincial or territorial coordinators for the BBS. We thank the subject editor and two reviewers for a previous submission to the journal Avian Conservation and Ecology for their constructive comments, which refined the manuscript and led us to find a more appropriate home for applied conservation work. We are grateful to BAM members Péter Sólymos, and Trish Fontaine for provision of data and Nicole Barker and Samuel Haché for guidance and feedback. Finally, we thank Kara Pearson for GIS database assembly and Charlotte Harding for contributions to the U.S. habitat management guidelines.

Conflicts of Interest

The authors declare no conflict of interest.

References

  1. Reitsma, L.R.; Goodnow, M.; Hallworth, M.T.; Conway, C.J. Canada Warbler (Cardellina canadensis). In The Birds of North America Online; Poole, A., Ed.; Cornell Lab of Ornithology: Ithaca, NY, USA, 2010. [Google Scholar]
  2. Sauer, J.R.; Hines, J.E.; Pardieck, K.L.; Ziolkowski, D.J., Jr.; Link, W.A. The North American Breeding Bird Survey, Results and Analysis 1966–2013; Version 02.19; USGS Patuxent Wildlife Research Center: Laurel, MD, USA, 2015. [Google Scholar]
  3. Government of Canada Species At Risk Act. S.C. 2002, c.29. Available online: http://www.sararegistry.gc.ca/default_e.cfm (accessed on 15 October 2018).
  4. Maine Dept. of Inland Fisheries and Wildlife. Maine’s Wildlife Action Plan; Maine Dept. of Inland Fisheries and Wildlife: August, ME, USA, 2015.
  5. Kennedy, J.; Cheskey, T. Notes from the NAOC VI CWICI Roundtable. In Proceedings of the Canada Warbler International Conservation Initiative Roundtable, Washington, DC, USA, 18 August 2016; pp. 1–6. [Google Scholar]
  6. Environment and Climate Change Canada North American Breeding Bird Survey—Canadian Trends Website, Data-Version. 2017. Available online: https://wildlife-species.canada.ca/breeding-bird-survey-results/P004/A001/?lang=e&m=s&r=OSFL&p=S (accessed on 2 February 2020).
  7. Westwood, A.R. Conservation of three forest landbird species at risk: Characterizing and modelling habitat at multiple scales to guide management Planning. Ph.D. Thesis, Department of Biology, Dalhousie University, Halifax, NS, Canada, 2016. [Google Scholar]
  8. Goodnow, M.; Reitsma, L.R. Nest-site selection in the Canada Warbler (Wilsonia canadensis) in central New Hampshire. Can. J. Zool. 2011, 89, 1172–1177. [Google Scholar] [CrossRef]
  9. Hallworth, M.; Ueland, A.; Anderson, E.; Lambert, J.D.; Reitsma, L.R. Habitat selection and site fidelity of Canada Warblers (Wilsonia canadensis) in Central New Hampshire. Auk 2008, 125, 880–888. [Google Scholar] [CrossRef]
  10. Westwood, A.R.; Staicer, C.; Sólymos, P.; Haché, S.; Fontaine, T.; Bayne, E.M.; Mazerolle, D.; Solymos, P.; Hache, S.; Fontaine, T.; et al. Estimating the conservation value of protected areas in Maritime Canada for two species at risk: the Olive-sided Flycatcher (Contopus cooperi) and Canada Warbler (Cardellina canadensis). Avian Conserv. Ecol. 2019, 14, 16. [Google Scholar] [CrossRef]
  11. Grinde, A.R.; Niemi, G.J. Influence of landscape, habitat, and species co-occurrence on occupancy dynamics of Canada Warblers. Condor 2016, 118, 513–531. [Google Scholar] [CrossRef]
  12. Hallworth, M.; Benham, P.M.; Lambert, J.D.; Reitsma, L.R. Canada warbler (Wilsonia canadensis) breeding ecology in young forest stands compared to a red maple (Acer rubrum) swamp. For. Ecol. Manag. 2008, 255, 1353–1358. [Google Scholar] [CrossRef]
  13. Westwood, A.R.; Harding, C.; Reitsma, L.; Lambert, D. Guidelines for Managing Canada Warbler Habitat in the Atlantic Northern Forest of Canada; High Branch Conservation Services: Hartland, VT, USA, 2017. [Google Scholar]
  14. Askins, R.A.; Philbrick, M.J. Effect of changes in regional forest abundance on the decline and recovery a forest bird community. Wilson Bull. 1987, 99, 7–21. [Google Scholar]
  15. Bayne, E.; Leston, L.; Mahon, C.L.; Sólymos, P.; Machtans, C.; Lankau, H.; Ball, J.R.; Van Wilgenburg, S.L.; Cumming, S.G.; Fontaine, T.; et al. Boreal bird abundance estimates within different energy sector disturbances vary with point count radius. Condor 2016, 118, 376–390. [Google Scholar] [CrossRef] [Green Version]
  16. Hunt, A.R.; Bayne, E.M.; Haché, S. Forestry and conspecifics influence Canada Warbler (Cardellina canadensis) habitat use and reproductive activity in boreal Alberta, Canada. Condor 2017, 119, 832–847. [Google Scholar] [CrossRef] [Green Version]
  17. Stralberg, D.; Bayne, E.M.; Cumming, S.G.; Sólymos, P.; Song, S.J.; Schmiegelow, F.K.A. Conservation of future boreal forest bird communities considering lags in vegetation response to climate change: A modified refugia approach. Divers. Distrib. 2015, 21, 1112–1128. [Google Scholar] [CrossRef]
  18. Moilanen, A.J.; Pouzols, F.M.; Meller, L.; Veach, V.; Arponen, A.; Leppänen, J.; Kujala, H. Spatial conservation planning methods and software: ZONATION 4.0 User Manual; Version 4; Conservation Biology Informatics Group, University of Helsinki: Helsinki, Finland, 2014; ISBN 9789521099199. [Google Scholar]
  19. Ball, I.; Possingham, H.P.; Watts, M. Marxan and relatives: Software for spatial conservation prioritisation. In Spatial Conservation Prioritisation: Quantitative Methods and Computational Tools; Moilanen, A., Wilson, K., Possingham, H., Eds.; Oxford University Press: Oxford, UK, 2009; pp. 185–195. [Google Scholar]
  20. Early, R.; Thomas, C.D. Multispecies conservation planning: Identifying landscapes for the conservation of viable populations using local and continental species priorities. J. Appl. Ecol. 2007, 44, 253–262. [Google Scholar] [CrossRef]
  21. Shriner, S.A.; Wilson, K.R.; Flather, C.H. Reserve networks based on richness hotspots and representations vary with scale. Ecol. Appl. 2006, 16, 1660–1673. [Google Scholar] [CrossRef]
  22. Franco, A.M.A.; Anderson, B.J.; Roy, D.B.; Gillings, S.; Fox, R.; Moilanen, A.J.; Thomas, C.D. Surrogacy and persistence in reserve selection: Landscape prioritization for multiple taxa in Britain. J. Appl. Ecol. 2009, 46, 82–91. [Google Scholar] [CrossRef]
  23. Mikkonen, N.; Moilanen, A.J. Identification of top priority areas and management landscapes from a national Natura 2000 network. Environ. Sci. Policy 2013, 27, 11–20. [Google Scholar] [CrossRef] [Green Version]
  24. Stralberg, D.; Camfield, A.; Carlson, M.; Lauzon, C.; Westwood, A.R.; Barker, N.K.S.; Song, S.J.; Schmiegelow, F.K.A. Strategies for identifying priority areas for songbird conservation in Canada’s boreal forest. Avian Conserv. Ecol. 2018, 13, 12. [Google Scholar] [CrossRef]
  25. Moilanen, A.J.; Anderson, B.J.; Eigenbrod, F.; Heinemeyer, A.; Roy, D.B.; Gillings, S.; Armsworth, P.R.; Gaston, K.J.; Thomas, C.D. Balancing alternative land uses in conservation prioritization. Ecol. Appl. 2011, 21, 1419–1426. [Google Scholar] [CrossRef]
  26. Kareksela, S.; Moilanen, A.J.; Tuominen, S.; Kotiaho, J.S. Use of inverse spatial conservation prioritization to avoid biological diversity loss outside protected areas. Conserv. Biol. 2013, 27, 1294–1303. [Google Scholar] [CrossRef]
  27. Kukkala, A.S.; Moilanen, A.J. Ecosystem services and connectivity in spatial conservation prioritization. Landsc. Ecol. 2017, 32, 5–14. [Google Scholar] [CrossRef] [Green Version]
  28. Paradis, E.; Baillie, S.R.; Sutherland, W.J.; Gregory, R.D. Patterns of natal and breeding dispersal in birds. J. Anim. Ecol. 1998, 67, 518–536. [Google Scholar] [CrossRef]
  29. Sutherland, G.D.; Harestad, A.S.; Price, K.; Lertzman, K.P. Scaling of natal dispersal distances in terrestrial birds and mammals. Ecol. Soc. 2000, 4, 1. [Google Scholar] [CrossRef]
  30. Tittler, R.; Villard, M.A.; Fahrig, L. How far do songbirds disperse? Ecography (Cop.). 2009, 32, 1051–1061. [Google Scholar] [CrossRef] [Green Version]
  31. Garrard, G.E.; McCarthy, M.A.; Vesk, P.A.; Radford, J.Q.; Bennett, A.F. A predictive model of avian natal dispersal distance provides prior information for investigating response to landscape change. J. Anim. Ecol. 2012, 81, 14–23. [Google Scholar] [CrossRef] [PubMed]
  32. Game, E.T.; Kareiva, P.; Possingham, H.P. Six common mistakes in conservation priority setting. Conserv. Biol. 2013, 27, 480–485. [Google Scholar] [CrossRef] [PubMed] [Green Version]
  33. Westwood, A.; Reitsma, L.R.; Lambert, D. Prioritizing Areas for Canada Warbler Conservation and Management in the Atlantic Northern Forest of Canada; High Branch Conservation Services: Hartland, VT, USA, 2017. [Google Scholar]
  34. Moilanen, A.J. Landscape Zonation, benefit functions and target-based planning: Unifying reserve selection strategies. Biol. Conserv. 2007, 134, 571–579. [Google Scholar] [CrossRef]
  35. Rich, T.D.; Beardmore, C.; Berlanga, H.; Blancher, P.J.; Bradstreet, M.; Butcher, G.; Demerast, D.; Dunn, E.; Hunter, W.; Iñigo-Elias, E.; et al. Partners in Flight North American Landbird Conversation Plan; Cornell Lab of Ornithology: Ithica, NY, USA, 2004. [Google Scholar]
  36. Mahon, C.L.; Bayne, E.M.; Sólymos, P.; Matsuoka, S.M.; Carlson, M.; Dzus, E.; Schmiegelow, F.K.A.; Song, S.J. Does expected future landscape condition support proposed population objectives for boreal birds? For. Ecol. Manag. 2014, 312, 28–39. [Google Scholar] [CrossRef]
  37. Ball, J.R.; Sólymos, P.; Schmiegelow, F.K.A.; Hache, S.; Schieck, J.; Bayne, E. Regional habitat needs of a nationally listed species, Canada Warbler (Cardellina canadensis), in Alberta, Canada. Avian Conserv. Ecol. 2016, 11, 10. [Google Scholar] [CrossRef] [Green Version]
  38. Environment and Climate Change Canada Bird Conservation Strategies for Bird Conservation Region 14. Available online: https://www.canada.ca/en/environment-climate-change/services/migratory-bird-conservation/regions-strategies/description-region-14.html (accessed on 19 February 2018).
  39. Trombulak, S.; Anderson, M.G.; Baldwin, R.; Beazley, K.; Ray, J.; Reining, C.; Woolmer, G.; Bettigole, C.; Forbes, G.; Gratton, L. The Northern Appalachian/Acadian Ecoregion Priority Locations for Conservation Action; Two Countries, One Forest Special Report; Two Countries, One Forest: Warner, NH, USA, 2008; No. 1. [Google Scholar]
  40. Vankerham, R. Conservation Areas Reporting and Tracking System Database. Available online: http://www.ccea.org/carts/ (accessed on 2 February 2020).
  41. Barker, N.K.S.; Fontaine, P.C.; Cumming, S.G.; Stralberg, D.; Westwood, A.R.; Bayne, E.M.; Sólymos, P.; Schmiegelow, F.K.A.; Song, S.J.; Rugg, D.J. Ecological monitoring through harmonizing existing data: Lessons from the boreal avian modelling project. Wildl. Soc. Bull. 2015, 39, 480–487. [Google Scholar] [CrossRef]
  42. Sólymos, P.; Matsuoka, S.M.; Bayne, E.M.; Lele, S.R.; Fontaine, P.; Cumming, S.G.; Stralberg, D.; Schmiegelow, F.K.A.; Song, S.J. Calibrating indices of avian density from non-standardized survey data: making the most of a messy situation. Methods Ecol. Evol. 2013, 4, 1047–1058. [Google Scholar] [CrossRef]
  43. Matsuoka, S.M.; Bayne, E.M.; Sólymos, P.; Fontaine, P.C.; Cumming, S.G.; Schmiegelow, F.K.A.; Song, S.J. Using binomial distance-sampling models to estimate the effective detection radius of point-count surveys across boreal Canada. Auk 2012, 129, 268–282. [Google Scholar] [CrossRef]
  44. Haché, S.; Solymos, P.; Bayne, E.M.; Fontaine, T.; Cumming, S.G.; Schmiegelow, F.; Stralberg, D. Analyses to Support Critical Habitat Identification for Canada Warbler, Olive-sided Flycatcher, and Common Nighthawk: Final Report 1. Available online: https://zenodo.org/record/2433885#.XjZUmiMRVPY (accessed on 14 December 2019).
  45. Stralberg, D.; Matsuoka, S.M.; Hamann, A.; Bayne, E.M.; Solymos, P.; Schmiegelow, F.K.A.; Wang, X.; Cumming, S.G.; Song, S.J. Projecting boreal bird responses to climate change: the signal exceeds the noise. Ecol. Appl. 2015, 25, 52–69. [Google Scholar] [CrossRef] [Green Version]
  46. Meehl, G.A.; Covey, C.; Delworth, T.; Latif, M.; McAvaney, B.; Mitchell, J.F.B.; Stouffer, R.J.; Taylor, K.E. The WCRP CMIP3 multimodel dataset: A new era in climatic change research. Bull. Am. Meteorol. Soc. 2007, 88, 1383–1394. [Google Scholar] [CrossRef] [Green Version]
  47. Global Forest Watch Canada’s Industrial Concessions. 2016. Available online: http://www.globalforestwatch.ca/node/273 (accessed on 2 February 2020).
  48. Anderson, M.G.; Clark, M.; Ferree, C.; Jospe, A.; Sheldon Olivero, A.; Weaver, K. Northeastern Habitat Guides: A Companion to the Terrestrial and Aquatic Habitat Maps; The Nature Conservancy, Eastern Conservation Science, Eastern Regional Office: Boston, MA, USA, 2013. [Google Scholar]
  49. Esri Inc. ArcGIS for Desktop 10.2.2. Available online: http://www.esri.com (accessed on 2 February 2020).
  50. Carroll, C.; Dunk, J.R.; Moilanen, A.J. Optimizing resiliency of reserve networks to climate change: Multispecies conservation planning in the Pacific Northwest, USA. Glob. Chang. Biol. 2010, 16, 891–904. [Google Scholar] [CrossRef] [Green Version]
  51. Betts, M.G.; Zitske, B.P.; Hadley, A.S.; Diamond, A.W. Migrant forest songbirds undertake breeding dispersal following timber harvest. Northeast. Nat. 2006, 13, 531–536. [Google Scholar] [CrossRef]
  52. Rushing, C.S.; Ryder, T.B.; Marra, P.P.; Rushing, C.S. Quantifying drivers of population dynamics for a migratory bird throughout the annual cycle. Proc. R. Soc. B Biol. Sci. 2016, 283, 20152846. [Google Scholar] [CrossRef] [PubMed]
  53. Bale, S.; Beazley, K.; Westwood, A.R.; Bush, P. The importance of using topographic features to predict climate-resilient habitat for migratory forest landbirds: An example for the Rusty Blackbird, Olive-sided Flycatcher, and Canada Warbler. Condor 2020, 122, 1–19. [Google Scholar]
  54. Reitsma, L.R.; Hallworth, M.T.; Benham, P.M. Does age influence territory size, habitat selection, and reproductive success of male Canada Warblers in central New Hampshire? Wilson J. Ornithol. 2008, 120, 446–454. [Google Scholar] [CrossRef]
  55. Araújo, M.B.; Peterson, A.T. Uses and misuses of bioclimatic envelope modeling. Ecology 2012, 93, 1527–1539. [Google Scholar] [CrossRef] [Green Version]
  56. Moilanen, A.; Runge, M.C.; Elith, J.; Tyre, A.; Carmel, Y.; Fegraus, E.; Wintle, B.A.; Burgman, M.; Ben-Haim, Y. Planning for robust reserve networks using uncertainty analysis. Ecol. Modell. 2006, 199, 115–124. [Google Scholar] [CrossRef] [Green Version]
  57. Moilanen, A.J.; Wintle, B.A. The boundary-quality penalty: A quantitative method for approximating species responses to fragmentation in reserve selection. Conserv. Biol. 2007, 21, 355–364. [Google Scholar] [CrossRef]
  58. Hilty, J.A.; Chester, C.C.; Cross, M.S. (Eds.) Climate and Conservation: Landscape and Seascape Science, Planning, and Action; Island Press: Washington, DC, USA, 2012; ISBN 9781610911702. [Google Scholar]
  59. Andrew, M.E.; Wulder, M.; Cardille, J.A. Protected areas in boreal Canada: A baseline and considerations for the continued development of a representative and effective reserve network. Environ. Rev. 2014, 22, 1–26. [Google Scholar] [CrossRef] [Green Version]
  60. Reitsma, L.R.; Jukosky, J.A.; Kimiatek, A.J.; Goodnow, M.L.; Hallworth, M.T. Extra-pair paternity in a long-distance migratory songbird beyond neighbors’ borders and across male age classes. Can. J. Zool. 2018, 96, 49–54. [Google Scholar] [CrossRef] [Green Version]
  61. Robertson, O.J.; Radford, J.Q. Gap-crossing decisions of forest birds in a fragmented landscape. Austral Ecol. 2009, 34, 435–446. [Google Scholar] [CrossRef]
  62. Wilson, S.; Saracco, J.F.; Krikun, R.G.; Flockhart, D.T.T.; Godwin, C.M.; Foster, K.R. Drivers of demographic decline across the annual cycle of a threatened migratory bird. Sci. Rep. 2018, 8, 7316. [Google Scholar] [CrossRef] [PubMed]
  63. Akçakaya, H.R. Linking population-level risk assessment with landscape and habitat models. Sci. Total Environ. 2001, 274, 283–291. [Google Scholar] [CrossRef]
  64. McCarthy, M.A. Spatial population viability analysis. In Spatial Conservation Prioritization; Moilanen, A., Wilson, K.A., Possingham, H.P., Eds.; Oxford University Press: New York, NY, USA, 2009; pp. 123–134. [Google Scholar]
  65. Pärt, T.; Arlt, D.; Villard, M.-A. Empirical evidence for ecological traps: a two-step model focusing on individual decisions. J. Ornithol. 2007, 148, 327–332. [Google Scholar] [CrossRef]
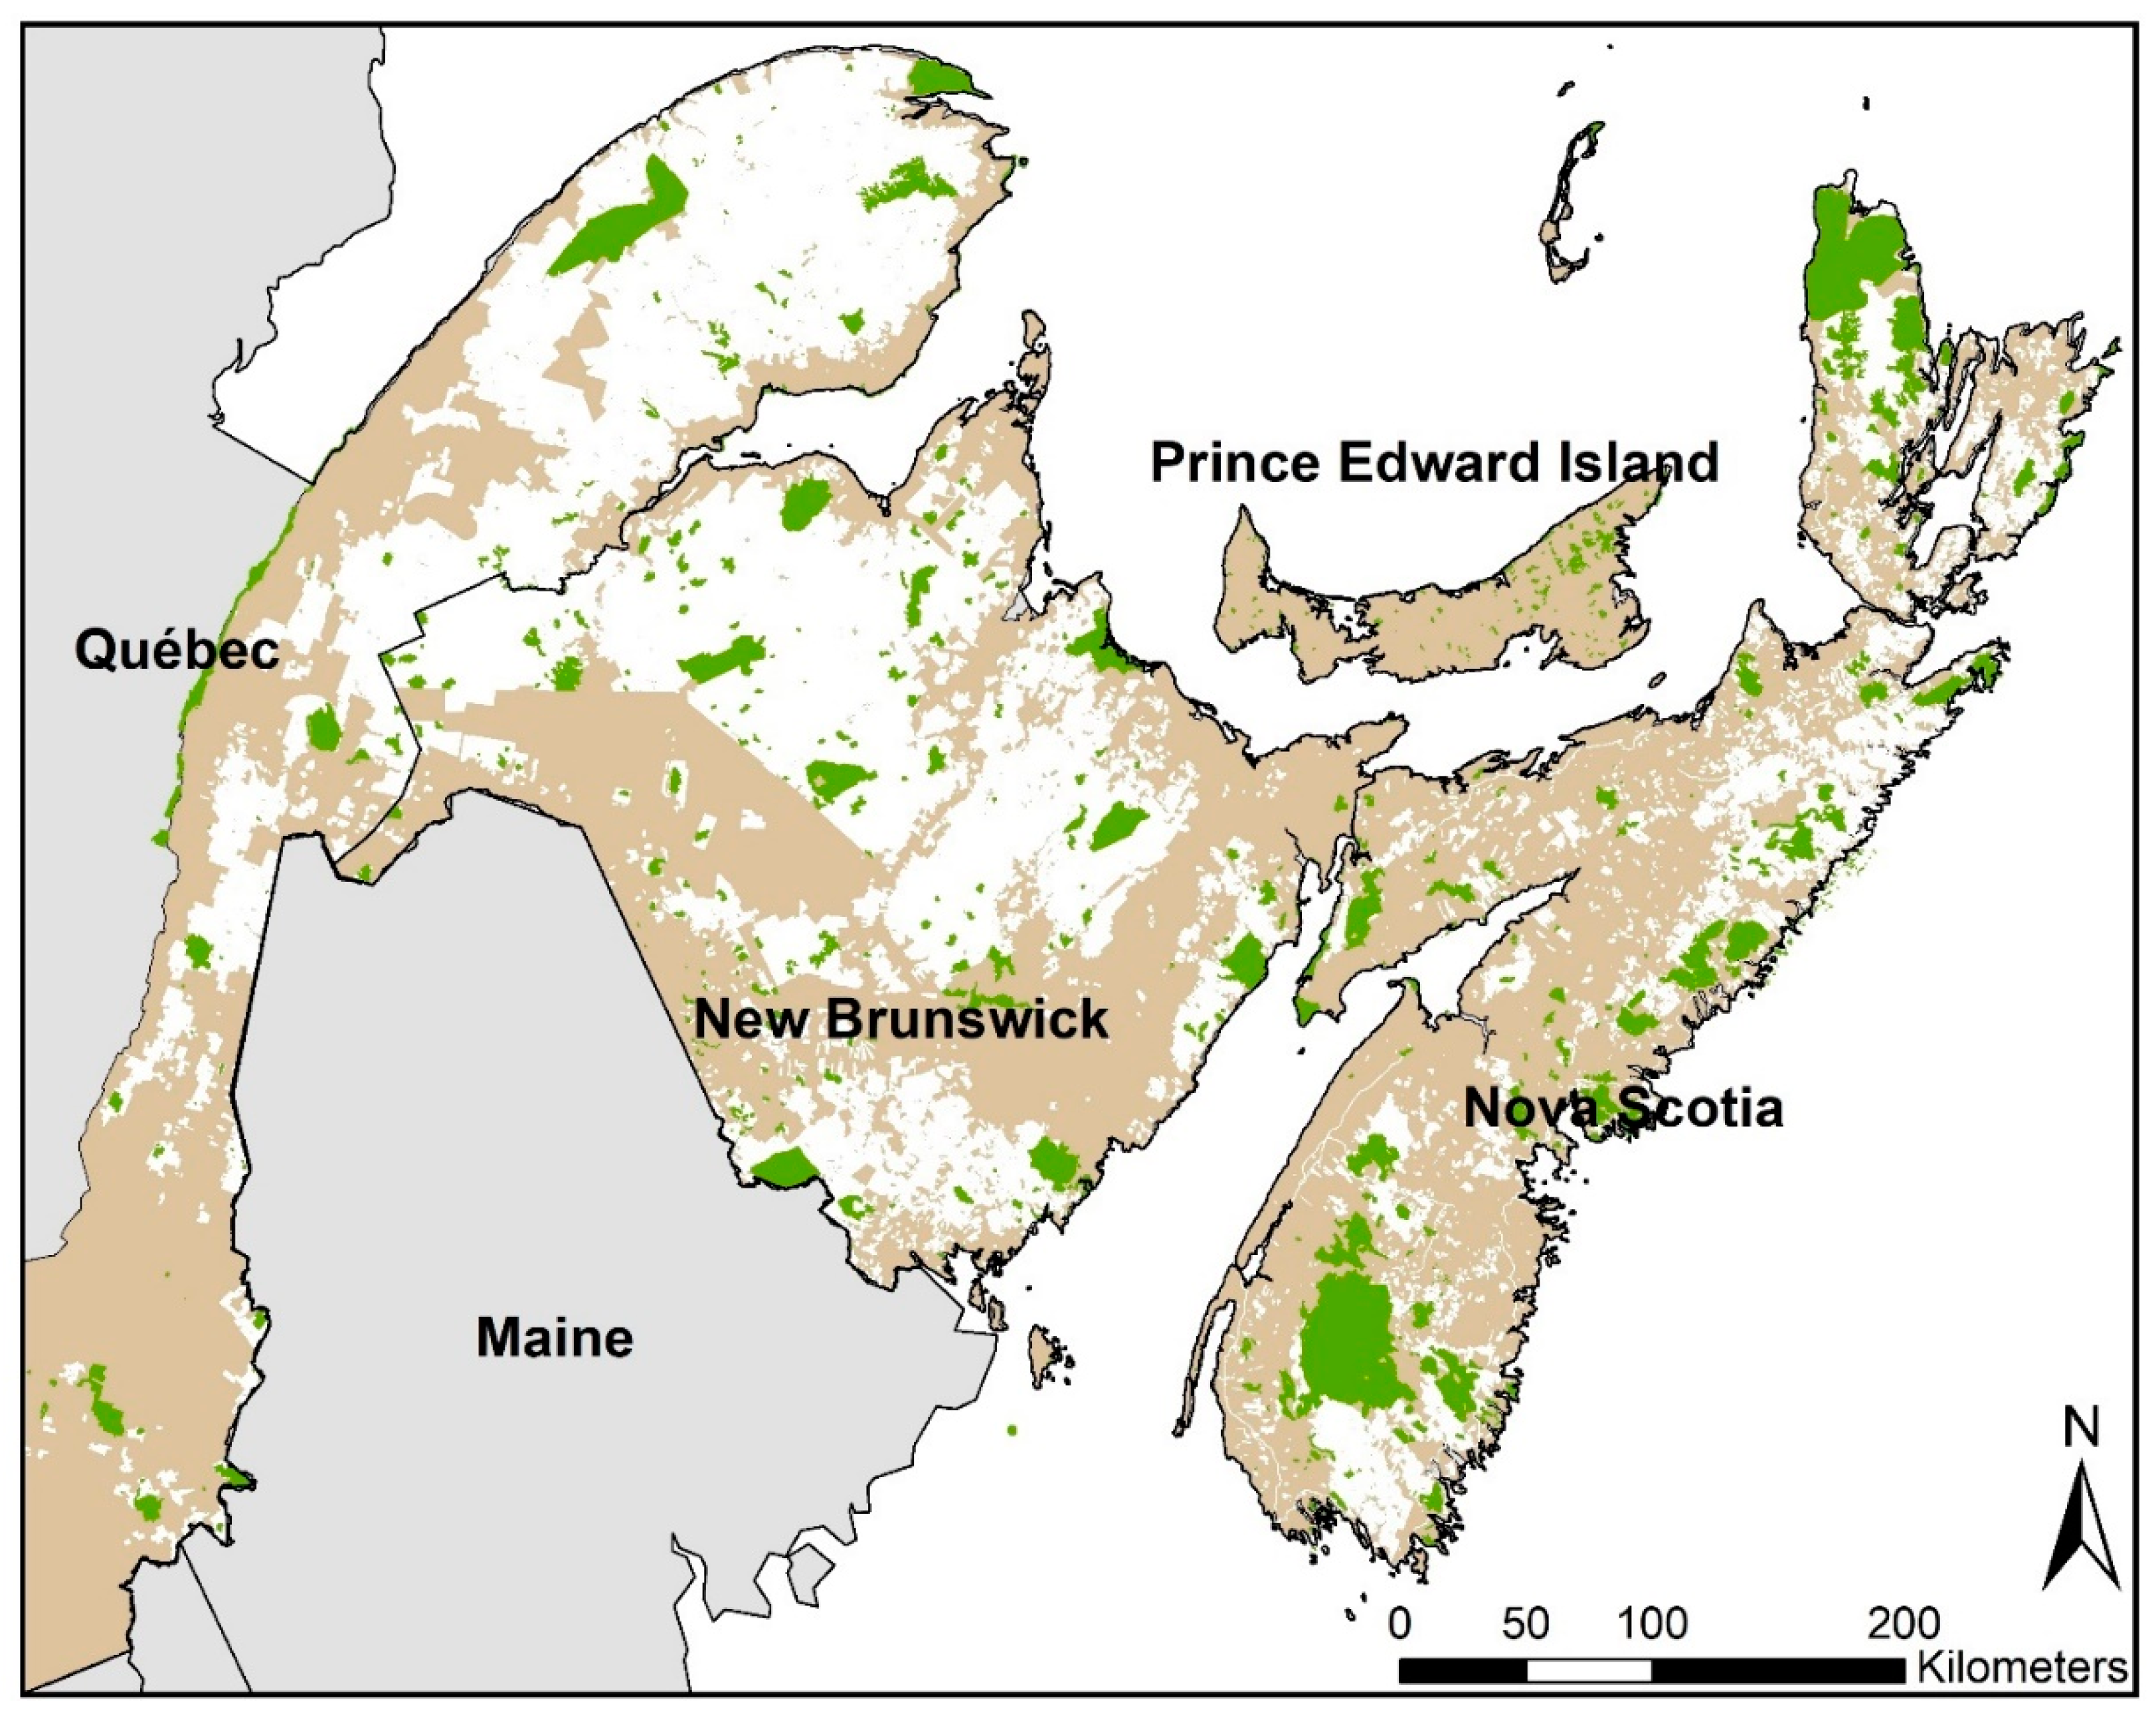
Figure 1. The Canadian portion of the Atlantic Northern Forest (Bird Conservation Region 14) showing protected areas (green) and areas under lease for timber activity (white).
Diversity 12 00061 g001
Figure 2. Zonation scenarios to prioritize areas for land conservation for Canada Warbler in Bird Conservation Region 14 at three natal dispersal distances: low dispersal distance (LDD, 5 km), medium dispersal distance (MDD, 10 km), and high dispersal distance (HDD, 50 km). Scenario descriptions given in Table 1. Priority rank for conservation scaled from blue (highest) to brown (lowest). Protected areas indicated by outlined polygons.
Diversity 12 00061 g002
Figure 3. Zonation scenario to prioritize areas for land conservation with high current population density of Canada Warbler which are connected to protected areas at a medium natal dispersal distance (10 km). Crosshatched polygons indicate protected areas. Blue squares were highly prioritized because they included observations of Canada Warbler made during point count surveys between 2005 and 2015.
Diversity 12 00061 g003
Figure 4. Zonation scenarios to prioritize areas for responsible forest management for Canada Warbler within forestry tenures in Bird Conservation Region 14 at three natal dispersal distances: 5 km (LDD), 10 km (MDD), and 50 km (HDD). Scenario descriptions given in Table 1. Priority rank for management scaled from blue (highest) to brown (lowest). Protected areas indicated by gray polygons.
Diversity 12 00061 g004
Figure 5. Response curves comparing efficiency (proportion of Canada Warbler population density retained per unit area) for two forest management scenarios (left panel) and two land conservation scenarios (right panel). Scenario descriptions given in Table 1. Curves shown at three dispersal distances: 5 km (LDD, solid line), 10 km (MDD, hashed line), and 50 km (HDD, dotted line).
Diversity 12 00061 g005
Table 1. Spatial prioritization scenarios developed to support land conservation and forest management planning for Canada Warbler conservation in the Atlantic Northern Forest.
Scenario GroupScenario CodeDescription of Areas PrioritizedIncluded Data Layers
Land ConservationLC1Areas of high current Canada Warbler (CAWA) population densityCAWA presence 2005–2009, CAWA presence 2010–2015, Population density, Model uncertainty
LC2Areas of high current population density that are connected to protected areasCAWA presence 2005–2009, CAWA presence 2010–2015, Population density, Model uncertainty, Protected areas
LC3Areas of high predicted population density under climate change that are connected to areas of high current population densityCAWA presence 2005–2009, CAWA presence 2010–2015, Population density, Model uncertainty, CAWA climate baseline, CAWA climate 2050
LC4Areas of high predicted population density under climate change that are connected to areas of high current population density and protected areasCAWA presence 2005–2009, CAWA presence 2010–2015, Population density, Model uncertainty, Protected areas, CAWA climate baseline, CAWA climate 2050
Forest ManagementFM1Areas to serve as buffers or reserves during timber harvesting that have high population density and occur in wet forests (assumed to have low timber productivity)CAWA presence 2005–2009, CAWA presence 2010–2015, Population density, Model uncertainty, Working lands, Wet-poor habitat
FM2Areas to harvest in upland forest areas (assumed to have high timber productivity) connected to wet forest areas with high Canada Warbler density to encourage colonization at 10–30 years post-harvestPopulation density, Model uncertainty, Working lands, Wet-poor habitat
Population density, Model uncertainty, Working lands, Wet-poor habitat, Upland habitat, Protected areas
FM3Areas to harvest in upland forest areas (assumed to have high timber productivity) with active avoidance of areas of high population densitySubtraction of results of FM1 from FM2
Table 2. Description of data layers used to generate prioritization scenarios for Canada Warbler in the Atlantic Northern Forest (Bird Conservation Region 14).
CategorySpatial Data LayerDescriptionYear Pub-lish-edUnitsData Ownership
Administrative BoundariesProtected areasThe Conservation Areas Reporting and Tracking System geodatabase contains data on national, provincial, and privately-held protected lands, updated on an annual basis.2015categoriesCanadian Council on Ecological Areas
BCR14Canadian portion of Bird Conservation Region 14—Atlantic Northern Forest.2013categoriesNABCI
Provinces/statesFederal, provincial, and state administrative regions.2000categoriesESRI 2000
Working lands Extent of actively leased or owned tenures by forestry companies, including both private and Crown lands.2014categoriesGlobal Forest Watch Canada; Environment Canada
Public landsUnprotected public hands held by the Crown or other government bodies. May be currently under lease.2013–2016categoriesGovernment (Gov’t) of Nova Scotia (NS); Gov’t of New Brunswick (NB), Gouv’t du Québec, Gov’t of Prince Edward Island (PEI)
Avian DataPopulation density Mean predicted population density of Canada Warbler in 2014 based predominantly on landcover and disturbance variables.2013males/hectareBoreal Avian Modelling (BAM) Project, Haché et al. 2014
Model uncertaintyStandard deviation of population density of Canada Warbler in 2014 based predominantly on landcover and disturbance variables.2013males/hectareBAM, Haché et al. 2014
CAWA presence 2005–2009Locations where Canada Warblers were observed in point count surveys between 2005–2009.2015presenceBAM
CAWA presence 2010–2015Locations where Canada Warblers were observed in point count surveys between 2010–2015.2015presenceBAM
CAWA climate baselineMean projected population density of Canada Warbler from 1961–1990.2014males/hectareBAM, Stralberg et al. 2015
CAWA climate 2050Mean projected population density of Canada Warbler in 2050 based predominantly on climate-related variables.2014males/hectareBAM, Stralberg et al. 2015
LandcoverWater bodiesProvincial hydrographic features at 1:10 000 scale.2008–2014N/ANS Department of Natural Resources; NB Department of Natural Resources/GeoNB (link); Gov’t of Québec (pers. comm.); Gov’t of PEI;
Wet-poor habitatTreed areas categorized as wet-poor by the Northeastern Habitat Types Classification developed for ecosystems and habitats in the Northeast US and Atlantic Canada.2015N/AThe Nature Conservancy—Eastern Conservation Science; Ferree and Anderson 201
Upland habitatTreed areas categorized as wet-poor by the Northeastern Habitat Types Classification developed for ecosystems and habitats in the Northeast US and Atlantic Canada.2015N/AThe Nature Conservancy—Eastern Conservation Science; Ferree and Anderson 2013
Table 3. Percent change in mean cell-level rankings across Zonation prioritization scenarios to support land conservation for the Canada Warbler when comparing between different estimated dispersal distances: 5 km (LDD), 10 km (MDDs), and 50 km (HDD). Scenario descriptions given in Table 1.
ScenarioDispersal Estimates ComparedMean Percent Change in Priority Ranking of a Given Cell between ScenariosStandard Deviation of Percent Change in Priority Ranking
LC1MDD-LDD33
LC1HDD-MDD97
LC2MDD-LDD44
LC2HDD-MDD129
LC3MDD-LDD34
LC3HDD-MDD77
LC4MDD-LDD45
LC4HDD-MDD1211