Article

Genetic Structure and Connectivity of the Red Mangrove at Different Geographic Scales through a Complex Transverse Hydrological System from Freshwater to Marine Ecosystems

by
Landy R. Chablé Iuit
1,
Salima Machkour-M’Rabet
1,*,
Julio Espinoza-Ávalos
2,†,
Héctor A. Hernández-Arana
3,
Haydée López-Adame
4 and
Yann Hénaut
5
1
Laboratorio de Ecología Molecular y Conservación, El Colegio de la Frontera Sur. Av. Centenario km 5.5, Chetumal C.P. 77014, Quintana Roo, Mexico
2
El Colegio de la Frontera Sur. Av. Centenario km 5.5, Chetumal C.P. 77014, Quintana Roo, Mexico
3
Laboratorio de Estructura y Función de Ecosistemas Costeros Tropicales (EFECT-LAB), El Colegio de la Frontera Sur. Av. Centenario km 5.5, Chetumal C.P. 77014, Quintana Roo, Mexico
4
ATEC Asesoría Técnica y Estudios Costeros SCP, Calle 63b, no. 221, fraccionamiento Yucalpetén, Mérida CP 97238, Yucatán, Mexico
5
Laboratorio de Etología, El Colegio de la Frontera Sur. Av. Centenario km 5.5, Chetumal C.P. 77014, Quintana Roo, Mexico
*
Author to whom correspondence should be addressed.
Sadly, our colleague Julio passed away before publication.
Diversity 2020, 12(2), 48; https://doi.org/10.3390/d12020048
Submission received: 5 December 2019 / Revised: 19 January 2020 / Accepted: 24 January 2020 / Published: 27 January 2020
(This article belongs to the Section Plant Diversity)

Abstract

:
Mangrove forests are ecologically and economically valuable resources composed of trees morphologically and physiologically adapted to thrive across a range of habitats. Although, mangrove trees have high dispersion capacity, complexity of hydrological systems may lead to a fine-scale genetic structure (FSGS). The Transverse Coastal Corridor (TCC) is an interesting case of hydrological systems from fresh to marine waters where mangrove forests dominate. We evaluated genetic diversity and structure of Rhizophora mangle across a range of hydrological conditions within the TCC using inter-simple sequence repeat molecular markers. Sampling included four hydrological systems, two localities inside each system, and fringe and dwarf trees. Genetic differentiation was evaluated at local (<100 km) and fine (<10 km) scales through a set of analyses, and genetic diversity was evaluated at all scale levels and between fringe and dwarf physiognomic types. Rhizophora mangle exhibited a high genetic structure at both scales with high genetic diversity. The genetic structure observed among hydrological systems likely reflects the historical dispersion of mangroves, whereas the FSGS reflect contemporary processes such as seed dispersal restriction, habitat fragmentation, and local water flow regimes. A higher genetic diversity for dwarf than for fringe trees and differentiation between both physiognomic types at a fine-scale were observed and discussed.

1. Introduction

Mangrove forests are distributed worldwide in intertidal zones of tropical and subtropical regions and represent a highly productive ecosystem that contributes to functional processes such as demineralization, organic matter production, and water quality improvement. Mangroves also provide valuable ecological services such as breeding and feeding areas for fauna, coastal protection against extreme weather events, and high capacity in storing carbons [1,2,3]. Mangrove trees possess morphological and physiological adaptations to thrive in marine and estuarine environments with large fluctuations in salinity, nutrients, wind regimen, and flooding conditions [1,4,5].
Rhizophora mangle L. 1753 (Malpighiales, Rhizophoraceae), which is the red mangrove, is widely distributed throughout Mexico [6], and is the dominant species along the coasts of the Yucatan Peninsula (YP) where the mangrove forests exhibit broad structural variations [1,5] comprising three main physiognomic types: fringe, basin, and dwarf mangroves [1]. Fringe mangroves are in direct contact with water bodies (edge of lagoon or swamp along the coast) and are highly influenced by tidal inundation or river discharge [1,7]. Dwarf mangroves, which are typically less than 3 m in height [8], lack the main stem with reduced canopy size and scarce production of flowers and propagules. They are located behind fringe and basin mangroves or directly alongside of inland water bodies in environments that are characterized by a deficiency in nutrients (e.g., phosphorus) and hydrological stress [1,9]. The importance and physiological effects of fluctuations in nutrient availability, sedimentation, and hydric stress on the growth of mangroves trees have been widely discussed [5,7,10,11,12,13,14]. However, research associated with genetic differentiation between mangrove physiognomic types are scarce [14,15].
Genetic structure and connectivity of mangrove forests depend on seed dispersal mechanisms, pollinators, availability of suitable substrate, level of fragmentation, anthropogenic pressure, coastal/estuarine geomorphology, hydrochory nature (passive dispersal of organism by water), and a hydrology regimen among other factors [14,16,17,18,19,20]. Long distance seed dispersal (LDD) of mangrove species is expected considering their hydrochory nature, a highly efficient mechanism for plant dispersion leading to a high gene flow, and a low population structure [20]. The LDD process has been demonstrated using genetic tools [21] for Avicennia germinans L. (L. 1764) in addition to mark and recapture experiments for different mangrove species [22]. However, other studies have demonstrated limited gene dispersal for mangrove species through pollen and seed dispersal, which leads to a fine-scale genetic structure (FSGS) as revealed for Rhizophora racemosa G. Mey within a Cameroon estuarine system [18], R. mangle, and A. germinans at an estuary in Panama [22], R. mangle along the coasts of the Yucatan Peninsula [14], A. germinans and A. schaueriana along the Brazilian coast [23], and more.
The genetic population structure for R. mangle is well documented. For example, Hodel et al. [24] showed a high genetic connectivity between the Atlantic and Gulf coasts of Florida. Pil et al. [25] highlighted a genetic differentiation between populations from the northern and southern areas of the State Rio Grande do Norte on the Brazilian coast, while Arbeláez-Cortes et al. [26] detected a low but significant structure among populations along the Colombian Pacific coast. In Mexico, the first study at a wide geographical scale revealed a genetic difference between populations from the Pacific and the Atlantic coasts [27]. Sandoval-Castro et al. [17] showed five clades for R. mangle along Mexican coasts with no genetic differentiation for populations from the Gulf of Mexico and the Caribbean region. Nevertheless, the recent regional study [14], using microsatellites genetic markers, showed an evident genetic differentiation between the Gulf of Mexico and Mexican Caribbean populations. At the regional scale, Sandoval-Castro et al. [28] reported genetic differentiation in two groups for populations along the northwestern coast of Mexico, and Reyes Medina et al. [29] presented a genetic structure for R. mangle inside the complex Magdalena Bay in Baja California Sur. There are very few genetic studies at regional or smaller geographical scales within the YP [14]. The YP region is particularly important for mangrove species because: (1) it contains more than 50% of the total mangrove cover in Mexico [6] and was declared a hotspot for biodiversity conservation [30], (2) its coastline is highly vulnerable to climatic events such as hurricanes and storm surges, which negatively affect mangrove forests [9], and (3) the land use conversion rate due to accelerated urban and tourism development of this region, particularly along the shoreline, has resulted in the widespread destruction of established mangrove forests and associated ecosystems [31,32].
The “Transverse Coastal Corridor” (TCC), which is located in the southern part of Quintana Roo (Mexico), is a complex ecological corridor characterized by connectivity processes among ecosystems through hydrological, biogeochemical, and ecological interactions [2]. A fine-scale genetic structure of R. mangle populations could be expected to occur in the TCC due to mangroves inhabiting three contrasting hydrological systems [2]: (1) Bacalar Lagoon, the second largest freshwater karstic lake in Mexico, characterized by a low level of nutrients (oligotrophic) particularly nitrogen, (2) Chetumal Bay, which is the largest estuarine-coastal lagoon in Mexico, presenting spatial and seasonal variations from oligotrophic to eutrophic in addition to brackish waters, and (3) the Caribbean Coast of Mexico with the most complex coral reef ecosystem of the Mesoamerican Barrier Reef System. These hydrological systems are interconnected by aboveground (channels and flood zones) and underground flows that facilitate physical, chemical, and biological transfers, which drive ecological and connectivity processes that determine biodiversity and ecosystem function. Mangroves are one of the main vegetation types in the TCC. The principal mangrove physiognomic types along this corridor are fringe, dwarf, and basin [2].
Several molecular techniques are available, and those that have been used to study the genetic population structure of mangroves include isozymes [27], microsatellites [14,17,22,28,29], chloroplast DNA [22,33,34], AFLP [35], RAPD [36], and ISSR [33,36,37,38,39]. Inter-simple sequence repeat (ISSR) is a dominant molecular marker that allows the amplification of a large number of highly polymorphic loci [40], and have been used to evaluate genetic diversity and structure in many plant species [41,42,43], particularly mangrove species (see above for references).
Considering the unique hydrological situation of the TCC system for which there is no information regarding the structure of mangrove populations and differing mangrove physiognomic types in the southern part of Mexico, we took advantage of the occurrence of Rhizophora mangle in contrasting hydrological systems of the TCC to focus our study, using ISSR molecular markers, on the following hypothesis: (i) dwarf and fringe mangrove trees do not present a genetic differentiation pattern at the local geographic scale (<100 km), (ii), different hydrological and hydrographical conditions of the TCC system structure, genetically different patches of the R. mangle forest, (iii) an FSGS is expected for R. mangle inside each hydrological system of the TCC, and (iv) the two different physiognomic types of R. mangle are genetically separated in two different lineages at a fine geographic scale.

2. Materials and Methods

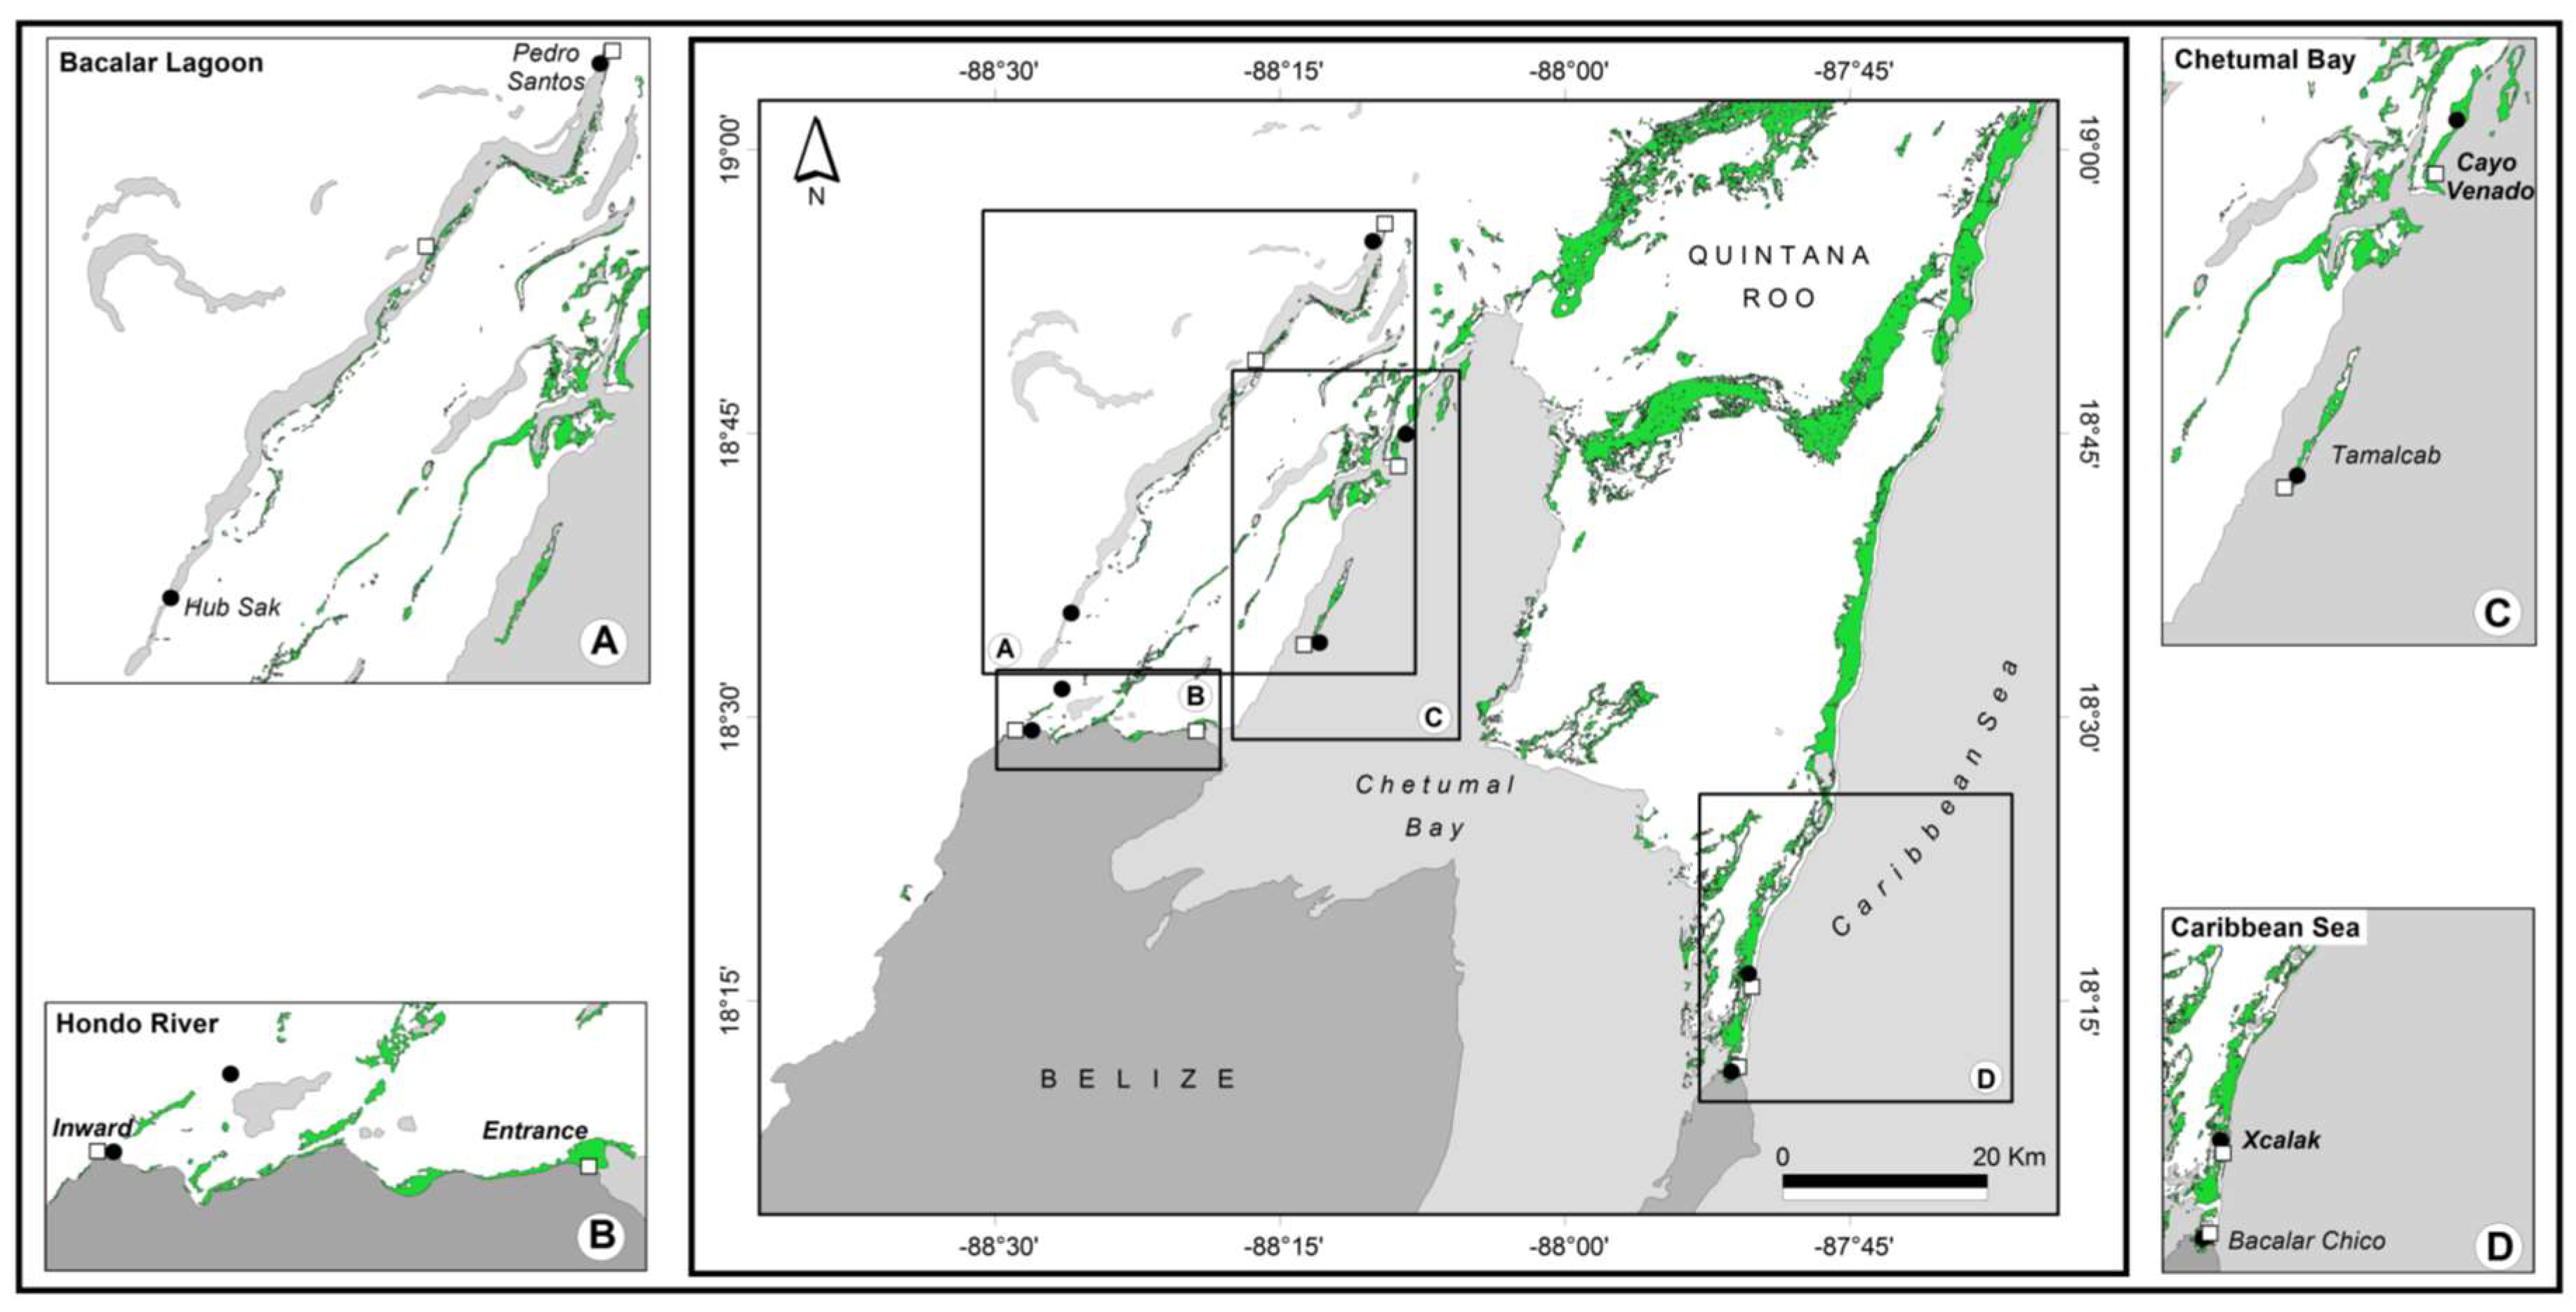
2.1. Sampling Sites and Collection

The study location comprises the area named the Transverse Coastal Corridor of southern Quintana Roo located in the southeastern Yucatan Peninsula. Hernández-Arana et al. [2] described the main features of the different coastal ecosystems, and the extent from the marine shorelines of the Caribbean coast to the brackish environments of Chetumal Bay up to the freshwater environments of the Rio Hondo and Bacalar Lagoon. The mangrove association is composed of four species Rhizophora mangle, Laguncularia racemosa L. (C.F. Gaetn 1807), Avicennia germinans L., and Conocarpus erectus (L. 1753) along the marine and brackish shorelines of the Caribbean Sea and Chetumal Bay. However, the mangrove association is reduced to three species, known as R. mangle, L. racemose, and C. erectus, along the shorelines, which interconnects channels and associated floodplains of freshwater environments of Rio Hondo and two species, known as R. mangle and C. erectus in Bacalar Lagoon. An outstanding feature of the mangrove association is the large extension covered by the dwarf physiognomic type of R. mangle. Dwarf mangroves are adapted to thrive in extreme conditions of prolonged flooded and dry periods as well as to shallow and poor soils [2]. There are three main climatic periods influencing the region, a dry period from February/March to June, a wet period from July to October, and a period of cold fronts from arctic air incursions throughout the winter months with less precipitation [44,45]. Recurrent events of tropical storms and hurricanes are the main climatic disturbance phenomena that strongly influence mangrove structures across the region [9,46].
Our sampling design considered the diversity of hydrological systems, the physiognomic types of R. mangle that inhabit in the systems, and the potential connectivity among them by including three factors: (1) hydrological regimes at the local scale (10 km to <100 km, [18]) that could affect the connectivity of R. mangle populations that inhabit them, (2) genetic connectivity within each hydrological system at a fine-scale (100 m to <10 km) by comparing R. mangle populations from two very close localities, and (3) fringe and dwarf physiognomic types of R. mangle. Four areas were selected to sample R. mangle including the three principal TCC hydrological systems (Bacalar Lagoon, Chetumal Bay, and the Caribbean Coast) and one important connecting (channel) area (Hondo River) (Figure 1 and Table S1). At each area, two localities were chosen to sample R. mangle at the fine-scale due to the presence of fringe and dwarf physiognomic types. At each locality, two transects parallel to the shoreline (one per physiognomic types of mangrove) of 450 m in length and 200 m in width were delimited. In each transect, five young leaves with petioles were collected from 15 trees of each physiognomic types selected haphazardly, which ensures a minimal distance of 10 m between samples to avoid sampling the same tree [18]. Immediately after cutting the leaves, PVP-40 (Sigma-Aldrich) was added at the cutting petiole zone for preservation. Leaves from each tree were placed and labelled in a botanical leaf press. In the laboratory, leaves of each tree were removed from the leaf press, and then repeating the PVP-40 addition at the cutting leaf zone. The leaves from each tree were individually wrapped in aluminum paper and placed in a plastic labeled bag for subsequent storage in an ultra-freezer (−70 °C) until DNA extraction was performed. Samples of R. mangle were collected under permits SGPA/DGVS/13642/16 and SGPA/DGVS/05702/17 emitted through the Secretariat of Environment and Natural Resources (Semarnat) of Mexico.

2.2. DNA Extraction and ISSR-PCR Amplification

Total genomic DNA for each sample tree was isolated from a small part of one leaf (~0.2 mg). Leaf tissue was grinded to powder using a porcelain mortar and liquid nitrogen. Afterward, the powder sample was re-suspended in a lysis solution of CTAB 2% protocol and the extraction method was applied [47]. DNA concentration and quality were determined using a Qubit 2.0 fluorometer (Invitrogen) and electrophoresis in 0.8% agarose gel with TAE (1x) with GelRed (Biotum) as post-staining.
A total of 23 ISSR primers were screened of which 19 displayed band patterns. Nine ISSR primers showed clear and unambiguous scoring, and four [(GAA)6, (AG)8C, (CA)8AC, (AG)8YC] were selected for further analyses due to exhibiting high polymorphism (Table S2). PCR amplifications were performed in a 15-µL reaction volume containing ~2 µL of template DNA (~ 20 ng), 1.5 µL of 5× buffer (Promega), 0.3 µL (0.20 mM) of dNTP mix (Promega), 1.8 µL (3 mM) of MgCl2 (Promega), 0.3 µL of primer (1 µM) (Integrate DNA Technology), 0.25 µL (1.25 U) Taq Polymerase (GoTaq Flexi, Promega), and 8.85 µL of ultrapure water. All amplifications were processed in a gradient thermocycler (T100, Bio-Rad) under the following conditions: initial denaturation at 94 °C for 5 min, 45 cycles of denaturation at 94 °C for 45 s, primer annealing temperature of 52 to 60 °C depending on the ISSR primer (Table S2) for 45 s, an extension at 72 °C for 90 s, and a final extension at 72 °C for 7 min. PCR products were separated by electrophoresis on 2% agarose gel with TAE 1X using GelRed (Biotum) as a post-staining method at 110 V for 3 h. A 100 bp DNA ladder (Promega) was used to evaluate the PCR product length. Band patterns were visualized and digitized on an imaging system (Photodoc-IT 65, UVP). The presence (coded as 1) or absence (coded as 0) of the ISSR bands pattern was scored. This information enabled the generation of the binary matrix used for analysis where only individuals that present genetic information for all primers were included. This explains the discrepancy between the number of individuals collected and processed, and the number of individuals used in the analysis (Table S1).

2.3. Data Analysis

First, we verified if fringe and dwarf physiognomic types of mangrove presented some level of genetic differentiation and, therefore, if they could be pooled for further analyses. This was achieved by performing different and complementary analyses: the number of private bands (loci), a principal coordinate analysis (PCOA), and an analysis of molecular variance (AMOVA) performed using GenAlex 6.5 [48,49].
Genetic diversity of R. mangle was determined using the percentage of polymorphic loci (PPL) and expected heterozygosity (He) for the whole dataset for each hydrological system (including two localities and two mangrove physiognomic types) considered in this study, and for fringe and dwarf physiognomic types of mangrove at each locality using GenAlex 6.5. Furthermore and due to the ISSR genetic markers being dominant, Hickory v1.1 [50] was used to determine a genetic diversity parameter (hs) based on the Bayesian method that does not assume a Hardy-Weinberg equilibrium. To determine the best fit model for our data, the four models proposed by Hickory were run using the default parameters: (1) the full model that considers population differentiation (θ analogous to FST) and inbreeding (f analogous to FIS), (2) the θ = 0 model that considers no population differentiation, (3) the f = 0 model that considers no inbreeding, and (4) the free model that randomly selects values of f from its prior information. The choice of the model is based on the value of DIC (Deviance Information Criterion) and Dbar parameters where the smallest parameters are better [51,52].
Genetic differentiation was approached at different geographic scales. At the local scale, genetic differentiation was evaluated among hydrological systems by applying ΦST, an analogue of Wright’s FST, determined for all pairs of hydrological systems (9999 permutations in GenAlex 6.5) and with the θII value, the most relevant statistic to evaluate the genetic differentiation among contemporaneous populations proposed by Hickory v1.1 [51]. In order to confirm these results, we applied two different methods to identify the most probable genetic structure among the four hydrological systems inside the TCC: 1) the Bayesian clustering analysis implemented in Structure 2.3.3 (basic algorithm in Reference [53], with an extension to the method shown in References [54,55]) was performed to infer the potential number of populations (or clusters, defined as K). This method was designed to identify the number of clusters (K) and each individual (sample) was assigned with a probability (qi) to one cluster or more (admixed genotypes). The admixture and allele correlated frequency models were performed, and we applied the locprior model (locpriorinit = 1), which uses the sampling location to assist in identifying clusters, as recommended when the level of the population structure is weak [55,56]. The program was run 10 times for different values of K (from 1 to 11) to determine the optimal number of clusters with the Markov chain Monte Carlo algorithm using a burn-in period of 100,000 steps followed by 100,000 steps. To identify the most probable number of K that best fitted our data, we used two methods. First, we identified the maximal value of Ln P(D), which is the value that indicates the start of "more-or-less plateaus" for larger K [57]. Second, we used the ΔK method [58] that can be found in the Structure Harvester website [59], and 2) the graphical method of the PCOA was performed with GenAlex 6.5 to show the relationships among samples from all hydrological systems.
The fine-scale genetic structure was approached by zooming inside each hydrological system. The genetic differentiation between both localities inside each area was evaluated by AMOVA (9999 permutations) and the graphical method of the PCOA. Furthermore, we determined the ΦST parameter between both localities inside each hydrological system (9999 permutations). To test an isolation-by-distance pattern (IBD), we applied a Mantel test that identifies any significant relationships between two data matrices (genetic and geographic). Lastly, a spatial autocorrelation [60,61,62] for multiple populations was carried out to evaluate the potential dispersion of mangroves inside each hydrological system. We used 9–14 (following area) even distance classes of 30 m. The significance of autocorrelation was tested by 999 random permutations, and the estimation of the 95% confidence interval around r was determined by using 1000 bootstrapping. These analyses were performed using GenAlex 6.5.
Lastly, a genetic differentiation between fringe and dwarf mangrove over a local geographical scale was evaluated by the θII parameter from Hickory v1.1, and the fine-scale analysis of the genetic relation between fringe and dwarf physiognomic types was evaluated using an analysis of molecular variance (AMOVA; 9999 permutations) at each locality. To determine if fringe and dwarf physiognomic types of mangrove displayed a differential potential dispersion, a spatial autocorrelation for multiple populations was performed considering the whole dataset (not sufficient data at each locality). Six (for dwarf) and ten (for fringe) even distance classes of 15 m were used, and analyses were performed under the same previously mentioned conditions. These analyses were processed using GenAlex 6.5.

3. Results

The selection of four primers resulted in a total of 81 clear and unambiguous fragments of ISSR markers (loci) for 198 sample of R. mangle trees from eight localities of the TCC system. The identification of only four private bands, two per mangrove physiognomic types, confirmed that all samples belonged to the same species. Data analysis with Hickory v1.1 suggested the full model as better for all systems (localities, hydrological systems, and fringe vs. dwarf mangroves) based on DIC and Dbar parameters (Table S3).

3.1. Genetic Differentiation of Dwarf and Fringe Mangrove Trees at A Local Geographical Scale (< 100 km)

Genetic analysis of 100 fringe and 98 dwarf physiognomic types of R. mangle did not support genetic differentiation. AMOVA revealed an extremely low (1%) level of differentiation (Table S4), and the two first axis of PCOA did not allow any group to be identified (Figure S1). Furthermore, the θII parameter was very low (θII = 0.012 ± 0.003). Accordingly, samples of fringe and dwarf mangrove trees were pooled for the genetic structure and diversity analysis.

3.2. Local-Scale (10 km–100 km) Genetic Diversity and Structure of Rhizophora Mangle

Considering all R. mangle individuals throughout the TCC system, GenAlex analysis revealed very high polymorphism (100%) and expected heterozygosity (He = 0.327 ± 0.019), and Hickory analysis gave similar results with the HT parameter defined as the total heterozygosity if all locations are considered as one (HT = 0.310) and the HS parameter defined as the mean heterozygosity within each system (HS = 0.282) [52]. At the hydrological system level (Table 1), all genetic diversity parameters remained high regardless of the program used. The highest level of genetic diversity was at the Hondo River (PPL = 89%, He = 0.292, hs = 0.288) and Bacalar Lagoon (PPL = 81%, He = 0.296, hs = 0.288), while Chetumal Bay presented the lowest diversity (PPL = 79%, He = 0.271, hs = 0.266).
Genetic differentiation considering the whole dataset was relatively low with the ΦST coefficient of 0.148 (***) and the θII parameter of 0.125 was also significant (95% credible interval: 0.097–0.157). The pairwise genetic differentiation coefficients (ΦST) suggested a hierarchical spatial structure of genetic differentiation with a first “group” (bold values in Table 2) including the Caribbean Coast and presenting the highest values of ΦST, a second “group” (italic values in Table 2), comprising Chetumal Bay, and a third group including the Hondo River and Bacalar Lagoon (underlined value in Table 2). In all of these “groups,” pairs with the Bacalar Lagoon always present the lower value.
The method of Ln P(D) in order to identify the appropriate number of clusters (K) suggested K = 3 (Figure S2A), while the Delta K method applied in the Structure Harvester website showed a peak at K = 2 with a very high and close value for K = 3 (Figure S2B). Consequently, both genetic structures (K = 2 and K = 3) are presented. When the probability assignment estimated by the Structure was used, all sample trees were partitioned into two clusters showing a gathering of initial localities evaluated by the Q probability values (Table S5). Each of the new clusters was clearly defined by Chetumal Bay (cluster 1 in red on Figure 2A) and Caribbean Coast (cluster 2 in blue on Figure 2A) samples, which both have a very good membership (mean for both localities: 97% and 97% respectively). Both hydrological systems (Bacalar Lagoon and Hondo River) displayed a mix of clusters (1 and 2) with different membership proportions (Table S5). Bacalar Lagoon showed higher similarity with Chetumal Bay at two localities (membership coefficients of Pedro Santos and Huub’ Sak to cluster 1, Table S5) while the entrance locality of Hondo River showed high similarity with Chetumal Bay, and inward locality of the river was more similar to the Caribbean Coast (membership coefficients in Table S5). An increase to three clusters continued to show cluster 1 and cluster 2 are well defined for Chetumal Bay and the Caribbean Coast, respectively, (membership coefficients in Table S5) while the other two areas exhibited a more complex situation (Figure 2B). In the third cluster, the inward locality of Hondo River was well defined (membership coefficient of 95%, cluster 3 in yellow in Figure 2B) while the entrance of this river was influenced by Chetumal Bay and an inward Hondo River locality (membership coefficient in Table S5). Each locality of Bacalar Lagoon presented a different situation. The Pedro Santos locality showed an admixture of cluster 1 (Chetumal Bay, red in Figure 2B) and cluster 2 (Caribbean Coast, blue in Figure 2B) with a low contribution of cluster 3 (yellow in Figure 2B), while the Huub’ Sak locality showed contribution mainly from both Chetumal Bay (cluster 1 in red in Figure 2B) and Hondo River inward (cluster 3 in yellow in Figure 2B) with a very low contribution of the Caribbean Coast (cluster 2 in blue in Figure 2B) (Table S5 for membership coefficients). When principal coordinate analysis (PCOA) was performed, a clear separation of Chetumal Bay and Caribbean Coast (red circle and blue rhombus, respectively, in Figure 3) occurred, as found with a Bayesian analysis of the Structure. On the positive side of the y-axis, a large number of points of the inward locality of Hondo River (yellow, empty square in Figure 3) formed the third cluster as proposed by the Structure analysis. Other localities (entrance of Hondo River and the two localities of Bacalar Lagoon, Figure 3) presented different contribution levels from the three principal groups (Chetumal Bay, Caribbean Coast, and inward locality of Hondo River) in agreement with the Structure analysis for K = 3.

3.3. Fine-Scale (<10 km) Genetic Structure of Rhizophora Mangle

Both localities of each hydrological system showed some genetic structure throughout AMOVA (Table S6) and PCOA (Figure 4) with high ΦST coefficients between them: Chetumal Bay (ΦST = 0.117, P = 0.0001), Bacalar Lagoon (ΦST = 0.188, P = 0.0001), Hondo River (ΦST = 0.178, P = 0.0001), and Caribbean Coast (ΦST = 0.138, P = 0.0001). Furthermore, the Mantel test indicated a significant IBD pattern inside each hydrological system: Chetumal bay (r2 = 0.06, P = 0.001), Bacalar Lagoon (r2 = 0.238, P = 0.001), Hondo River (r2 = 0.217, P = 0.001), and Caribbean Coast (r2 = 0.099, P = 0.001).
The correlograms were globally significant for all hydrological systems and spatial auto-correlation identified at a fine-scale spatial aggregation of individuals at each hydrological system (Figure 5) but with different patterns. The Chetumal Bay and Caribbean Coast systems (Figure 5A,D) displayed a significant positive auto-correlation at the first three distance classes (0–90 m). The Laguna Bacalar system (Figure 5B) presented a significant positive auto-correlation at the first two distance classes (0–60 m) whereas the Hondo River system (Figure 5C) had a significant positive autocorrelation over the first eight distance classes (0–240 m).

3.4. Genetic Characterization of Fringe and Dwarf Physiognomic Types of Mangroves at a Fine Geographic Scale

Generally, dwarf mangroves exhibited slightly higher genetic diversity parameters than fringe mangroves considering all of the geographical studied area [dwarf: PPL = 96.30%, He = 0.328 ± 0.019, hs = 0.293 ± 0.013, and fringe: PPL = 93.83%, He = 0.311 ± 0.020, hs = 0.286 ± 0.013) at each locality (PPL, He, and hs, Table 1). Although both physiognomic types of mangroves did not distinguish genetic differentiation in the analyses integrating the whole dataset (see the beginning of the results), a fine-scale genetic differentiation was evident through AMOVA (Table S7). At all localities (except for Hondo River inward), AMOVA showed a high and significant genetic differentiation. Auto-correlation at the fine-scale revealed a differential aggregation of individuals for fringe and dwarf physiognomic types of mangrove (Figure 5E,F), which show a significant positive auto-correlation up to 75 m and 30 m, respectively.

4. Discussion

This study represents one of the few contributions to the genetic knowledge of Rhizophora mangle in Mexico, and is the first that simultaneously considers the dwarf and fringe physiognomic types of the species, a fine geographic scale analysis, and analyses throughout a complex transverse hydrographic system (TCC). Our results highlight a clear genetic structure for the Rhizophora mangle community across the TCC, which shows a clear separation between Chetumal Bay (including the entrance of Hondo River) and the Mexican Caribbean Coast. This was unexpected considering the interconnection between Chetumal Bay and the Caribbean Sea through its wide and long mouth [63] and other minor interconnections such as the natural and narrow channel (Bacalar Chico), and the artificial channel (Zaragoza) [64]. However, it is worth noting that Chetumal Bay is a 2600 km2 coastal lagoon with a strong salinity gradient and that our sampling sites limited to the western and northwestern shores away from the direct influence of the Caribbean Sea. The genetic structure of mangrove forests observed in the TCC contrasts with studies, which shows high connectivity for mangrove species, such as R. mangle and Avicennia germinans on the Florida coasts [24] and R. mangle forming genetically homogeneous groups within wide geographical areas along Mexican coasts [17,27]. Nonetheless, our results are similar to those from other studies that have revealed an FSGS for mangrove species such as R. racemosa, which presented a high genetic structure within estuaries along the coast of Cameroon [18,65]. This reflects a historical sea level rise due to climate change but also intrinsic and extrinsic contemporary processes [18,65]. Furthermore, Cerón-Souza et al. [22] established genetic differentiation for A. germinans and R. mangle in estuaries on the Caribbean and Pacific coasts of Panama, which highlights the importance of coastal geomorphology (long-term evolution) and the limitation of seed dispersal (contemporary effect) to explain the level of structure. Lastly, the recent study of Cisneros-de la Cruz et al. [14] identified genetic differentiation between the Gulf of Mexico and the Mexican Caribbean of R. mangle populations when taking into consideration the geomorphology history of the Yucatan Peninsula and the influence of ocean currents as key factors to explain the genetic structure.
Although the genetic structure of R. mangle observed with a contemporary genetic marker give information about recent events to explain the structure, we can easily imagine that the observed structure of mangroves finds its origin in historical events and has been maintained through time for various processes. We would suggest a hypothesis of a historical structure of mangrove populations inside the study area based on available literature, and we are aware that this hypothesis is speculative and needs to be confirmed using other genetic markers. The general structure of mangroves could find its origin due to the variation of the sea level occurring between 4600 and 4000 B.P. [66] and the variation of mangrove coverage due to successive episodes of dry periods in this region beginning around 3400 B.P. to ~2000 B.P. when climatic conditions became favorable for tropical forests and mangroves [67]. These historical events could have isolated forest mangrove patches, which were maintained by the sea current movement along the Mesoamerica Reef System, the recent increase in the mean sea level [68], and the geomorphology and hydrological characteristics of the TCC system. Loss of connectivity among hydrographic systems of the TCC is reinforced by the dispersal limitation of R. mangle seed (see below). The unique source of connectivity between Chetumal Bay and the southern region of the Mexican Caribbean Coast is the wide mouth (~ 15 km) of Chetumal Bay. However, this does not allow a genetic homogenization among both systems. This is not unexpected given that runoff coming from Honduras (Caribbean Current) is transported toward Chinchorro Banks flowing south-to-north through the Yucatan Channel (Yucatan Current) while another current flows north-to-south along the coast of southern Quintana Roo (close to Mahahual) and Belize and re-circulates into the Gulf of Honduras (offshore gyre rotating counterclockwise) (see Figure 2 in References [69,70]). In addition, water movement from Chetumal Bay flows north-to-south toward the coast of Belize and Gulf of Honduras (see Figure 2 in Reference [69]). Natural and artificial channels (Bacalar Chico and Zaragoza, respectively), which connect Chetumal Bay and the Caribbean Coast of Quintana Roo did not appear to represent a source of exchange for R. mangle trees likely due to the high density of mangrove trees increasing propagules retention by roots, as suggested in other studies [18], and also because the large area covered by Chetumal Bay and its complex hydrodynamic [71] would limit the connection between the bay and the coastal area. All of those complex water movements in this region may explain the limited genetic connectivity between Chetumal Bay and the Caribbean Coast. More sampling across the wider area of Chetumal Bay and the Caribbean Coast will be necessary to obtain a better understanding of the connectivity of mangrove populations inside the bay and the connectivity level along the Mesoamerican Reef System. We are aware that our hypothesis of mangrove populations distribution is speculative since it is based on only one kind of a nuclear genetic marker, and that the use of different molecular markers such as cpDNA or better genomic data (e.g., RADseq) need to be investigated.
At the species level, the genetic diversity observed for R. mangle in the TCC was high and consistent with other studies using ISSR molecular markers. For example, a study of Lumnitzera littorea (Combretaceae), which is a non-viviparous mangrove from tropical Asia and North Australia, revealed high genetic diversity (PPL = 76.5%, He = 0.240) [38]. The Kandelia obovate (Rhizophoraceae) tropical and subtropical mangrove from China, which also demonstrated high values of genetic diversity (PPL = 83%, H = 0.363) [72], while Merope angulata (Rutaceae) presented medium polymorphism (43%) and high heterozygosity (He = 0.393) in a cumulative study using AFLP and ISSR [73]. In contrast, other studies have shown extremely low genetic diversity (Nypa fruticans, P = 3% and He = 0.0113, [74], Bruguiera gymnorrhiza, P = 24.36% and h = 0.0785, and Heritiera fomes, P = 12.76% and h = 0.0592 [36]). Genetic diversity at the species level, which reflects long-term evolution, is a prerequisite for its survival and development [75]. At the population level, genetic diversity reflects the adaptability and evolution of the species, which illustrates genotype richness in specific environments [72], and provides valuable information about the status of a species and an assessment of its conservation value [36]. All local communities of R. mangle in the TCC system exhibited high genetic diversity suggesting greater ability to adapt and evolve [75]. These results could be attributable to the diversity of mangrove physiognomic types (fringe and dwarf) used in our analyses, as demonstrated in previous studies for mangroves and others organisms, which reflects the ecological differences between samples (see review in Reference [14]). Furthermore, the wide distribution and relatively wide patch size of R. mangle in each hydrological system could contribute to high genetic diversity.
Significant FSGS of mangrove populations was found inside each hydrological system (spatial auto-correlation, AMOVA, and PCOA results), over a short distance that is generally less than 100 m, with the exception of the Hondo River that exhibited a significant FSGS over a distance close to 240 m. This is most likely a consequence of this hydrological system having the fewest environmental barriers. This very short distance for an FSGS in mangrove populations has been identified previously in a study on R. racemosa on the coasts of Cameroon [18]. The FSGS model in mangrove species, and more particularly in Rhizophora sp., could be explained by the limitation in dispersal capacity (pollen and seed) [18,22] or environmental barriers limiting the development of propagules. Several factors have been proposed to understand FSGS in mangrove species. The most evident intrinsic factor is the dispersal limitation of mangrove propagules caused by the high density of the root network, which is characteristic of Rhizophora spp. [76]. Propagules are transported very short distances and, therefore, the development of new mangrove trees predominantly occurs in close proximity to their parent trees [18,76]. Extrinsic factors could play an important role in the limitation of mangrove propagule dispersion such as geomorphology of the shore, habitat fragmentation, and water flow regimes within each system [18,22]. The study of R. mangle communities in the complex hydrological systems of the TCC demonstrates the role of intrinsic and extrinsic factors in explaining FSGS, as previously suggested [18,22,23]. Nevertheless, to refine our understanding of causes linked to the FSGS in the TCC, further investigations that are beyond the purpose of this study are required. Yet, long-distance dispersal cannot be completely ignored. Some climatic events such as exceptional floods favor long distance dispersal of propagules, which allows colonization of new sites and/or gene flow between existing stands. Nevertheless, although long-distance dispersal is possible for mangrove sp., they are relatively rare because of loss of viability with the dispersal time, a physical barrier, and more [77]. We are aware that results from spatial auto-correlation analysis must be considered with caution considering the difference in the number of samples in each distance class. Nevertheless, these results are unique and give a first approximation about the capacity of dispersion of R. mangle in a contrasting hydrological system.
Our study showed no difference in term of genetic diversity between fringe and dwarf mangroves, which may suggest that morphological variation could be explain by the epigenetic variation [15]. On another side, we highlighted a clear genetic differentiation in terms of the structure between fringe and dwarf mangroves for individuals separated by short distances, which confirms the results obtained by Cisneros-de la Cruz et al. [14] who used other nuclear genetic markers. The first and most clear explanation for the genetic difference between fringe and dwarf mangroves is the effect of environmental conditions such as salinity and phosphorus, which would have a significant impact on the morphological growth of trees [1,15]. However, a recent study showed no direct relationship between salinity/phosphorus and tree height, which suggests that other variables play a role in the physiognomic types of the trees [14]. An additional explanation is the existence of a reproductive barrier (flowering periodicity, size of propagules, among others), which is an indirect result of contrasting environments that generate progressive genetic isolation between fringe and dwarf physiognomic types of mangroves (see review in Reference [14]). Nevertheless, in the TCC system, fringe and dwarf mangrove trees coexist over very short distances (sometimes no more than 200 m) where contrasting environments, in terms of salinity and phosphorus, are unlikely. All this suggests that a genetic difference between fringe and dwarf R. mangle reflect the existence of two local lineages (dwarf vs. fringe) as a response to ecological and physiological adaptations to the microenvironment [78]. Furthermore, dwarf trees exhibited slightly higher values of genetic diversity than fringe trees, which could suggest a better phenotypic plasticity as a response to more stressful microenvironments. However, to confirm our hypothesis and improve our understanding of the complex relationship among fringe and dwarf R. mangle trees, a wider sampling of trees (geographically and numerically), a powerful genetic method capable to screen a higher number of loci (e.g., RADseq genomic data), and the microenvironment (e.g., soil regulators such as salinity, frequency and duration of hydroperiod, and soil resources such as phosphorus or nitrogen, [79]), and plasticity analysis should be applied. Another interesting difference between fringe and dwarf R. mangel is the potential capacity of dispersion highlighted by the genetic autocorrelation analysis, which suggested that dwarf mangroves disperse over smaller distances (<30 m) than fringe mangroves (<75 m), which can be explained by the denser root system for the dwarf trees, which further limits propagule dispersion [14]. Furthermore, the location of the two different physiognomic types could explain de capacity of dispersion. Fringe mangroves are subject to a continuous water movement along shorelines, while dwarf mangroves preferentially distribute far off from the shoreline, within floodplains.
The Mangrove forest is one of the most important ecosystems for aquatic and terrestrial biodiversity in tropical and subtropical regions. They are a highly valuable ecological and economical resource and yet they are subject to a high degree of deforestation and degradation, generally associated with anthropogenic activities, such as urban development, aquaculture, pollution, fragmentation, and more [22,80]. Improved knowledge and understanding of the distribution of genetic diversity and the organization of populations in a mangrove community would assist conservation and management programs [78], particularly in regions experiencing rapid economic development as in the case of Southern Quintana Roo. Our study revealed the presence of some genetic structure in Southern Quintana Roo that is likely a reflection of historical and contemporary processes. We demonstrated that, even though Bacalar is subject to relatively high levels of anthropogenic pressure, it exhibits higher genetic diversity for R. mangle trees, which makes it an excellent candidate for a conservation priority area. Genetic structure observed in the TCC suggests that mangrove areas could constitute different management units for which management and conservation programs could be adapted depending on intrinsic and extrinsic factors that limit the connectivity of mangrove trees.

Supplementary Materials

The following are available online at https://www.mdpi.com/1424-2818/12/2/48/s1, Figure S1: Two first axis of the principal coordinate analysis (PCOA) for two physiognomic types of Rhizophora mangle (fringe and dwarf) obtained by ISSR molecular markers. Fringe mangroves (green), dwarf mangroves (orange). Figure S2: Determination of the optimal number of K from Structure analysis. Ten replicates for values of K from 1 to 11 were realized. The classical method based on the mean value of Ln P(D) for each value of K (A), and ΔK determined using the Structure Harvest website following the Evanno method (B). Table S1: Sampling information of Rhizophora mangle collected through the Transverse Coastal Corridor of Southern Quintana Roo, Mexico. GC: geographic coordinates. N1: number of collected samples. N2: number of samples with genetic information used for analysis. Table S2: ISSR primers information used for Rhizophora mangle. Ta: annealing temperature. N bands: number of bands over all localities. size (bp): range size of the DNA fragments. YC: degenerated sites. Table S3: DIC statistics obtained for the four models implemented in Hickory v1.1 program applied to dominant ISSR markers for Rhizophora mangle. Number of groups considered in the analysis (n). Table S4: Analysis of molecular variance (AMOVA) between two Rhizophora mangle physiognomic types (fringe and dwarf) in the Transverse Coastal Corridor, Southern Quintana Roo, Mexico, using ISSR molecular markers. Table S5: Membership probabilities (Q) of each pre-defined sample localities in each of the new clusters for K = 2 and K = 3. The highest value assigned of a sample to one of the new clusters is indicated in bold. n: number of individual Rhizophora mangle trees. Table S6: Analysis of molecular variance (AMOVA) based on nuclear ISSR markers for Rhizophora mangle inside each hydrological system of the Transverse Coastal Corridor system. Table S7: Analysis of molecular variance (AMOVA) based on nuclear ISSR markers for Rhizophora mangle between fringe and dwarf physiognomic types of mangroves at each locality in the four hydrological systems of the TCC, Southern Quintana Roo, Mexico. Table S8: ISSRs database.

Author Contributions

Conceptualization, S.M.-M., J.E.-Á., H.A.H.-A., H.L.-A., and Y.H. Data curation, L.R.C.I. and H.A.H.-A. Formal analysis, L.R.C.I. and S.M.-M. Funding acquisition, S.M.-M., and H.A.H.-A. Investigation, L.R.C.I., H.A.H.-A.., H.L.-A., and Y.H. Methodology, L.R.C.I., S.M.-M., H.A.H.-A., H.L.-A., and Y.H. Resources, S.M.-M., H.A.H.-A., and Y.H. Supervision, S.M.-M. Visualization, S.M.-M. Writing – original draft, L.R.C.I., and S.M.-M. Writing–review & editing, S.M.-M., H.A.H.-A., L.R.C.I, H.L.-A., Y.H., and J.E.-Á. All authors have read and agreed to the published version of the manuscript.

Acknowledgments

We would like to thank J. Martínez-Castillo and M. Ortiz-García from the Centro de Investigación Científica de Yucatán (CICY) their valuable help in the DNA extraction of mangle samples, and H. Weissenberger from El Colegio de la Frontera Sur (Chetumal) for preparing a map of Figure 1. We are grateful to the Consejo Nacional de Ciencia y Tecnología (CONACyT) for the financial support provided through the scholarship No. 595949 to LRCI.

Conflicts of Interest

The authors declare no conflict of interest.

References

  1. Zaldívar-Jiménez, M.A.; Herrera-Silveira, J.A.; Teutli-Hernández, C.; Comín, F.A.; Andrade, J.L.; Molina, C.C.; Pérez Ceballos, R. Conceptual framework for mangrove restoration in the Yucatán Peninsula. Ecol. Restor. 2010, 28, 333–342. [Google Scholar] [CrossRef] [Green Version]
  2. Hernández-Arana, H.A.; Vega-Zepeda, A.; Ruiz-Zárate, M.A.; Falcón-Álvarez, L.I.; López-Adame, H.; Herrera-Silveira, J.; Kaster, J. Transverse Coastal Corridor: from freshwater lakes to coral reefs ecosystems. In Biodiversity and Conservation of the Yucatán Peninsula; Islebe, G.A., Calmé, S., Léon-Córtez, J.L., Schmook, B., Eds.; Springer: Cham, Switzerland, 2015; pp. 355–376. [Google Scholar]
  3. Alonji, D.M. Carbon sequestration in mangrove forests. Carbon Manag. 2012, 3, 313–322. [Google Scholar] [CrossRef]
  4. Schaeffer-Novelli, Y.; Cintron-Molero, G.; Adaime, R.R.; de Camargo, T.M. Variability of Mangrove Ecosystems Along the Brazilian Coast. Estuaries 1990, 13, 204–218. [Google Scholar] [CrossRef]
  5. Medina, E.; Cuevas, E.; Lugo, A.E. Nutrient relations of dwarf Rhizophora mangle L. mangroves on peat in eastern Puerto Rico. Plant. Ecol. 2010, 207, 13–24. [Google Scholar] [CrossRef]
  6. Valderrama-Landeros, L.H.; Rodríguez-Zúñiga, M.T.; Troche-Souza, C.; Velázquez-Salazar, S.; Villeda-Chávez, E.; Alcántara Maya, J.A.; Vázquez-Balderas, B.; Cruz-López, M.I.; Ressl, R. Manglares de México: actualización y exploración de los datos del sistema de monitoreo 1970/1980–2015; Comisión Nacional para el Conocimiento y Uso de la Biodiversidad: Mexico City, Mexico, 2017. [Google Scholar]
  7. Gonçalves Reis, C.R.; Nardoto, G.B.; Casarin Rochelle, A.L.; Vieira, S.A.; Oliveira, R.S. Nitrogen dynamics in subtropical fringe and basin mangrove forests inferred from stable isotopes. Oecologia 2017, 183, 841–848. [Google Scholar] [CrossRef] [PubMed]
  8. Trejo-Torres, J.C.; Duran, R.; Olmsted, I. Manglares de la Península de Yucatán. In Biodiversidad Marina y Costera de México; Salazar-Vallejo, S., González, N.E., Eds.; Comisión Nacional de Biodiversidad (CONABIO) and Centro de Investigaciones de Quintana Roo (CIQRO): Quintana Roo, Mexico, 1993; pp. 660–672. [Google Scholar]
  9. Adame, M.F.; Zaldívar-Jimenez, A.; Teutli, C.; Caamal, J.P.; Andueza, M.T.; López-Adame, H.; Cano, R.; Hernández-Arana, H.A.; Torres-Lara, R.; Herrera-Silveira, J.A. Drivers of Mangrove Litterfall within a Karstic Region Affected by Frequent Hurricanes. Biotropica 2013, 45, 147–154. [Google Scholar] [CrossRef] [Green Version]
  10. Lovelock, C.E.; Feller, I.C.; Ellis, J.; Schwarz, A.M.; Hancock, N.; Nichols, P.; Sorrel, P. Mangrove growth in New Zealand estuaries: The role of nutrient enrichment at sites with contrasting rates of sedimentation. Oecologia 2007, 153, 633–641. [Google Scholar] [CrossRef]
  11. Naidoo, G. Ecophysiological differences between fringe and dwarf Avicennia marina mangroves. Trees 2010, 24, 667–673. [Google Scholar] [CrossRef]
  12. Zhang, C.; Kovacs, J.M.; Wachowiak, M.P.; Flores-Verdugo, F. Relationship between hyperspectral measurements and mangrove leaf nitrogen concentrations. Remote Sens. 2013, 5, 891–908. [Google Scholar] [CrossRef] [Green Version]
  13. Cerón-Souza, I.; Turner, B.L.; Winter, K.; Medina, E.; Bermingham, E.; Feliner, G.N. Reproductive phenology and physiological traits in the red mangrove hybrid complex (Rhizophora mangle and R. racemosa) across a natural gradient of nutrients and salinity. Plant. Ecol. 2014, 215, 481–493. [Google Scholar] [CrossRef]
  14. Cisneros-de la Cruz, D.J.; Martínez-Castillo, J.; Herrera-Silveira, J.; Yáñez-Espinosa, L.; Ortiz-García, M.; Us-Santamaria, R.; Andrade, J.L. Short-distance barriers affect genetic variability of Rhizophora mangle L. in the Yucatan Peninsula. Ecol. Evol. 2018, 8, 11083–11099. [Google Scholar] [CrossRef] [PubMed]
  15. Lira-Medeiros, C.F.; Parisod, C.; Fernandes, R.A.; Mata, C.S.; Cardoso, M.A.; Ferreira, P.C.G. Epigenetic variation in mangrove plants occurring in contrasting natural environment. PLoS ONE 2010, 5, e10326. [Google Scholar] [CrossRef] [PubMed]
  16. Sengupta, R.; Middleton, B.; Yan, C.; Zuro, M.; Hartman, H. Landscape characteristics of Rhizophora mangle forests and propagule deposition in coastal environments of Florida (USA). Landsc. Ecol. 2005, 20, 63–72. [Google Scholar] [CrossRef]
  17. Sandoval-Castro, E.; Dodd, R.S.; Riosmena-Rodríguez, R.; Enríquez-Paredes, L.M.; Tovilla-Hernández, C.; López-Vivas, J.M.; Aguilar-May, B.; Muñiz-Salazar, R. Post-glacial expansion and population genetic divergence of mangrove species Avicennia germinans (L.) Stearn and Rhizophora mangle L. along the Mexican coast. PLoS ONE 2014, 9, e93358. [Google Scholar] [CrossRef] [PubMed] [Green Version]
  18. Ngeve, M.N.; Van der Stocken, T.; Menemenlis, D.; Koedam, N.; Triest, L. Hidden founders? Strong bottlenecks and fine-scale genetic structure in mangrove populations of the Cameroon Estuary complex. Hydrobiologia 2017, 803, 189–207. [Google Scholar] [CrossRef]
  19. Francisco, P.M.; Mori, G.M.; Alves, F.M.; Tambarussi, E.V.; de Souza, A.P. Population genetic structure; introgression; and hybridization in the genus Rhizophora along the Brazilian coast. Ecol. Evol. 2018, 8, 3491–3504. [Google Scholar] [CrossRef]
  20. Nilsson, C.; Brown, R.L.; Jansson, R.; Merritt, D.M. The role of hydrochory in structuring riparian and wetland vegetation. Biol. Rev. 2010, 85, 837–858. [Google Scholar] [CrossRef]
  21. Nettel, A.; Dodd, R.S. Drifting propagules and receding swamps: Genetic footprints of mangrove recolonization and dispersal along tropical coasts. Evolution Int. J. Org. Evolution 2007, 61, 958–971. [Google Scholar] [CrossRef]
  22. Cerón-Souza, I.; Bermingham, E.; McMillan, W.O.; Jones, F.A. Comparative genetic structure of two mangrove species in Caribbean and Pacific estuaries of Panama. BMC Evol. Biol. 2012, 12, 205. [Google Scholar] [CrossRef] [Green Version]
  23. Mori, G.M.; Zucchi, M.I.; Souza, A.P. Multiple-geographic-scale genetic structure of two mangrove tree species: the roles of mating system; hybridization; limited dispersal and extrinsic factors. PLoS ONE 2015, 10, e0118710. [Google Scholar] [CrossRef] [PubMed] [Green Version]
  24. Hodel, R.G.; Cortez, M.B.; Soltis, P.S.; Soltis, D.E. Comparative phylogeography of black mangroves (Avicennia germinans) and red mangroves (Rhizophora mangle) in Florida: Testing the maritime discontinuity in coastal plants. Am. J. Bot. 2016, 103, 730–739. [Google Scholar] [CrossRef] [PubMed] [Green Version]
  25. Pil, M.W.; Boeger, M.R.; Muschner, V.C.; Pie, M.R.; Ostrensky, A.; Boeger, W.A. Postglacial north–south expansion of populations of Rhizophora mangle (Rhizophoraceae) along the Brazilian coast revealed by microsatellite analysis. Am. J. Bot. 2011, 98, 1031–1039. [Google Scholar] [CrossRef] [PubMed]
  26. Arbeláez-Cortes, E.; Castillo-Cárdenas, M.F.; Toro-Perea, N.; Cárdenas-Henao, H. Genetic structure of the red mangrove (Rhizophora mangle L.) on the Colombian Pacific detected by microsatellite molecular markers. Hydrobiologia 2007, 583, 321–330. [Google Scholar] [CrossRef]
  27. Núñez-Farfán, J.; Domínguez, C.A.; Eguiarte, L.E.; Cornejo, A.; Quijano, M.; Vargas, J.; Dirzo, R. Genetic divergence among Mexican populations of red mangrove (Rhizophora mangle): Geographic and historic effects. Evol. Ecol. Res. 2002, 4, 1049–1064. [Google Scholar]
  28. Sandoval-Castro, E.; Muniz-Salazar, R.; Enríquez-Paredes, L.M.; Riosmena-Rodríguez, R.; Dodd, R.S.; Tovilla-Hernández, C.; Arredondo-García, M.C. Genetic population structure of red mangrove (Rhizophora mangle L.) along the northwestern coast of Mexico. Aquat. Bot. 2012, 99, 20–26. [Google Scholar] [CrossRef]
  29. Reyes Medina, I.; Salazar, R.M.; Arango, G.H.; Vivas, J.L.; Rodríguez, R.R. Genetic analysis for red mangrove reforestation (Rhizophora mangle L.). In The Arid Mangrove Forest from Baja California Peninsula; Riosmena Rodríguez, R., López Vivas, J.M., Hinojosa Arango, G., Eds.; Nova Science Pub Inc.: London, UK, 2016; pp. 35–51. [Google Scholar]
  30. Myers, N.; Mittermeier, R.A.; Mittermeier, C.G.; Da Fonseca, G.A.; Kent, J. Biodiversity hotspots for conservation priorities. Nature 2000, 403, 853–858. [Google Scholar] [CrossRef]
  31. Murray, G. Constructing paradise: The impacts of big tourism in the Mexican coastal zone. Coast. Manag. 2007, 35, 339–355. [Google Scholar] [CrossRef]
  32. Hirales-Cota, M.; Espinoza-Avalos, J.; Schmook, B.; Ruiz-Luna, A.; Ramos-Reyes, R. Drivers of mangrove deforestation in Mahahual-Xcalak; Quintana Roo; southeast Mexico. Cienc. Mar. 2010, 36, 147–159. [Google Scholar] [CrossRef]
  33. Huang, Y.; Tan, F.; Su, G.; Deng, S.; He, H.; Shi, S. Population genetic structure of three tree species in the mangrove genus Ceriops (Rhizophoraceae) from the Indo West Pacific. Genetica 2008, 133, 47–56. [Google Scholar] [CrossRef]
  34. Takayama, K.; Tamura, M.; Tateishi, Y.; Webb, E.L.; Kajita, T. Strong genetic structure over the American continents and transoceanic dispersal in the mangrove genus Rhizophora (Rhizophoraceae) revealed by broad-scale nuclear and chloroplast DNA analysis. Am. J. Bot. 2013, 100, 1191–1201. [Google Scholar] [CrossRef]
  35. Maguire, T.L.; Peakall, R.; Saenger, P. Comparative analysis of genetic diversity in the mangrove species Avicennia marina (Forsk.) Vierh. (Avicenniaceae) detected by AFLPs and SSRs. Theor. Appl. Genet. 2002, 104, 388–398. [Google Scholar] [CrossRef] [PubMed]
  36. Dasgupta, N.; Nandy, P.; Sengupta, C.; Das, S. RAPD and ISSR marker mediated genetic polymorphism of two mangroves Bruguiera gymnorrhiza and Heritiera fomes from Indian Sundarbans in relation to their sustainability. Physiol. Mol. Biol. Pla. 2015, 21, 375–384. [Google Scholar] [CrossRef] [PubMed] [Green Version]
  37. Ge, X.J.; Sun, M. Population genetic structure of Ceriops tagal (Rhizophoraceae) in Thailand and China. Wetl. Ecol. Manag. 2001, 9, 213–219. [Google Scholar] [CrossRef]
  38. Su, G.; Huang, Y.; Tan, F.; Ni, X.; Tang, T.; Shi, S. Conservation genetics of Lumnitzera littorea (Combretaceae); an endangered mangrove; from the Indo-West Pacific. Mar. Biol. 2007, 150, 321–328. [Google Scholar] [CrossRef]
  39. Kader, A.; Sinha, S.N.; Ghosh, P. Evaluation of genetic diversity of Avicenniaceae family in Indian sundarban by using RAPD and ISSR markers. Iran. J. Genet. Plant. Breed 2012, 1, 22–27. [Google Scholar]
  40. Machkour-M’Rabet, S.; Cruz-Medina, J.; García-De León, F.J.; De Jesús-Navarrete, A.; Hénaut, Y. Connectivity and genetic structure of the queen conch on the Mesoamerican Reef. Coral Reefs 2017, 36, 535–548. [Google Scholar] [CrossRef]
  41. Tanya, P.; Taeprayoon, P.; Hadkam, Y.; Srinives, P. Genetic diversity among Jatropha and Jatropha-related species based on ISSR markers. Plant Mol. Biol. Rep. 2011, 29, 252–264. [Google Scholar] [CrossRef]
  42. Kumar, H.; Priya, P.; Singh, N.; Kumar, M.; Kumar Choudhary, B.; Kumar, L. RAPD and ISSR marker-based comparative evaluation of genetic diversity among Indian germplasms of Euryale ferox: An aquatic food plant. App. Biochem. Biotechnol. 2016, 180, 1345–1360. [Google Scholar] [CrossRef]
  43. Thakur, J.; Dwivedi, M.D.; Sourabh, P.; Uniyal, P.L.; Pandey, A.K. Genetic homogeneity revealed using SCoT; ISSR and RAPD markers in micropropagated Pittosporum eriocarpum Royle-an endemic and endangered medicinal plant. PLoS ONE 2016, 11, e0159050. [Google Scholar] [CrossRef] [Green Version]
  44. Hernández-Arana, H.A.; Rowden, A.A.; Attril, M.J.; Warwick, R.M.; Gold Bouchot, G. Large-scale environmental influences on the benthic macroinfauna of the Southern Gulf of Mexico. Estuar. Coast. Shelf. Sci. 2003, 58, 825–841. [Google Scholar] [CrossRef]
  45. Torrescano-Valle, N.; Folan, W.J. Physical settings, environmental history with an outlook on global change. In Biodiversity and Conservation of the Yucatan Peninsula; Islebe, G., Calmè, S., León-Cortes, J.L., Schmook, B., Eds.; Springer: Cham, Switzerland, 2015; pp. 9–37. [Google Scholar]
  46. Calderon-Aguilera, L.E.; Rivera-Monroy, V.H.; Porter-Bolland, L.; Martínez-Yrízar, A.; Ladah, L.B.; Martínez-Ramos, M.; Alcocer, J.; Santiago-Pérez, A.L.; Hernandez-Arana, H.A.; Reyes-Gómez, V.M.; et al. An assessment of natural and human disturbance effects on Mexican ecosystems: Current trends and research gaps. Biodivers Conserv. 2012, 21, 589–617. [Google Scholar] [CrossRef]
  47. Martínez-Castillo, J.; Camacho-Pérez, L.; Villanueva-Viramontes, S.; Andueza-Noh, R.H.; Chacón-Sánchez, M.I. Genetic structure within the Mesoamerican gene pool of wild Phaseolus lunatus (Fabaceae) from Mexico as revealed by microsatellite markers: Implications for conservation and the domestication of the species. Am. J. Bot. 2014, 101, 851–864. [Google Scholar] [CrossRef] [PubMed]
  48. Peakall, R.; Smouse, P.E. GENALEX 6: Genetic analysis in Excel. Population genetic software for teaching and research. Mol. Ecol. Notes 2006, 6, 288–295. [Google Scholar] [CrossRef]
  49. Peakall, R.; Smouse, P.E. GENALEX 6.5: Genetic analysis in Excel. Population genetic software for teaching and research—an update. Bioinformatics 2012, 28, 2537–2539. [Google Scholar] [CrossRef] [PubMed] [Green Version]
  50. Holsinger, K.E.; Lewis, P.O.; Dey, D.K. A Bayesian method for analysis of genetic population structure with dominant marker data. Mol. Ecol. 2002, 11, 1157–1164. [Google Scholar] [CrossRef] [PubMed] [Green Version]
  51. Holsinger, K.E.; Lewis, P.O. Hickory: A package for analysis of population genetic data v1. 0. Department of Ecology and Evolutionary Biology; University of Connecticut: Storrs, CT, USA, 2003. [Google Scholar]
  52. Manrique-Poyato, M.I.; López-León, M.D.; Gómez, R.; Perfectti, F.; Camacho, J.P.M. Population genetic structure of the grasshopper Eyprepocnemis plorans in the south and east of the Iberian Peninsula. PLoS ONE 2013, 8, e59041. [Google Scholar] [CrossRef] [Green Version]
  53. Pritchard, J.K.; Stephens, M.; Donnelly, P.J. Inference of population structure using multilocus genotype data. Genetics 2000, 155, 945–959. [Google Scholar]
  54. Falush, D.; Stephens, M.; Pritchard, J.K. Inference of population structure using multilocus genotype data: dominant markers and null alleles. Mol. Ecol. Notes 2007, 7, 574–578. [Google Scholar] [CrossRef]
  55. Hubisz, M.J.; Falush, D.; Stephens, M.; Pritchard, J.K. Inferring weak population structure with the assistance of sample group information. Mol. Ecol. Resour. 2009, 9, 1322–1332. [Google Scholar] [CrossRef] [Green Version]
  56. Hoffman, J.I.; Peck, L.S.; Linse, K.; Clarke, A. Strong population genetic structure in a broadcast-spawning Antarctic marine invertebrate. J. Hered. 2011, 102, 55–66. [Google Scholar] [CrossRef] [Green Version]
  57. Pritchard, J.K.; Wen, X.; Falush, D. Documentation for STRUCTURE software, version 2.3, University of Chicago: Chicago, IL, USA, 2010.
  58. Evanno, G.; Regnaut, S.; Goudet, J. Detecting the number of clusters of individuals using the software STRUCTURE: A simulation study. Mol. Ecol. 2005, 14, 2611–2620. [Google Scholar] [CrossRef] [Green Version]
  59. Earl, D.A.; von Holdt, B.M. STRUCTURE HARVESTER: A website and program for visualizing STRUCTURE output and implementing the Evanno method. Conserv. Genet. Resour. 2012, 4, 359–361. [Google Scholar] [CrossRef]
  60. Smouse, P.E.; Peakall, R. Spatial autocorrelation analysis of multi-allele and multi-locus genetic microstructure. Heredity 1999, 82, 561–573. [Google Scholar] [CrossRef] [PubMed] [Green Version]
  61. Peakall, R.; Ruibal, M.; Lindenmayer, D.B. Spatial autocorrelation analysis offers new insights into gene flow in the Australian bush rat, Rattus fuscipes. Evolution 2003, 57, 1182–1195. [Google Scholar] [CrossRef] [PubMed]
  62. Carriconde, F.; Gryta, H.; Jargeat, P.; Mouhamadou, B.; Gardes, M. High sexual reproduction and limited contemporary dispersal in the ectomycorrhizal fungus Tricholoma scalpturatum: New insights from population genetics and spatial autocorrelation analysis. Mol. Ecol. 2005, 17, 4433–4445. [Google Scholar] [CrossRef] [PubMed]
  63. Hernández-Arana, H.A.; Espinoza-Avalos, J.; Islebe, G.A. Introducción y perspectivas. In El sistema ecológico de la bahía de Chetumal/Corozal: costa occidental del Mar Caribe; Espinoza-Avalos, J., Islebe, G.A., Hernández-Arana, H.A., Eds.; ECOSUR: Chetumal, México, 2009; pp. 1–4. [Google Scholar]
  64. Hernández-Arana, H.A.; Ameneyro-Angeles, B. Benthic biodiversity changes due to the opening of an artificial channel in a tropical coastal lagoon (Mexican Caribbean). J. Mar. Biol. Assoc. U. K. 2011, 91, 969–978. [Google Scholar] [CrossRef]
  65. Ngeve, M.N.; Van der Stocken, T.; Menemenlis, D.; Koedam, N.; Triest, L. Contrasting effects of historical sea level rise and contemporary ocean currents on regional gene flow of Rhizophora racemosa in Eastern Atlantic mangroves. PLoS ONE 2016, 11, e0150950. [Google Scholar] [CrossRef] [Green Version]
  66. Torrescano, N.; Islebe, G.A. Tropical forest and mangrove history from southeastern Mexico: A 5000 yr pollen record and implications for sea level rise. Veg. Hist. Archaeobot. 2006, 15, 191–195. [Google Scholar] [CrossRef]
  67. Aragón-Moreno, A.A.; Islebe, G.A.; Roy, P.D.; Torrescano-Valle; Mueller, A.D. Climate forcings on vegetation of the southeastern Yucatán Peninsula (Mexico) during the middle to late Holocene. Palaeogeogr. Palaeoclimatol. Palaeoecol. 2018, 495, 214–226. [Google Scholar]
  68. Ruiz-Ramírez, J.D.; Euán-Ávila, J.I.; Torres-Irineo, E. Tendencias del nivel del mar en las costas del Caribe mexicano. Eur. Sci. J. 2014, 10, 86–96. [Google Scholar]
  69. Ezer, T.; Thattai, D.V.; Kjerfve, B.; Heyman, W.D. On the variability of the flow along the Meso-American Barrier Reef system: a numerical model study of the influence of the Caribbean current and eddies. Ocean. Dynam. 2005, 55, 458–475. [Google Scholar] [CrossRef]
  70. Chérubin, L.M.; Kuchinke, C.P.; Paris, C.B. Ocean circulation and terrestrial runoff dynamics in the Mesoamerican region from spectral optimization of SeaWiFS data and a high resolution simulation. Coral Reefs 2008, 27, 503–519. [Google Scholar] [CrossRef]
  71. Avalos-Cueva, D.; Palacios-Hernandez, E.; Carrillo, L.; Gonzalez-Vivanco, L.A. Numerical models as tools to understand the dynamics in Bays: case of study Chetumal Bay; Quintana Roo. Ra Ximhai 2017, 13, 267–290. [Google Scholar]
  72. Chen, S.B.; Ding, W.Y.; Qiu, J.B.; Wang, G.Y.; Zhou, Z.M.; Chen, J.F.; Ai, W.M.; Wang, C.Y.; Xie, Q.L. The genetic diversity of the mangrove Kandelia obovata in China revealed by ISSR analysis. Pak. J. Bot. 2010, 42, 3755–3764. [Google Scholar]
  73. Jena, S.N.; Verma, S.; Nair, K.N.; Srivastava, A.K.; Misra, S.; Rana, T.S. Genetic diversity and population structure of the mangrove lime (Merope angulata) in India revealed by AFLP and ISSR markers. Aquat. Bot. 2015, 120, 260–267. [Google Scholar] [CrossRef]
  74. Jian, S.; Ban, J.; Ren, H.; Yan, H. Low genetic variation detected within the widespread mangrove species Nypa fruticans (Palmae) from Southeast Asia. Aquat. Bot. 2010, 92, 23–27. [Google Scholar] [CrossRef]
  75. Li, H.S.; Chen, G.Z. Genetic diversity of mangrove plant Sonneratia caseolaris in Hainan Island based on ISSR analysis. Acta Ecol. Sin 2004, 24, 1657–1663. [Google Scholar]
  76. Van der Stocken, T.; De Ryck, D.J.R.; Vanschoenwinkel, B.; Deboelpaep, E.; Bouma, T.J.; Dahdouh-Guebas, F. Impact of landscape structure on propagule dispersal in mangrove forests. Mar. Ecol. Progr. Ser. 2015, 524, 95–106. [Google Scholar] [CrossRef]
  77. Alleman, L.K.; Hester, M.W. Reproductive ecology of black mangrove (Avicennia germinans) along the Louisiana coast: Propagule production cycles, dispersal limitations, and establishment elevations. Estuaries Coast. 2011, 34, 1068. [Google Scholar] [CrossRef]
  78. Schwarzbach, A.E.; Ricklefs, R.E. The use of molecular data in mangrove plant research. Wetl. Ecol. Manag. 2001, 9, 205–211. [Google Scholar] [CrossRef]
  79. Twilley, R.R.; Rivera-Monroy, V.H. Developing performance measures of mangrove wetlands using simulation models of hydrology; nutrient biogeochemistry; and community dynamics. J. Coast. Res. 2005, 40, 79–93. [Google Scholar]
  80. Alongi, D.M. Present state and future of the world’s mangrove forests. Environ. Conserv. 2002, 29, 331–349. [Google Scholar] [CrossRef] [Green Version]
Figure 1. Hydrological systems and localities in the TCC system in Southern Quintana Roo, Mexico, where Rhizophora mangle tree samples were collected. Hydrological systems: Bacalar Lagoon (A), Hondo River (B), Chetumal Bay (C), and Caribbean Coast (D). Black circle (dwarf mangrove trees), white square (fringe mangrove trees), light grey areas (water bodies), green areas (mangrove forest cover, source: “Comisión Nacional para el Conocimiento y Uso de la Biodiversidad” CONABIO 2016).
Diversity 12 00048 g001
Figure 2. Bayesian analysis of Rhizophora mangle in the Transverse Coastal Corridor, southern Quintana Roo, Mexico, computed by Structure 2.3.1 software. (A) results for K = 2, (B) results for K = 3. Each individual is represented by a single vertical line broken into K segments of length proportional to the estimated membership (probability qi) in the K clusters.
Diversity 12 00048 g002aDiversity 12 00048 g002b
Figure 3. Principal coordinate analysis (PCOA) for the red mangrove, Rhizophora mangle, in the Transverse Coastal Corridor, southern Quintana Roo, Mexico, using ISSR molecular markers. Chetumal Bay (red circle): Tamalcab (solid) and Playa Cayo Venado (empty), Bacalar Lagoon (green triangle): Pedro Santo (solid) and Huub’ Sak (empty), Hondo River (yellow square): entrance (solid) and inward (empty), and Caribbean Coast (blue rhomb): Bacalar Chico (solid) and Xcalak National Reef Park (empty).
Diversity 12 00048 g003
Figure 4. Principal coordinate analysis (PCOA) for the red mangrove, Rhizophora mangle, at each hydrological system within the Transverse Coastal Corridor, southern Quintana Roo, Mexico, using ISSR molecular markers. Chetumal Bay (A): Tamalcab (solid circle) and Playa Cayo Venado (empty circle), Bacalar Lagoon (B): Pedro Santo (solid triangle) and Huub’ Sak (empty triangle), Hondo River (C): entrance (solid square) and inward (empty square), and Caribbean Coast (D): Bacalar Chico (solid rhomb) and Xcalak National Reef Park (empty rhomb).
Diversity 12 00048 g004
Figure 5. Correlograms illustrating the spatial autocorrelation analyses for Rhizophora mangle at each hydrological system, and for fringe and dwarf physiognomic types within the TCC system. Chetumal Bay (A), Bacalar Lagoon (B), Hondo River (C), Caribbean Coast (D), fringe (E), and dwarf (F) physiognomic types of mangrove. x-axis: distance class (km), y-axis: spatial auto-correlation coefficient (r). Error bars for r were determined by bootstrap re-sampling (999 permutations). Grey dashed lines represent upper and lower bounds of a 95% confidence interval for r under the null hypothesis of no auto-correlation between genetic and spatial distances (999 permutations). Asterisks indicate a significant auto-correlation coefficient (*** P < 0.001, ** P < 0.01, * P < 0.05).
Diversity 12 00048 g005
Table 1. Genetic diversity parameters estimated with GenAlex for Rhizophora mangle from four different hydrological systems and for each physiognomic type inside all localities in southern Quintana Roo, Mexico. Number of samples (n), percentage of polymorphic loci (PPL (%)), expected heterozygosity with a standard error (He ± SE), and estimated genetic diversity determined by Hickory v1.1 (hs ± SD).
Hydrological SystemLocalityPhysiognomic TypenPPLHehs
Chetumal BayTamalcabaFringe1548.150.182 (0.023)0.228 (0.012)
Dwarf1355.560.209 (0.023)0.244 (0.011)
Playa Cayo VenadoFringe1558.020.222 (0.024)0.251 (0.010)
Dwarf1358.020.211 (0.023)0.249 (0.012)
Mean 5679.010.271 (0.022)0.266 (0.011)
Bacalar LagoonPedro SantosFringe1154.320.197 (0.023)0.248 (0.012)
Dwarf1260.490.246 (0.024)0.266 (0.012)
Huub’ SakFringe649.380.184 (0.023)0.245 (0.013)
Dwarf956.790.224 (0.024)0.268 (0.012)
Mean 3881.480.296 (0.020)0.288 (0.011)
Hondo RiverEntranceFringe1354.320.177 (0.023)0.228 (0.010)
Dwarf1265.430.233 (0.023)0.259 (0.011)
InwardFringe1360.490.191 (0.022)0.251 (0.013)
Dwarf1261.730.231 (0.023)0.262 (0.011)
Mean 5088.890.292 (0.021)0.288 (0.009)
Caribbea CoastsXcalakFringe1246.910.188 (0.024)0.252 (0.013)
Dwarf1254.320.221 (0.024)0.268 (0.011)
Bacalar ChicoFringe1566.670.241 (0.023)0.263 (0.011)
Dwarf1561.730.223 (0.022)0.257 (0.011)
Mean 5481.480.291 (0.021)0.287 (0.012)
Table 2. Pairwise genetic differentiation values (ΦPT, below the diagonal) determined for Rhizophora mangle among four hydrological systems of the Transverse Coastal Corridor system, southern Quintana Roo, Mexico. Above diagonal: probability for ΦPT based on 9999 permutations. Bold, italics, and underline values represent the hierarchical spatial structure for the genetic differentiation.
Chetumal BayBacalar LagoonHondo RiverCaribbean Coast
Chetumal Bay 0.00010.00010.0001
Bacalar Lagoon0.119 0.00010.0001
Hondo River0.1320.113 0.0001
Caribbean Coast0.1920.1430.164

