Landscape Transformation Influences Responses of Terrestrial Small Mammals to Land Use Intensity in North-Central Namibia

 , and
, and
Abstract
:1. Introduction
2. Materials and Methods
2.1. Study Region and Research Areas
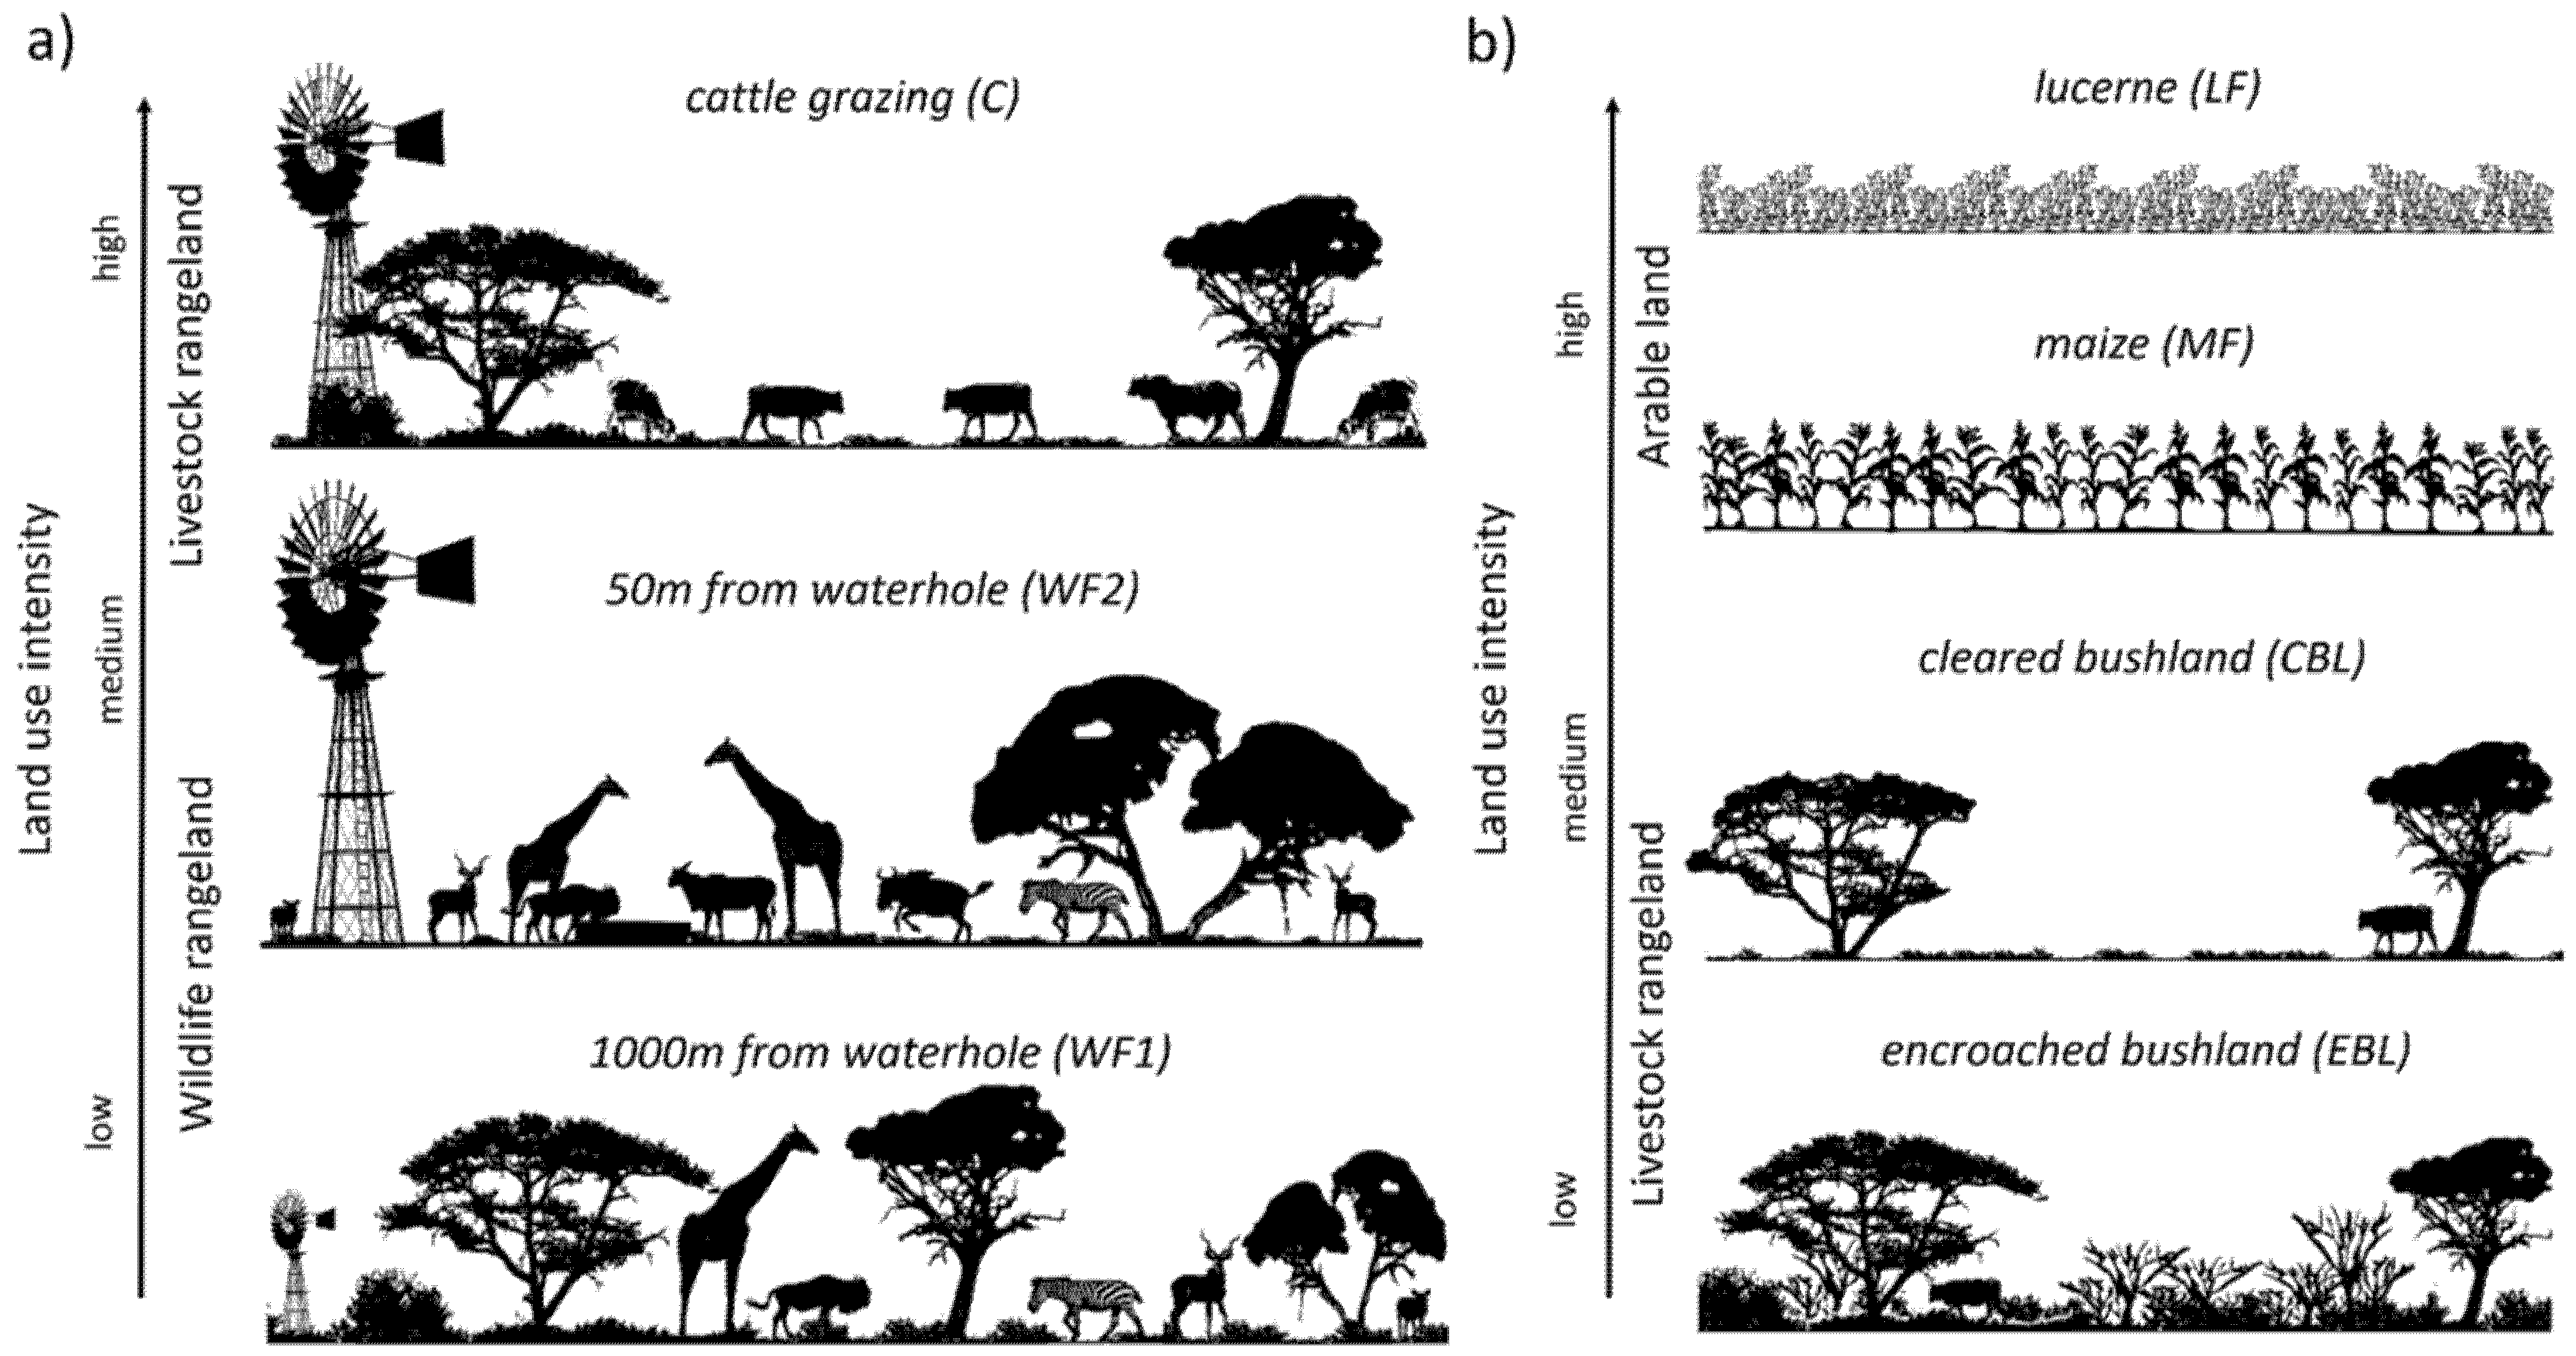
2.2. Farm Management Practices and Site Selections
2.3. Small Mammal Sampling
2.4. Data Analysis
3. Results
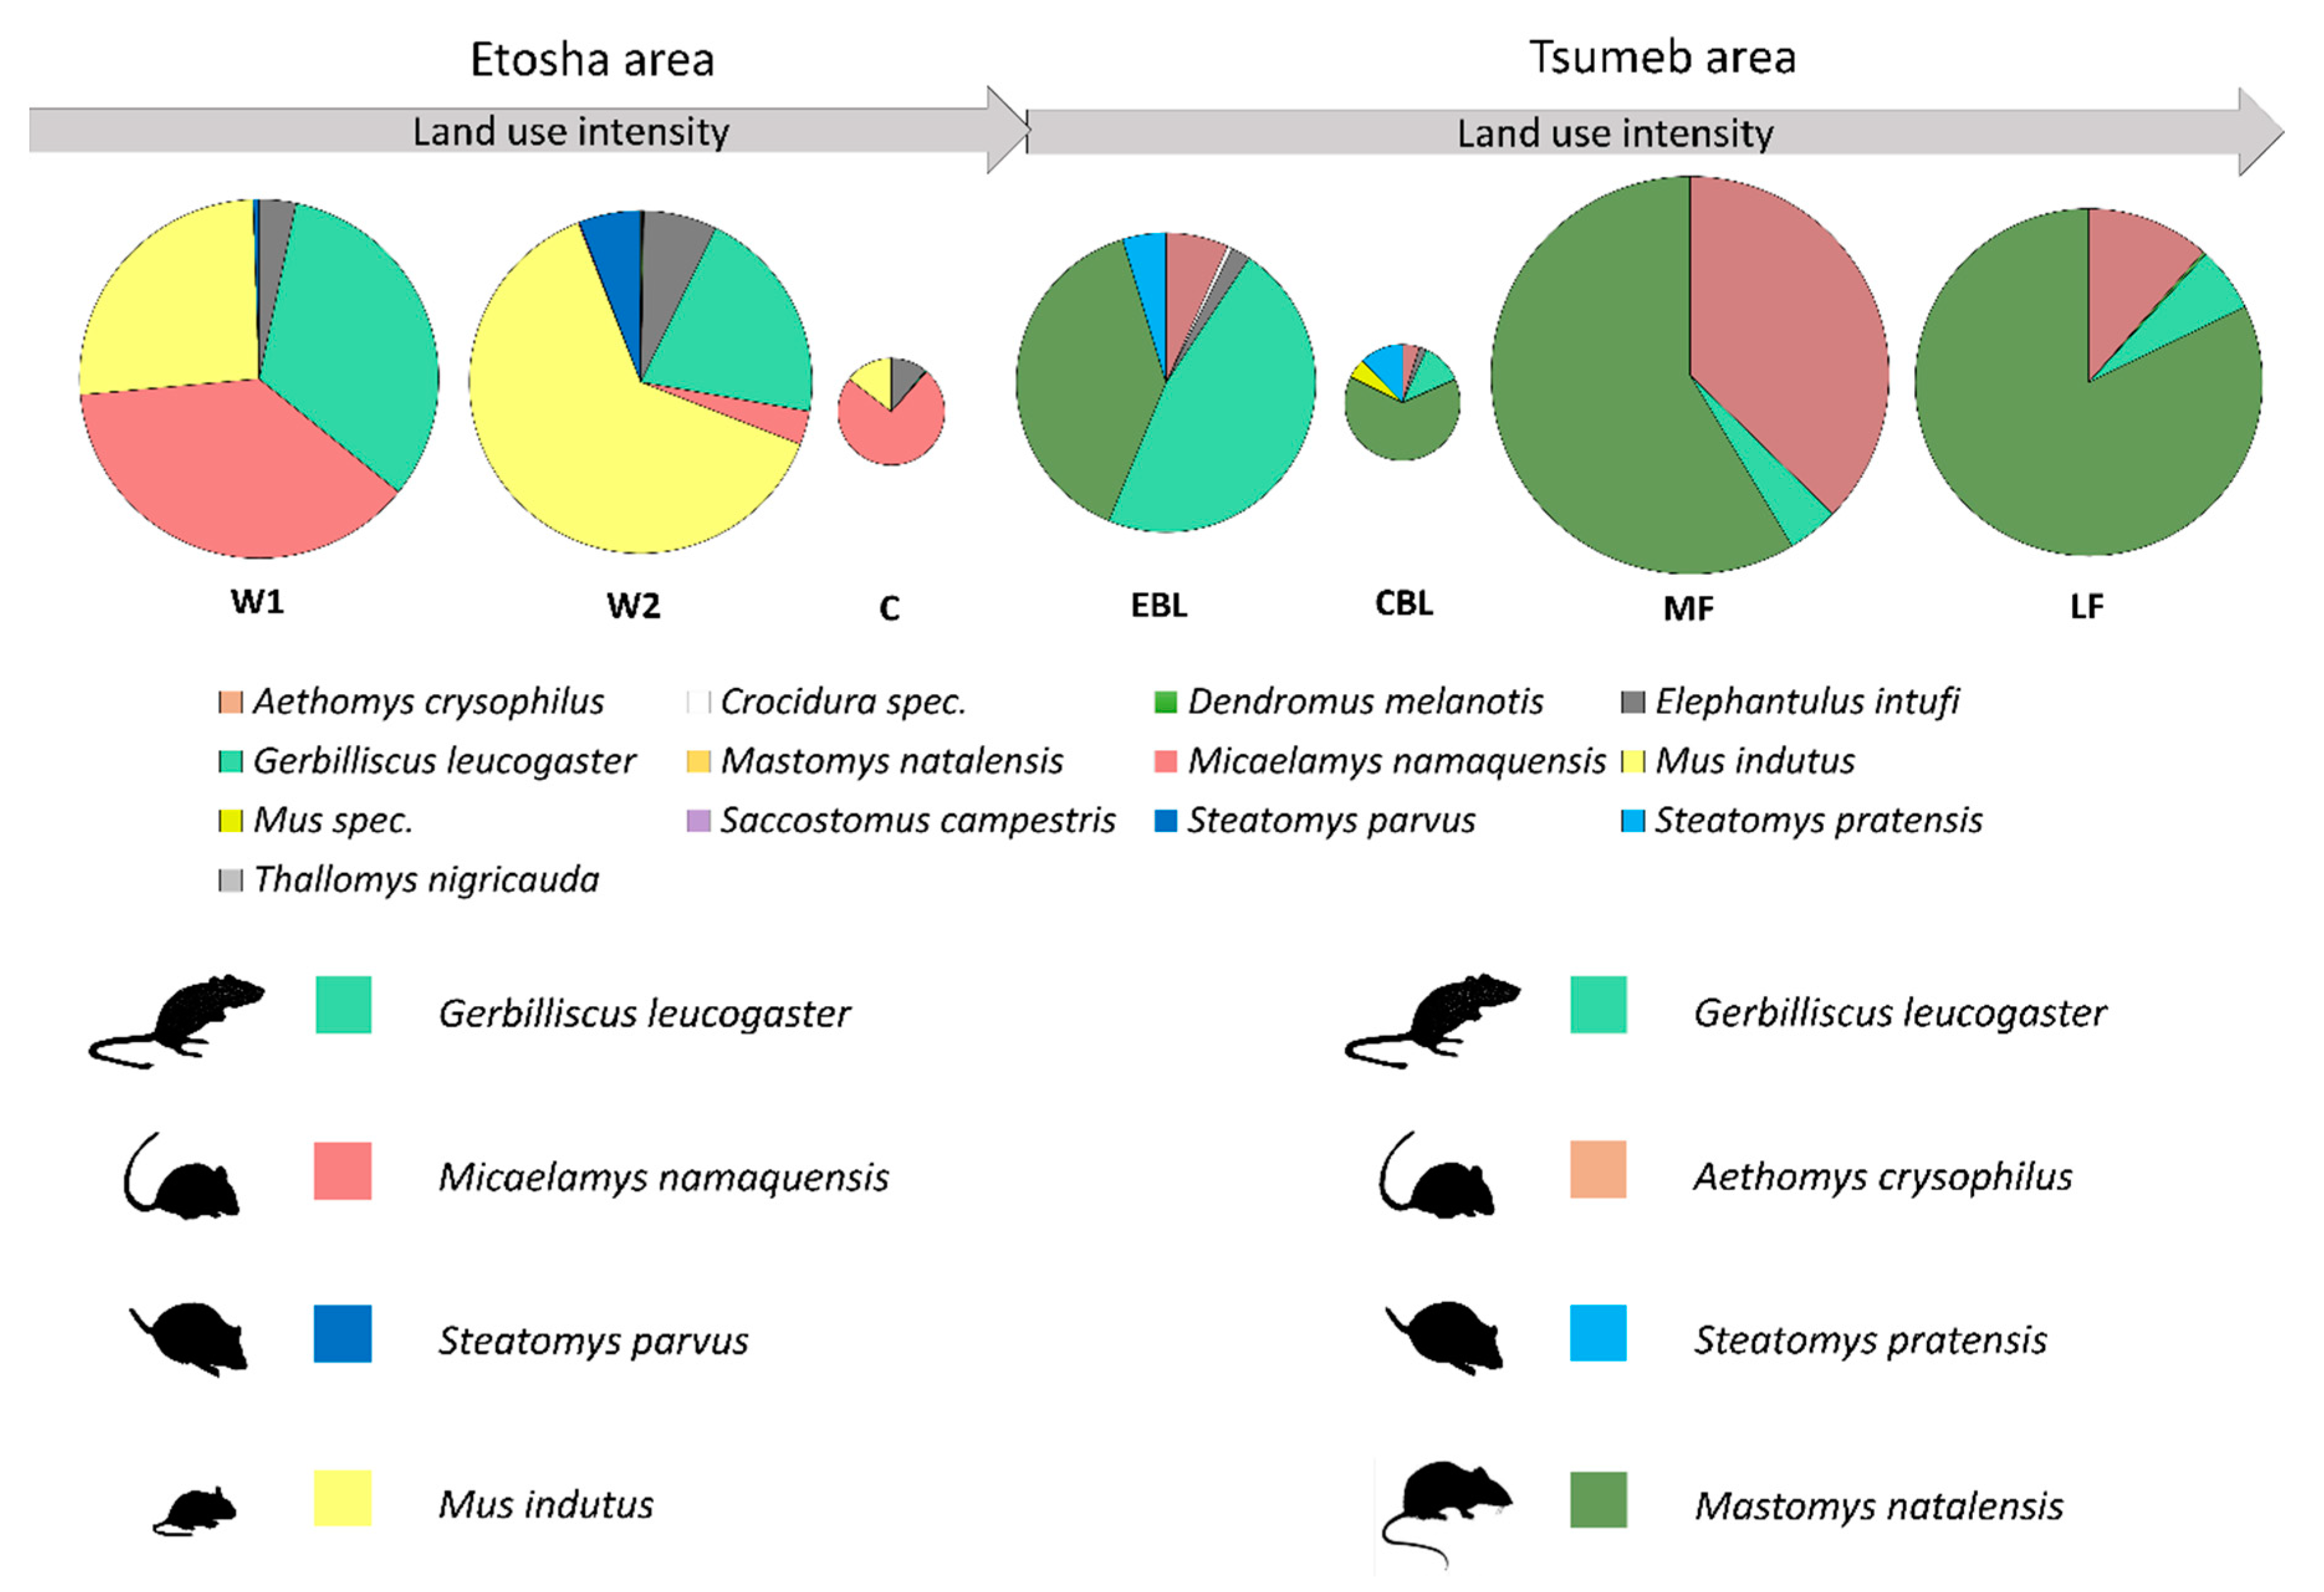
3.1. Etosha Area
3.2. Tsumeb Area
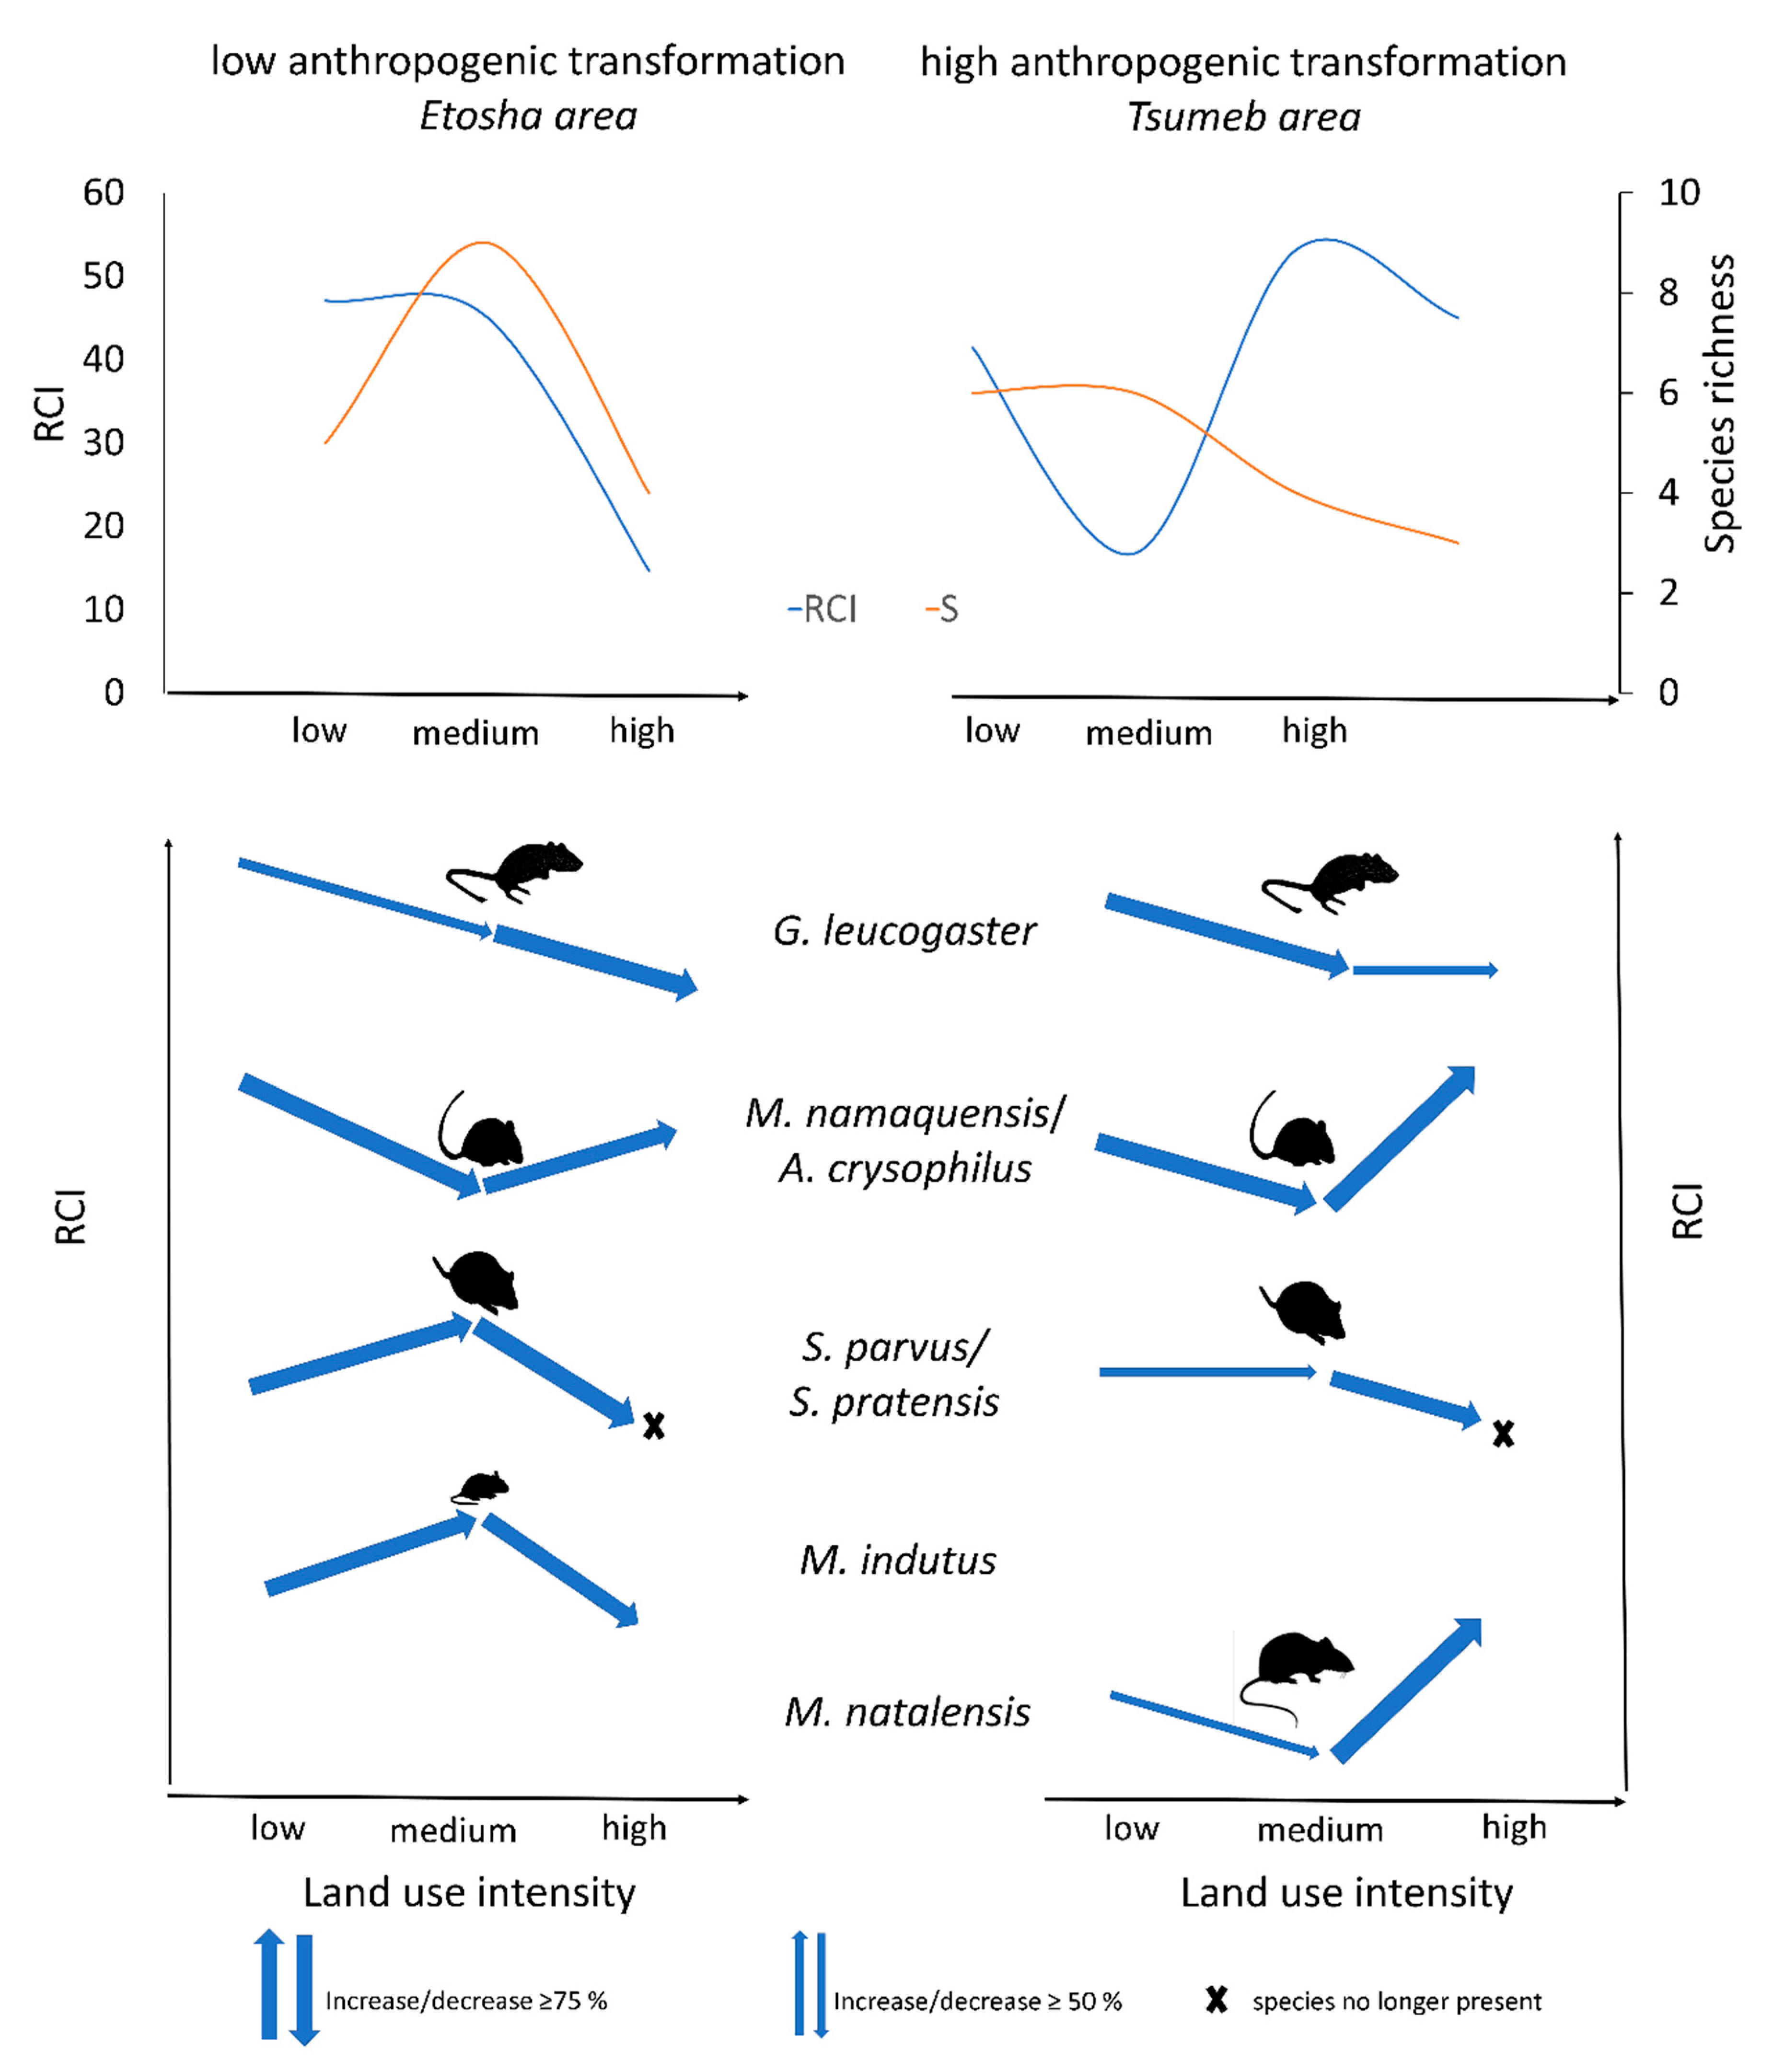
3.3. Cross-Area Comparison
4. Discussion
5. Conclusions
Supplementary Materials
Author Contributions
Funding
Acknowledgments
Conflicts of Interest
References
- Osborne, C.P.; Charles-Dominique, T.; Stevens, N.; Bond, W.J.; Midgley, G.; Lehmann, C.E. Human impacts in African savannas are mediated by plant functional traits. New Phytol. 2018, 220, 10–24. [Google Scholar] [CrossRef] [PubMed]
- Ward, D. Do we understand the causes of bush encroachment in African savannas? Afr. J. Range Forage Sci. 2005, 22, 101–105. [Google Scholar] [CrossRef]
- Wingate, V.R.; Phinn, S.R.; Kuhn, N.; Bloemertz, L.; Dhanjal-Adams, K.L. Mapping decadal land cover changes in the woodlands of north eastern Namibia from 1975 to 2014 using the Landsat satellite archived data. Remote Sens. 2016, 8, 681. [Google Scholar] [CrossRef] [Green Version]
- Newman, E.A. Disturbance Ecology in the Anthropocene. Front. Ecol. Evol. 2019, 7, 147. [Google Scholar] [CrossRef] [Green Version]
- Ministry of Agriculture, Water and Rural Development. National Agricultural Policy. Available online: https://www.atf.org.na/cms_documents/8f7-nationalagriculturalpolicy1995.pdf (accessed on 30 September 2020).
- Ministry of Agriculture, Water and Forestry. Green Scheme Policy. Available online: https://www.npc.gov.na/downloads/policies%20by%20year/2008/Green%20Scheme%20Policy.pdf (accessed on 30 September 2020).
- Joubert, D.F.; Rothauge, A.; Smit, G.N. A conceptual model of vegetation dynamics in the semiarid highland savanna of Namibia, with particular reference to bush thickening by Acacia mellifera. J. Arid Environ. 2008, 72, 2201–2210. [Google Scholar] [CrossRef]
- Stolter, C.; Joubert, D.; Schwarz, K.; Finckh, M. Impact of bush encroachment management on plant response and animal distribution. In Climate Change and Adaptive Land Management in Southern Africa—Assessments, Changes, Challenges, and Solutions; Biodiversity & Ecology; Revermann, R., Krewenka, K.M., Schmiedel, U., Olwoch, J.M., Helmschrot, J., Jürgens, N., Eds.; Klaus Hess Publishers: Windhoek, Namibia; Göttingen, Germany, 2018; Volume 6, pp. 219–225. [Google Scholar]
- Vushe, A.; Haimene, E.P.; Mashauri, D. Namibian land use changes and nutrient water quality of the Okavango River. Madr. J. Agric. Environ. Sci. 2014, 3, 219–239. [Google Scholar]
- Zeller, U.; Starik, N.; Göttert, T. Biodiversity, land use and ecosystem services—An organismic and comparative approach to different geographical regions. Glob. Ecol. Conserv. 2017, 10, 114–125. [Google Scholar] [CrossRef]
- Mannetti, L.M.; Göttert, T.; Zeller, U.; Esler, K.J. Expanding the protected area network in Namibia: An institutional analysis. Ecosyst. Serv. 2017, 28, 207–218. [Google Scholar] [CrossRef]
- Mannetti, L.M.; Göttert, T.; Zeller, U.; Esler, K.J. Identifying and categorizing stakeholders for protected area expansion around a national park in Namibia. Ecol. Soc. 2019, 24, 5. [Google Scholar] [CrossRef]
- Milton, S.J.; du Plessis, M.A.; Siegfried, W.R. A conceptual model of arid rangeland degradation. Bioscience 1994, 44, 70–76. [Google Scholar] [CrossRef]
- Wesche, K.; Ronnenberg, K.; Retzer, V.; Miehe, G. Effects of large herbivore exclusion on southern Mongolian desert steppes. Acta Oecol. 2010, 36, 234–241. [Google Scholar] [CrossRef]
- Jeltsch, F.; Milton, S.J.; Dean, W.R.J.; Van Rooyen, N. Analysing shrub encroachment in the southern Kalahari: A grid-based modelling approach. J. Appl. Ecol. 1997, 134, 497–1508. [Google Scholar] [CrossRef]
- Teague, W.R.; Duke, S.E.; Waggoner, J.A.; Dowhower, S.L.; Gerrard, S.A. Rangeland vegetation and soil response to summer patch fires under continuous grazing. Arid Land Res. Manag. 2008, 22, 228–241. [Google Scholar] [CrossRef]
- Macdonald, D.W.; Tattersall, F.H.; Service, K.M.; Firbank, L.G.; Feber, R.E. Mammals, agri-environment schemes and set-aside—What are the putative benefits? Mamm. Rev. 2007, 37, 259–277. [Google Scholar] [CrossRef]
- Medan, D.; Torretta, J.P.; Hodara, K.; Elba, B.; Montaldo, N.H. Effects of agriculture expansion and intensification on the vertebrate and invertebrate diversity in the Pampas of Argentina. Biodivers. Conserv. 2011, 20, 3077–3100. [Google Scholar] [CrossRef]
- Starik, N.; Göttert, T.; Heitlinger, E.; Zeller, U. Bat community responses to structural habitat complexity resulting from management practices within different land use types—A case study from north-eastern Germany. Acta Chiropt. 2018, 20, 387–405. [Google Scholar] [CrossRef]
- Hobbs, N.T. Modification of ecosystems by ungulates. J. Wildl. Manag. 1996, 60, 695–713. [Google Scholar] [CrossRef]
- Le Roux, X.; Abbadie, L.; Fritz, H.; Leriche, H. Modification of the Savanna Functioning by Herbivores. In Lamto; Ecological Studies; Abbadie, L., Gignoux, J., Le Roux, X., Lepage, M., Eds.; Springer: New York, NY, USA, 2007; Volume 179, pp. 185–198. [Google Scholar] [CrossRef]
- Sinclair, A.R.E. Mammal population regulation, keystone processes and ecosystem dynamics. Philos. Trans. R. Soc. Lond. B Biol. Sci. 2003, 358, 1729–1740. [Google Scholar] [CrossRef] [Green Version]
- Zeller, U.; Göttert, T. The relations between evolution and domestication reconsidered—Implications for systematics, ecology, and nature conservation. Glob. Ecol. Conserv. 2019, 20, e00756. [Google Scholar] [CrossRef]
- Kinnaird, M.F.; O’Brien, T.G. Effects of private-land use, livestock management, and human tolerance on diversity, distribution, and abundance of large African mammals. Biol. Conserv. 2012, 26, 1026–1039. [Google Scholar] [CrossRef]
- Ostfeld, R.S.; Keesing, F. Pulsed resources and community dynamics of consumers in terrestrial ecosystems. Trends Ecol. Evol. 2000, 15, 232–237. [Google Scholar] [CrossRef]
- Horváth, G.F.; Horvath, B.; Sali, N.; Herczeg, R. Community-level response to different human disturbances and land use of small mammals in two marshland habitat patches in Hungary. Arch. Biol. Sci. 2012, 64, 613–628. [Google Scholar] [CrossRef]
- Hoffmann, A.; Zeller, U. Influence of variations in land use intensity on species diversity and abundance of small mammals in the Nama Karoo, Namibia. Belg. J. Zool. 2005, 135, 91–96. [Google Scholar]
- Muck, C.; Zeller, U. Small mammal communities on cattle and game grazing areas in Namibia. Afr. Zool. 2006, 41, 1–9. [Google Scholar] [CrossRef]
- Hoffmann, A.; Vohland, K.; Zeller, U. Overgrazing favours desert species—Differences in arthropod and small mammal communities of the twin sites Gellap Ost and Nabaos. In Biodiversity in Southern Africa. Patterns and Processes at Regional Scale; Schmiedel, U., Jürgens, N., Eds.; Klaus Hess Publishers: Windhoek, Namibia; Göttingen, Germany, 2010; Volume 2, pp. 239–244. [Google Scholar]
- Palumbi, S.R. Humans as the world’s greatest evolutionary force. Science 2001, 293, 1786–1790. [Google Scholar] [CrossRef]
- Brown, P.R.; Huth, N.I.; Banks, P.B.; Singleton, G.R. Relationship between abundance of rodents and damage to agricultural crops. Agric. Ecosyst. Environ. 2007, 120, 405–415. [Google Scholar] [CrossRef]
- Heroldová, M.; Tkadlec, E. Harvesting behaviour of three central European rodents: Identifying the rodent pest in cereals. J. Crop. Prot. 2011, 30, 82–84. [Google Scholar] [CrossRef]
- Odhiambo, R.O.; Makundi, R.H.; Leirs, H.; Verhagen, R. Dietary selection in Mastomys natalensis (Rodentia: Muridae) in the maize agro-ecosystems of central and southwestern Tanzania. Mammalia 2008, 72, 169–177. [Google Scholar] [CrossRef]
- Swanepoel, L.H.; Swanepoel, C.M.; Brown, P.R.; Eiseb, S.J.; Goodman, S.M.; Keith, M.; Kirsten, F.; Leirs, H.; Mahlaba, T.A.M.; Makundi, R.; et al. A systematic review of rodent pest research in Afro-Malagasy small-holder farming systems: Are we asking the right questions? PLoS ONE 2017, 12, e0174554. [Google Scholar] [CrossRef]
- Taylor, P.J.; Downs, S.; Monadjem, A.; Eiseb, S.J.; Mulungu, L.S.; Massawe, A.W.; Mahlaba, T.A.; Kirsten, F.; Von Maltitz, E.; Malebane, P.; et al. Experimental treatment-control studies of ecologically based rodent management in Africa: Balancing conservation and pest management. Wildl. Res. 2012, 39, 51–61. [Google Scholar] [CrossRef]
- Mendelsohn, J.; Jarvis, A.; Roberts, C.; Robertson, T. Atlas of Namibia: A Portrait of the Land and Its People; David Philip Publishers: Cape Town, South Africa, 2002. [Google Scholar]
- Erkkilä, A. Living on the land: Change in forest cover in north-central Namibia 1943–1996. Silva Carelica 2001, 37, 1–118. [Google Scholar]
- Göttert, T.; Zeller, U. Das Etosha Pufferzonenprojekt–ein Konzept zur Unterstützung der Bemühungen zur Anbindung des Etosha Nationalparks an das transnationale Netzwerk von Schutzgebieten im südlichen Afrika. Beitr. Jagd Wildforsch. 2008, 33, 283–292. [Google Scholar]
- Noack, J.; Schwabe, F.; Göttert, T.; Starik, N.; Zeller, U. Investigations on the occurrence and relative abundance of large carnivores and their potential prey using camera traps and line transect sampling. In Land Use and Nature Conservation—Proceedings of the 2nd International Workshop of the Quality Network Biodiversity in Sub-Sahara Africa; Dannenberg, P., Göttert, T., Nduru, G., Zeller, U., Eds.; Arbeitsberichte des Geographischen Instituts der Humboldt-Universität zu Berlin: Berlin, Germany, 2012; Volume 175, pp. 60–61. ISBN 0947-0360. [Google Scholar] [CrossRef]
- Jones, C.; McShea, W.J.; Conroy, M.J.; Kunz, T.H. Capturing mammals. In Measuring and Monitoring Biological Diversity: Standard Methods for Mammals; Wilson, D.E., Cole, F.R., Nicols, J.D., Rudran, R., Foster, M.S., Eds.; Smithsonian Institution Press: Washington, DC, USA, 1996; pp. 115–155. [Google Scholar]
- Fraser, J.L.; Thompson, G.G.; Moro, D. Adequacy of terrestrial fauna surveys for the preparation of Environmental Impact Assessments in the mining industry of Western Australia. Ecol. Manag. Restor. 2003, 4, 187–192. [Google Scholar] [CrossRef] [Green Version]
- Sikes, R.S. Animal Care and Use Committee of the American Society of Mammalogists. Guidelines of the American Society of Mammalogists for the use of wild mammals in research and education. J. Mammal. 2016, 97, 663–688. [Google Scholar] [CrossRef]
- Krebs, C.J. Ecological Methodology; Addison Wesley Longman: Menlo Park, CA, USA, 1999; pp. 361–362. [Google Scholar]
- PAST: Paleontological Statistics Software Package for Education and Data Analysis. Available online: https://palaeo-electronica.org/2001_1/past/past.pdf (accessed on 30 September 2020).
- Caughley, G. Analysis of Vertebrate Populations; John Wiley and Sons: Chichester, UK, 1977; p. 12ff. [Google Scholar]
- Heroldová, M.; Bryja, J.; Zejda, J.; Tkadlec, E. Structure and diversity of small mammal communities in agriculture landscape. Agric. Ecosyst. Environ. 2007, 120, 206–210. [Google Scholar] [CrossRef]
- Castañeda, I.; Pisanu, B.; Díaz, M.; Rézouki, C.; Baudry, E.; Chapuis, J.L.; Bonnaud, E. Minimising trapping effort without affecting population density estimations for small mammals. Mamm. Biol. 2018, 93, 144–152. [Google Scholar] [CrossRef]
- Hopkins, H.L.; Kennedy, M.L. An assessment of indices of relative and absolute abundance for monitoring populations of small mammals. Wildl. Soc. Bull. 2004, 32, 1289–1296. [Google Scholar] [CrossRef]
- Rottstock, T.; Göttert, T.; Zeller, U. Relatively undisturbed African savannas—An important reference for assessing wildlife responses to livestock grazing systems in European rangelands. Glob. Ecol. Conserv. 2019, 23, e01124. [Google Scholar] [CrossRef]
- Osman, R.W. Intermediate Disturbance Hypothesis. In Encyclopedia of Ecology, 2nd ed.; Fath, B., Ed.; Elsevier: Amsterdam, The Netherlands, 2019; Volume 1, pp. 441–450. ISBN 9780444641304. [Google Scholar] [CrossRef]
- Grant, W.E.; Birney, E.C.; French, N.R.; Swift, D.M. Structure and productivity of grassland small mammal communities related to grazing-induced changes in vegetative cover. J. Mammal. 1982, 63, 248–260. [Google Scholar] [CrossRef]
- Avenant, P. Small mammal diversity in the Maguga Dam inundation area, Swaziland. S. Afr. J. Wildl. Res. 2002, 32, 101–108. [Google Scholar]
- Prevedello, J.A.; Dickman, C.R.; Vieira, M.V.; Vieira, E.M. Population responses of small mammals to food supply and predators: A global meta-analysis. J. Anim. Ecol. 2013, 82, 927–936. [Google Scholar] [CrossRef] [PubMed] [Green Version]
- Hauptfleisch, M.L.; Vinte, M.P.; Blaum, N. A comparison of the community dynamics of bioturbating small mammals between livestock and wildlife farming areas in the Kalahari, Namibia. J. Namibian Stud. 2017, 1, 34–39. [Google Scholar]
- Muck, C.; Zeller, U. Kleinsäugerpopulationen zweier unterschiedlich genutzter Weideflächen in Namibia. In Treffpunkt Biologische Vielfalt IV; Korn, H., Feit, U., Eds.; Bundesamt für Naturschutz: Bonn, Germany, 2004; pp. 195–201. [Google Scholar]
- Erckie, B.J. Assessing the Effects of Grazing Intensity by Large Herbivores on Species Diversity and Abundance of Small Mammals at Waterberg Plateau Park, Namibia. Master’s Thesis, Humboldt-Universität zu Berlin, Germany and University of Namibia, Windhoek, Namibia, April 2007. Available online: http://repository.unam.edu.na/handle/11070/342 (accessed on 12 March 2020).
- Hickman, K.R.; Hartnett, D.C. Effects of grazing intensity on growth, reproduction, and abundance of three palatable forbs in Kansas tallgrass prairie. Plant Ecol. 2002, 159, 23–33. [Google Scholar] [CrossRef]
- Rickart, E.A.; Bienek, K.G.; Rowe, R.J. Impact of livestock grazing on plant and small mammal communities in the Ruby Mountains, northeastern Nevada. West. N. Am. Nat. 2013, 73, 505–515. [Google Scholar] [CrossRef] [Green Version]
- Burke, A. The impact of large herbivores on floral composition and vegetation structure in the Naukluft Mountains, Namibia. Biodivers. Conserv. 1997, 6, 1203–1217. [Google Scholar] [CrossRef]
- Augustine, D.J.; McNaughton, S.J. Ungulate effects on the functional species composition of plant communities: Herbivore selectivity and plant tolerance. J. Wildl. Manag. 1998, 62, 1165–1183. [Google Scholar] [CrossRef]
- Avenant, N.L.; Cavallini, P. Correlating rodent community structure with ecological integrity, Tussen-die-Riviere Nature Reserve, Free State province, South Africa. Integr. Zool. 2007, 2, 212–219. [Google Scholar] [CrossRef] [Green Version]
- Bowland, A.E.; Perrin, M.R. The effect of overgrazing on the small mammals in Umfolozi Game Reserve. Z. Säugetierkd. 1998, 54, 251–260. [Google Scholar]
- Munro, N.T.; Fischer, J.; Wood, J.; Lindenmayer, D.B. Revegetation in agricultural areas: The development of structural complexity and floristic diversity. Ecol. Appl. 2009, 19, 1197–1210. [Google Scholar] [CrossRef]
- Skinner, J.D.; Chimimba, C.T. The Mammals of the Southern African Sub-Region; Cambridge University Press: Cambridge, UK, 2005. [Google Scholar]
- du Plessis, J.; Swanepoel, L.H.; McDonough, M.; Schoeman, C. A conservation assessment of Gerbilliscus leucogaster. In The Red List of Mammals of South Africa, Swaziland and Lesotho; Child, M.F., Roxburgh, L., Do Linh San, E., Raimondo, D., Davies-Mostert, H.T., Eds.; South African National Biodiversity Institute and Endangered Wildlife Trust: Cape Town, South Africa, 2016. [Google Scholar]
- McGeoch, M.A. The selection, testing and application of terrestrial insects as bioindicators. Biol. Rev. 1998, 73, 181–202. [Google Scholar] [CrossRef]
- Giere, P.; Zeller, U. Small mammal diversity and reproduction along a transect in Namibia (BIOTA S 07). In African Biodiversity. Molecules, Organisms, Ecosystems; Huber, B., Sinclair, J., Lampe, K.H., Eds.; Springer: Berlin, Germany, 2004; pp. 305–313. [Google Scholar]
- Smithers, R.H.N.; Wilson, V.J. Check List and Atlas of the Mammals of Zimbabwe Rhodesia; Trustees of the National Museum of Rhodesia: Salisbury, Rhodesia, 1979. [Google Scholar]
- Schlitter, D.; Monadjem, A. Steatomys parvus. The IUCN Red List of Threatened Species. IUCN 2017, e.T20721A22233188. [Google Scholar] [CrossRef]
- Perrin, M.R.; Richardson, E.J. Factors affecting the induction of torpor and body mass in the fat mouse Steatomys pratensis. J. Therm. Biol. 2004, 29, 133–139. [Google Scholar] [CrossRef]
- Child, M.F.; Monadjem, A. Steatomys pratensis (errata version published in 2017). The IUCN Red List of Threatened Species. IUCN 2016, e.T20722A115159593. [Google Scholar] [CrossRef]
- Schoeman, C.; Relton, C.; Harvey, J.; Monadjem, A. A conservation assessment of Steatomys pratensis. In The Red List of Mammals of South Africa, Swaziland and Lesotho; Child, M.F., Roxburgh, L., Do Linh San, E., Raimondo, D., Davies-Mostert, H.T., Eds.; South African National Biodiversity Institute and Endangered Wildlife Trust: Cape Town, South Africa, 2016. [Google Scholar]
- Cassola, F.; Child, M.F.; Coetzee, N. Micaelamys namaquensis (amended version of 2016 assessment). The IUCN Red List of Threatened Species. IUCN 2017, e.T573A114636514. [Google Scholar] [CrossRef]
- Child, M.F. Aethomys chrysophilus (errata version published in 2017). The IUCN Red List of Threatened Species. IUCN 2016, e.T569A115050345. [Google Scholar] [CrossRef]
- Russo, I.R.; MacFadyen, D.; Taylor, P.; Child, M.F. A conservation assessment of Micaelamys namaquensis. In The Red List of Mammals of South Africa, Swaziland and Lesotho; Child, M.F., Roxburgh, L., Do Linh San, E., Raimondo, D., Davies-Mostert, H.T., Eds.; South African National Biodiversity Institute and Endangered Wildlife Trust: Cape Town, South Africa, 2016. [Google Scholar]
- Linzey, A.; MacFadyen, D.; Russo, I.M.; Taylor, P.; Bryja, J. A conservation assessment of Aethomys chrysophilus. In The Red List of Mammals of South Africa, Swaziland and Lesotho; Child, M.F., Roxburgh, L., Do Linh San, E., Raimondo, D., Davies-Mostert, H.T., Eds.; South African National Biodiversity Institute and Endangered Wildlife Trust: Cape Town, South Africa, 2016. [Google Scholar]
- Massawe, A.W.; Mulungu, L.S.; Makundi, R.H.; Dlamini, N.; Eiseb, S.J.; Kirsten, F.; Mahlaba, T.; Malebane, P.; Von Maltitz, E.; Monadjem, A.; et al. Spatial and temporal population dynamics of rodents in three geographically different regions in Africa: Implication for ecologically-based rodent management. Afr. Zool. 2011, 46, 393–405. [Google Scholar] [CrossRef]
- Eiseb, S.; Taylor, P.; Zeller, U.; Denys, C.; Nicolas, V. Rapid peripatric speciation linked with drainage evolution in a rare African rodent, Mastomys shortridgei (Rodentia: Muridae). J. Zool. Syst. Evol. Res. 2020. [Google Scholar] [CrossRef]
- Mulungu, L.S.; Massawe, A.W.; Kennis, J.; Crauwels, D.; Eiseb, S.; Mahlaba, T.A.; Monadjem, A. Differences in diet between two rodent species, Mastomys natalensis and Gerbilliscus vicinus, in fallow land habitats in central Tanzania. Afr. Zool. 2011, 46, 87–392. [Google Scholar] [CrossRef]
- Makundi, R.H.; Massawe, A.W.; Mulungu, L.S. Reproduction and population dynamics of Mastomys natalensis Smith, 1834 in an agricultural landscape in the Western Usambara Mountains, Tanzania. Integr. Zool. 2007, 2, 233–238. [Google Scholar] [CrossRef]
- Leirs, H.; Verhagen, R.; Verheyen, W.; Mwanjabe, P.; Mbise, T. Forecasting rodent outbreaks in Africa: An ecological basis for Mastomys control in Tanzania. J. Appl. Ecol. 1996, 33, 937–943. [Google Scholar] [CrossRef]
- Firquet, E.; Leirs, H.; Bronner, G. Germinating grasses and reproductive seasonality of Mastomys species (Rodentia, Muridae). Mammalia 1996, 60, 775–779. [Google Scholar]
- Leirs, H. Population Ecology of Mastomys Natalensis (Smith, 1834); Implications for Rodent Control in Africa, Agricultural Edition; Belgian Administration for Development Cooperation: Brussels, Belgium, 1994; Volume 35, pp. 1–268. [Google Scholar]
- Happold, D.C.D.; Happold, M. An ecological study of small rodents in the thicket-clump savanna of Lengwe National Park, Malawi. J. Zool. 1991, 223, 527–547. [Google Scholar] [CrossRef]
- Zeller, U.; Perry, G.; Starik, N.; Göttert, T. Organisms in Nature—Evolutionary Perspective and Ecological Significance; Humboldt-Universität zu Berlin: Berlin, Germany, 2020; pp. 3–7. [Google Scholar] [CrossRef]


| Wildlife Rangeland | Livestock Rangeland | |||||
|---|---|---|---|---|---|---|
| WF1 | WF2 | C | ||||
| land use intensity | low | medium | high | |||
| trap nights | 1600 | 1600 | 1600 | |||
| species | captures | RCI | captures | RCI | captures | RCI |
| Crocidura sp. | 1 | 0.062 | ||||
| Dendromus melanotis | 1 | 0.062 | ||||
| Elephantulus intufi | 25 | 1.56 | 50 | 3.12 | 26 | 1.63 |
| Gerbilliscus leucogaster | 245 | 15.31 | 148 | 9.25 | 1 | 0.06 |
| Micaelamys namaquensis | 284 | 17.75 | 23 | 1.44 | 174 | 10.88 |
| Mus indutus | 195 | 12.19 | 455 | 28.44 | 34 | 2.125 |
| Saccostomus campestris | 1 | 0.06 | ||||
| Steatomys parvus | 4 | 0.25 | 41 | 2.56 | ||
| Thallomys nigricauda | 1 | 0.06 | ||||
| total | 753 | 47.06 | 721 | 45.06 | 235 | 14.69 |
| Livestock Rangeland | Arable Land | |||||||
|---|---|---|---|---|---|---|---|---|
| EBL | CBL | MF | LF | |||||
| land use intensity | low | medium | high | high | ||||
| trap nights | 990 | 990 | 630 | 960 | ||||
| species | captures | RCI | captures | RCI | captures | RCI | captures | RCI |
| Aethomys crysophilus | 26 | 2.62 | 7 | 0.71 | 61 | 9.68 | 138 | 14.38 |
| Crocidura sp. | 2 | 0.2 | ||||||
| Dendromus melanotis | 1 | 0.16 | ||||||
| Elephantulus intufi | 8 | 0.81 | 3 | 0.3 | ||||
| Gerbilliscus leucogaster | 180 | 18.18 | 17 | 1.71 | 18 | 2.86 | 20 | 2.08 |
| Mastomys natalensis | 150 | 15.15 | 94 | 9.49 | 253 | 40.15 | 272 | 28.34 |
| Mus sp. | 8 | 0.8 | ||||||
| Steatomys pratensis | 18 | 1.82 | 18 | 1.82 | ||||
| indet. | 24 | 21 | ||||||
| total | 408 | 41.21 | 168 | 16.96 | 333 | 52.85 | 430 | 44.79 |
Publisher’s Note: MDPI stays neutral with regard to jurisdictional claims in published maps and institutional affiliations. |
© 2020 by the authors. Licensee MDPI, Basel, Switzerland. This article is an open access article distributed under the terms and conditions of the Creative Commons Attribution (CC BY) license (http://creativecommons.org/licenses/by/4.0/).
Share and Cite
Starik, N.; Mbango, O.K.; Bengsch, S.; Göttert, T.; Zeller, U. Landscape Transformation Influences Responses of Terrestrial Small Mammals to Land Use Intensity in North-Central Namibia. Diversity 2020, 12, 488. https://doi.org/10.3390/d12120488
Starik N, Mbango OK, Bengsch S, Göttert T, Zeller U. Landscape Transformation Influences Responses of Terrestrial Small Mammals to Land Use Intensity in North-Central Namibia. Diversity. 2020; 12(12):488. https://doi.org/10.3390/d12120488
Chicago/Turabian StyleStarik, Nicole, Oskar Kandali Mbango, Susanne Bengsch, Thomas Göttert, and Ulrich Zeller. 2020. "Landscape Transformation Influences Responses of Terrestrial Small Mammals to Land Use Intensity in North-Central Namibia" Diversity 12, no. 12: 488. https://doi.org/10.3390/d12120488