Article

Definition of Core Bacterial Taxa in Different Root Compartments of Dactylis glomerata, Grown in Soil under Different Levels of Land Use Intensity

1
Research Unit Comparative Microbiome Analysis, Helmholtz Zentrum München, 85764 Neuherberg, Germany
2
Department of Health Technology, Technical University of Denmark, 2800 Lyngby, Denmark
3
Institute for Biology, Freie Universität Berlin, 14195 Berlin, Germany
4
Eastern Switzerland University of Applied Sciences, ILF Institute for Landscape and Open Space—Landscape Ecology, 8640 Rapperswil, Switzerland
5
Chair for Soil Sciences, Technical University Munich, 85354 Freising, Germany
*
Author to whom correspondence should be addressed.
Diversity 2020, 12(10), 392; https://doi.org/10.3390/d12100392
Submission received: 17 August 2020 / Revised: 29 September 2020 / Accepted: 2 October 2020 / Published: 13 October 2020
(This article belongs to the Special Issue Plant-Soil Interactions)

Abstract

:
Plant-associated bacterial assemblages are critical for plant fitness. Thus, identifying a consistent plant-associated core microbiome is important for predicting community responses to environmental changes. Our target was to identify the core bacterial microbiome of orchard grass Dactylis glomerata L. and to assess the part that is most sensitive to land management. Dactylis glomerata L. samples were collected from grassland sites with contrasting land use intensities but comparable soil properties at three different timepoints. To assess the plant-associated bacterial community structure in the compartments rhizosphere, bulk soil and endosphere, a molecular barcoding approach based on high throughput 16S rRNA amplicon sequencing was used. A distinct composition of plant-associated core bacterial communities independent of land use intensity was identified. Pseudomonas, Rhizobium and Bradyrhizobium were ubiquitously found in the root bacterial core microbiome. In the rhizosphere, the majority of assigned genera were Rhodoplanes, Methylibium, Kaistobacter and Bradyrhizobium. Due to the frequent occurrence of plant-promoting abilities in the genera found in the plant-associated core bacterial communities, our study helps to identify “healthy” plant-associated bacterial core communities. The variable part of the plant-associated microbiome, represented by the fluctuation of taxa at the different sampling timepoints, was increased under low land use intensity. This higher compositional variation in samples from plots with low land use intensity indicates a more selective recruitment of bacteria with traits required at different timepoints of plant development compared to samples from plots with high land use intensity.

1. Introduction

It is generally accepted that microbiomes support plant growth and health at the plant soil interface [1,2,3,4]. The soil influenced by the root (rhizosphere) and the plant inner tissue (endosphere) provides distinct habitats for these microbial communities. In the rhizosphere, microorganisms benefit from exudation of organic compounds by the plant as well as mucilage provides ecological niches for important plant growth promoting microorganisms [5]. Moreover, plants secrete compounds to selectively chemoattract microorganisms, facilitating their colonization of and proliferation in the rhizosphere [6]. Endophytic bacteria are usually recruited from the rhizosphere microbiome and enter the plant either through lesions or penetrate the root surface actively in addition to vertical transmission of microbes via seeds [7,8]. Despite strong seasonal variations in relation to the plant development stage, the structure and function of plant-associated microbiomes are mostly influenced by the plant species [9].
However, in addition to the plant, microbial communities at the plant–soil interface are also shaped by other factors, including abiotic site-specific properties like soil characteristics, water availability and temperature. Furthermore, the type of management of a particular site and its intensity have been considered important drivers of the plant-associated microbial community [3,10,11,12,13,14]. We could recently show for Dactylis glomerata L., grown in a number of different grassland soils across Germany, that, independent of land use intensity (LUI), members of Pseudomonadaceae, Enterobacteriaceae and Comamonadaceae were the most abundant root endophytes, whereas in the rhizosphere and bulk soil, a clear influence of LUI on the microbial community structure was evident [15]. However, only a single date during peak vegetation was taken into account in this study, which might have masked effects of land use intensity on root endophytes due to the plants’ impact as a result of high exudation rates at the selected sampling time.
Numerous studies postulate that despite the dynamic nature of the plant-associated microbial communities, plants may harbor a species-specific set of essential microbes that are not influenced by environmental conditions and plant growth, supporting the concept of plant-associated core microbial communities [16,17]. Those members may be crucial for nutrient uptake as well as the stress response of the plant and consequently determine the overall fitness of a plant [18]. Thus, the loss of parts of the plant-associated core microbial communities may induce reduced plant fitness and in the long run out-competition by other plants, which triggers significant shifts in biodiversity pattern worldwide, mainly if the plants are facing abiotic and biotic stressors. However, the consequences of LUI for the formation of a particular plant-associated core microbial composition at the root–soil interface are so far unclear.
In the frame of this study we selected eight grassland sites with different LUI within the Biosphere Reserve “Schwäbische Alb” in Southwestern Germany, to identify and define a putative root-associated bacterial core microbiome in (a) the endophytic compartment and (b) the rhizosphere of D. glomerata. Though plant-associated microbes comprise also of different entities such as fungi or protists, we focused in our study on plant-associated bacterial communities for which highly standardized analytical pipelines have been developed in the last years. For all sites, we analyzed bacterial diversity pattern using a molecular barcoding approach at different plant growth stages. We postulated that intensive land use (high LUI) may disentangle the close association of plants and microbes in terms of their co-occurrence and the composition of the core bacterial communities at the plant–soil interface (rhizosphere) might be less complex in terms of reduced bacterial diversity compared to sites with extensive forms of land use (low LUI). We expected that this effect be more pronounced in the rhizosphere than in the root interior.

2. Materials and Methods

2.1. Sampling Sites

The present study was conducted within the long-term interdisciplinary project of the German “Biodiversity Exploratories” (http://www.biodiversity-exploratories.de). Our study sites were located at the “Schwäbische Alb”, which is a limestone secondary mountain range in the southwest of Germany, covering an area of about 422 km2. The land use intensity of the experimental plots was assessed by a land use intensity index according to Blüthgen et al. [19], which was calculated for consecutive years (2006–2014) and included the three major management components fertilization, livestock density and mowing frequency (Table S1). The intensities of the different components were normalized to the regional mean. The index reflects a numerical gradient, formed by calculating the sum of the normalized LUI components equally weighted. For detailed equations please see Blüthgen et al. [19]. Plots were classified as high/low LUI based on their LUI index throughout several years (2006–2010). Selected sites were AEG6, AEG19, AEG20 and AEG21, representing high LUI plots and AEG7, AEG28, AEG33 and AEG34, representing low LUI plots (details can be seen in Table S1). Low LUI index ranged from 0.56 to 1.31 and high LUI index ranged from 1.55 to 2.25. The soil type of all plots was described as Rendzic Leptosol (according to the FAO classification system). Soil texture of the plots was determined as follows: clay content was in the range of 423–637 g/kg soil, silt content in the range of 327–554 g/kg soil and sand content in the range of 15–69 g/kg soil with exception of plot AEG7, showing differing values (clay: 385 g/kg soil, silt: 427 g/kg soil and sand: 188 g/kg soil). Total carbon contents of the sites were in a comparable range from 47 to 88 g/kg soil, total nitrogen contents were in the range of 4.8–10.6 g/kg soil. The C to N ratio was between 9 and 11 for all plots investigated. Samples were collected in May, June and October 2015, representing dynamic seasonal variations. The mean annual temperature was 9.9 °C and the annual precipitation was 730 mm. Mean temperature and precipitation during the months of sampling collection was 8.5–19 °C and 67.1 mm in May, 12.3–22.7 °C and 80.6 mm in June and 5.2–13.3 °C and 19.1 mm in October (Deutscher Wetterdienst, Offenbach, Station Stuttgart/Echterdingen). At each plot, samples were collected within a subplot of 1.5 m × 1.5 m. At each sampling timepoint, three plants of D. glomerata without any disease symptoms were excavated per plot and treated as true replicates.

2.2. Sampling and Basic Analyses

Roots of D. glomerata with adhering rhizosphere soil were suspended in 7.5 mL sterile 1× PBS solution amended with 0.02% Silwet (PBS, AppliChem, Darmstadt, Germany; Silwet L-77), and shaken at 180 rpm for 5 min to separate the rhizosphere from the roots. This step was repeated three times. The PBS solution containing the collected rhizosphere soil was centrifuged at 5000× g for 5 min and the pellet was frozen in liquid nitrogen and stored at −80 °C until further analyses.
After the separation of rhizosphere soil, roots were immediately surface sterilized. Therefore, roots were subjected to sterile 1% Tween 20 for 2 min and washed with pure autoclaved water. Next, roots were incubated for 2 min in 70% ethanol and rinsed three times in sterile distilled water. Subsequently, surface sterilization was done by incubating the roots in 5% sodium hypochlorite for 10 min and rinsing them in sterile water eight times. Sterilized roots were frozen in liquid nitrogen and stored at −80 °C. To check successful surface sterilization, DNA extraction followed by PCR amplification of the 16S rRNA genes, and incubation of 200 µL of the final rinse water on NB agar plates was performed. The absence of the PCR product and no colonies on the agar after 10 days at 28 °C confirmed successful sterilization.
Furthermore, bulk soil samples were taken (soil only loosely attached to the roots) and stored at −80 °C until further molecular analyses, respectively, sieved and stored for a maximum of 24 h at 4 °C for chemical analysis. Water extractable organic carbon (WEOC) and nitrogen (WEON) were determined using DIMA-TOC 100 (Dima Tec, Langenhagen, Germany) using 0.01 M calcium chloride solution for extraction [20]. The same extracts were used to measure nitrate (NO3-N) and ammonium (NH4+-N) by continuous flow analysis using a photometric autoanalyzer (CFA-SAN Plus; Skalar Analytik, Erkelenz, Germany).
In addition, above ground plant material was collected and rinsed with tap water, dried on 65 °C for 2 days and pulverized using the Tissue LyserII (Qiagen GmbH, Hilden, Germany). Total carbon and nitrogen contents were measured using an Elemental Analyzer ’Euro-EA’ (Eurovector, Milano, Italy).

2.3. Nucleic Acid Extraction

For nucleic acid extraction, a phenol-chloroform-based method was used with slight modifications [21]. We used surface sterilized roots, the rhizosphere and bulk soil from all eight plots (3 replicates per plot) in May, June and October resulting in 216 samples in total. Prior to DNA extraction, surface sterilized roots were frozen in liquid nitrogen and prehomogenized using a TissueLyserII (Qiagen GmbH, Hilden, Germany). Afterwards, 0.1 g of roots and 0.3 g of rhizosphere and bulk soil were homogenized using lysing matrix tubes E (MP Biomedicals, Illkirch-Graffenstaden, France) in 120 mM sodium phosphate buffer (pH 8) and TNS solution (500 mM Tris-HCl pH 8.0, 100 mM NaCl, 10% SDS (wt/vol)), and centrifuged at 16,100× g for 10 min at 4 °C. The supernatant was transferred into a 2 mL DNase/RNase free SafeLock tube on ice and successively mixed with an equal volume of phenol/chloroform/isoamylalcohol (25:24:1 (vol/vol), Sigma-Aldrich, St. Louis, MO, USA) and chloroform/isoamylalcohol (24:1 (vol/vol)) and centrifuged for 5 min at 16,100× g. DNA was precipitated using 30% (wt/vol) polyethylene glycol (PEG) solution (PEG 6000, NaCl). After 2 h of incubation on ice, the solution was centrifuged (16,100× g, 10 min, 4 °C). The resulting pellet was washed in ice-cold DNase/RNase free 70% ethanol, air-dried and eluted in 30 µL 0.1% diethylpyrocarbonate water. The concentration was measured in duplicates using the Quant-iT™Pico Green® ds DNA assay Kit (Invitrogen, Carlsbad, CA, USA) according to the manufacturer’s instructions. The measurements were performed with a SpectraMax Gemini EM Fluorescence Plate Reader Spectrometer (Molecular Devices, Sunnyvale, CA, USA). Values were corrected for background fluorescence by addition of negative controls. Finally, the DNA extracts were stored at −80 °C until further use.

2.4. Library Preparation and Illumina Sequencing

Next generation sequencing was performed on the Illumina MiSeq platform (Illumina Inc., San Diego, CA, USA). Library was prepared according to the “16S Metagenomic Sequencing Library Preparation” protocol proposed by Illumina Inc., USA. To reduce biases of the polymerase chain reaction (PCR) amplification of the 16S rRNA region, the reaction was carried out in triplicates using 335Fc (5′-CADACTCCTACGGGAGGC-3′) as a forward primer and 769Rc (5′-ATCCTGTTTGMTMCCCVCRC-3′) as a reverse primer with Illumina adapter sequences [22]. The PCR reaction contained 12.5 µL NEB Next High Fidelity Master Mix (Illumina Inc., San Diego, CA, USA), 0.5 µL of each primer (10 pmol/µL), 2.5 µL of 3% BSA, 100–200 ng of template DNA and 25 µL of DEPC water. PCR conditions included an initial denaturation step at 98 °C for 5 min, followed by 20 cycles (rhizosphere and bulk soil samples) or 28 cycles (root samples) of denaturation (98 °C; 10 s), annealing (60 °C; 30 s) and elongation (72 °C; 30 s). The final elongation was performed at 72 °C for 5 min. Negative controls of extraction (blank extraction) and PCR (using DEPC water instead of template DNA) were treated accordingly. Resulting amplicons were analyzed on a 2% agarose gel. Afterwards, triplicates were pooled and purified using the Agencourt®AMPure®XP (Beckman Coulter Company, Carlsbad, CA USA) extraction kit according to the manufacturer’s instructions, with a modified ratio of AMPure XP to PCR reaction (0.6/1). The presence of primer-dimers and amplicon sizes were checked on a Bioanalyzer 2100 Agilent Technologies, Santa Clara, CA, USA), using the DNA 7500 kit (Agilent Technologies, Santa Clara, CA, USA) and quantified using the Quant-iT PicoGreen kit (Life Technologies, Grand Island, NY, USA). Finally, indexing PCR was carried out using 10 ng of amplicon DNA, 12.5 µL NEB Next High Fidelity Master Mix and 10 pmol of each indexing-primer. PCR conditions were changed for the annealing temperature (55 °C) and the number of cycles (8 cycles). Purified PCR products were pooled in equimolar ratios to a final concentration of 4 nM and sequenced using the MiSeq Reagent kit v3 (600 cycles; Illumina Inc., San Diego, CA, USA) for paired end sequencing. Sequence files were deposited in the NCBI Sequence Read Archive under accession numbers SRP102620 and PRJNA380810.

2.5. Sequence Data Analysis

Sequence analysis was performed using QIIME (quantitative insights into microbial ecology [23]) and default parameters. FASTQ files were trimmed and merged with a minimum read length of 50 and minimum Phred score of 15 using AdapterRemoval [24]. PhiX contamination was removed using DeconSeq [25]. Reads were merged and filtered by size (400–480 bp) and clustered into operational taxonomic units (OTUs) at 97% sequence identity with an open reference strategy using GreenGenes 16S rRNA reference database (13_5 release) [26]. Taxonomy was assigned using the RDP (v2.2) classifier retrained on the GreenGenes [27]. Afterwards, chloroplast sequences were removed, and output was filtered with an abundance cut-off of 0.001%. To make results comparable, the data set was rarefied to the lowest obtained read number. Afterwards, diversity analyses were performed, which is implemented in the Qiime workpackages, including the calculation of relative abundance of each OTU per sample as well as the computation of α- and ß-diversity. The analysis of α-diversity (within sample diversity) was calculated per sample and was based on chao1 richness [28] and Shannon’s diversity [29]. For the calculation of the boxplots, samples were grouped by month and LUI (i.e., 3 × 4 samples high and 3 × 4 samples low LUI per sampling season and compartment). Significant differences in α-diversity were obtained by unpaired t-tests. Betadiversity measures were calculated using unweighted and weighted UniFrac metrics as described by Catherine et al. [30].
Statistical significance of dissimilarities in ß-diversity was determined by adonis using the r-package, Vegan (R package version 2.4-4) [31], via the Qiime script “compare_categories.py”. Significances of LUI were calculated per compartment and season. Significances of season were calculated per compartment and LUI. The analysis of the core bacterial microbiome of roots and rhizosphere from different LUIs was based on the total relative abundance of bacterial OTUs and was computed using “compute_core_microbiome.py”. Thus, a table of OTUs was obtained per month and LUI, where the OTUs that remained were present in 90% of the respective samples (i.e., OTU had to be present in 11 of 12 samples per LUI and month). These tables were used for visualization in the Bioinformatics and Evolutionary Genomics webtool [32].

3. Results

3.1. Soil Carbon and Nitrogen Content

While WEOC was not influenced by different LUI levels, it changed in response to the sampling season. Concentrations in October (64.1 µg g−1 dw in average) were significantly higher compared to May (35 µg g−1 dw in average) or June (26.1 µg g−1 dw in average). In contrast, WEON, nitrate and ammonium concentrations increased with LUI and changed over time. As expected, the highest concentrations of 43.13 µg g−1 dw WEON and 46.08 µg N g−1 dw nitrate on average were detected in June on intensively managed sites due to increased fertilizer input by manure application (see Table S2).

3.2. Sequencing Summary

In total, 16,085,722 raw-sequence reads were obtained from PCR amplicons by Illumina sequencing. After quality filtering and chimera check, 12,561,385 high-quality partial 16S rRNA gene sequences with a minimum length of 400 bp remained. After removal of chloroplasts and the application of an abundance cut-off of 0.001%, 8,991,033 sequences and 10,099 OTUs remained. To compare samples without statistical bias, data were rarefied to 14,092 reads per sample, which reflected the lowest obtained read number. Rarefaction was performed to account for variations in library sizes between samples of different compartments. Rarefaction analysis indicated a sufficient sampling depth for further investigation at 97% sequence similarity (Figure S1).

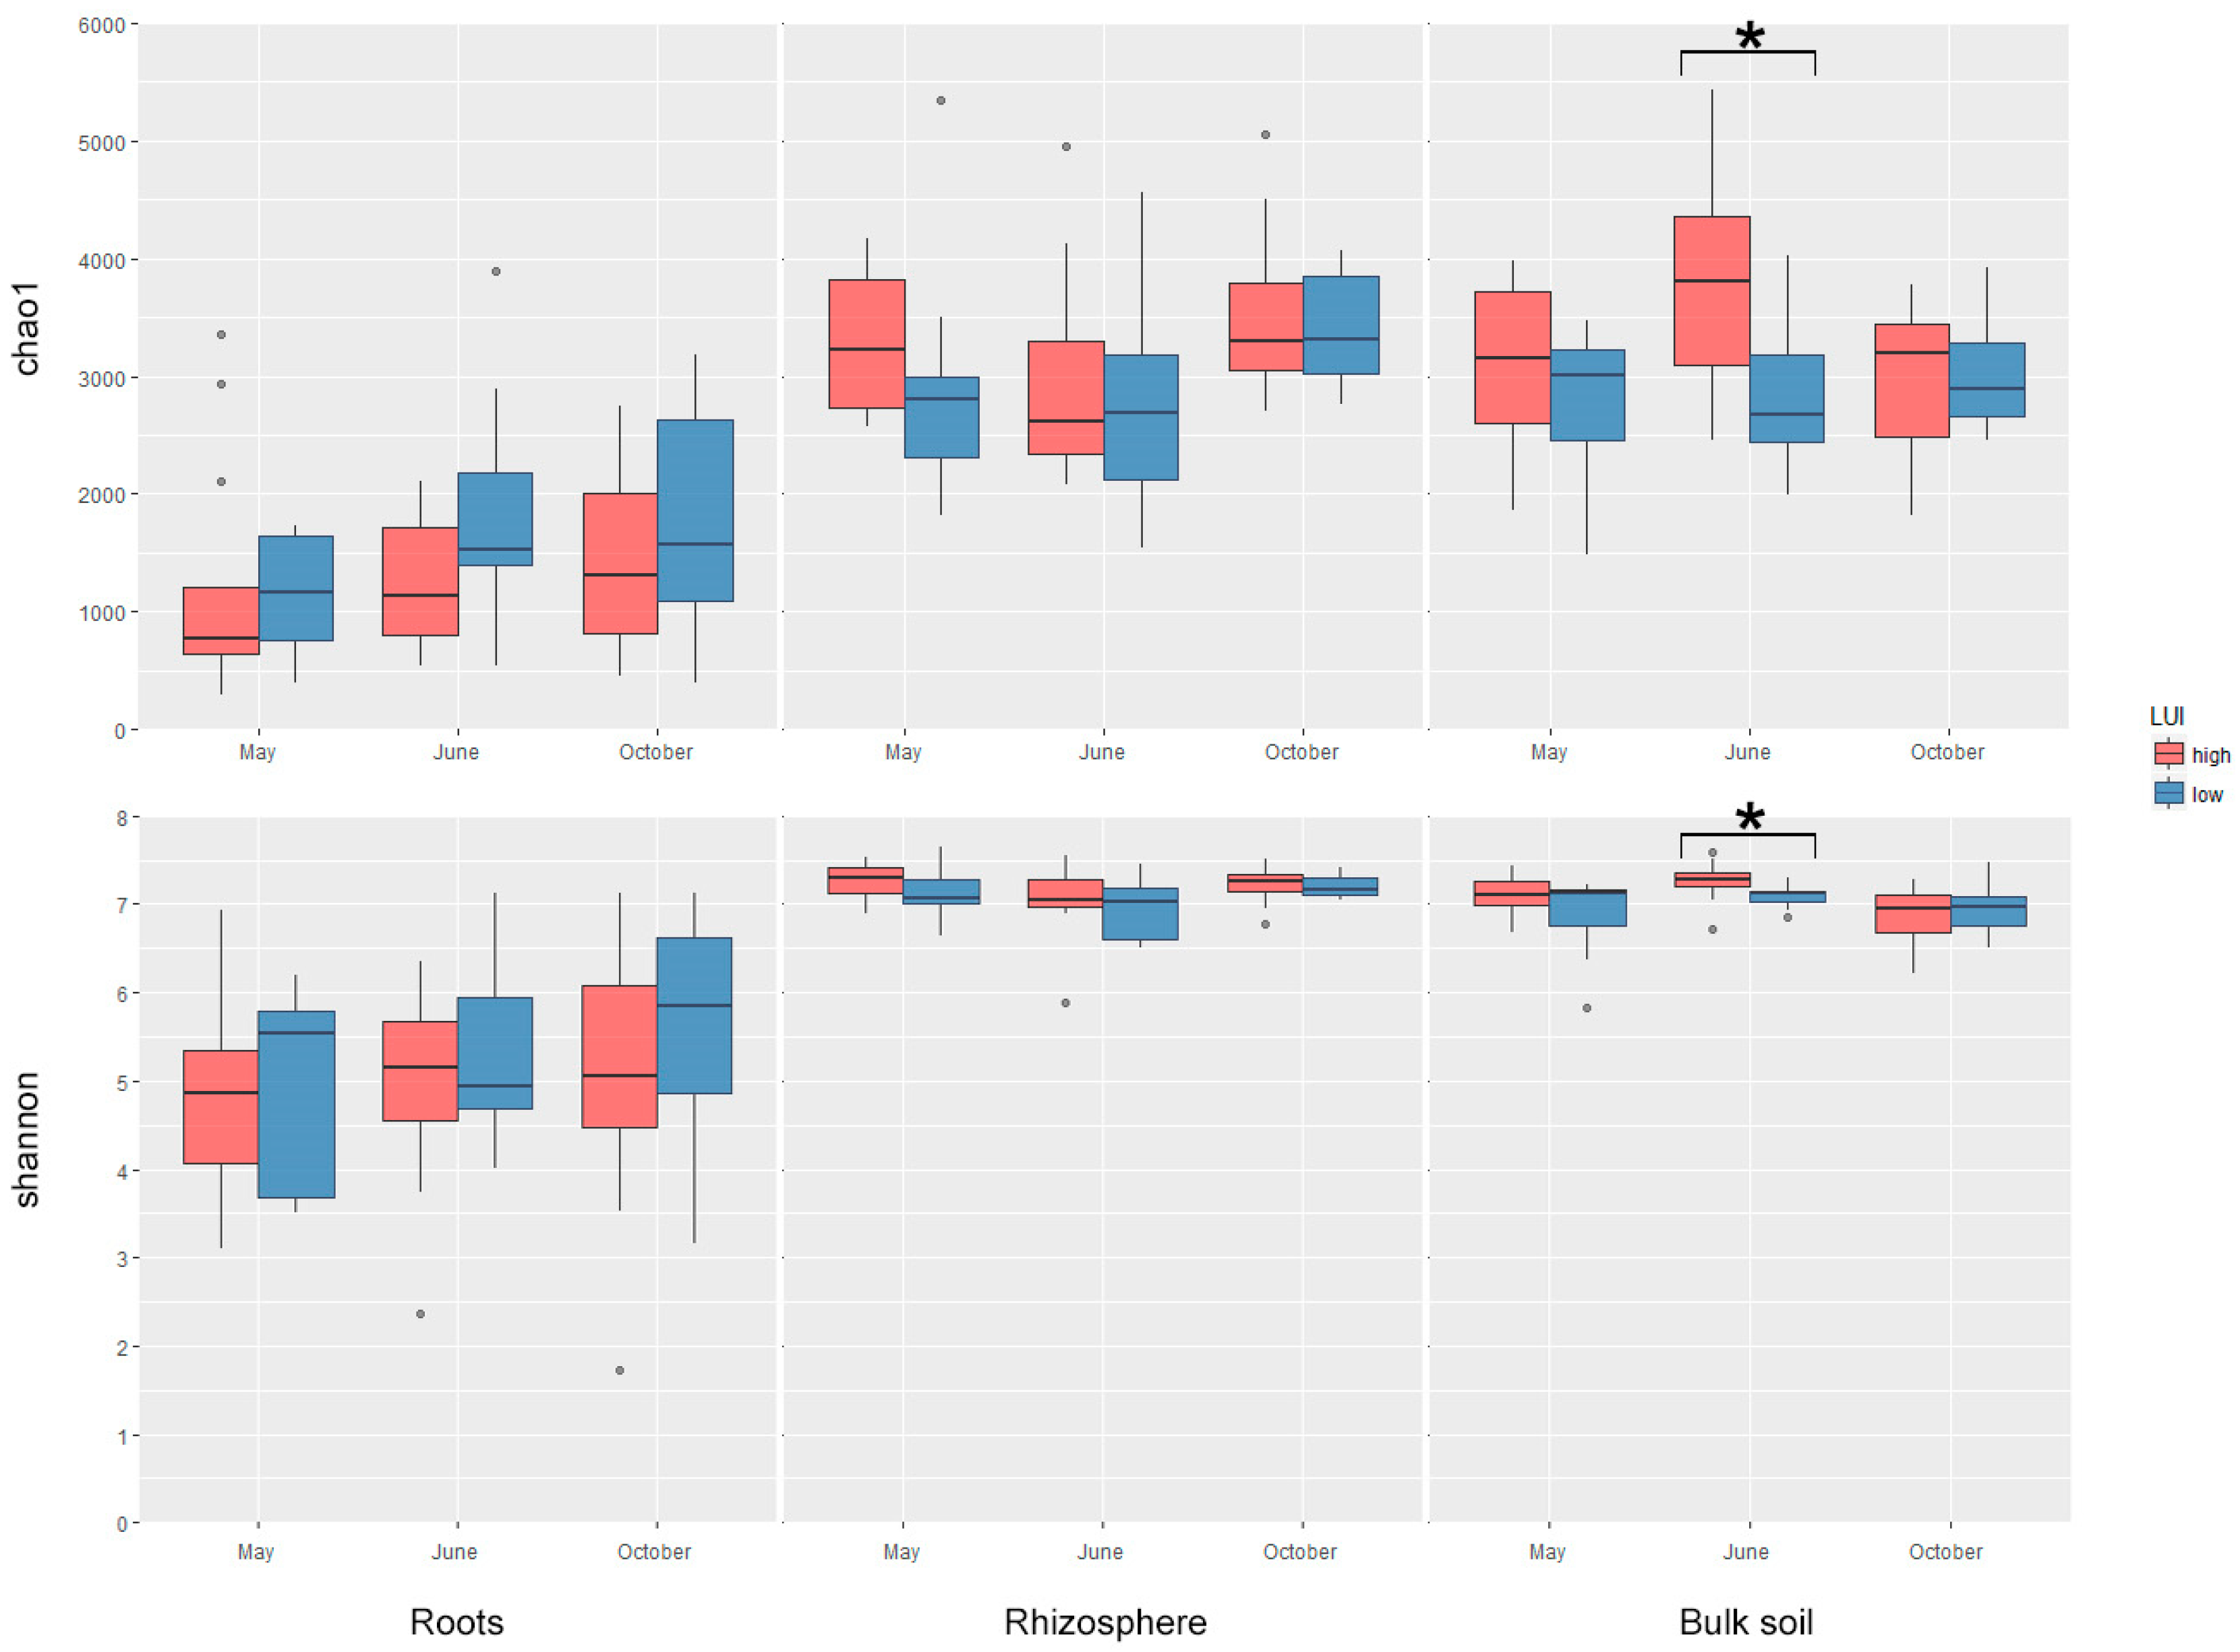
3.3. Characterization of Bacterial Diversity

Analysis of α-diversity (diversity in terms of OTU numbers present in a single sample), measured as the Shannon index and chao1 richness (Figure 1), indicated a significant impact of LUI mainly on bacterial diversity in bulk soil in June, with increased values at sites with high LUI compared to sites with low LUI. For other timepoints no significant influence of LUI on bacterial diversity was detected in bulk soil. For the other compartments (rhizosphere and root interior) no significant influence of LUI on bacterial diversity was measured for any of the sampling timepoints. However, as expected, overall α-diversity was higher in the rhizosphere and bulk soil compared to the root interior.
Beta-diversity was also impacted by LUI to a large extent, mainly in June, when effects of LUI on all compartments were observed. In addition, significant differences between different LUI levels were also observed in the rhizosphere and bulk soil for the other two sampling periods (Table S3). Weighted UniFrac distances indicated a significant impact of season for all analyzed compartments (Table S4).
Most abundant phyla in all compartments (endosphere, rhizosphere and bulk soil) were Proteobacteria, Bacteroidetes and Actinobacteria, followed by Firmicutes and Acidobacteria (Table S5). At the genus level (Table S6), Pseudomonas (23%) was dominating the root endosphere followed by Janthinobacterium (4%), Rhizobium (3%), Burkholderia (3%) and genera belonging to the family of Enterobacteriaceae (4%). In contrast, in the rhizosphere as well as in bulk soil, most abundant taxa were assigned to the families Sinobacteraceae (9/6%) and Chitinophagaceae (8/12%) followed by the genus Rhodoplanes (4/6%).

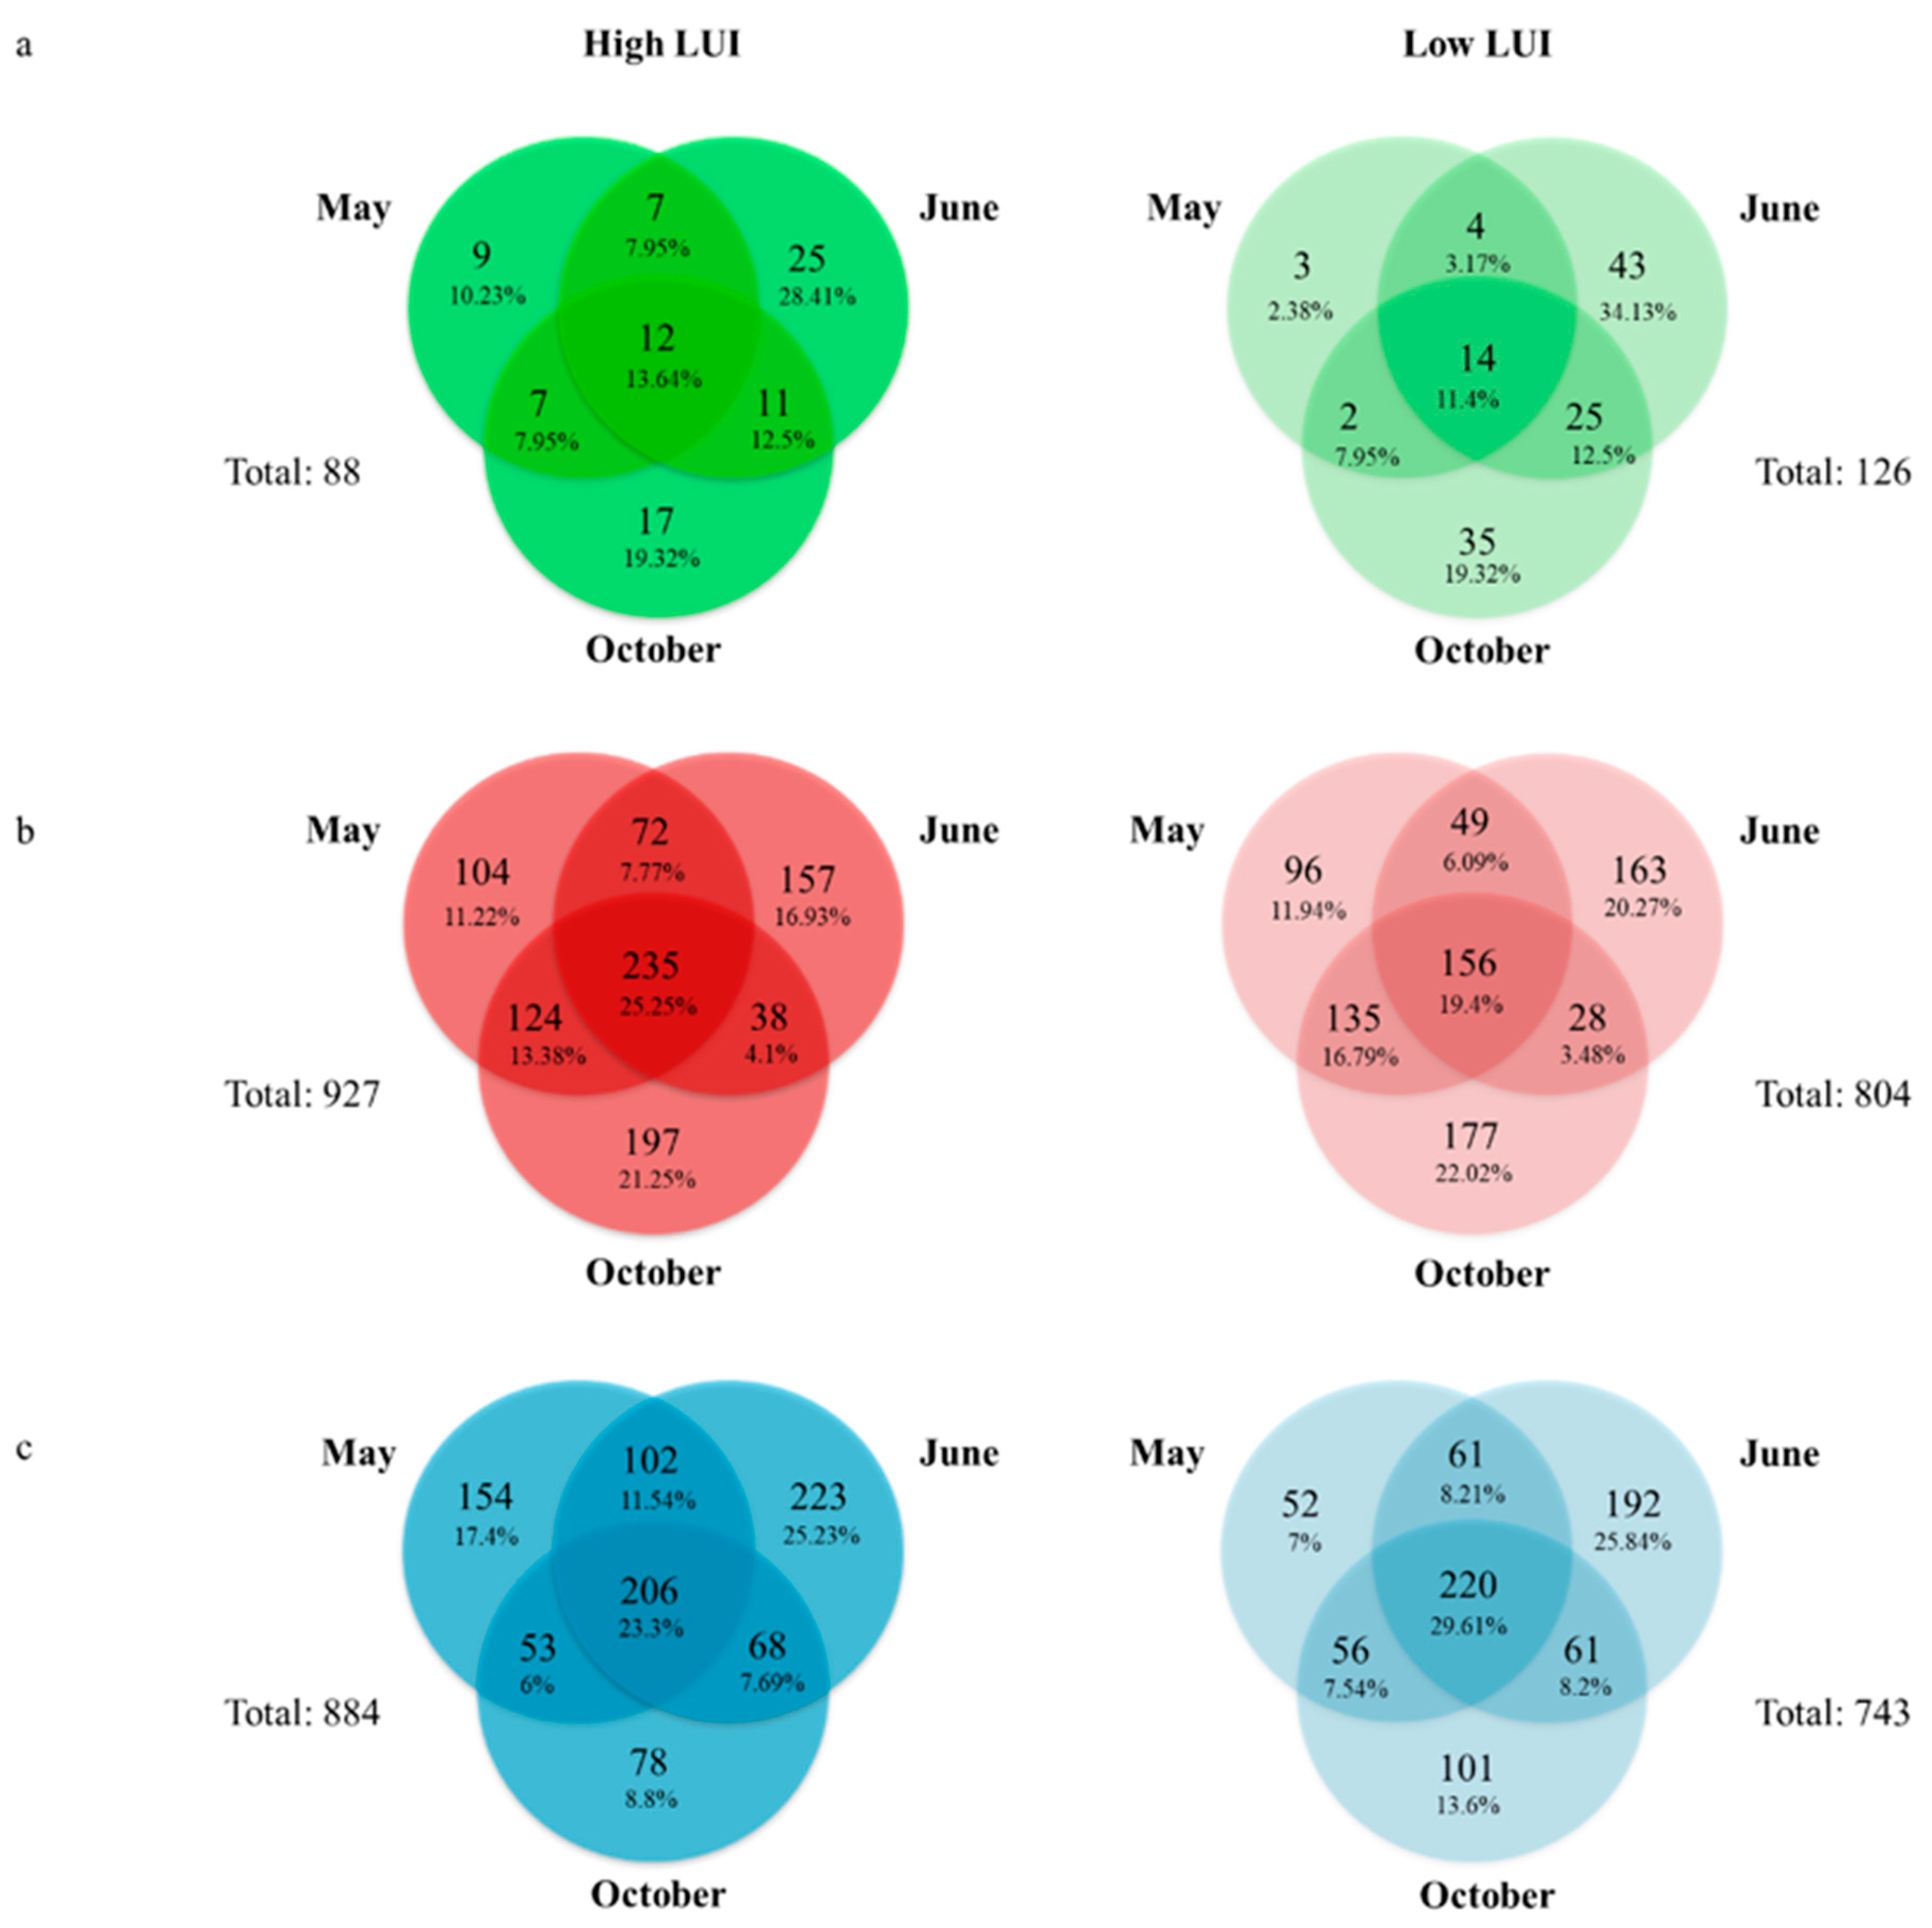
3.4. Definition of an Endophytic Core Microbiome for Dactylis glomerata L.

From the 88 OTUs detected in roots under high LUI on the 97% homology level, 76 were affected by the sampling timepoint. At all sampling timepoints, 12 OTUs were detected and formed a plant-associated bacterial core community (high LUI, May, June and October; Figure 2).
Five of these OTUs were classified as Pseudomonas without a clear affiliation to a particular species (OTU 398604, 4455861, 3314521, 9448 and 1087); one OTU (633252) could be further classified as P. veronii. The other OTUs of the core microbiome could be assigned to Rhizobium (OTU 1104627, 220539), Bradyrhizobium (OTU 4377104, 1105814), Agrobacterium (OTU 969805) and Labrys (OTU 218772; see Table S7).
Overall, more OTUs could be detected in roots under low LUI compared to high LUI (126 OTUs compared to 88 on the level of 97% homology). However, the plant-associated core bacterial communities including all sampling timepoints (low LUI, May, June and October) were comparable (14 OTUs compared to 12; Figure 2). The classification revealed close similarities between the plant-associated core bacterial communities of high and low LUI. Like for high LUI, most OTUs in the core (8) could be identified as Pseudomonas. The OTU assigned to P. veronii for both land use intensities were identical (OTU 633252). Other identical OTUs found were OTUs 3,314,521, 9448 and 1087, classified also as Pseudomonas and OTU 4,377,104 and 1,105,814, assigned to Bradyrhizobium. OTUs that were unique in the core bacterial composition of plants from low LUI sites, but phylogenetically comparable to OTUs found in the roots of plants from high LUI sites were OTUs 12,056, 6025 and 14298, which were further classified to P. umsongensis. In addition to those, we found one OTU (646,549), classified as Pseudomonas and three OTUs classified as Rhizobium (2156, 1433, 1,104,627), which were phylogenetically similar to those detected in roots of plants from sites with high LUI.
The only OTU that was solely found as part of the root core microbiome of plants at sites with low LUIs was assigned to Caulobacter (OTU 7929). In contrast, the OTUs that were only present in the endophytic core microbiome of plants under high LUI were assigned to Agrobacterium (OTU 969805) and Labrys (OTU 218772; see Table S8).

3.5. Definition of a Core Microbiome for the Rhizosphere of Dactylis glomerata L.

Due to the higher diversity in the rhizosphere compared to the root interior, the absolute numbers of OTUs, which contributed to the bacterial core microbiome of the rhizosphere, were higher. However, surprisingly also relative numbers were increased (Figure 2b and Figure 3b). While in the root interior the bacterial core composition was only formed by 11–13% of the detected OTUs, more than 19% of the detected OTUs were part of the plant-associated core bacterial communities in the rhizosphere (Figure 2a,b). Interestingly, the numbers, as well as the proportion of OTUs that contributed to the core that was shared amongst all sampling seasons in the rhizosphere was lower under low LUI (156/19.4%) compared to high LUI (235/25.3%). In contrast to the root core bacterial community composition (shared throughout all sampling seasons under high vs. low LUI), the amount of uniquely found OTUs was higher under high LUI compared to low LUI (Figure 3b).
While the core plant-associated bacteria (found across all sampling seasons) in roots were dominated by OTUs, which could be assigned to Pseudomonas under both LUIs, OTUs linked to this genus were less abundant in the core bacterial community (found across all sampling seasons) of the plant rhizosphere independent of LUI. Under both LUIs, the majority of core OTUs was assigned to the genera Rhodoplanes, Methylibium, Kaistobacter and Bradyrhizobium, and to the families Sinobacteraceae and Chitionophagaceae.
We found a total number of 927 OTUs under high LUI in the rhizosphere, where 692 OTUs were influenced by a sampling timepoint on a 97% sequence similarity level (not found across every season). 235 OTUs were detected independent of the sampling timepoint, reflecting the high LUI rhizosphere core (found across all seasons). The majority of OTUs found in the core was assigned to the genera Rhodoplanes (16 OTUs), Methylibium (15 OTUs), Kaistobacter (11 OTUs) and Bradyrhizobium (8 OTUs). Furthermore, a high number of not further assigned Sinobacteraceae (20 OTUs) and Chitinophagaceae (12 OTUs) was detected (Table S9).
Under low LUI, we found a total number of 804 OTUs, with 648 OTUs being influenced by the sampling date on the 97% sequence similarity level (not found across every season). The plant-associated core bacterial community composition was formed by 156 OTUs (found across all seasons). As for the root core plant-associated bacteria, the largest part of the rhizosphere core (low LUI) was comparable to the core found under high LUI regarding the genera detected. In total, we found 124 identical OTUs in both high and low LUI core bacterial community composition. The genera that were found in highest amounts were the same as under high LUI: Rhodoplanes (11 out of 12 OTUs identical to high LUI core), Kaistobacter (7 out of 8 OTUs identical), Methylibium (7 identical OTUs) and Bradyrhizobium (7 identical OTUs). Additionally, not further classified families that were found in high numbers were the same: Sinobacteraceae (11 identical OTUs) and Chitinophagaceae (5 out of 8 OTUs identical). Thirty-two OTUs appeared to be unique in the rhizosphere core of low LUI. Among those were the genera Pseudomonas (OTUs 646,549, 398,604), Candidatus Solibacter (OTU 817,874), Flavobacterium (OTU 6614), Kaistobacter (OTU 331,282), Niabella (7994), Novosphingobium (OTU 941,803), Pedobacter (OTU 976,441) and Rhodoplanes (OTU 2,025,156). Moreover, six unique OTUs could be classified to a particular species (on the 97% homology level; Table S10, Table S11 and Table S12): Asticcacaulis biprosthecium (OTU 1,105,085), Bosea genosp. OTUs (567,840, 829,415), Variovorax paradoxus (OTUs 123, 2575) and Sphingomonas wittichii (OTU 3395). Additionally, we found three taxa that were only present in the low LUI plant-associated core bacterial community composition: Novosphingobium (OTU 94,180), Niabella (OTU 7994) and Pedobacter (OTU 976,441).
OTUs unique to the high LUI rhizosphere core (111) appeared to be more diverse compared to low LUI (Figure 3b). Within the 111 unique OTUs in the core of high LUI, 39 OTUs could be assigned to genus level without further classification to the species. Among those we found Methylibium (8 OTUs), Rhodoplanes (5 OTUs), Kaistobacter (4 OTUs) and Candidatus Solibacter (3 OTUs). Furthermore, among the unique OTUs under high LUI, we found OTUs that could be assigned to Rhizobium (103,410), Mycoplana (998,905), Labrys (543,156), Asticcacaulis (1,105,085) Adhaeribacter (1,069,076), Paucibacter (593,163) Microlunatus (249,330, 4209) and Bosea (567,840, 829,415).

3.6. Definition of a Core Microbiome for the Bulk Soil of Dactylis glomerata L.

The bulk soil associated bacterial core communities were comparable to the rhizosphere associated core bacterial communities with regard to the composition as well as to the total amount of shared OTUs found amongst all sampling seasons. Under high LUI, we found in total 884 OTUs, 678 of which were influenced by the sampling timepoint (not found across all seasons). We found 206 OTUs to be shared across all sampling seasons under high LUI on the 97% sequence similarity level. The majority of OTUs assigned to the genus level was also comparable to the core bacterial community composition of the rhizosphere. OTUs in the shared core of the bulk soil (found across all seasons) were assigned to Rhodoplanes (23 OTUs), Kaistobacter (10 OTUs), Candidatus Solibacter (8 OTUs), Bradyrhizobium (8 OTUs), Methylibium (8 OTUs) and Pedomicrobium (8 OTUs). High numbers of not further classified families were Sinobacteraceae (22 OTUs) and Chitinophagaceae (16 OTUs) like in the rhizosphere. Genera found to be unique in the core of high LUI were Geobacter (701,911), Ramlibacter (4928), Afifella (10,984), Nitrospira (173,004), Adhaeribacter (1,069,076) and Thermomonas (805,685). Only the latter two OTUs were also found in the high LUI core bacterial community composition of the rhizosphere.
Under low LUI, a total of 743 OTUs was detected across all seasons in the bulk soil. Among those, 220 could be found independent of the sampling timepoint (shared across all sampling seasons). Most OTUs could be classified to Bacillus (with 3 out of 5 OTUs being identical to high LUI OTUs), Bradyrhizobium (8 out of 9 identical OTUs), Kaistobacter (6 out of 8 identical OTUs), Methylibium (4 out of 9 identical OTUs), Pedomicrobium (7 out of 8 identical OTUs), Rhodoplanes (19 out of 22 identical OTUs), Steroidobacter (1 out of 7 identical OTUs), Sinobacteraceae (16 out of 25 identical OTUs) and Chitinophagaceae (8 out of 11 identical OTUs). In addition to this, two genera were found solely present in the low LUI core: SMB53 (555,945) and Labrys (543,156). OTU 543,156, however, was found in the core bacterial community composition of low LUI rhizosphere, too.

4. Discussion

4.1. The Role of LUI for Bacterial Diversity at the Plant–Soil Interface at Different Stages of Plant Development

In this study, we compared the putative core bacterial communities of the agricultural important grass Dactylis glomerata L. under the influence of different LUIs. Plants were sampled at three different dates from sites exposed to high and low LUI, respectively, to characterize the bacterial community composition in the endosphere and rhizosphere as well as in the bulk soil.
The analysis of α-diversity showed an increase of microbial diversity under high LUI within all plant stages only in the bulk soil. This might be explained by a more transient and patchy bacterial colonization under higher LUI [33]. In contrast, under low land use intensity, bacterial communities are differing strongly between the measured timepoints during the season, indicating a clear fluctuation of bacterial communities over the season, which is not the case under high land use intensity. Lower α-diversity as a result of low LUI, which we attribute to less disturbance, results in a more stable and consistent composition of bacterial communities [34]. However, we could neither find a significant impact of LUI on the bacterial α-diversity in the rhizosphere, nor in the root endosphere. This is in accordance with several studies showing that plant species have a stronger effect on plant-associated microbial communities than soil parameters [35,36].
Analysis of β-diversity within the root endosphere revealed a significant impact of land use intensity in June, indicating a difference in the presence and/or absence of certain OTUs. This might be due to seed production in June, which generates high metabolic expenses for the plant, which are caused by the synthesis of storage products (including proteins, starch and lipids), the uptake of mineral nutrients, as well as nutrient translocation from the site of synthesis to seed assimilation [37]. Thus, mainly at sites with low land use intensity and reduced amounts of plant available nitrogen, it is essential for optimal performance of the plant to recruit bacteria, which are capable of forming plant available nitrogen either by mineralization of dead biomass or by nitrogen fixation, which might explain differences in β-diversity in June between sites with different land use intensities.
As expected, a significant difference between LUIs was also observed in the rhizosphere and bulk soil at every sampling date. In addition, we also found a significant difference in the presence and/or absence of certain OTUs (unweighted Unifrac) between different sampling dates, within high and low LUI, respectively, in all compartments (Table S8). Thus, the results suggest a root-associated bacterial community composition that is selected by the plant throughout the season, which is in accordance with numerous studies [2,38,39] and additional effects driven by LUI, which differ in their degree and direction towards shifts in the abundance of single OTUs dependent on the sampling date. As the LUI index we used in our study takes into account various parameters, which are affected by land use intensity, including fertilization and subsequent changes of nitrogen pools in soils, the observed LUI-mediated effects might be coupled to altered soil parameters, which in turn affected the bacterial community composition.

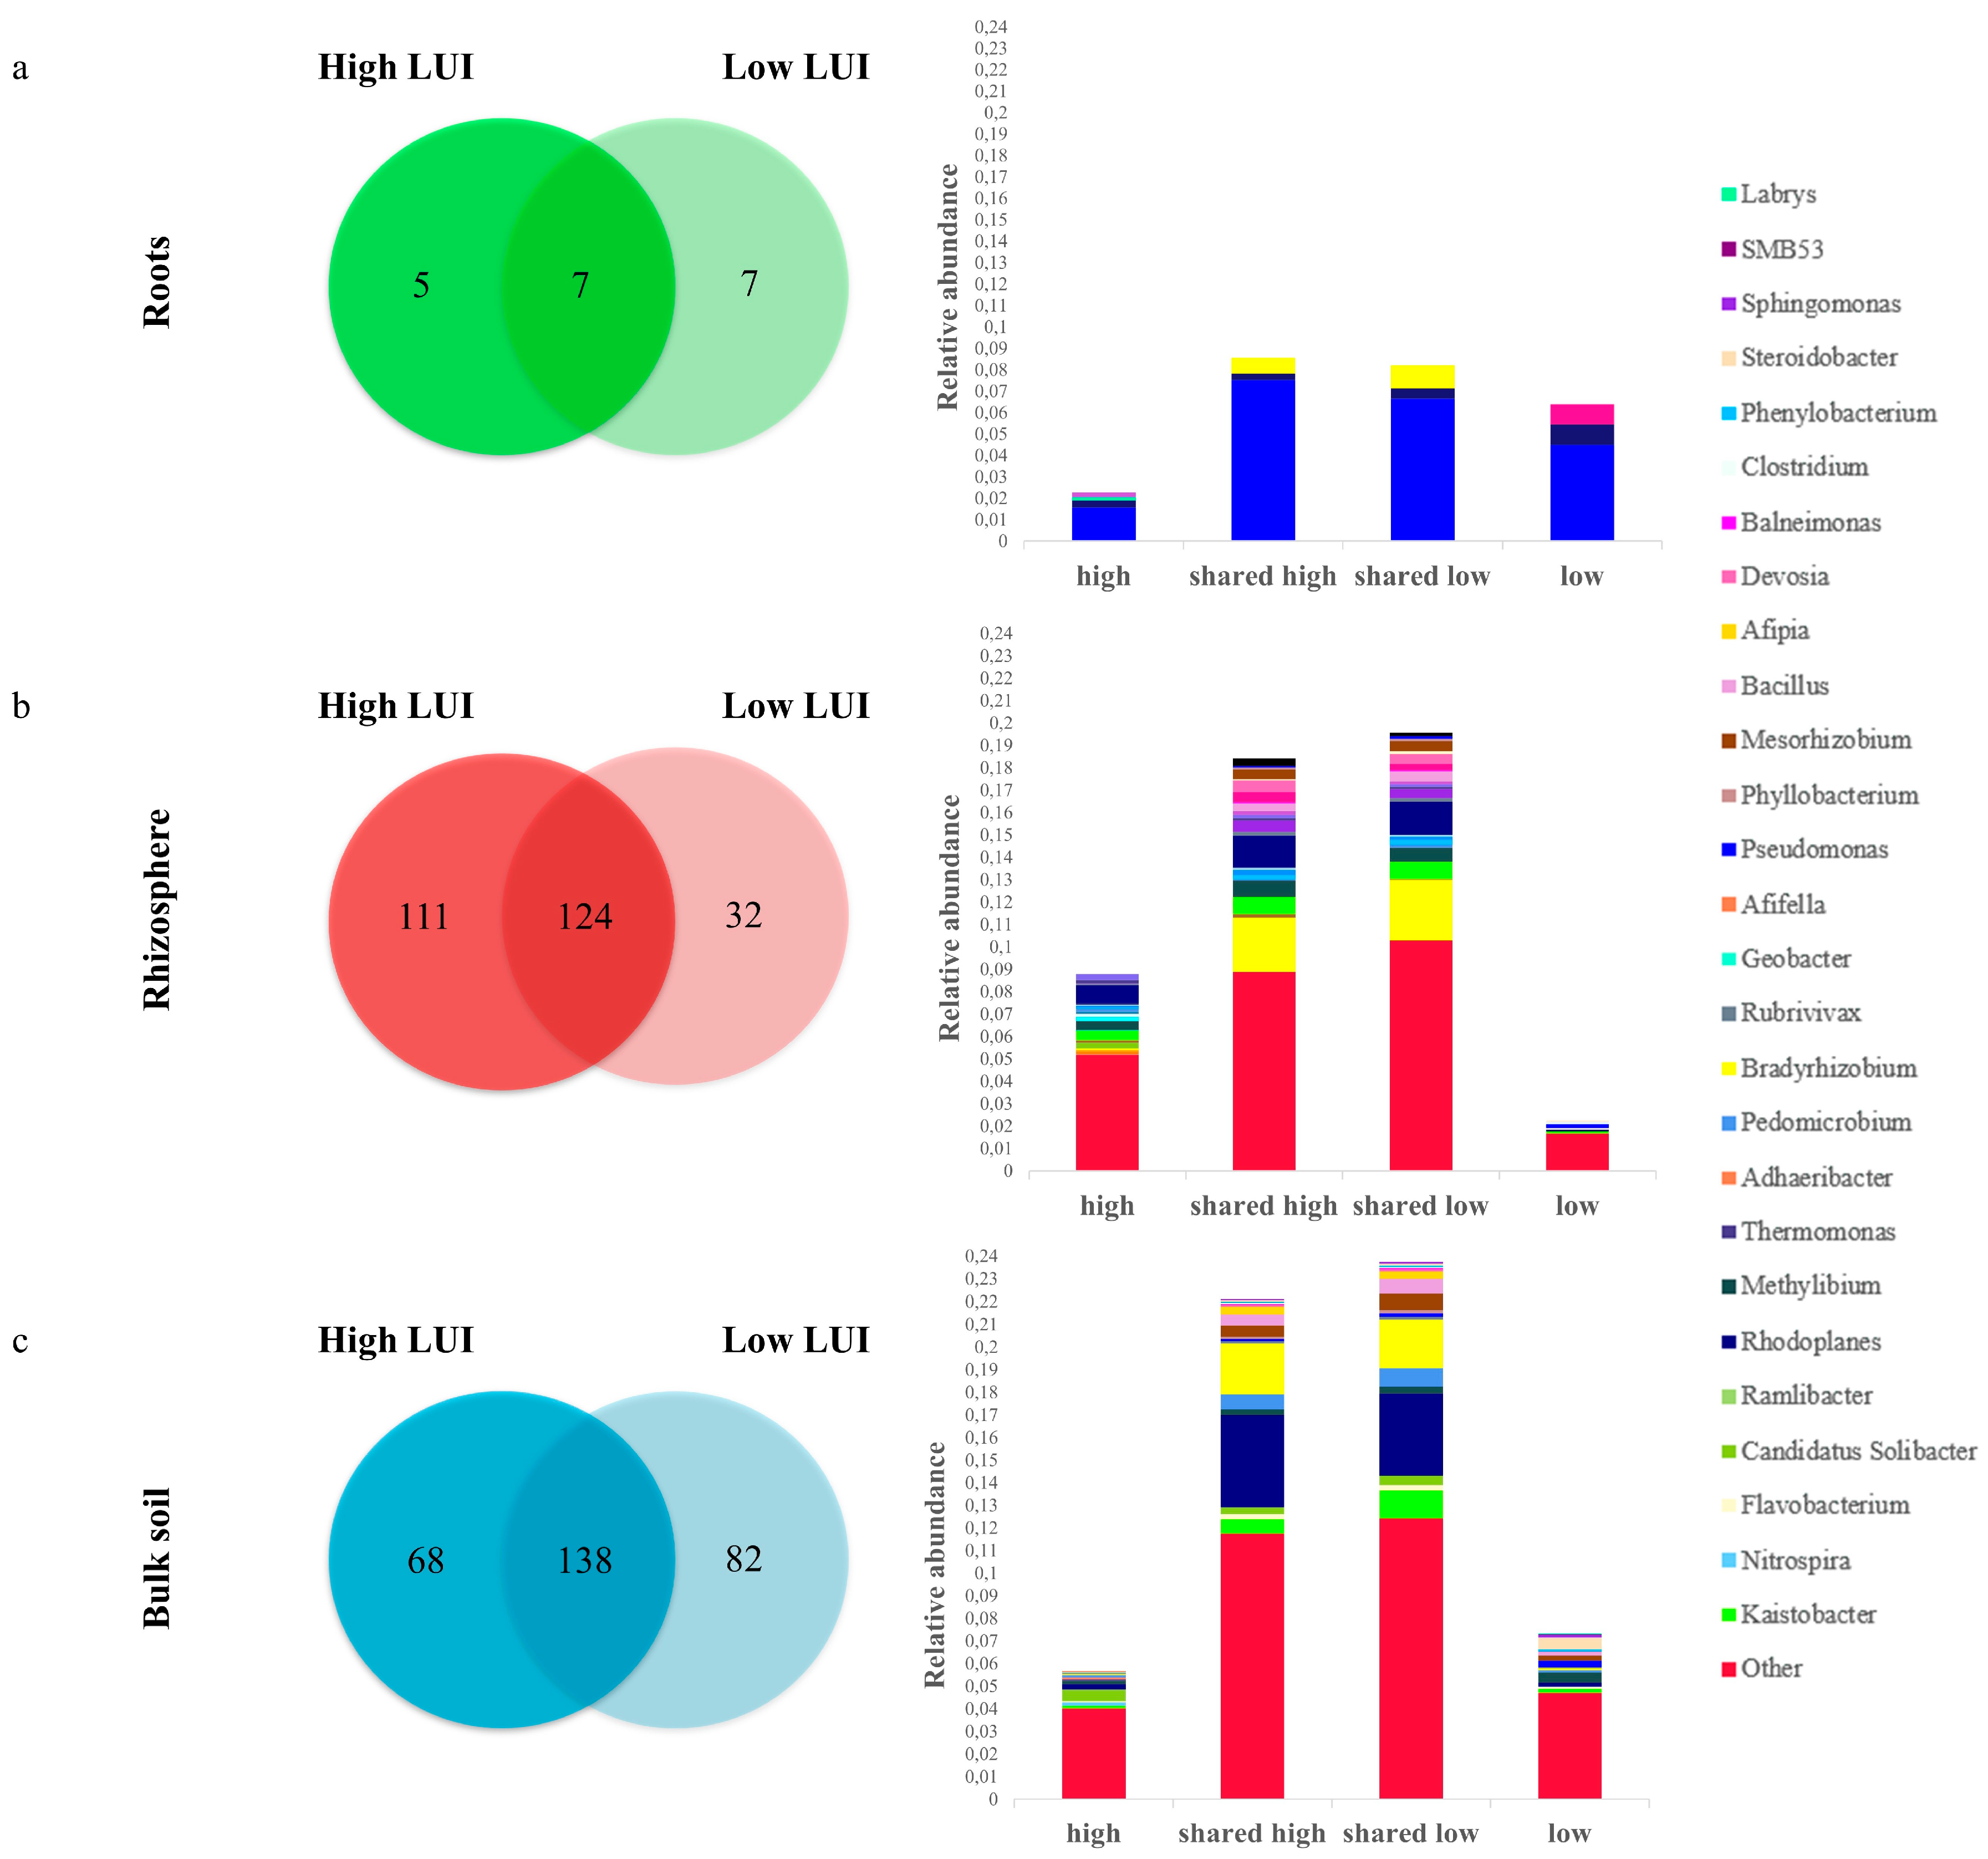
4.2. The LUI Independent Bacterial Core Microbiome of D. glomerate

The main focus of this study was to identify a putative plant-associated core bacterial community of D. glomerata in different plant compartments, because bacteria that are consistently found across samples subjected to different conditions likely provide critical ecological functions. Indeed, we found plant-associated bacterial communities that were shared across all sampling seasons under both LUIs (Figure 2). Pseudomonas veronii was found in the root core of both LUIs, emphasizing its importance for D. glomerata. Previous studies have demonstrated that root-associated P. veronii exhibits high biocontrol potential by increasing the bioavailability of phosphate and ammonia in the soil [40] and by synthesizing indole-3-acetic acid (IAA), which is of major importance, since it stimulates cell elongation and cell division of the plant [41]. Furthermore, a high nematodical activity was observed within this species [42]. It was shown that the abundance of plant-parasitic nematodes is significantly increased in D. glomerata compared to other grasses and legumes [43]. This might be critical for D. glomerata since it can affect the competitive ability of the plant significantly. Moreover, other Pseudomonas spp. were reported to possess a wide variety of plant growth promoting traits and beneficial properties. These include the production of various phytohormones like IAA, cytokinins or gibberillins, as well as nitrogen fixation and production of antimicrobial compounds [44]. Additionally, Rhizobium and Bradyrhizobium were found in the plant-associated core bacterial composition independent of LUI. Both genera are known for their nitrogen-fixing abilities within nodules of leguminous plants [45,46] and for the production of phytohormones [47,48]. Moreover, genes for nitrogen fixation of the endophytic Rhizobium spp. were found in high abundances within tissues of the perennial grass sugarcane, indicating their particular importance for plant-associated nitrogen fixation in perennial grasses [49]. Due to its high abundance in roots, it is presumably a key player for plant health.
In general, more OTUs were found in total and relative numbers in the core bacterial communities (shared across all seasons, high vs. low LUI) of the rhizosphere compared to roots, which seems reasonable, as there is no obstacle to overcome like passing the cell wall of the plant. Interestingly, the most prominent genus found in root core bacterial communities (Pseudomonas) was not as ubiquitously found in the rhizosphere core under both LUIs. This might be due to higher competition and the strong adaptation of Pseudomonas spp. to the specific conditions present in the root interior. The majority of genera found in the rhizospheric cores (high and low LUI) were Rhodoplanes, Methylibium, Kaistobacter and Bradyrhizobium, which were frequently isolated from other rhizosphere environments [50,51,52,53]. Among those, Bradyrhizobium is the only one that was also found in the root core bacterial communities under both LUIs, highlighting its importance for the plant. While representatives of Rhodoplanes have been characterized as a facultative photo-organothroph and potentially nitrate-fixing bacteria [54,55], Methylibium was described as a facultative methylotroph that actively utilizes root exudates [51]. Furthermore, species within the latter are involved in the degradation of aromatic hydrocarbon and methyl tert-butyl ether [50]. Members of Kaistobacter have also been reported to be involved in the degradation of aromatic compounds and suggested to suppress bacterial wilt disease [56].

4.3. Microbial Variation of Core OTUs as Influenced by LUI

In addition to the LUI-independent plant-associated core bacterial community composition (shared throughout all seasons and both LUIs), we also found taxa that were only present in the core under high or low LUI (shared throughout all seasons, but only on high or low LUI). In roots, the OTU assigned to Caulobacter was present exclusively in all samples from low LUI sites, constituting part of the core bacterial communities in roots. Microbes within this genus were reported to produce IAA and solubilize inorganic phosphate [57]. A study on bacterial communities in different grapevine cultivars showed higher abundance of Caulobacter under organic production versus integrated pest management [58], which would be in line with our findings of Caulobacter under low management intensity. In turn, a single OTU assigned to Labrys was found exclusively in the core of sites subjected to high LUI (shared throughout all seasons on high LUI). Species within this genus are frequently isolated from various soil and sediment samples but were also found in the rhizosphere of Korean ginseng [59,60,61], and as an endophyte in Clerodendrum colebrookianum [62]. Though no strain within this genus has been described in the context of plant growth-promoting traits, numerous species of Labrys isolated from sediment and soil were shown to possess the ability to reduce nitrate, assimilate various amino acids and sugars, have catalase activity etc. [59,60], which might also play an important role in supporting the plant under a high amount of available nitrate. Agrobacterium (e.g., Agrobacterium tumefaciens) is widely known for its ability to transmit plasmid T-DNA into plant cells [3]. Furthermore, several Agrobacterium species carry pathogenic capacity on Ti (tumorigenic) or Ri (rhizogenic) plasmids, which can cause the induction of tumor-like growth and reduce seed production, e.g., crown-gall or hairy root disease [63]. On the other hand, various nonpathogenic Agrobacterium spp. have been found lacking those plasmids [64]. Indeed, numerous Agrobacterium spp. appeared to contribute to plant growth by phosphate solubilization, nitrogen fixation and siderophore production [65].
We found several differences in the composition of core bacterial communities in the rhizosphere between high and low LUI, e.g., species within Variovorax were only found in the core of low LUI (shared throughout all seasons). Variovorax paradoxus is frequently described as the plant-growth promoting genus, including traits like the reduction of plant stress, increasing nutrient availability and inhibiting growth of pathogens by degrading N-acyl homoserine-lactones. The latter constitute mechanisms related to their catabolic capacities [65,66,67], which are likely critical to satisfy the metabolic expenses of the plant as they are found in the core microbiome of low LUI. Furthermore, Sphingomonas wittichii and Bosea genosp were only found in the low LUI core (shared throughout all seasons). Numerous studies showed their plant-growth promoting abilities due to their production of phytohormones [68,69]. Moreover, other species found only in the low LUI core within the genera Sphingomonas and Bosea were shown to be diazotrophic, solubilize inorganic phosphorus and are involved in biocontrol [70]. Asticcacaulis biprosthecium has recently been found in the rhizosphere of maize, however, their plant-growth promoting abilities have not been further described [71].
Genera exclusively found under high LUI, but shared throughout all sampling seasons were Rhizobium, Mycoplana, Labrys, Adhaeribacter, Paucibacter and Microlunatus, all of which have been described to harbor plant-growth promoting functions and thus enhancing plant performance [72,73,74,75,76,77].
OTUs found in the rhizosphere and bulk samples differed as expected, but all taxa that were detected in the bulk soil core bacterial communities were also found in the rhizosphere core under both LUIs. Differences in the core of bulk soil and the rhizosphere may be due to the selective attraction of taxa by the plant. Interestingly, LUI influenced the proportion of OTUs that contributed to the uniquely found OTUs (shared among all sampling seasons, but only on high or low LUI) and on the number of taxa in the rhizosphere (total OTUs found throughout all seasons), as OTUs were assigned to more different taxa under high LUI. Though the prevalent taxa specific for one plant stage were comparable in the rhizosphere, the amount and proportion of OTUs contributing to the core were lower under low LUI (156/19.4%) compared to high LUI (235/25.35%). Furthermore, the higher amount of OTUs that were present in the low LUI associated core bacterial communities compared to high LUI indicates a higher variability of bacteria colonizing the rhizosphere. In a low nutrient environment, specific recruitment of microorganisms is crucial to the plant to enhance plant fitness and growth [78]. Thus, a lower amount of similar genera may be found, indicating a more selective attraction of soil bacterial communities under low LUI by plant exudation throughout the season. Furthermore, the observation that seven OTUs were present in root samples and 124 in rhizosphere samples independent of LUI and sampling timepoints imply that these taxa are highly persistent and ubiquitous in agricultural soil.

5. Conclusions

During the last years, several studies investigated the influence of land management on plant-associated bacteria, thereby focusing on single plant development stages or compartments. As frequently occurring plant-associated bacterial assemblages are presumably critical for plant fitness [18], the identification of a plant-associated core bacterial community composition might be the first step of defining a “healthy” bacterial community to unravel the ecology of plant-associated bacterial consortia and predict community responses to environmental changes. Up to date, this is the first study defining the composition of a stable plant-associated core bacterial community composition in the rhizosphere and endosphere as well as its dependency on LUI for a plant species of agricultural importance. We found the genera Pseudomonas, Rhizobium and Bradyrhizobium to be part of the consistent root core plant-associated bacteria of D. glomerata independent of LUI and stable along the season. The majority of genera identified as the core bacterial communities of the rhizosphere compartment belonged to Rhodoplanes, Methylibium, Kaistobacter and Bradyrhizobium. Their persistent occurrence independent of LUI or the growth stage as well as their plant-growth promoting traits supporting plant health could be a first insight into the composition of a life-supporting essential part of the plant microbiome. Nevertheless, we could not infer from the measured co-occurrence of plant-associated bacterial communities across different LUI how the detected species react and interact with their host plants, although many of the identified taxa have been associated with plant growth promoting traits in previous studies [79]. In this context, also the co-occurrence of fungi and bacteria especially in the plants’ rhizosphere compartment should be assessed to account for the presence and contribution of fungi in plant-associated microbiomes.
A higher compositional variation throughout different sampling dates was observed under low LUI compared to high LUI, suggesting a stronger adaption of plant-associated bacteria under low LUI. Taking the minimum cut-off of 0.001% (i.e., required number of reads for one OTU to be kept was 103) after cut-off into account, these results were significant.
Taking the functions associated to the detected bacterial species into account, we could speculate that the major functionality of the plant-associated core bacterial community might be linked in particular to the plant growth and stress response. However, to obtain deeper insights into the functionality of a “healthy” core bacterial microbiome and its resilience to disturbances, it is of importance to further analyze the functional traits of the identified microbial communities to reveal their functional potential. This will gain deeper knowledge on core plant-associated bacteria of a healthy versus a diseased state of the plant and the predictability of the fitness state of the plant to improve plant performance in agricultural production systems. Though our study revealed the existence of shared plant-associated bacterial taxa under different land use intensities, these findings were specific for D. glomerata in the investigated grassland soils. Thus, it would be tempting to assess also bacterial communities associated with other D. glomerata cultivars or to study broader biogeographical patterns of the root associated microbiome of D. glomerata or other grass species of Poaceae.

Supplementary Materials

The following materials are available online at https://www.mdpi.com/1424-2818/12/10/392/s1, Figure S1: Rarefaction curves, Table S1: Summary of sampling plot parameters, Table S2: Summary of edaphic parameters, Table S3: The impact of LUI on the β-diversity within one sampling season in all compartments (between sample diversity), Table S4: The impact of sampling season on the β-diversity within one LUI in all compartments (between sample diversity), Table S5: Relative abundance of assigned phyla, Table S6: Relative abundance of assigned genera, Table S7: Classification of core OTUs in roots and high LUI. Shared core OTUs (May, June and October) high LUI: 12, Table S8: Classification of core OTUs in roots and low LUI. Shared core OTUs (May, June and October) low LUI: 14, Table S9: Classification of shared core OTUs that were found in 95% in high LUI samples across all sampling seasons (rhizosphere), Table S10: Classification of shared core OTUs that were found in 95% in low LUI samples across all sampling seasons (rhizosphere), Table S11: Classification of shared core OTUs that were found in 95% in high LUI samples across all sampling seasons (bulk soil), Table S12: Classification of shared core OTUs that were found in 95% in high LUI samples across all sampling seasons (bulk soil).

Author Contributions

Conceptualization, M.C.R., J.J., P.S. and M.S.; Methodology, J.E. and G.V.; Software, G.V.; Investigation, J.E.; Writing—Original Draft Preparation, J.E. and B.S., Writing—Review and Editing, B.S., S.S., M.C.R., J.J., P.S. and M.S.; Supervision S.S., P.S., M.S., Funding Acquisition, M.S. All authors have read and agreed to the published version of the manuscript.

Funding

This research was (partly) funded by DFG Priority Program 1374, “Infrastructure-Biodiversity-Exploratories”.

Acknowledgments

We thank Ingo Schöning for providing data concerning soil parameters. We thank the managers of the three Exploratories, Kirsten Reichel-Jung, Katrin Lorenzen, Martin Gorke and all former managers for their work in maintaining the plot and project infrastructure; Christiane Fischer for giving support through the central office, Michael Owonibi for managing the central data base, and Markus Fischer, Eduard Linsenmair, Dominik Hessenmöller, Daniel Prati, Ingo Schöning, François Buscot, Ernst-Detlef Schulze, Wolfgang W. Weisser and the late Elisabeth Kalko for their role in setting up the Biodiversity Exploratories project. Field work permits were issued by the responsible state environmental offices of Baden-Württemberg, Thüringen, and Brandenburg.

Conflicts of Interest

The authors declare no conflict of interest. The funders had no role in the design of the study; in the collection, analyses, or interpretation of data; in the writing of the manuscript, or in the decision to publish the results.

References

  1. Martínez-Viveros, O.; Jorquera, M.A.; Crowley, D.E.; Gajardo, G.; Mora, M.L. Mechanisms and practical considerations involved in plant growth promotion by rhizobacteria. J. Soil. Sci. Plant. Nutr. 2010, 10, 293–319. [Google Scholar] [CrossRef] [Green Version]
  2. Berendsen, R.L.; Pieterse, C.M.J.; Bakker, P.A.H.M. The rhizosphere microbiome and plant health. Trends Plant. Sci. 2012, 17, 478–486. [Google Scholar] [CrossRef] [PubMed]
  3. Gaiero, J.; McCall, C.; Thompson, K.; Day, N.; Best, A.; Dunfield, K. Inside the root microbiome: Bacterial root endophytes and plant growth promotion. Am. J. Bot. 2013, 100. [Google Scholar] [CrossRef] [Green Version]
  4. Reinhold-Hurek, B.; Bünger, W.; Burbano, C.S.; Sabale, M.; Hurek, T. Roots shaping their microbiome: Global hotspots for microbial activity. Annu. Rev. Phytopathol. 2015, 53, 403–424. [Google Scholar] [CrossRef] [PubMed]
  5. Turner, T.R.; James, E.K.; Poole, P.S. The plant microbiome. Genome. Biol. 2013, 14, 209. [Google Scholar] [CrossRef] [PubMed] [Green Version]
  6. Lugtenberg, B.; Kamilova, F. Plant-Growth-Promoting Rhizobacteria. Annu. Rev. Microbiol. 2009, 63, 541–556. [Google Scholar] [CrossRef] [PubMed] [Green Version]
  7. Reinhold-Hurek, B.; Hurek, T. Living inside plants: Bacterial endophytes. Curr. Opin. Plant. Biol. 2011, 14, 435–443. [Google Scholar] [CrossRef]
  8. Truyens, S.; Weyens, N.; Cuypers, A.; Vangronsveld, J. Bacterial seed endophytes: Genera, vertical transmission and interaction with plants. Environ. Microbiol. Rep. 2015, 7, 40–50. [Google Scholar] [CrossRef]
  9. Helliwell, J.R.; Sturrock, C.J.; Miller, A.J.; Whalley, W.R.; Mooney, S.J. The role of plant species and soil condition in the structural development of the rhizosphere. Plant. Cell Environ. 2019, 42, 1974–1986. [Google Scholar] [CrossRef]
  10. Kowalchuk, G.A.; Buma, D.S.; de Boer, W.; Klinkhamer, P.G.L.; van Veen, J.A. Effects of above-ground plant species composition and diversity on the diversity of soil-borne microorganisms. Antonie Van Leeuwenhoek 2002, 81, 509. [Google Scholar] [CrossRef] [Green Version]
  11. Compant, S.; Reiter, B.; Sessitsch, A.; Nowak, J.; Clément, C.; Ait Barka, E. Endophytic Colonization of Vitis vinifera L. by Plant Growth-Promoting Bacterium Burkholderia sp. Strain PsJN. Appl. Environ. Microbiol. 2005, 71, 1685–1693. [Google Scholar] [CrossRef] [PubMed] [Green Version]
  12. Tuteja, N.; Sopory, S.K. Chemical signaling under abiotic stress environment in plants. Plant. Signal. Behav. 2008, 3, 525–536. [Google Scholar] [CrossRef] [PubMed] [Green Version]
  13. Ernebjerg, M.; Kishony, R. Distinct Growth Strategies of Soil Bacteria as Revealed by Large-Scale Colony Tracking. Appl. Environ. Microbiol. 2012, 78, 1345–1352. [Google Scholar] [CrossRef] [PubMed] [Green Version]
  14. Tardieu, F. Plant response to environmental conditions: Assessing potential production, water demand, and negative effects of water deficit. Front. Physiol. 2013, 4. [Google Scholar] [CrossRef] [PubMed] [Green Version]
  15. Estendorfer, J.; Stempfhuber, B.; Haury, P.; Vestergaard, G.; Rillig, M.C.; Joshi, J.; Schröder, P.; Schloter, M. The Influence of Land Use Intensity on the Plant-Associated Microbiome of Dactylis glomerata L. Front. Plant. Sci. 2017, 8. [Google Scholar] [CrossRef] [PubMed] [Green Version]
  16. Lundberg, D.; Lebeis, S.; Herrera Paredes, S.; Yourstone, S.; Gehring, J.; Malfatti, S.; Tremblay, J.; Engelbrektson, A.; Kunin, V.; Rio, T.; et al. Defining the core Arabidopsis thaliana root microbiome. Nature 2012, 488, 86–90. [Google Scholar] [CrossRef] [Green Version]
  17. Pfeiffer, S.; Mitter, B.; Oswald, A.; Schloter-Hai, B.; Schloter, M.; Declerck, S.; Sessitsch, A. Rhizosphere microbiomes of potato cultivated in the High Andes show stable and dynamic core microbiomes with different responses to plant development. FEMS Microbiol. Ecol. 2017, 93. [Google Scholar] [CrossRef]
  18. Bowen, J.L.; Kearns, P.J.; Byrnes, J.E.K.; Wigginton, S.; Allen, W.J.; Greenwood, M.; Tran, K.; Yu, J.; Cronin, J.T.; Meyerson, L.A. Lineage overwhelms environmental conditions in determining rhizosphere bacterial community structure in a cosmopolitan invasive plant. Nat. Commun. 2017, 8, 433. [Google Scholar] [CrossRef]
  19. Bluthgen, N.; Dormann, C.F.; Prati, D.; Klaus, V.H.; Kleinebecker, T.; Holzel, N.; Alt, F.; Boch, S.; Gockel, S.; Hemp, A.; et al. A quantitative index of land-use intensity in grasslands: Integrating mowing, grazing and fertilization. Basic Appl. Ecol. 2012, 13, 207–220. [Google Scholar] [CrossRef]
  20. Houba, V.J.G.; Temminghoff, E.J.M.; Gaikhorst, G.A.; van Vark, W. Soil analysis procedures using 0.01 M calcium chloride as extraction reagent. Commun. Soil. Sci. Plant. Anal. 2000, 31, 1299–1396. [Google Scholar] [CrossRef]
  21. Lueders, T.; Manefield, M.; Friedrich, M.W. Enhanced sensitivity of DNA- and rRNA-based stable isotope probing by fractionation and quantitative analysis of isopycnic centrifugation gradients. Environ. Microbiol. 2004, 6, 73–78. [Google Scholar] [CrossRef] [PubMed]
  22. Dorn-In, S.; Bassitta, R.; Schwaiger, K.; Bauer, J.; Hölzel, C.S. Specific amplification of bacterial DNA by optimized so-called universal bacterial primers in samples rich of plant DNA. J. Microbiol. Methods 2015, 113, 50–56. [Google Scholar] [CrossRef] [PubMed]
  23. Caporaso, J.G.; Kuczynski, J.; Stombaugh, J.; Bittinger, K.; Bushman, F.D.; Costello, E.K.; Fierer, N.; Peña, A.G.; Goodrich, J.K.; Gordon, J.I.; et al. QIIME allows analysis of high-throughput community sequencing data. Nat. Methods 2010, 7, 335–336. [Google Scholar] [CrossRef] [PubMed] [Green Version]
  24. Schubert, M.; Lindgreen, S.; Orlando, L. AdapterRemoval v2: Rapid adapter trimming, identification, and read merging. BMC Res. Notes 2016, 9, 88. [Google Scholar] [CrossRef] [PubMed] [Green Version]
  25. Schmieder, R.; Edwards, R. Fast identification and removal of sequence contamination from genomic and metagenomic datasets. PLoS ONE 2011, 6, e17288. [Google Scholar] [CrossRef] [PubMed] [Green Version]
  26. DeSantis, T.Z.; Hugenholtz, P.; Larsen, N.; Rojas, M.; Brodie, E.L.; Keller, K.; Huber, T.; Dalevi, D.; Hu, P.; Andersen, G.L. Greengenes, a chimera-checked 16S rRNA gene database and workbench compatible with ARB. Appl. Environ. Microbiol. 2006, 72, 5069–5072. [Google Scholar] [CrossRef] [PubMed] [Green Version]
  27. Wang, Q.; Garrity, G.M.; Tiedje, J.M.; Cole, J.R. Naïve Bayesian Classifier for Rapid Assignment of rRNA Sequences into the New Bacterial Taxonomy. Appl. Environ. Microbiol. 2007, 73, 5261–5267. [Google Scholar] [CrossRef] [Green Version]
  28. Chao, A. Nonparametric Estimation of the Number of Classes in a Population. Scand. Stat. Theory Appl. 1984, 11, 265–270. [Google Scholar]
  29. Southwood, T.R.E.; Henderson, P.A. Ecological Methods, 3rd ed.; Blackwell Science Ltd.: Hoboken, NJ, USA, 2000; p. 592. [Google Scholar]
  30. Lozupone, C.A.; Hamady, M.; Kelley, S.T.; Knight, R. Quantitative and Qualitative β Diversity Measures Lead to Different Insights into Factors That Structure Microbial Communities. Appl. Environ. Microbiol. 2007, 73, 1576–1585. [Google Scholar] [CrossRef] [Green Version]
  31. Oksanen, F.J.; Blanchet, F.G.; Friendly, M.; Kindt, R.; Legendre, P.; McGlinn, D.; Minchin, P.; O’Hara, R.B.; Simpson, G.; Solymos, P.; et al. Vegan: Community Ecology Package. Available online: https://cran.r-project.org/src/contrib/Archive/vegan/ (accessed on 10 August 2017).
  32. Calculate and Draw Custom Venn Diagrams. Available online: http://bioinformatics.psb.ugent.be/webtools/Venn/ (accessed on 15 January 2018).
  33. Garbeva, P.; van Elsas, J.D.; van Veen, J.A. Rhizosphere microbial community and its response to plant species and soil history. Plant. Soil. 2008, 302, 19–32. [Google Scholar] [CrossRef] [Green Version]
  34. Bevivino, A.; Paganin, P.; Bacci, G.; Florio, A.; Pellicer, M.S.; Papaleo, M.C.; Mengoni, A.; Ledda, L.; Fani, R.; Benedetti, A.; et al. Soil bacterial community response to differences in agricultural management along with seasonal changes in a Mediterranean region. PLoS ONE 2014, 9, e105515. [Google Scholar] [CrossRef] [PubMed] [Green Version]
  35. Grayston, S.J.; Wang, S.; Campbell, C.D.; Edwards, A.C. Selective influence of plant species on microbial diversity in the rhizosphere. Soil. Biol. Biochem. 1998, 30, 369–378. [Google Scholar] [CrossRef]
  36. Gottel, N.R.; Castro, H.F.; Kerley, M.; Yang, Z.; Pelletier, D.A.; Podar, M.; Karpinets, T.; Uberbacher, E.; Tuskan, G.A.; Vilgalys, R.; et al. Distinct microbial communities within the endosphere and rhizosphere of Populus deltoides roots across contrasting soil types. Appl. Environ. Microbiol. 2011, 77, 5934–5944. [Google Scholar] [CrossRef] [PubMed] [Green Version]
  37. Munier-Jolain, N.; Salon, C. Are the carbon costs of seed production related to the quantitative and qualitative performance? An appraisal of legumes and other crops. Plant. Cell Environ. 2005, 28, 1388–1395. [Google Scholar] [CrossRef]
  38. Berg, G.; Grube, M.; Schloter, M.; Smalla, K. Unraveling the plant microbiome: Looking back and future perspectives. Front. Microbiol. 2014, 5. [Google Scholar] [CrossRef] [Green Version]
  39. Lareen, A.; Burton, F.; Schäfer, P. Plant root-microbe communication in shaping root microbiomes. Plant. Mol. Biol. 2016, 90, 575–587. [Google Scholar] [CrossRef] [Green Version]
  40. Montes, C.; Altimira, F.; Canchignia, H.; Castro, Á.; Sánchez, E.; Miccono, M.; Tapia, E.; Sequeida, Á.; Valdés, J.; Tapia, P.; et al. A draft genome sequence of Pseudomonas veronii R4: A grapevine (Vitis vinifera L.) root-associated strain with high biocontrol potential. Stand. Genom. Sci. 2016, 11, 76. [Google Scholar] [CrossRef]
  41. Perrot-Rechenmann, C. Cellular responses to auxin: Division versus expansion. Cold Spring Harb. Perspect. Biol. 2010, 2, a001446. [Google Scholar] [CrossRef]
  42. Canchignia, H.; Altimira, F.; Montes, C.; Sánchez, E.; Tapia, E.; Miccono, M.; Espinoza, D.; Aguirre, C.; Seeger, M.; Prieto, H. Candidate nematicidal proteins in a new Pseudomonas veronii isolate identified by its antagonistic properties against Xiphinema index. J. Gen. Appl. Microbiol. 2017, 63, 11–21. [Google Scholar] [CrossRef] [Green Version]
  43. Viketoft, M.; Palmborg, C.; Sohlenius, B.; Huss-Danell, K.; Bengtsson, J. Plant species effects on soil nematode communities in experimental grasslands. Appl. Soil Ecol. 2005, 30, 90–103. [Google Scholar] [CrossRef]
  44. Oteino, N.; Lally, R.D.; Kiwanuka, S.; Lloyd, A.; Ryan, D.; Germaine, K.J.; Dowling, D.N. Plant growth promotion induced by phosphate solubilizing endophytic Pseudomonas isolates. Front. Microbiol. 2015, 6, 745. [Google Scholar] [CrossRef] [PubMed] [Green Version]
  45. Lodwig, E.M.; Hosie, A.H.F.; Bourdès, A.; Findlay, K.; Allaway, D.; Karunakaran, R.; Downie, J.A.; Poole, P.S. Amino-acid cycling drives nitrogen fixation in the legume–Rhizobium symbiosis. Nature 2003, 422, 722–726. [Google Scholar] [CrossRef] [PubMed]
  46. Fujita, H.; Aoki, S.; Kawaguchi, M. Evolutionary Dynamics of Nitrogen Fixation in the Legume–Rhizobia Symbiosis. PLoS ONE 2014, 9, e93670. [Google Scholar] [CrossRef]
  47. Chi, F.; Shen, S.-H.; Cheng, H.-P.; Jing, Y.-X.; Yanni, Y.G.; Dazzo, F.B. Ascending migration of endophytic rhizobia, from roots to leaves, inside rice plants and assessment of benefits to rice growth physiology. Appl. Environ. Microbiol. 2005, 71, 7271–7278. [Google Scholar] [CrossRef] [PubMed] [Green Version]
  48. Egamberdieva, D.; Wirth, S.J.; Alqarawi, A.A.; Abd_Allah, E.F.; Hashem, A. Phytohormones and Beneficial Microbes: Essential Components for Plants to Balance Stress and Fitness. Front. Microbiol. 2017, 8. [Google Scholar] [CrossRef] [PubMed]
  49. Fischer, D.; Pfitzner, B.; Schmid, M.; Simões-Araújo, J.L.; Reis, V.M.; Pereira, W.; Ormeño-Orrillo, E.; Hai, B.; Hofmann, A.; Schloter, M.; et al. Molecular characterisation of the diazotrophic bacterial community in uninoculated and inoculated field-grown sugarcane (Saccharum sp.). Plant. Soil 2012, 356, 83–99. [Google Scholar] [CrossRef]
  50. Nakatsu, C.H.; Hristova, K.; Hanada, S.; Meng, X.-Y.; Hanson, J.R.; Scow, K.M.; Kamagata, Y. Methylibium petroleiphilum gen. nov., sp. nov., a novel methyl tert-butyl ether-degrading methylotroph of the Betaproteobacteria. Int. J. Syst. Evol. Microbiol. 2006, 56, 983–989. [Google Scholar] [CrossRef] [Green Version]
  51. Mao, Y.; Li, X.; Smyth, E.M.; Yannarell, A.C.; Mackie, R.I. Enrichment of specific bacterial and eukaryotic microbes in the rhizosphere of switchgrass (Panicum virgatum L.) through root exudates. Environ. Microbiol. Rep. 2014, 6, 293–306. [Google Scholar] [CrossRef]
  52. Rouws, L.; Leite, J.; Feitosa de Matos, G.; Zilli, J.; Reed Rodrigues Coelho, M.; Xavier, G.; Fischer, D.; Hartmann, A.; Reis, V.; Baldani, J. Endophytic Bradyrhizobium spp. isolates from sugarcane obtained through different culture strategies. Environ. Microbiol. Rep. 2013, 6. [Google Scholar] [CrossRef]
  53. Gkarmiri, K.; Mahmood, S.; Ekblad, A.; Alström, S.; Högberg, N.; Finlay, R. Identifying the Active Microbiome Associated with Roots and Rhizosphere Soil of Oilseed Rape. Appl. Environ. Microbiol. 2017, 83, e01938-17. [Google Scholar] [CrossRef] [Green Version]
  54. Hiraishi, A.; Ueda, Y. Rhodoplanes gen. nov., a New Genus of Phototrophic Bacteria Including Rhodopseudomonas rosea as Rhodoplanes roseus comb. nov. and Rhodoplanes elegans sp. nov. Int. J. Syst. Evol. Microbiol. 1994, 44, 665–673. [Google Scholar] [CrossRef] [Green Version]
  55. Buckley, D.H.; Huangyutitham, V.; Hsu, S.-F.; Nelson, T.A. Stable Isotope Probing with 15N2 Reveals Novel Noncultivated Diazotrophs in Soil. Appl. Environ. Microbiol. 2007, 73, 3196–3204. [Google Scholar] [CrossRef] [Green Version]
  56. Liu, X.; Zhang, S.; Jiang, Q.; Bai, Y.; Shen, G.; Li, S.; Ding, W. Using community analysis to explore bacterial indicators for disease suppression of tobacco bacterial wilt. Sci. Rep. 2016, 6, 36773. [Google Scholar] [CrossRef] [PubMed] [Green Version]
  57. Chimwamurombe, P.M.; Grönemeyer, J.L.; Reinhold-Hurek, B. Isolation and characterization of culturable seed-associated bacterial endophytes from gnotobiotically grown Marama bean seedlings. FEMS Microbiol. Ecol. 2016, 92, fiw083. [Google Scholar] [CrossRef] [Green Version]
  58. Campisano, A.; Antonielli, L.; Pancher, M.; Yousaf, S.; Pindo, M.; Pertot, I. Bacterial Endophytic Communities in the Grapevine Depend on Pest Management. PLoS ONE 2014, 9, e112763. [Google Scholar] [CrossRef] [PubMed]
  59. Miller, J.A.; Kalyuzhnaya, M.G.; Noyes, E.; Lara, J.C.; Lidstrom, M.E.; Chistoserdova, L. Labrys methylaminiphilus sp. nov., a novel facultatively methylotrophic bacterium from a freshwater lake sediment. Int. J. Syst. Evol. Microbiol. 2005, 55, 1247–1253. [Google Scholar] [CrossRef] [PubMed] [Green Version]
  60. Carvalho, M.; De Marco, P.; Duque, A.; Pacheco, C.; Janssen, D.; Castro, P. Labrys portucalensis sp. nov., a fluorobenzene-degrading bacterium isolated from an industrially contaminated sediment in northern Portugal. Int. J. Syst. Evol. Microbiol. 2008, 58, 692–698. [Google Scholar] [CrossRef] [Green Version]
  61. Nguyen, N.-L.; Kim, Y.-J.; Hoang, V.-A.; Kang, J.-P.; Wang, C.; Zhang, J.; Kang, C.-H.; Yang, D.-C. Labrys soli sp. nov., isolated from the rhizosphere of ginseng. Int. J. Syst. Evol. Microbiol. 2015, 65, 3913–3919. [Google Scholar] [CrossRef]
  62. Passari, A.K.; Mishra, V.K.; Leo, V.V.; Gupta, V.K.; Singh, B.P. Phytohormone production endowed with antagonistic potential and plant growth promoting abilities of culturable endophytic bacteria isolated from Clerodendrum colebrookianum Walp. Microbiol. Res. 2016, 193, 57–73. [Google Scholar] [CrossRef]
  63. Chihaoui, S.A.; Trabelsi, D.; Jdey, A.; Mhadhbi, H.; Mhamdi, R. Inoculation of Phaseolus vulgaris with the nodule-endophyte Agrobacterium sp. 10C2 affects richness and structure of rhizosphere bacterial communities and enhances nodulation and growth. Arch. Microbiol. 2015, 197, 805–813. [Google Scholar] [CrossRef]
  64. Bosmans, L.; Moerkens, R.; Wittemans, L.; De Mot, R.; Rediers, H.; Lievens, B. Rhizogenic agrobacteria in hydroponic crops: Epidemics, diagnostics and control. Plant. Pathol. 2017, 66, 1043–1053. [Google Scholar] [CrossRef]
  65. Pereira, S.I.; Castro, P.M. Diversity and characterization of culturable bacterial endophytes from Zea mays and their potential as plant growth-promoting agents in metal-degraded soils. Environ. Sci. Pollut. Res. 2014, 21, 14110–14123. [Google Scholar] [CrossRef]
  66. Leadbetter, J.R.; Greenberg, E.P. Metabolism of Acyl-Homoserine Lactone Quorum-Sensing Signals by Variovorax paradoxus. J. Bacteriol. 2000, 182, 6921–6926. [Google Scholar] [CrossRef] [PubMed] [Green Version]
  67. Han, J.-I.; Choi, H.-K.; Lee, S.-W.; Orwin, P.M.; Kim, J.; LaRoe, S.L.; Kim, T.-g.; O’Neil, J.; Leadbetter, J.R.; Lee, S.Y.; et al. Complete Genome Sequence of the Metabolically Versatile Plant Growth-Promoting Endophyte Variovorax paradoxus S110. J. Bacteriol. 2011, 193, 1183–1190. [Google Scholar] [CrossRef] [PubMed] [Green Version]
  68. Shen, S.Y.; Fulthorpe, R. Seasonal variation of bacterial endophytes in urban trees. Front. Microbiol. 2015, 6, 427. [Google Scholar] [CrossRef]
  69. Khan, A.L.; Waqas, M.; Asaf, S.; Kamran, M.; Shahzad, R.; Bilal, S.; Khan, M.A.; Kang, S.-M.; Kim, Y.-H.; Yun, B.-W.; et al. Plant growth-promoting endophyte Sphingomonas sp. LK11 alleviates salinity stress in Solanum pimpinellifolium. Environ. Exp. Bot. 2017, 133, 58–69. [Google Scholar] [CrossRef]
  70. Correa-Galeote, D.; Bedmar, E.J.; Arone, G.J. Maize Endophytic Bacterial Diversity as Affected by Soil Cultivation History. Front. Microbiol. 2018, 9. [Google Scholar] [CrossRef] [PubMed]
  71. Walters, W.A.; Jin, Z.; Youngblut, N.; Wallace, J.G.; Sutter, J.; Zhang, W.; González-Peña, A.; Peiffer, J.; Koren, O.; Shi, Q.; et al. Large-scale replicated field study of maize rhizosphere identifies heritable microbes. Proc. Natl. Acad. Sci. USA 2018, 115, 7368–7373. [Google Scholar] [CrossRef] [Green Version]
  72. Dohrmann, A.; Küting, M.; Jünemann, S.; Jaenicke, S.; Schlueter, A.; Tebbe, C. Importance of rare taxa for bacterial diversity in the rhizosphere of Bt-and conventional maize varieties. ISME J. 2012, 7. [Google Scholar] [CrossRef]
  73. Egamberdiyeva, D.; Höflich, G. Influence of growth-promoting bacteria on the growth of wheat in different soils and temperatures. Soil. Biol. Biochem. 2003, 35, 973–978. [Google Scholar] [CrossRef]
  74. Fernández-González, A.J.; Martínez-Hidalgo, P.; Cobo-Díaz, J.F.; Villadas, P.J.; Martínez-Molina, E.; Toro, N.; Tringe, S.G.; Fernández-López, M. The rhizosphere microbiome of burned holm-oak: Potential role of the genus Arthrobacter in the recovery of burned soils. Sci. Rep. 2017, 7, 6008. [Google Scholar] [CrossRef] [PubMed]
  75. Madigan, M.; Cox, S.S.; Stegeman, R.A. Nitrogen fixation and nitrogenase activities in members of the family Rhodospirillaceae. J. Bacteriol. 1984, 157, 73–78. [Google Scholar] [CrossRef] [Green Version]
  76. Laranjo, M.; Alexandre, A.; Oliveira, S. Legume growth-promoting rhizobia: An overview on the Mesorhizobium genus. Microbiol. Res. 2014, 169, 2–17. [Google Scholar] [CrossRef] [PubMed]
  77. Hardoim, P.R.; van Overbeek, L.S.; Berg, G.; Pirttilä, A.M.; Compant, S.; Campisano, A.; Döring, M.; Sessitsch, A. The Hidden World within Plants: Ecological and Evolutionary Considerations for Defining Functioning of Microbial Endophytes. Microbiol. Mol. Biol. Rev. MMBR 2015, 79, 293–320. [Google Scholar] [CrossRef] [PubMed] [Green Version]
  78. Dreccer, M.F.; Chapman, S.C.; Rattey, A.R.; Neal, J.; Song, Y.; Christopher, J.J.; Reynolds, M. Developmental and growth controls of tillering and water-soluble carbohydrate accumulation in contrasting wheat (Triticum aestivum L.) genotypes: Can we dissect them? J. Exp. Bot. 2013, 64, 143–160. [Google Scholar] [CrossRef] [Green Version]
  79. Fitzpatrick, C.R.; Salas-González, I.; Conway, J.M.; Finkel, O.M.; Gilbert, S.; Russ, D.; Pereira Lima Teixeira, P.J.; Dangl, J.L. The Plant Microbiome: From Ecology to Reduction and Beyond. Annu. Rev. Microbiol. 2020, 74, 81–100. [Google Scholar] [CrossRef]
Figure 1. α-diversity measures chao1 species richness and Shannon index of all compartments under low and high land use intensity, respectively. The distribution is shown at 97% sequence similarity. The boxplot indicates the first and third quartile. The median is indicated as a horizontal line and whiskers indicate minimum or maximum, respectively. Significant differences among land use intensities are indicated with an asterisk, circles reflect outlier values (t-test, p < 0.05).
Diversity 12 00392 g001
Figure 2. Shared operational taxonomic units (OTUs) between the different sampling seasons May, June and October for both land use intensities (LUIs). Green depicts root samples (a), red depicts rhizosphere samples (b) and blue depicts bulk soil samples (c). The percentages are based on the total amount of OTUs that contribute to the diagram.
Diversity 12 00392 g002
Figure 3. Comparison of plant-associated core bacterial communities. The Venn diagrams show the amount of OTUs that contributed to the core bacterial communities that were shared amongst all seasons only under high and low LUI as well as the core OTUs found under both LUIs and all seasons for roots (green, (a)), rhizosphere (red, (b)) and bulk soil (blue, (c)). The stackplots show the comparison of the total relative abundance of the OTUs that contribute to the core bacterial communities in Figure 3a. “High” refers to the abundance of OTUs found under high LUI only (shared amongst all seasons, but only under high LUI), “shared high” refers to the abundance under high LUI of those OTUs that were found under both LUIs (shared amongst all seasons under high as well as low LUI), “shared low” refers to the abundance under low LUI of those OTUs that were found under both LUIs (shared amongst all seasons under high as well as low LUI), abundance of OTUs under low LUI only (shared amongst all seasons, but only under low LUI), colored by genus. OTUs in “Other” could not be classified to the genus level.
Diversity 12 00392 g003

