Seascape Configuration and Fine-Scale Habitat Complexity Shape Parrotfish Distribution and Function across a Coral Reef Lagoon

 , , ,
, , ,
Abstract

1. Introduction
2. Methods
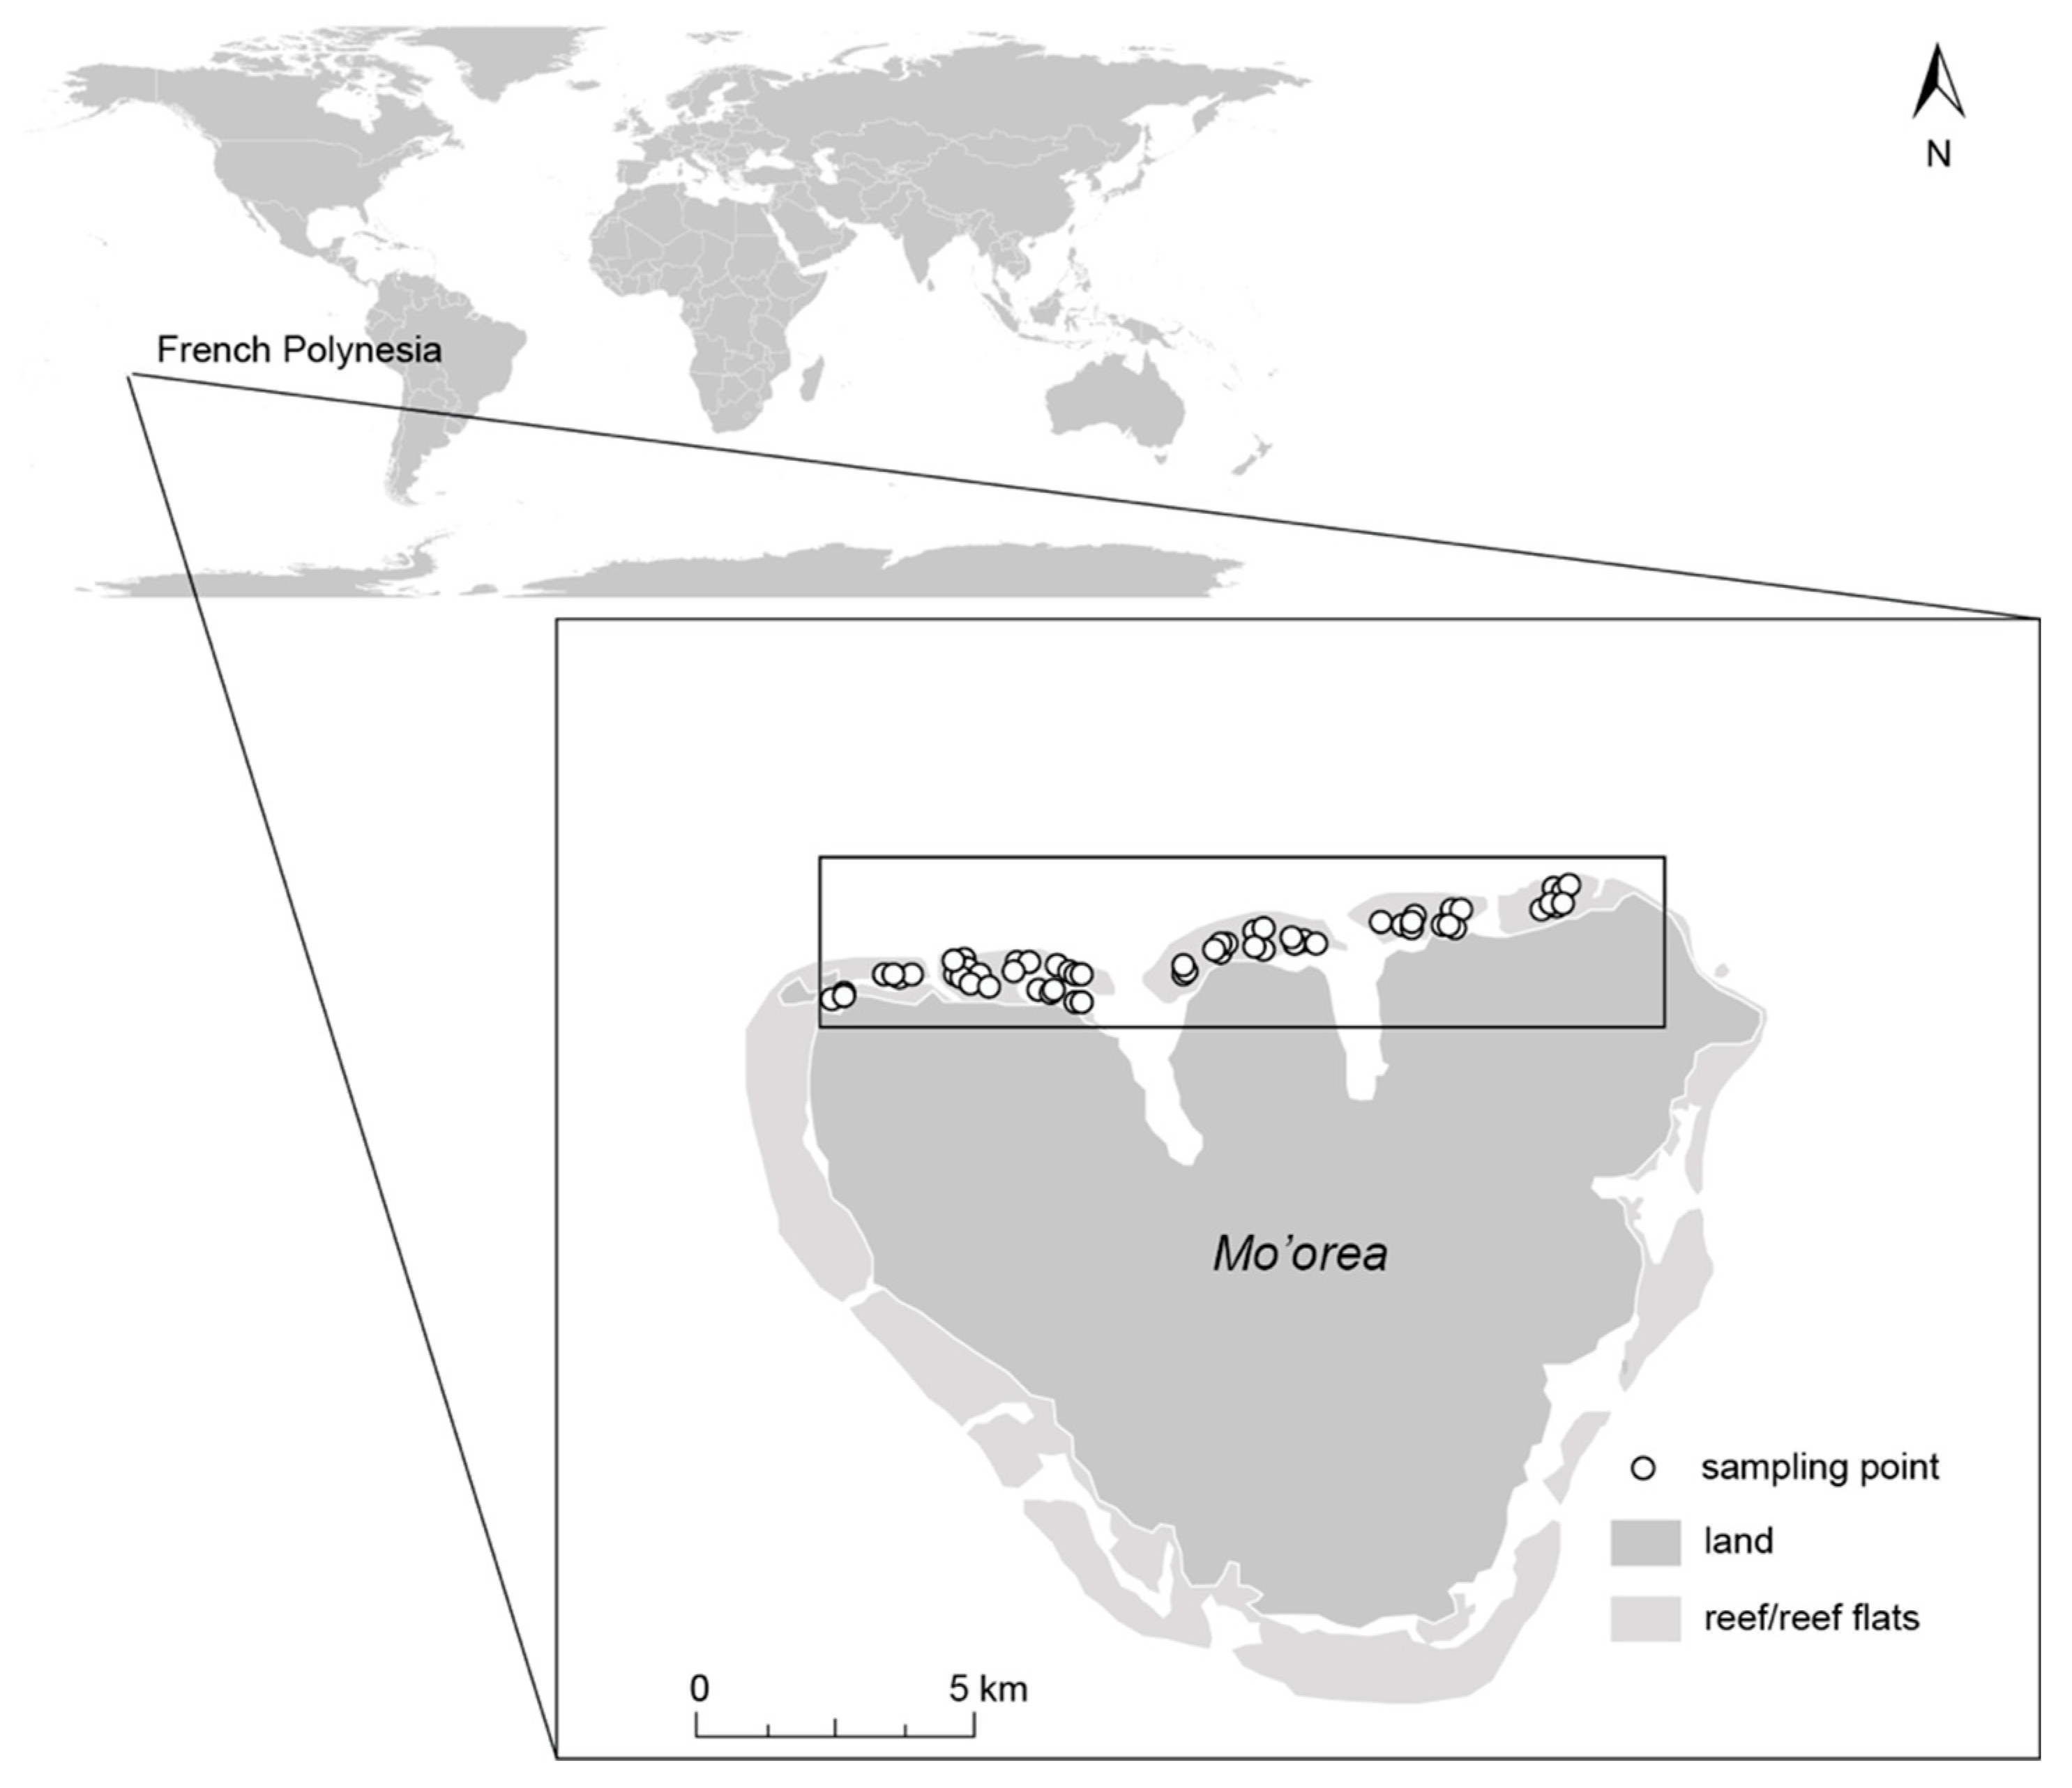
2.1. Study Site
2.2. Survey Design and Data Collection
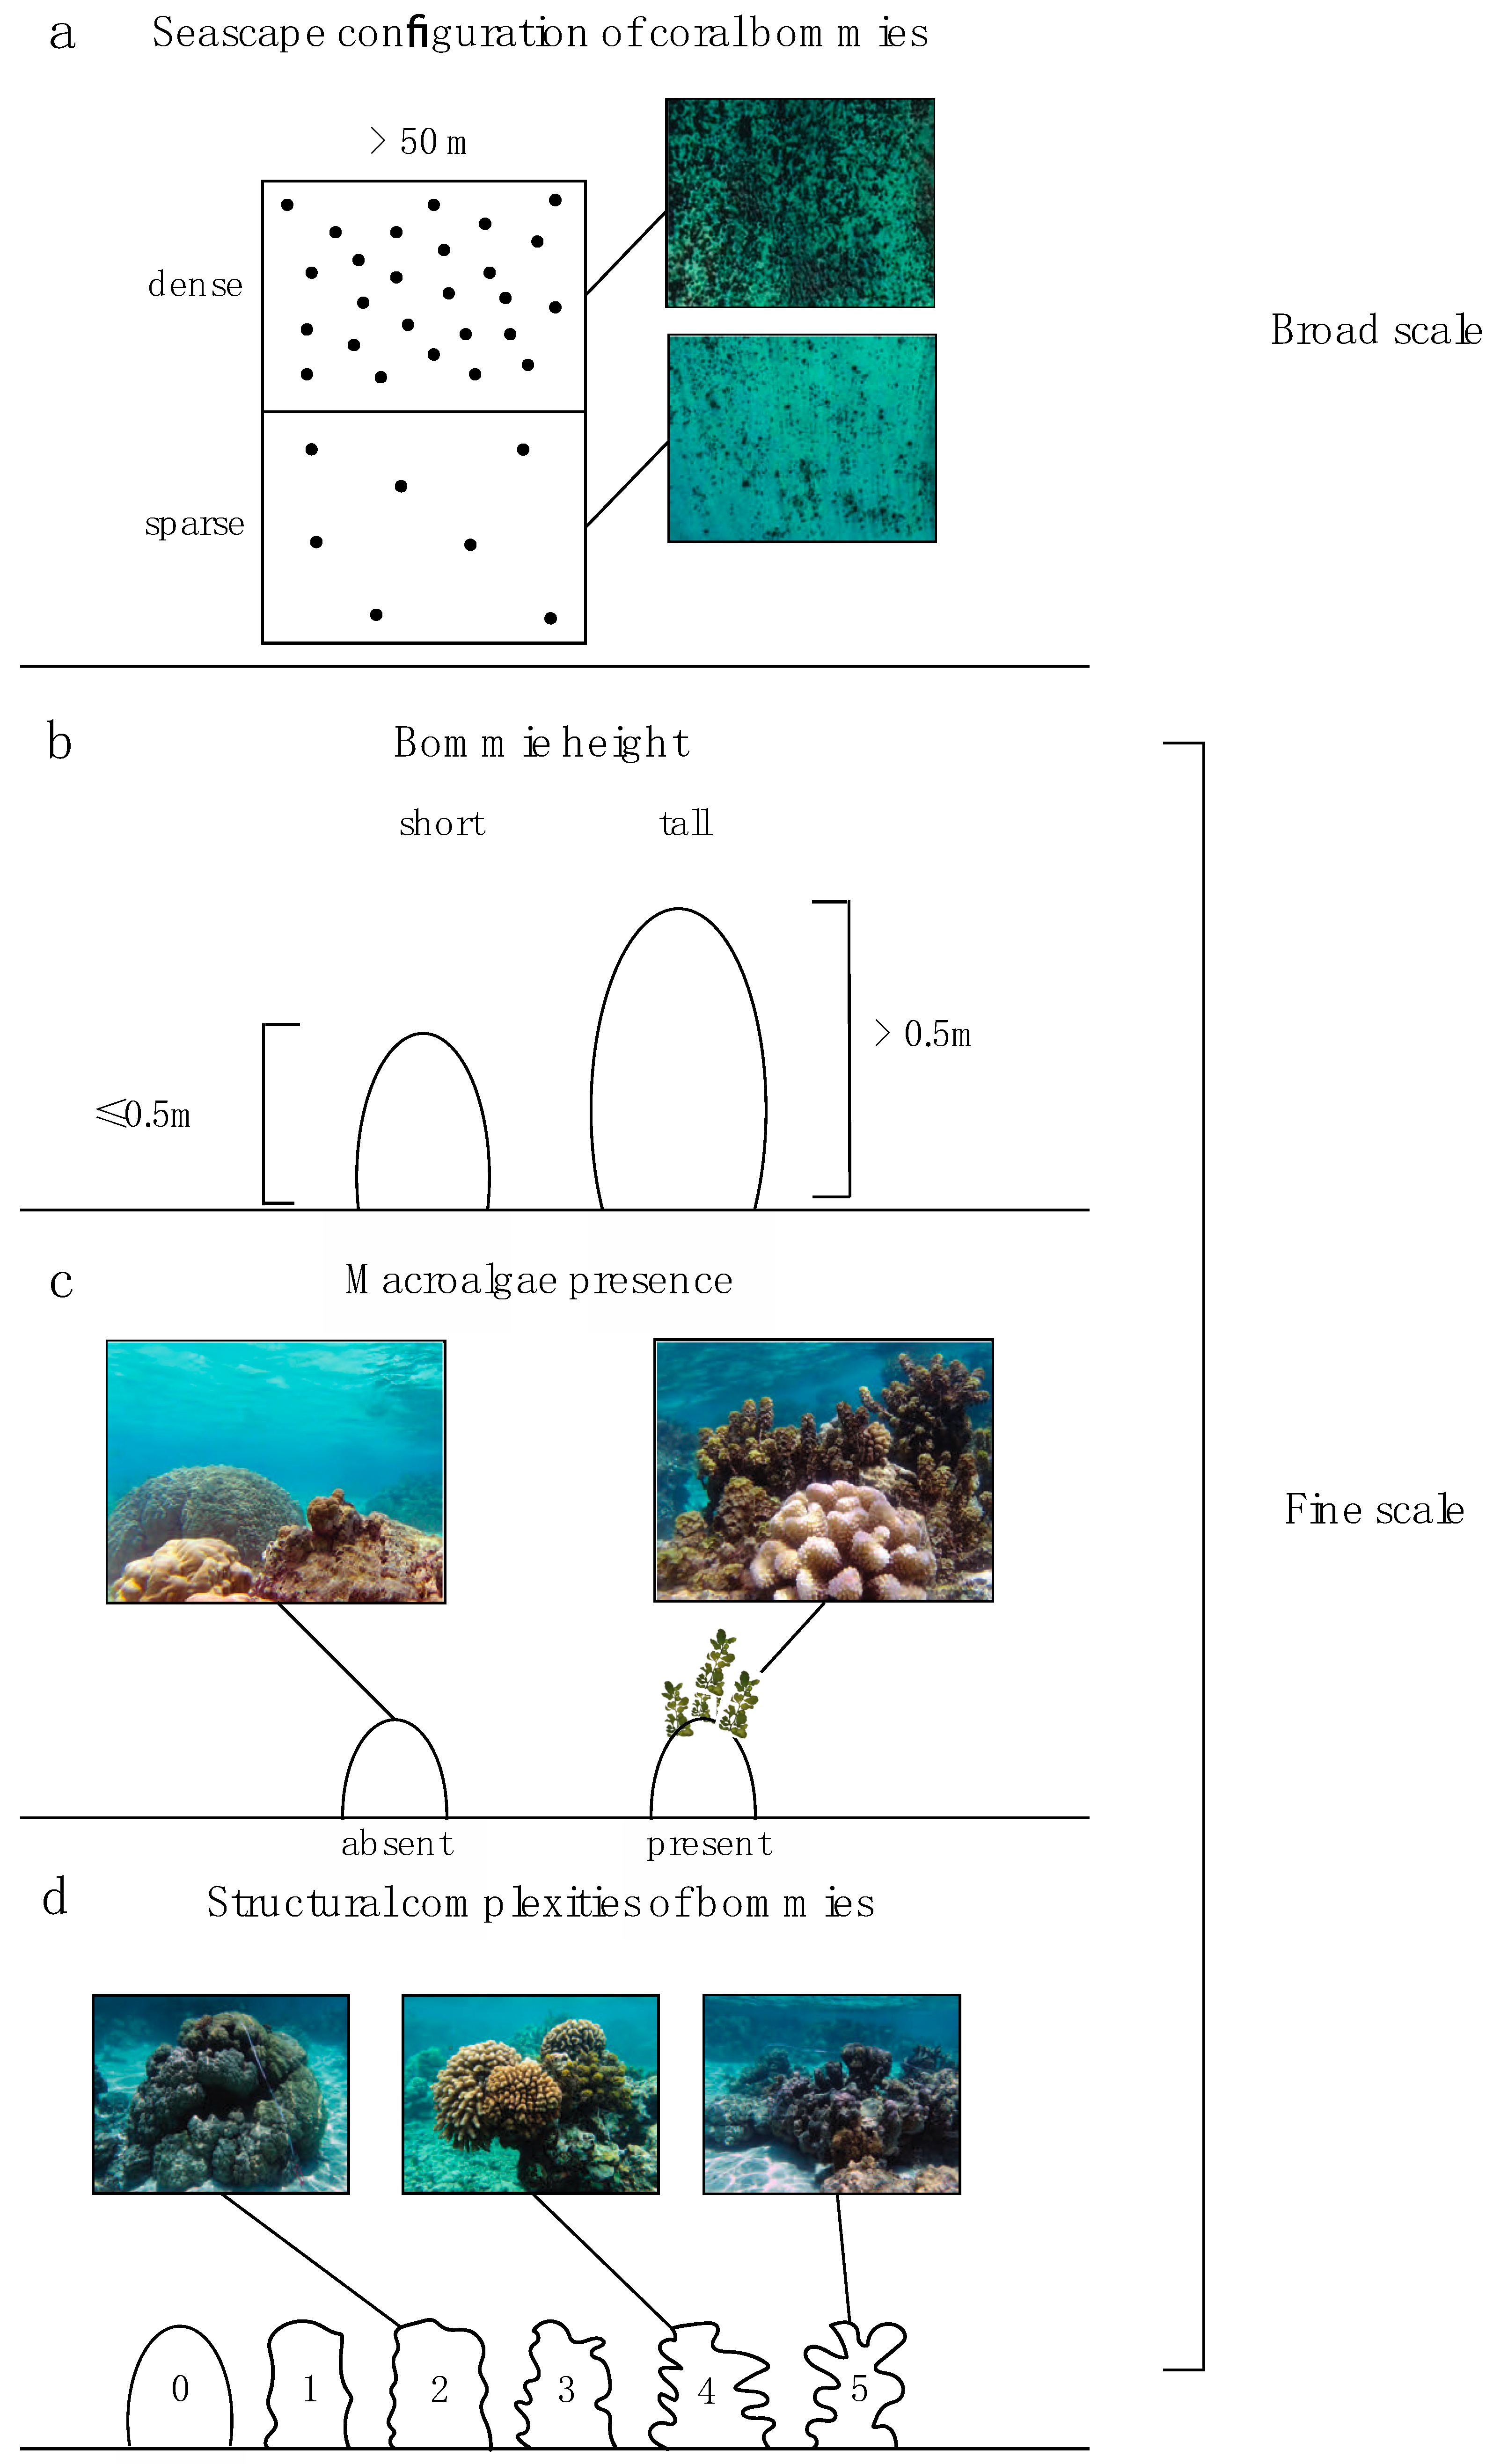
2.2.1. Seascape and Habitat Categorization
2.2.2. Fish and Habitat Surveys
2.2.3. Fish Spatial Movement
2.2.4. Fish Bite Rate
2.3. Statistical Analyses
3. Results
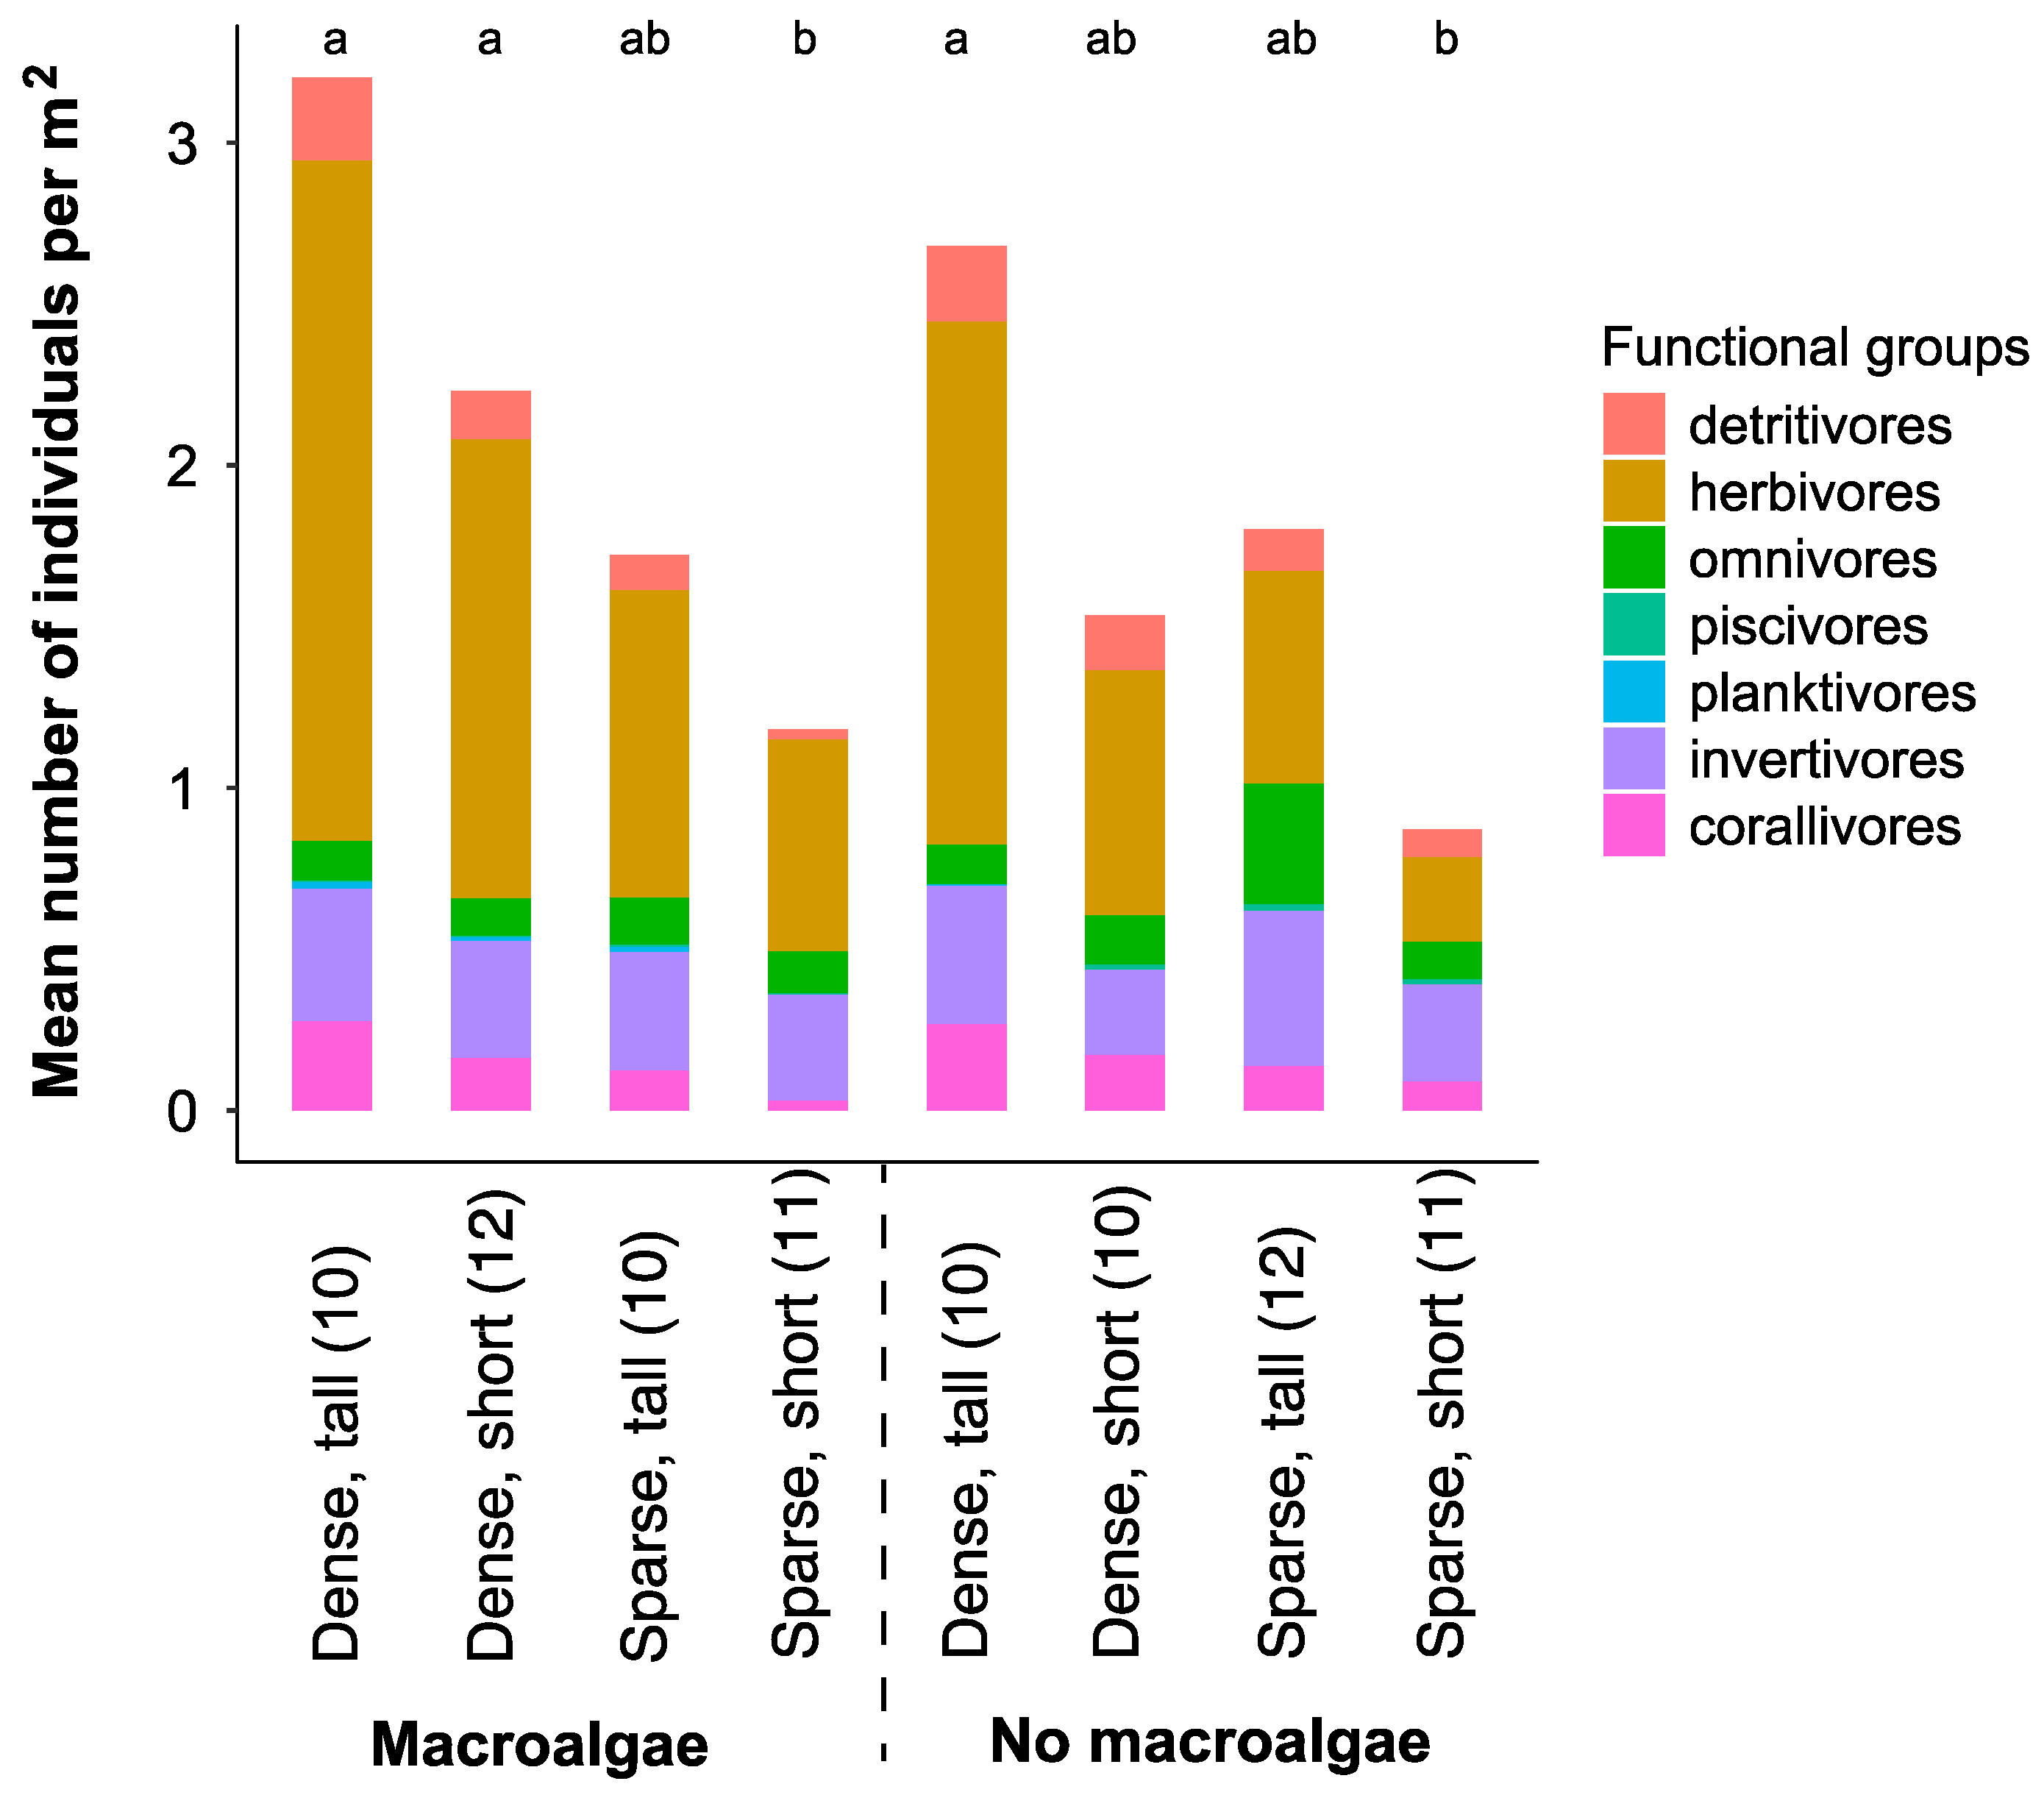
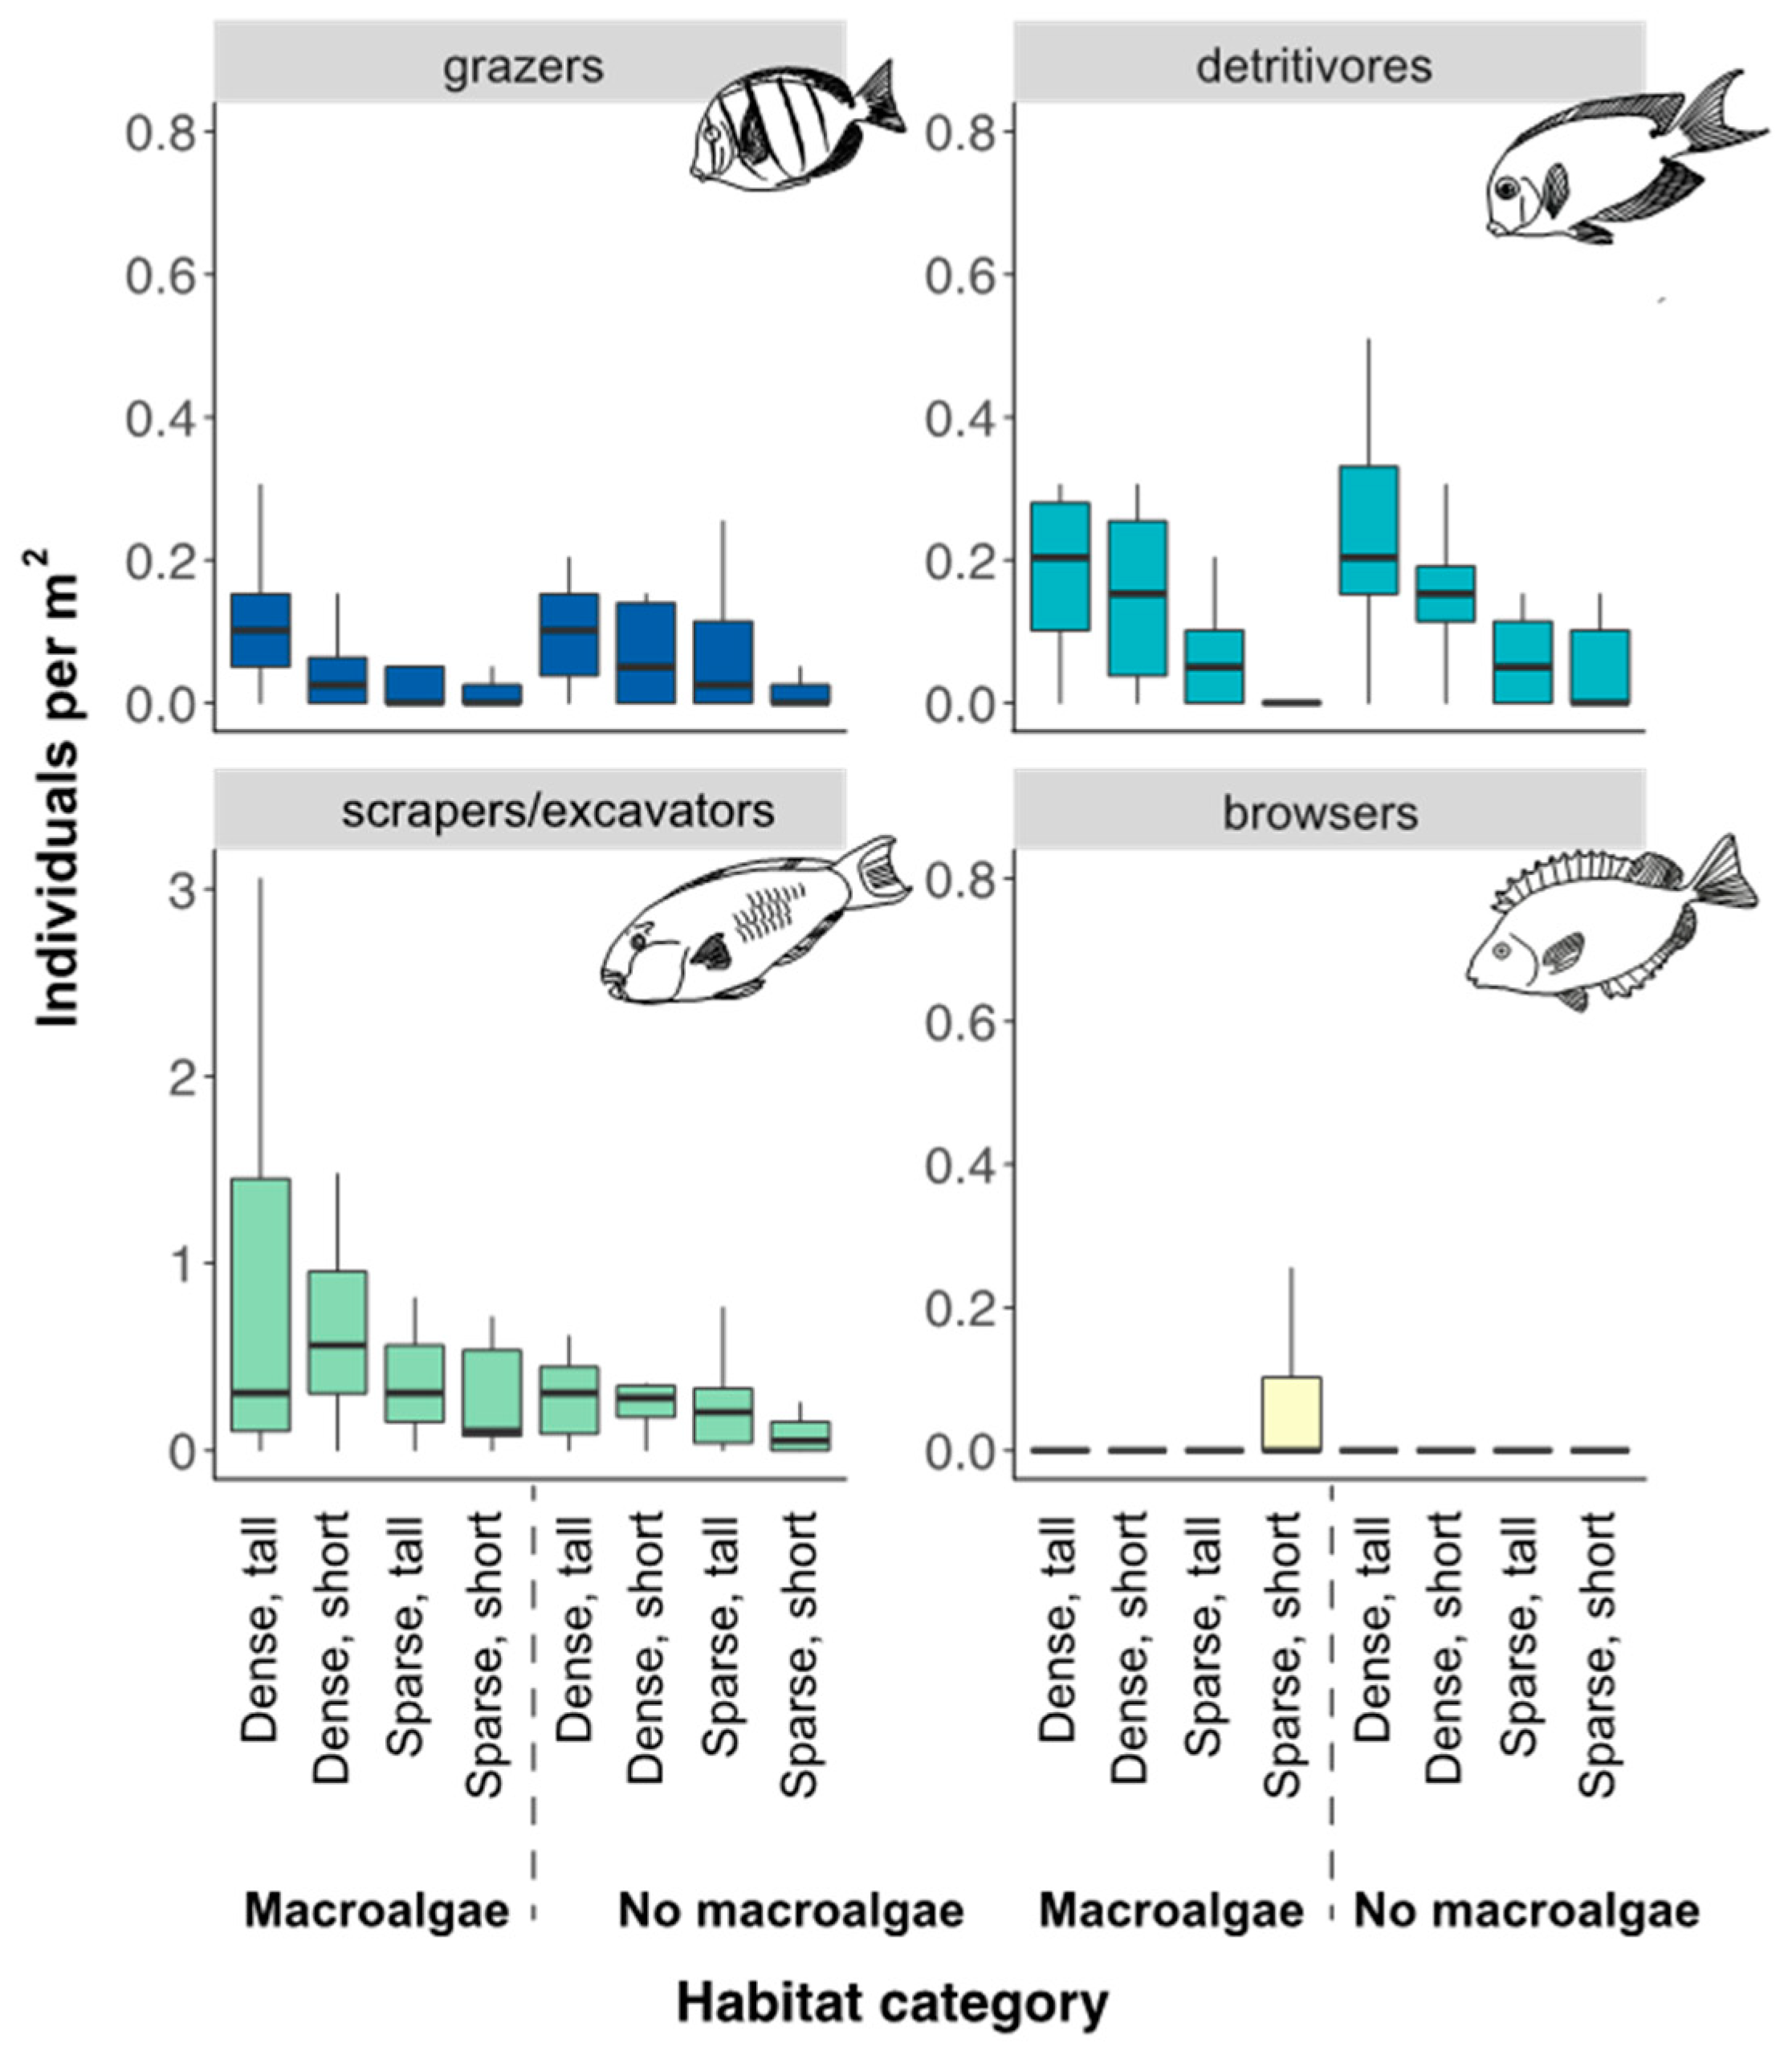
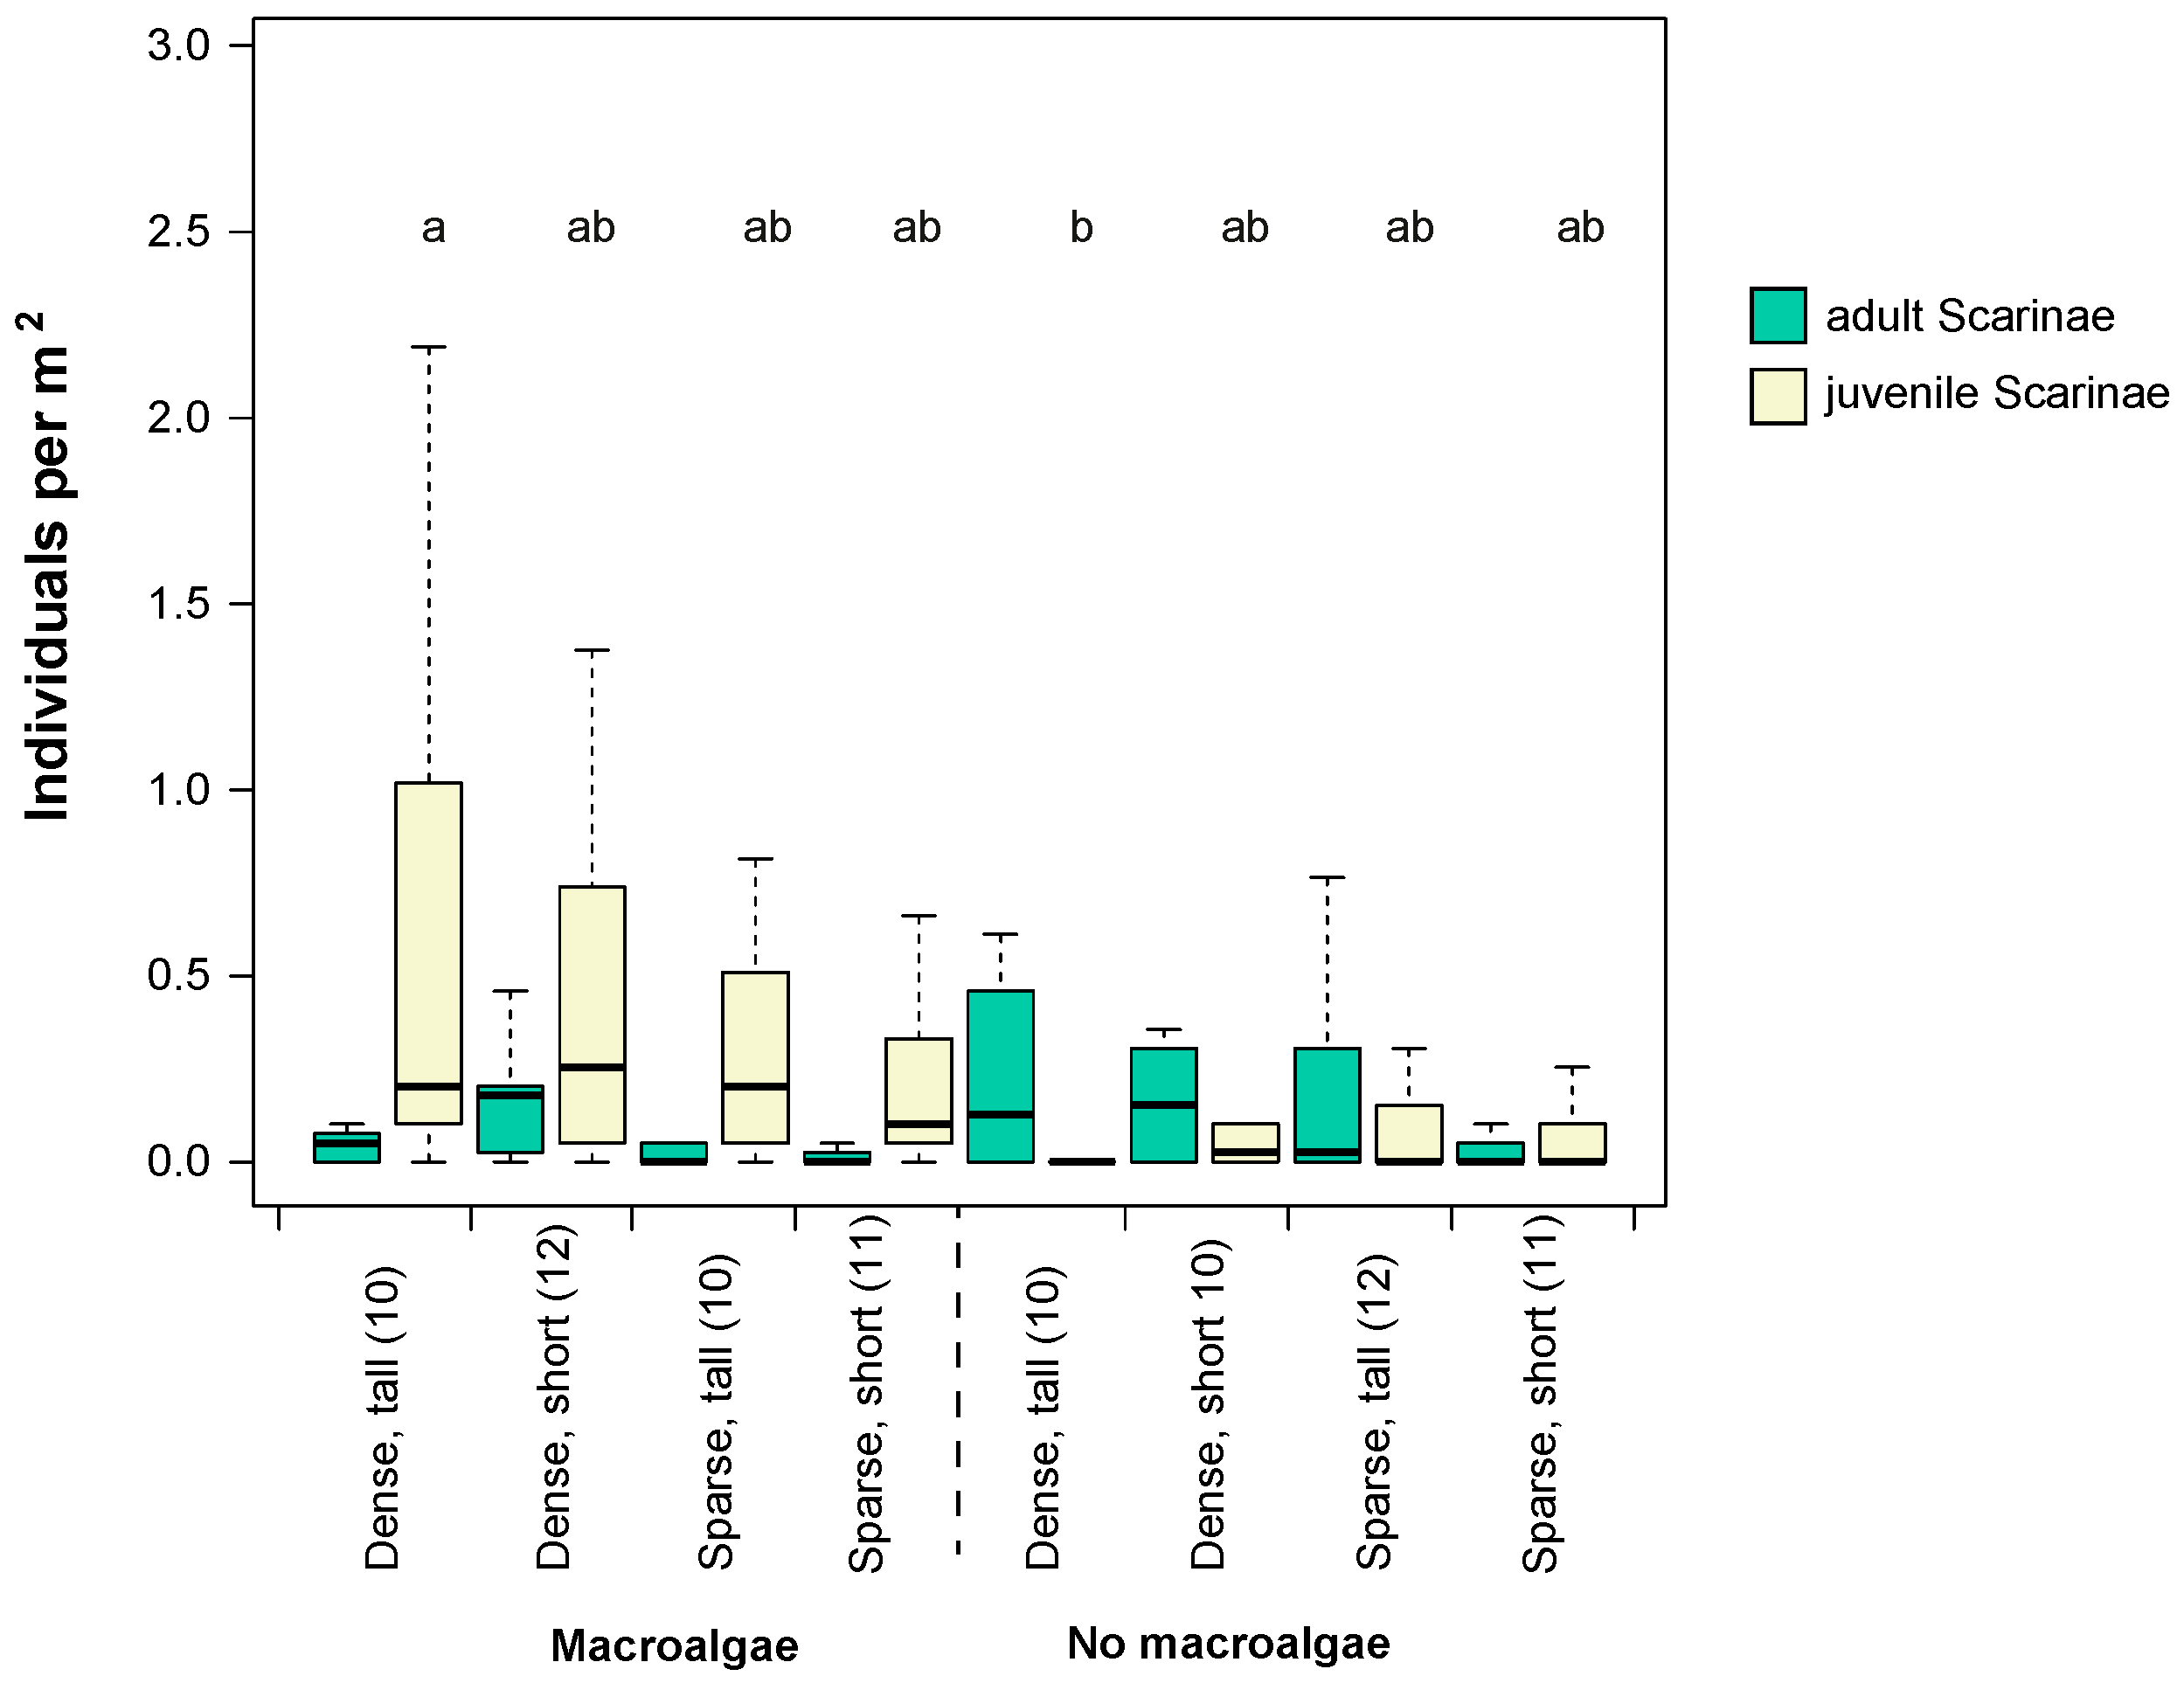
3.1. Fish Assemblage in Different Seascape Configurations and Habitat Complexities
3.2. Environmental Variables Influencing Total Fish and Scraping/Excavating Parrotfish Abundance
3.3. Spatial Movements of Scraping/Excavating Parrotfish in Different Seascape Configurations and Habitat Complexities
3.4. Bite Rates of Herbivorous Fish and Seascape Configuration
4. Discussion
Supplementary Materials
Author Contributions
Funding
Acknowledgments
Conflicts of Interest
References
- Turner, M.G. Landscape Ecology: The Effect of Pattern on Process. Annu. Rev. Ecol. Syst. 1989, 20, 29. [Google Scholar] [CrossRef]
- Turner, M.G. Landscape ecology in North America: Past, present, and future. Ecology 2005, 86, 1967–1974. [Google Scholar] [CrossRef]
- Schröder, B.; Seppelt, R. Analysis of pattern–process interactions based on landscape models—Overview, general concepts, and methodological issues. Ecol. Model. 2006, 199, 505–516. [Google Scholar] [CrossRef]
- Atauri, J.A.; de Lucio, J.V. The role of landscape structure in species richness distribution of birds, amphibians, reptiles and lepidopterans in Mediterranean landscapes. Landsc. Ecol. 2001, 16, 147–159. [Google Scholar] [CrossRef]
- Foley, J.A. Global Consequences of Land Use. Science 2005, 309, 570–574. [Google Scholar] [CrossRef]
- Lindenmayer, D.; Hobbs, R.J.; Montague-Drake, R.; Alexandra, J.; Bennett, A.; Burgman, M.; Cale, P.; Calhoun, A.; Cramer, V.; Cullen, P.; et al. A checklist for ecological management of landscapes for conservation. Ecol. Lett. 2008, 11, 78–91. [Google Scholar] [CrossRef] [PubMed]
- Holling, C.S. Cross-Scale Morphology, Geometry, and Dynamics of Ecosystems. Ecol. Monogr. 1992, 62, 57. [Google Scholar] [CrossRef]
- Sanderson, E.W.; Redford, K.H.; Vedder, A.; Coppolillo, P.B.; Ward, S.E. A conceptual model for conservation planning based on landscape species requirements. Landsc. Urban Plan. 2002, 58, 41–56. [Google Scholar] [CrossRef]
- Boström, C.; Pittman, S.; Simenstad, C.; Kneib, R. Seascape ecology of coastal biogenic habitats: Advances, gaps, and challenges. Mar. Ecol. Prog. Ser. 2011, 427, 191–217. [Google Scholar] [CrossRef]
- Hitt, S.; Pittman, S.; Nemeth, R. Diel movements of fishes linked to benthic seascape structure in a Caribbean coral reef ecosystem. Mar. Ecol. Prog. Ser. 2011, 427, 275–291. [Google Scholar] [CrossRef]
- Staveley, T.A.B.; Perry, D.; Lindborg, R.; Gullström, M. Seascape structure and complexity influence temperate seagrass fish assemblage composition. Ecography 2017, 40, 936–946. [Google Scholar] [CrossRef]
- Roff, G.; Bejarano, S.; Priest, M.; Marshell, A.; Chollett, I.; Steneck, R.S.; Doropoulos, C.; Golbuu, Y.; Mumby, P.J. Seascapes as drivers of herbivore assemblages in coral reef ecosystems. Ecol. Monogr. 2019, 89, e01336. [Google Scholar] [CrossRef]
- Roberts, C.; Ormond, R. Habitat complexity and coral reef fish diversity and abundance on Red Sea fringing reefs. Mar. Ecol. Prog. Ser. 1987, 41, 1–8. [Google Scholar] [CrossRef]
- Luckhurst, B.E.; Luckhurst, K. Analysis of the influence of substrate variables on coral reef fish communities. Mar. Biol. 1978, 49, 317–323. [Google Scholar] [CrossRef]
- Friedlander, A.M.; Parrish, J.D. Habitat characteristics affecting fish assemblages on a Hawaiian coral reef. J. Exp. Mar. Biol. Ecol. 1998, 224, 1–30. [Google Scholar] [CrossRef]
- Gratwicke, B.; Speight, M.R. The relationship between fish species richness, abundance and habitat complexity in a range of shallow tropical marine habitats. J. Fish Biol. 2005, 66, 650–667. [Google Scholar] [CrossRef]
- Graham, N.A.J.; Nash, K.L. The importance of structural complexity in coral reef ecosystems. Coral Reefs 2013, 32, 315–326. [Google Scholar] [CrossRef]
- Rogers, A.; Blanchard, J.L.; Mumby, P.J. Vulnerability of Coral Reef Fisheries to a Loss of Structural Complexity. Curr. Biol. 2014, 24, 1000–1005. [Google Scholar] [CrossRef]
- van Lier, J.R.; Wilson, S.K.; Depczynski, M.; Wenger, L.N.; Fulton, C.J. Habitat connectivity and complexity underpin fish community structure across a seascape of tropical macroalgae meadows. Landsc. Ecol. 2018, 33, 1287–1300. [Google Scholar] [CrossRef]
- Vergés, A.; Vanderklift, M.A.; Doropoulos, C.; Hyndes, G.A. Spatial Patterns in Herbivory on a Coral Reef Are Influenced by Structural Complexity but Not by Algal Traits. PLoS ONE 2011, 6, e17115. [Google Scholar] [CrossRef]
- Catano, L.B.; Rojas, M.C.; Malossi, R.J.; Peters, J.R.; Heithaus, M.R.; Fourqurean, J.W.; Burkepile, D.E. Reefscapes of fear: Predation risk and reef hetero-geneity interact to shape herbivore foraging behaviour. J. Anim. Ecol. 2016, 85, 146–156. [Google Scholar] [CrossRef] [PubMed]
- Wilson, S.K.; Graham, N.A.J.; Pratchett, M.S.; Jones, G.P.; Polunin, N.V.C. Multiple disturbances and the global degradation of coral reefs: Are reef fishes at risk or resilient? Glob. Chang. Biol. 2006, 12, 2220–2234. [Google Scholar] [CrossRef]
- Fontoura, L.; Zawada, K.J.A.; D’agata, S.; Álvarez-Noriega, M.; Baird, A.H.; Boutros, N.; Dornelas, M.; Luiz, O.J.; Madin, J.S.; Maina, J.M.; et al. Climate-driven shift in coral morphological structure predicts decline of juvenile reef fishes. Glob. Chang. Biol. 2020, 26, 557–567. [Google Scholar] [CrossRef] [PubMed]
- Trebilco, R.; Dulvy, N.; Stewart, H.; Salomon, A. The role of habitat complexity in shaping the size structure of a temperate reef fish community. Mar. Ecol. Prog. Ser. 2015, 532, 197–211. [Google Scholar] [CrossRef]
- Van Lier, J.R.; Harasti, D.; Laird, R.; Noble, M.M.; Fulton, C.J. Importance of soft canopy structure for labrid fish communities in estuarine mesohabitats. Mar. Biol. 2017, 164, 45. [Google Scholar] [CrossRef]
- Connell, S.D.; Jones, G.P. The influence of habitat complexity on postrecruitment processes in a temperate reef fish population. J. Exp. Mar. Biol. Ecol. 1991, 151, 271–294. [Google Scholar] [CrossRef]
- Tuya, F.; Wernberg, T.; Thomsen, M.S. Habitat structure affect abundances of labrid fishes across temperate reefs in south-western Australia. Environ. Biol. Fishes 2009, 86, 311–319. [Google Scholar] [CrossRef]
- Eggertsen, M.; Chacin, D.H.; Åkerlund, C.; Halling, C.; Berkström, C. Contrasting distribution and foraging patterns of herbivorous and detritivorous fishes across multiple habitats in a tropical seascape. Mar. Biol. 2019, 166, 51. [Google Scholar] [CrossRef]
- Grober-Dunsmore, R.; Frazer, T.K.; Beets, J.P.; Lindberg, W.J.; Zwick, P.; Funicelli, N.A. Influence of landscape structure on reef fish assemblages. Landsc. Ecol. 2008, 23, 37–53. [Google Scholar] [CrossRef]
- Stier, A.C.; Hanson, K.M.; Holbrook, S.J.; Schmitt, R.J.; Brooks, A.J. Predation and landscape characteristics independently affect reef fish community organization. Ecology 2014, 95, 1294–1307. [Google Scholar] [CrossRef]
- Swadling, D.S.; Knott, N.A.; Rees, M.J.; Davis, A.R. Temperate zone coastal seascapes: Seascape patterning and adjacent seagrass habitat shape the distribution of rocky reef fish assemblages. Landsc. Ecol. 2019, 34, 2337–2352. [Google Scholar] [CrossRef]
- Nash, K.L.; Welsh, J.Q.; Graham, N.A.J.; Bellwood, D.R. Home-range allometry in coral reef fishes: Comparison to other vertebrates, methodological issues and management implications. Oecologia 2015, 177, 73–83. [Google Scholar] [CrossRef] [PubMed]
- Green, A.L.; Maypa, A.P.; Almany, G.R.; Rhodes, K.L.; Weeks, R.; Abesamis, R.A.; Gleason, M.G.; Mumby, P.J.; White, A.T. Larval dispersal and movement patterns of coral reef fishes, and implications for marine reserve network design: Connectivity and marine reserves. Biol. Rev. 2015, 90, 1215–1247. [Google Scholar] [CrossRef] [PubMed]
- Weeks, R.; Green, A.L.; Joseph, E.; Peterson, N.; Terk, E. Using reef fish movement to inform marine reserve design. J. Appl. Ecol. 2017, 54, 145–152. [Google Scholar] [CrossRef]
- Wilson, S.K.; Graham, N.A.J.; Polunin, N.V.C. Appraisal of visual assessments of habitat complexity and benthic composition on coral reefs. Mar. Biol. 2007, 151, 1069–1076. [Google Scholar] [CrossRef]
- Bellwood, D.R.; Hoey, A.S.; Ackerman, J.L.; Depczynski, M. Coral bleaching, reef fish community phase shifts and the resilience of coral reefs. Glob. Chang. Biol. 2006, 12, 1587–1594. [Google Scholar] [CrossRef]
- Hench, J.L.; Leichter, J.J.; Monismith, S.G. Episodic circulation and exchange in a wave-driven coral reef and lagoon system. Limnol. Oceanogr. 2008, 53, 2681–2694. [Google Scholar] [CrossRef]
- Poray, A.K.; Carpenter, R.C. Distributions of coral reef macroalgae in a back reef habitat in Moorea, French Polynesia. Coral Reefs 2014, 33, 67–76. [Google Scholar] [CrossRef]
- Dufour, V.; Galzin, R. Colonization patterns of reef fish larvae to the lagoon at Moorea Island, French Polynesia. Mar. Ecol. Prog. Ser. 1993, 102, 143. [Google Scholar] [CrossRef]
- Leichter, J.J.; Stokes, M.D.; Hench, J.L.; Witting, J.; Washburn, L. The island-scale internal wave climate of Moorea, French Polynesia: Internal Waves on Moorea. J. Geophys. Res. Ocean. 2012, 117. [Google Scholar] [CrossRef]
- Pratchett, M.S.; Trapon, M.; Berumen, M.L.; Chong-Seng, K. Recent disturbances augment community shifts in coral assemblages in Moorea, French Polynesia. Coral Reefs 2011, 30, 183–193. [Google Scholar] [CrossRef]
- Adam, T.C.; Schmitt, R.J.; Holbrook, S.J.; Brooks, A.J.; Edmunds, P.J.; Carpenter, R.C.; Bernardi, G. Herbivory, Connectivity, and Ecosystem Resilience: Response of a Coral Reef to a Large-Scale Perturbation. PLoS ONE 2011, 6, e23717. [Google Scholar] [CrossRef] [PubMed]
- Done, T.J.; Dayton, P.K.; Dayton, A.E.; Steger, R. Regional and local variability in recovery of shallow coral communities: Moorea, French Polynesia and central Great Barrier Reef. Coral Reefs 1991, 9, 183–192. [Google Scholar] [CrossRef]
- Andréfouët, S.; Zubia, M.; Payri, C. Mapping and biomass estimation of the invasive brown algae Turbinaria ornata (Turner) J. Agardh and Sargassum mangarevense (Grunow) Setchell on heterogeneous Tahitian coral reefs using 4-meter resolution IKONOS satellite data. Coral Reefs 2004, 23, 26–38. [Google Scholar] [CrossRef]
- Stiger, V.; Payri, C.E. Natural settlement dynamics of a young population of Turbinaria ornata and phenological comparisons with older populations. Aquat. Bot. 2005, 81, 225–243. [Google Scholar] [CrossRef]
- Bittick, S.J.; Bilotti, N.D.; Peterson, H.A.; Stewart, H.L. Turbinaria ornata as an herbivory refuge for associate algae. Mar. Biol. 2010, 157, 317–323. [Google Scholar] [CrossRef]
- Bijoux, J.; Dagorn, L.; Berke, G.; Cowley, P.; Soria, M.; Gaertner, J.; Robinson, J. Temporal dynamics, residency and site fidelity of spawning aggregations of a herbivorous tropical reef fish Siganus sutor. Mar. Ecol. Prog. Ser. 2013, 475, 233–247. [Google Scholar] [CrossRef]
- Yarlett, R.; Perry, C.; Wilson, R.; Philpot, K. Constraining species-size class variability in rates of parrotfish bioerosion on Maldivian coral reefs: Implications for regional-scale bioerosion estimates. Mar. Ecol. Prog. Ser. 2018, 590, 155–169. [Google Scholar] [CrossRef]
- Berkström, C.; Lindborg, R.; Thyresson, M.; Gullström, M. Assessing connectivity in a tropical embayment: Fish migrations and seascape ecology. Biol. Conserv. 2013, 166, 43–53. [Google Scholar] [CrossRef]
- Bohnsack, J.A.; Bannerot, S.P. A Stationary Visual Census Technique for Quantitatively Assessing Community Structure of Coral Reef Fishes; NOAA/National Marine Fisheries Service: Silver Spring, MD, USA, 1986.
- Wenger, L.; van Lier, J.; Fulton, C. Microhabitat selectivity shapes the seascape ecology of a carnivorous macroalgae-associated tropical fish. Mar. Ecol. Prog. Ser. 2018, 590, 187–200. [Google Scholar] [CrossRef]
- Polunin, N.; Roberts, C. Greater biomass and value of target coral-reef fishes in two small Caribbean marine reserves. Mar. Ecol. Prog. Ser. 1993, 100, 167–176. [Google Scholar] [CrossRef]
- Fulton, C.; Bellwood, D. Patterns of foraging in labrid fishes. Mar. Ecol. Prog. Ser. 2002, 226, 135–142. [Google Scholar] [CrossRef]
- Young, G.C.; Dey, S.; Rogers, A.D.; Exton, D. Cost and time-effective method for multi-scale measures of rugosity, fractal dimension, and vector dispersion from coral reef 3D models. PLoS ONE 2017, 12, e0175341. [Google Scholar] [CrossRef] [PubMed]
- Burns, J.; Delparte, D.; Gates, R.; Takabayashi, M. Integrating structure-from-motion photogrammetry with geospatial software as a novel technique for quantifying 3D ecological characteristics of coral reefs. PeerJ 2015, 3, e1077. [Google Scholar] [CrossRef] [PubMed]
- Cignoni, P.; Callieri, M.; Corsini, M.; Dellepiane, M.; Ganovelli, F.; Ranzuglia, G. MeshLab: An Open-Source Mesh Processing Tool. In Proceedings of the Eurographics Italian Chapter Conference, Salerno, Italy, 2–4 July 2008. [Google Scholar]
- Choat, J.; Clements, K.; Robbins, W. The trophic status of herbivorous fishes on coral reefs. Mar. Biol. 2002, 140, 613–623. [Google Scholar] [CrossRef]
- Clements, K.D.; German, D.P.; Piché, J.; Tribollet, A.; Choat, J.H. Integrating ecological roles and trophic diversification on coral reefs: Multiple lines of evidence identify parrotfishes as microphages. Biol. J. Linn. Soc. 2016, 120, 729–751. [Google Scholar] [CrossRef]
- Tebbett, S.B.; Goatley, C.H.R.; Bellwood, D.R. Clarifying functional roles: Algal removal by the surgeonfishes Ctenochaetus striatus and Acanthurus nigrofuscus. Coral Reefs 2017, 36, 803–813. [Google Scholar] [CrossRef]
- Clements, K.D.; Choat, J.H. Nutritional ecology of parrotfishes (Scarinae, Labridae). In Biology of Parrotfishes; CRC Press: Boca Raton, FL, USA; Taylor & Francis Group: Oxfordshire, UK, 2018. [Google Scholar]
- Froese, R.; Pauly, D. FishBase. Available online: www.fishbase.org (accessed on 9 October 2017).
- Montgomery, W.L.; Myrberg, A.A.; Fishelson, L. Feeding ecology of surgeonfishes (Acanthuridae) in the northern Red Sea, with particular reference to Acanthurus nigrofuscus (Forsskål). J. Exp. Mar. Biol. Ecol. 1989, 132, 179–207. [Google Scholar] [CrossRef]
- Tano, S.A.; Eggertsen, M.; Wikström, S.A.; Berkström, C.; Buriyo, A.S.; Halling, C. Tropical seaweed beds as important habitats for juvenile fish. Mar. Freshw. Res. 2017, 68, 1921–1934. [Google Scholar] [CrossRef]
- Randall, J.E.; Choat, J.H. Two new parrotfishes of the genus Scarus from the Central and South Pacific, with further examples of sexual dichromatism. Zool. J. Linn. Soc. 1980, 70, 383–419. [Google Scholar] [CrossRef]
- DeMartini, E.E.; Howard, K.G. Comparisons of body sizes at sexual maturity and at sex change in the parrotfishes of Hawaii: Input needed for management regulations and stock assessments: Comparative maturation of parrotfishes. J. Fish Biol. 2016, 88, 523–541. [Google Scholar] [CrossRef] [PubMed]
- Taylor, B.M.; Houk, P.; Russ, G.R.; Choat, J.H. Life histories predict vulnerability to overexploitation in parrotfishes. Coral Reefs 2014, 33, 869–878. [Google Scholar] [CrossRef]
- Fisher, R.; Wilson, S.K.; Sin, T.M.; Lee, A.C.; Langlois, T.J. A simple function for full-subsets multiple regression in ecology with R. Ecol. Evol. 2018, 8, 6104–6113. [Google Scholar] [CrossRef]
- Wood, S.N. Generalized Additive Models, An Introduction with R; CRC Press: Boca Raton, FL, USA; Chapman and Hall: London, UK, 2017. [Google Scholar]
- Shono, H. Application of the Tweedie distribution to zero-catch data in CPUE analysis. Fish. Res. 2008, 93, 154–162. [Google Scholar] [CrossRef]
- Graham, M.H. Confronting multicollinearity in ecological multiple regression. Ecology 2003, 84, 2809–2815. [Google Scholar] [CrossRef]
- Zuur, A.F.; Ieno, E.N.; Elphick, C.S. A protocol for data exploration to avoid common statistical problems: Data exploration. Methods Ecol. Evol. 2010, 1, 3–14. [Google Scholar] [CrossRef]
- Adam, T.; Burkepile, D.; Ruttenberg, B.; Paddack, M. Herbivory and the resilience of Caribbean coral reefs: Knowledge gaps and implications for management. Mar. Ecol. Prog. Ser. 2015, 520, 1–20. [Google Scholar] [CrossRef]
- Mumby, P.J. Fishing, Trophic Cascades, and the Process of Grazing on Coral Reefs. Science 2006, 311, 98–101. [Google Scholar] [CrossRef]
- Hughes, T.P.; Rodrigues, M.J.; Bellwood, D.R.; Ceccarelli, D.; Hoegh-Guldberg, O.; McCook, L.; Moltschaniwskyj, N.; Pratchett, M.S.; Steneck, R.S.; Willis, B. Phase Shifts, Herbivory, and the Resilience of Coral Reefs to Climate Change. Curr. Biol. 2007, 17, 360–365. [Google Scholar] [CrossRef]
- McCook, L.J. Effects of herbivory on zonation of Sargassum spp. within fringing reefs of the central Great Barrier Reef. Mar. Biol. 1997, 129, 713–722. [Google Scholar] [CrossRef]
- Lim, I.E.; Wilson, S.K.; Holmes, T.H.; Noble, M.M.; Fulton, C.J. Specialization within a shifting habitat mosaic underpins the seasonal abundance of a tropical fish. Ecosphere 2016, 7, e01212. [Google Scholar] [CrossRef]
- Aburto-Oropeza, O.; Sala, E.; Paredes, G.; Mendoza, A.; Ballesteros, E. Predictability of reef fish recruitment in a highly variable nursery habitat. Ecology 2007, 88, 2220–2228. [Google Scholar] [CrossRef] [PubMed]
- Holbrook, S.J.; Schmitt, R.J.; Adam, T.C.; Brooks, A.J. Coral Reef Resilience, Tipping Points and the Strength of Herbivory. Sci. Rep. 2016, 6, 35817. [Google Scholar] [CrossRef] [PubMed]
- Davis, K.; Carlson, P.M.; Bradley, D.; Warner, R.R.; Caselle, J.E. Predation risk influences feeding rates but competition structures space use for a common Pacific parrotfish. Oecologia 2017, 184, 139–149. [Google Scholar] [CrossRef] [PubMed]
- Robinson, J.P.W.; McDevitt, J.M.; Dajka, C.; Hadj, J.; Howlett, S.; Graba, A.; Hoey, A.S.; Nash, K.L.; Wilson, S.K.; Graham, N.A.J. Habitat and fishing control grazing potential on coral reefs. Funct. Ecol. 2020, 34, 240–251. [Google Scholar] [CrossRef]
- Viviani, J.; Moritz, C.; Parravicini, V.; Lecchini, D.; Siu, G.; Galzin, R.; Viriot, L. Synchrony patterns reveal different degrees of trophic guild vulnerability after disturbances in a coral reef fish community. Divers. Distrib. 2019, 25, 1210–1221. [Google Scholar] [CrossRef]
- Kovalenko, K.E.; Thomaz, S.M.; Warfe, D.M. Habitat complexity: Approaches and future directions. Hydrobiologia 2012, 685, 1–17. [Google Scholar] [CrossRef]
- Chen, L.-S. Post-settlement Diet Shift of Chlorurus sordidus and Scarus schlegeli (Pisces: Scaridae). Zool. Stud. 2002, 41, 47–58. [Google Scholar]
- Bellwood, D.R. Ontogenetic changes in the diet of early post-settlement Scarus species (Pisces: Scaridae). J. Fish Biol. 1988, 33, 213–219. [Google Scholar] [CrossRef]
- Fulton, C.J.; Abesamis, R.A.; Berkström, C.; Depczynski, M.; Graham, N.A.J.; Holmes, T.H.; Kulbicki, M.; Noble, M.M.; Radford, B.T.; Tano, S.; et al. Form and function of tropical macroalgal reefs in the Anthropocene. Funct. Ecol. 2019, 33, 989–999. [Google Scholar] [CrossRef]
- Brandl, S.J.; Hoey, A.S.; Bellwood, D.R. Micro-topography mediates interactions between corals, algae, and herbivorous fishes on coral reefs. Coral Reefs 2014, 33, 421–430. [Google Scholar] [CrossRef]
- Almany, G.R. Differential effects of habitat complexity, predators and competitors on abundance of juvenile and adult coral reef fishes. Oecologia 2004, 141, 105–113. [Google Scholar] [CrossRef]
- Dubin, R.E.; Baker, J.D. Two types of cover-seeking behavior at sunset by the princess parrotfish, Scarus taeniopterus, at Barbados, West Indies. Bull. Mar. Sci. 1982, 32, 572–583. [Google Scholar]
- Nagelkerken, I.; Bothwell, J.; Nemeth, R.; Pitt, J.; van der Velde, G. Interlinkage between Caribbean coral reefs and seagrass beds through feeding migrations by grunts (Haemulidae) depends on habitat accessibility. Mar. Ecol. Prog. Ser. 2008, 368, 155–164. [Google Scholar] [CrossRef]
- Brandl, S.J.; Bellwood, D.R. Microtopographic refuges shape consumer-producer dynamics by mediating consumer functional diversity. Oecologia 2016, 182, 203–217. [Google Scholar] [CrossRef]
- Gust, N.; Choat, J.; McCormick, M. Spatial variability in reef fish distribution, abundance, size and biomass: A multi-scale analysis. Mar. Ecol. Prog. Ser. 2001, 214, 237–251. [Google Scholar] [CrossRef]
- Fulton, C.J.; Noble, M.N.; Radford, B.; Gallen, C.; Harasti, D. Microhabitat selectivity underpins regional indicators of fish abundance and replenishment. Ecol. Indic. 2016, 70, 222–231. [Google Scholar] [CrossRef]
- Eggertsen, L.; Ferreira, C.E.L.; Fontoura, L.; Kautsky, N.; Gullström, M.; Berkström, C. Seaweed beds support more juvenile reef fish than seagrass beds: Carrying capacity in a south-western Atlantic tropical seascape. Estuar. Coast. Shelf Sci. 2017, 196, 97–108. [Google Scholar] [CrossRef]
- Fulton, C.J.; Berkström, C.; Wilson, S.K.; Abesamis, R.A.; Bradley, M.; Åkerlund, C.; Barrett, L.T.; Bucol, A.A.; Chacin, D.H.; Chong-Seng, K.M.; et al. Macroalgal meadow habitats support fish and fisheries in diverse tropical seascapes. Fish Fish. 2020, 21, 700–717. [Google Scholar] [CrossRef]
- Lecchini, D.; Waqalevu, V.; Parmentier, E.; Radford, C.; Banaigs, B. Fish larvae prefer coral over algal water cues: Implications of coral reef degradation. Mar. Ecol. Prog. Ser. 2013, 475, 303–307. [Google Scholar] [CrossRef]
- Russ, G.R.; Questel, S.-L.A.; Rizzari, J.R.; Alcala, A.C. The parrotfish–coral relationship: Refuting the ubiquity of a prevailing paradigm. Mar. Biol. 2015, 162, 2029–2045. [Google Scholar] [CrossRef]


| Complexity Category | Df | MS | F | p-Value |
|---|---|---|---|---|
| Total Fish Abundance | ||||
| Configuration | 1 | 3.919 | 16.161 | <0.001 |
| Bommie height | 1 | 4.420 | 18.229 | <0.001 |
| Macroalgal presence/absence | 1 | 0.421 | 1.735 | 0.19 |
| Residuals | 82 | 0.242 | ||
| Herbivorous Fish Abundance | ||||
| Configuration | 1 | 11.473 | 11.546 | 0.0011 |
| Bommie height | 1 | 2.575 | 2.592 | 0.111 |
| Macroalgal presence/absence | 1 | 4.639 | 4.669 | 0.034 |
| Residuals | 82 | 0.994 |
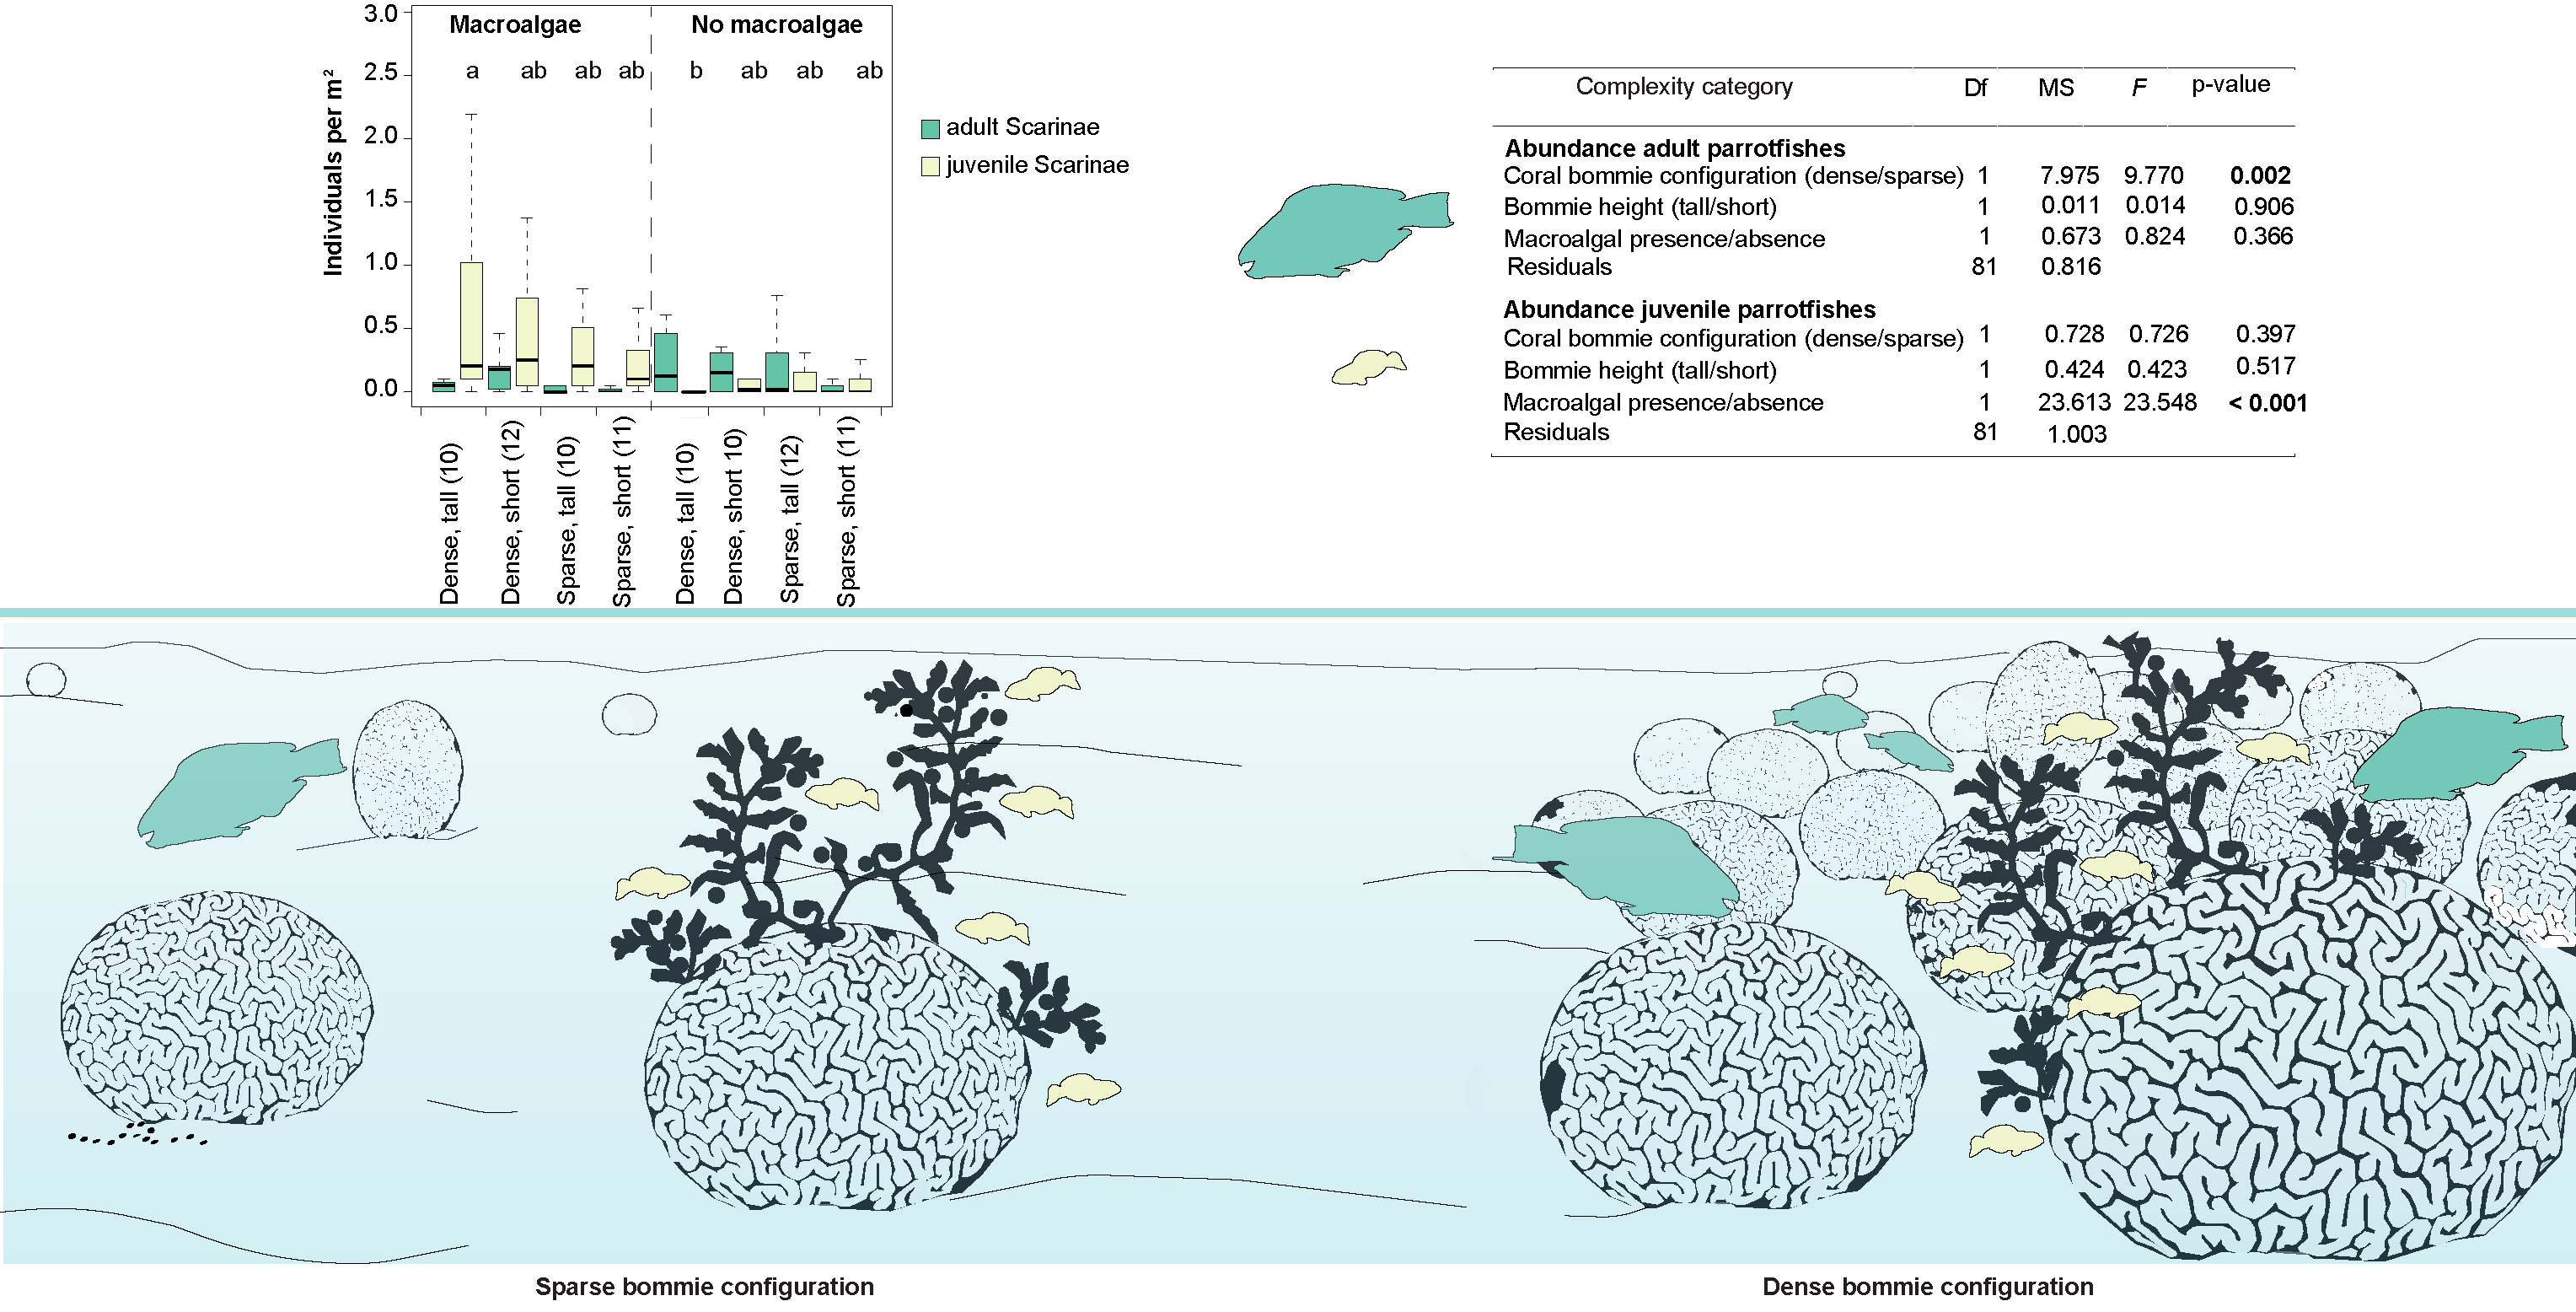
| Complexity Category | Df | MS | F | p-Value |
|---|---|---|---|---|
| Adult Parrotfish Abundance | ||||
| Configuration | 1 | 7.975 | 9.770 | 0.002 |
| Bommie height | 1 | 0.011 | 0.014 | 0.906 |
| Macroalgal presence/absence | 1 | 0.673 | 0.824 | 0.366 |
| Residuals | 81 | 0.816 | ||
| Juvenile Parrotfish Abundance | ||||
| Configuration | 1 | 0.728 | 0.726 | 0.397 |
| Bommie height | 1 | 0.424 | 0.423 | 0.517 |
| Macroalgal presence/absence | 1 | 23.613 | 23.548 | <0.001 |
| Residuals | 81 | 1.003 |
| Response | Model | ∆AICc | AICc Weights | R2 | Edf |
|---|---|---|---|---|---|
| Total fish abundance | Bommie height + log(Turf cover) + Sand cover | 0 | 0.478 | 0.233 | 6.86 |
| Total fish abundance | Bommie height + log(Distance to barrier reef) + sqrt(Macroalgal cover on bommie) | 0.604 | 0.353 | 0.235 | 6.56 |
| Juvenile parrotfish abundance | log(Number of holdfasts) | 0 | 0.056 | 0.311 | 11.82 |
| Juvenile parrotfish abundance | log(Distance to barrier reef) + log(Number of holdfasts) | 0.94 | 0.036 | 0.331 | 12.64 |
| Juvenile parrotfish abundance | log(Number of holdfasts) + Number of urchins | 0.95 | 0.035 | 0.314 | 12.9 |
| Adult parrotfish abundance | Bommie height + Sand cover | 0 | 0.086 | 0.145 | 12.26 |
| Adult parrotfish abundance | log(Distance to barrier reef) + Number of bommies + sqrt(Coral cover) | 0.022 | 0.085 | 0.176 | 11.33 |
| Adult parrotfish abundance | Bommie height + Sand cover + sqrt(Coral cover) | 0.071 | 0.083 | 0.161 | 12.63 |
| Adult parrotfish abundance | Sand cover | 1.17 | 0.048 | 0.127 | 10.53 |
| Adult parrotfish abundance | log(Distance to barrier reef) + sqrt(Coral cover) | 1.813 | 0.035 | 0.135 | 9.02 |
© 2020 by the authors. Licensee MDPI, Basel, Switzerland. This article is an open access article distributed under the terms and conditions of the Creative Commons Attribution (CC BY) license (http://creativecommons.org/licenses/by/4.0/).
Share and Cite
Eggertsen, M.; Chacin, D.H.; van Lier, J.; Eggertsen, L.; Fulton, C.J.; Wilson, S.; Halling, C.; Berkström, C. Seascape Configuration and Fine-Scale Habitat Complexity Shape Parrotfish Distribution and Function across a Coral Reef Lagoon. Diversity 2020, 12, 391. https://doi.org/10.3390/d12100391
Eggertsen M, Chacin DH, van Lier J, Eggertsen L, Fulton CJ, Wilson S, Halling C, Berkström C. Seascape Configuration and Fine-Scale Habitat Complexity Shape Parrotfish Distribution and Function across a Coral Reef Lagoon. Diversity. 2020; 12(10):391. https://doi.org/10.3390/d12100391
Chicago/Turabian StyleEggertsen, Maria, Dinorah H Chacin, Joshua van Lier, Linda Eggertsen, Christopher J Fulton, Shaun Wilson, Christina Halling, and Charlotte Berkström. 2020. "Seascape Configuration and Fine-Scale Habitat Complexity Shape Parrotfish Distribution and Function across a Coral Reef Lagoon" Diversity 12, no. 10: 391. https://doi.org/10.3390/d12100391
APA StyleEggertsen, M., Chacin, D. H., van Lier, J., Eggertsen, L., Fulton, C. J., Wilson, S., Halling, C., & Berkström, C. (2020). Seascape Configuration and Fine-Scale Habitat Complexity Shape Parrotfish Distribution and Function across a Coral Reef Lagoon. Diversity, 12(10), 391. https://doi.org/10.3390/d12100391