Demersal Fish Assemblages in NE Atlantic Seagrass and Kelp


Abstract

1. Introduction
2. Materials and Methods
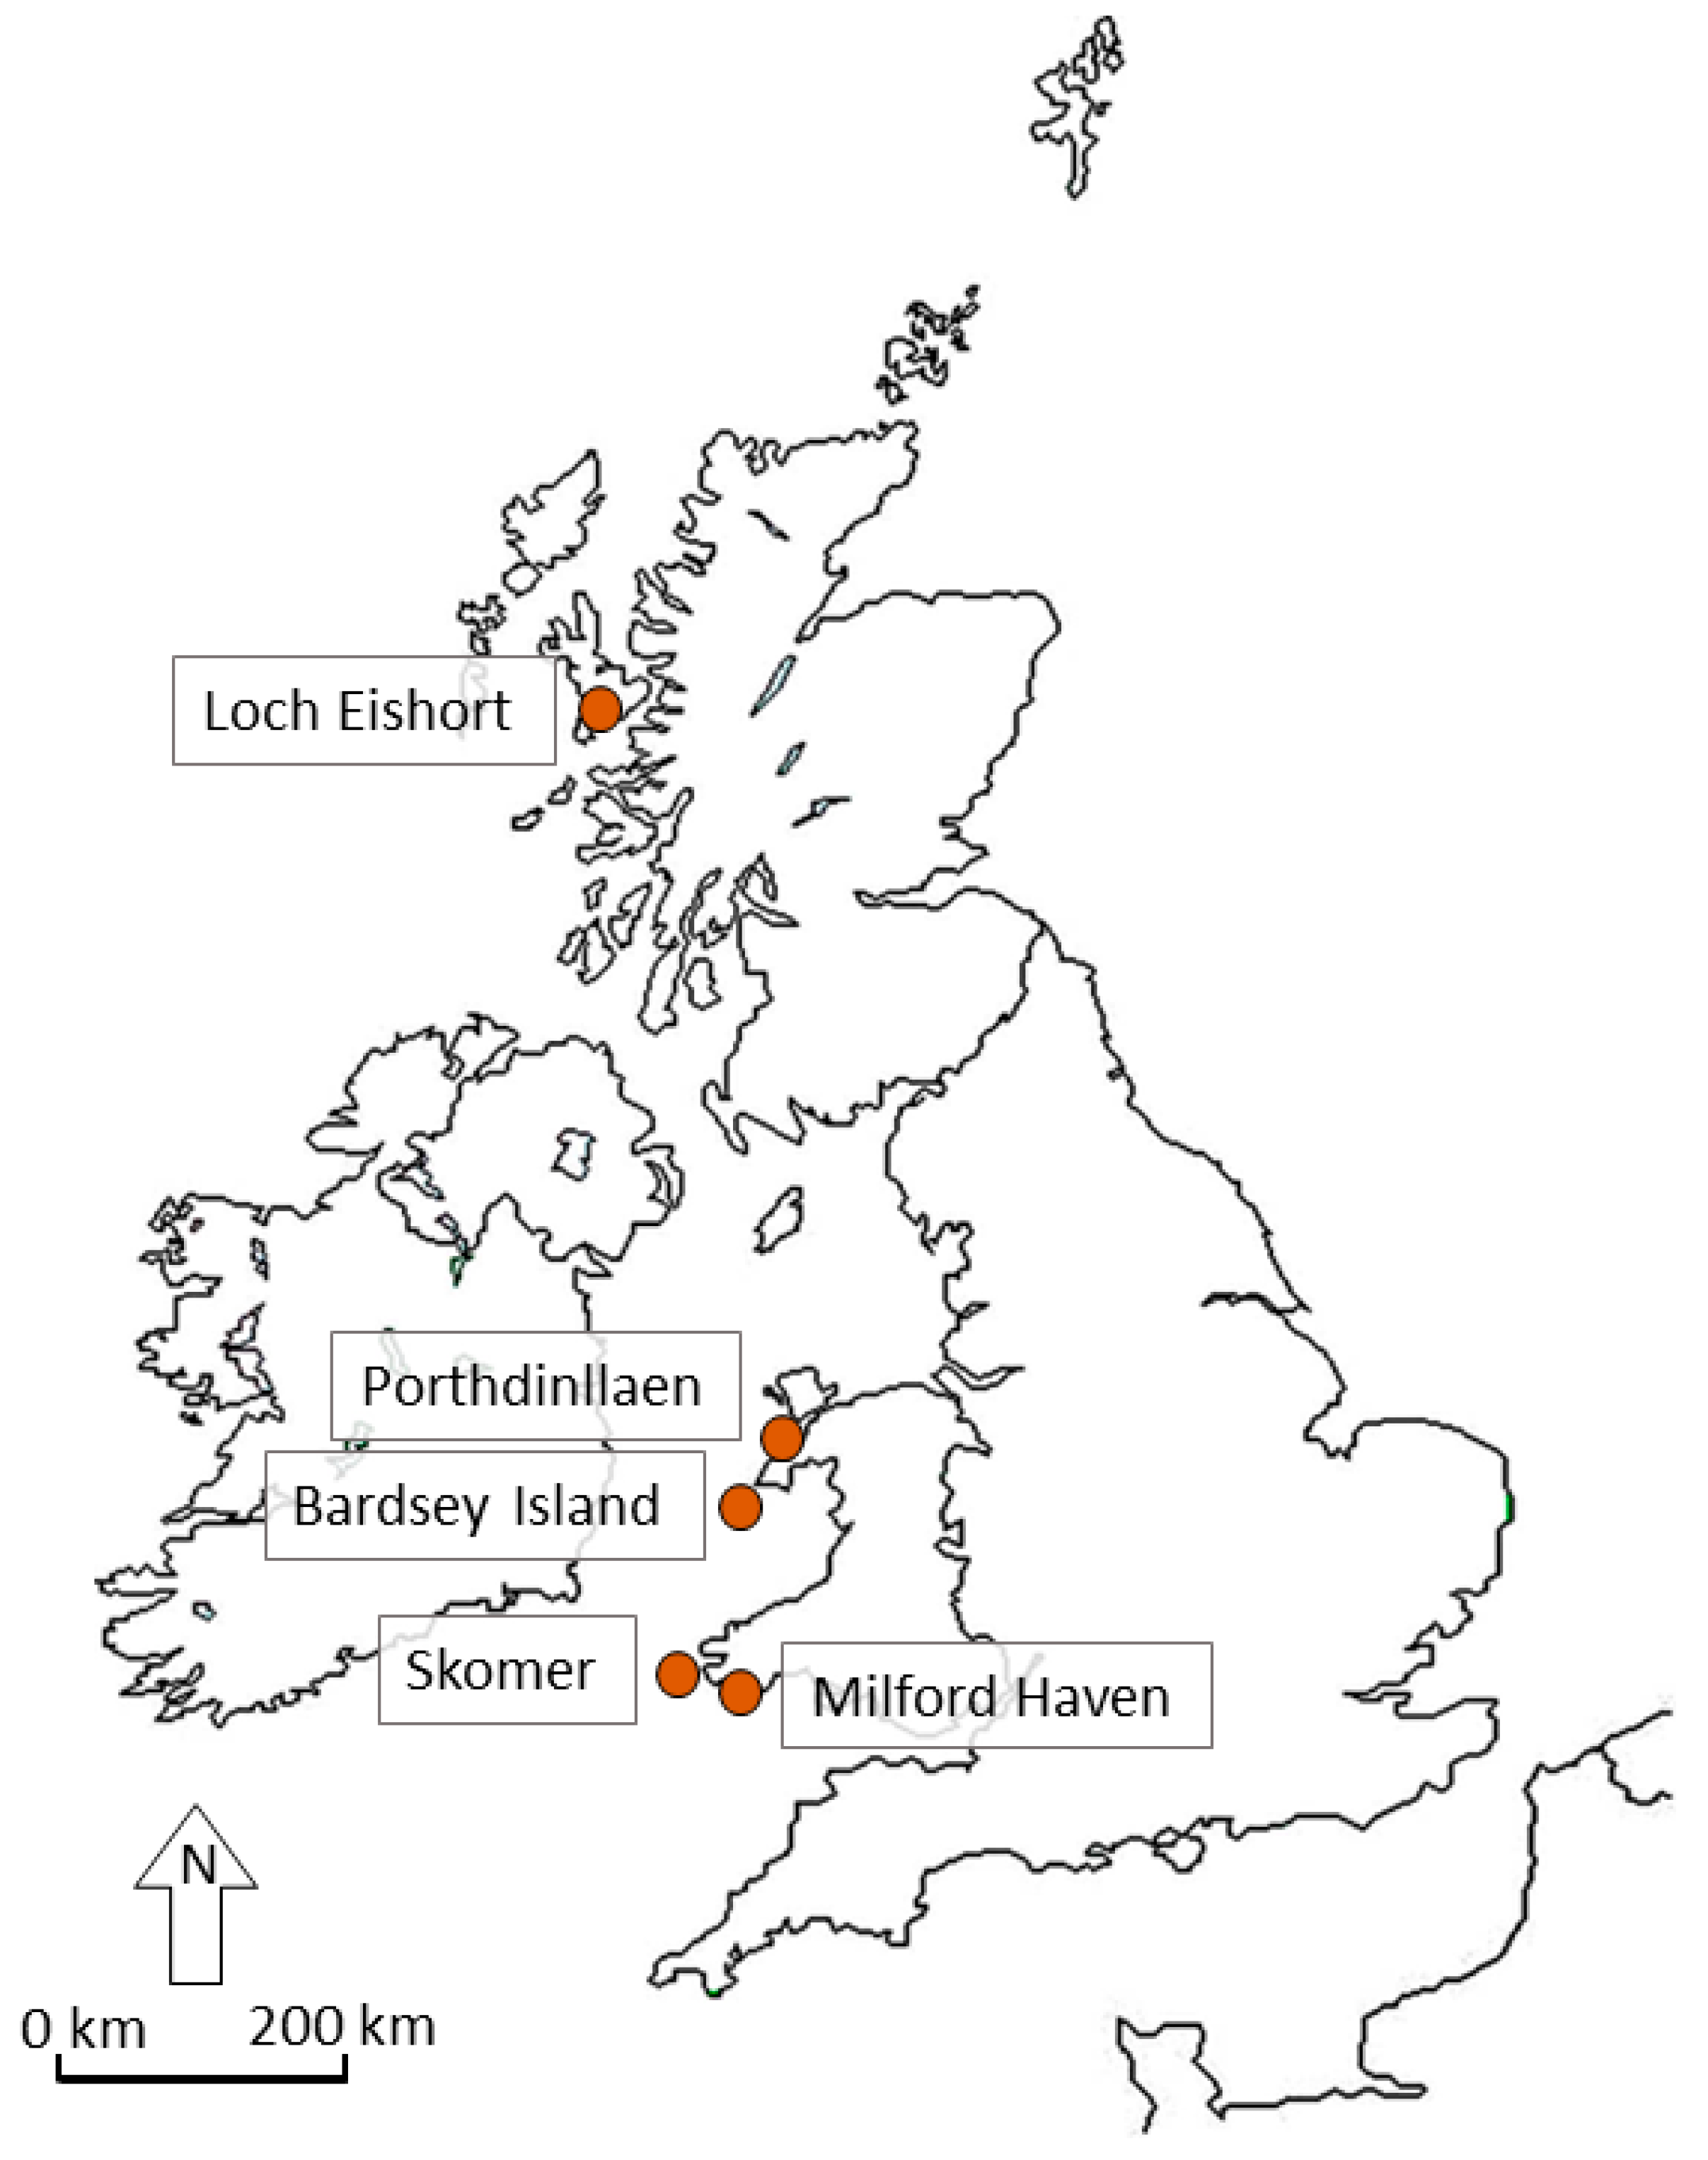
2.1. Study Sites
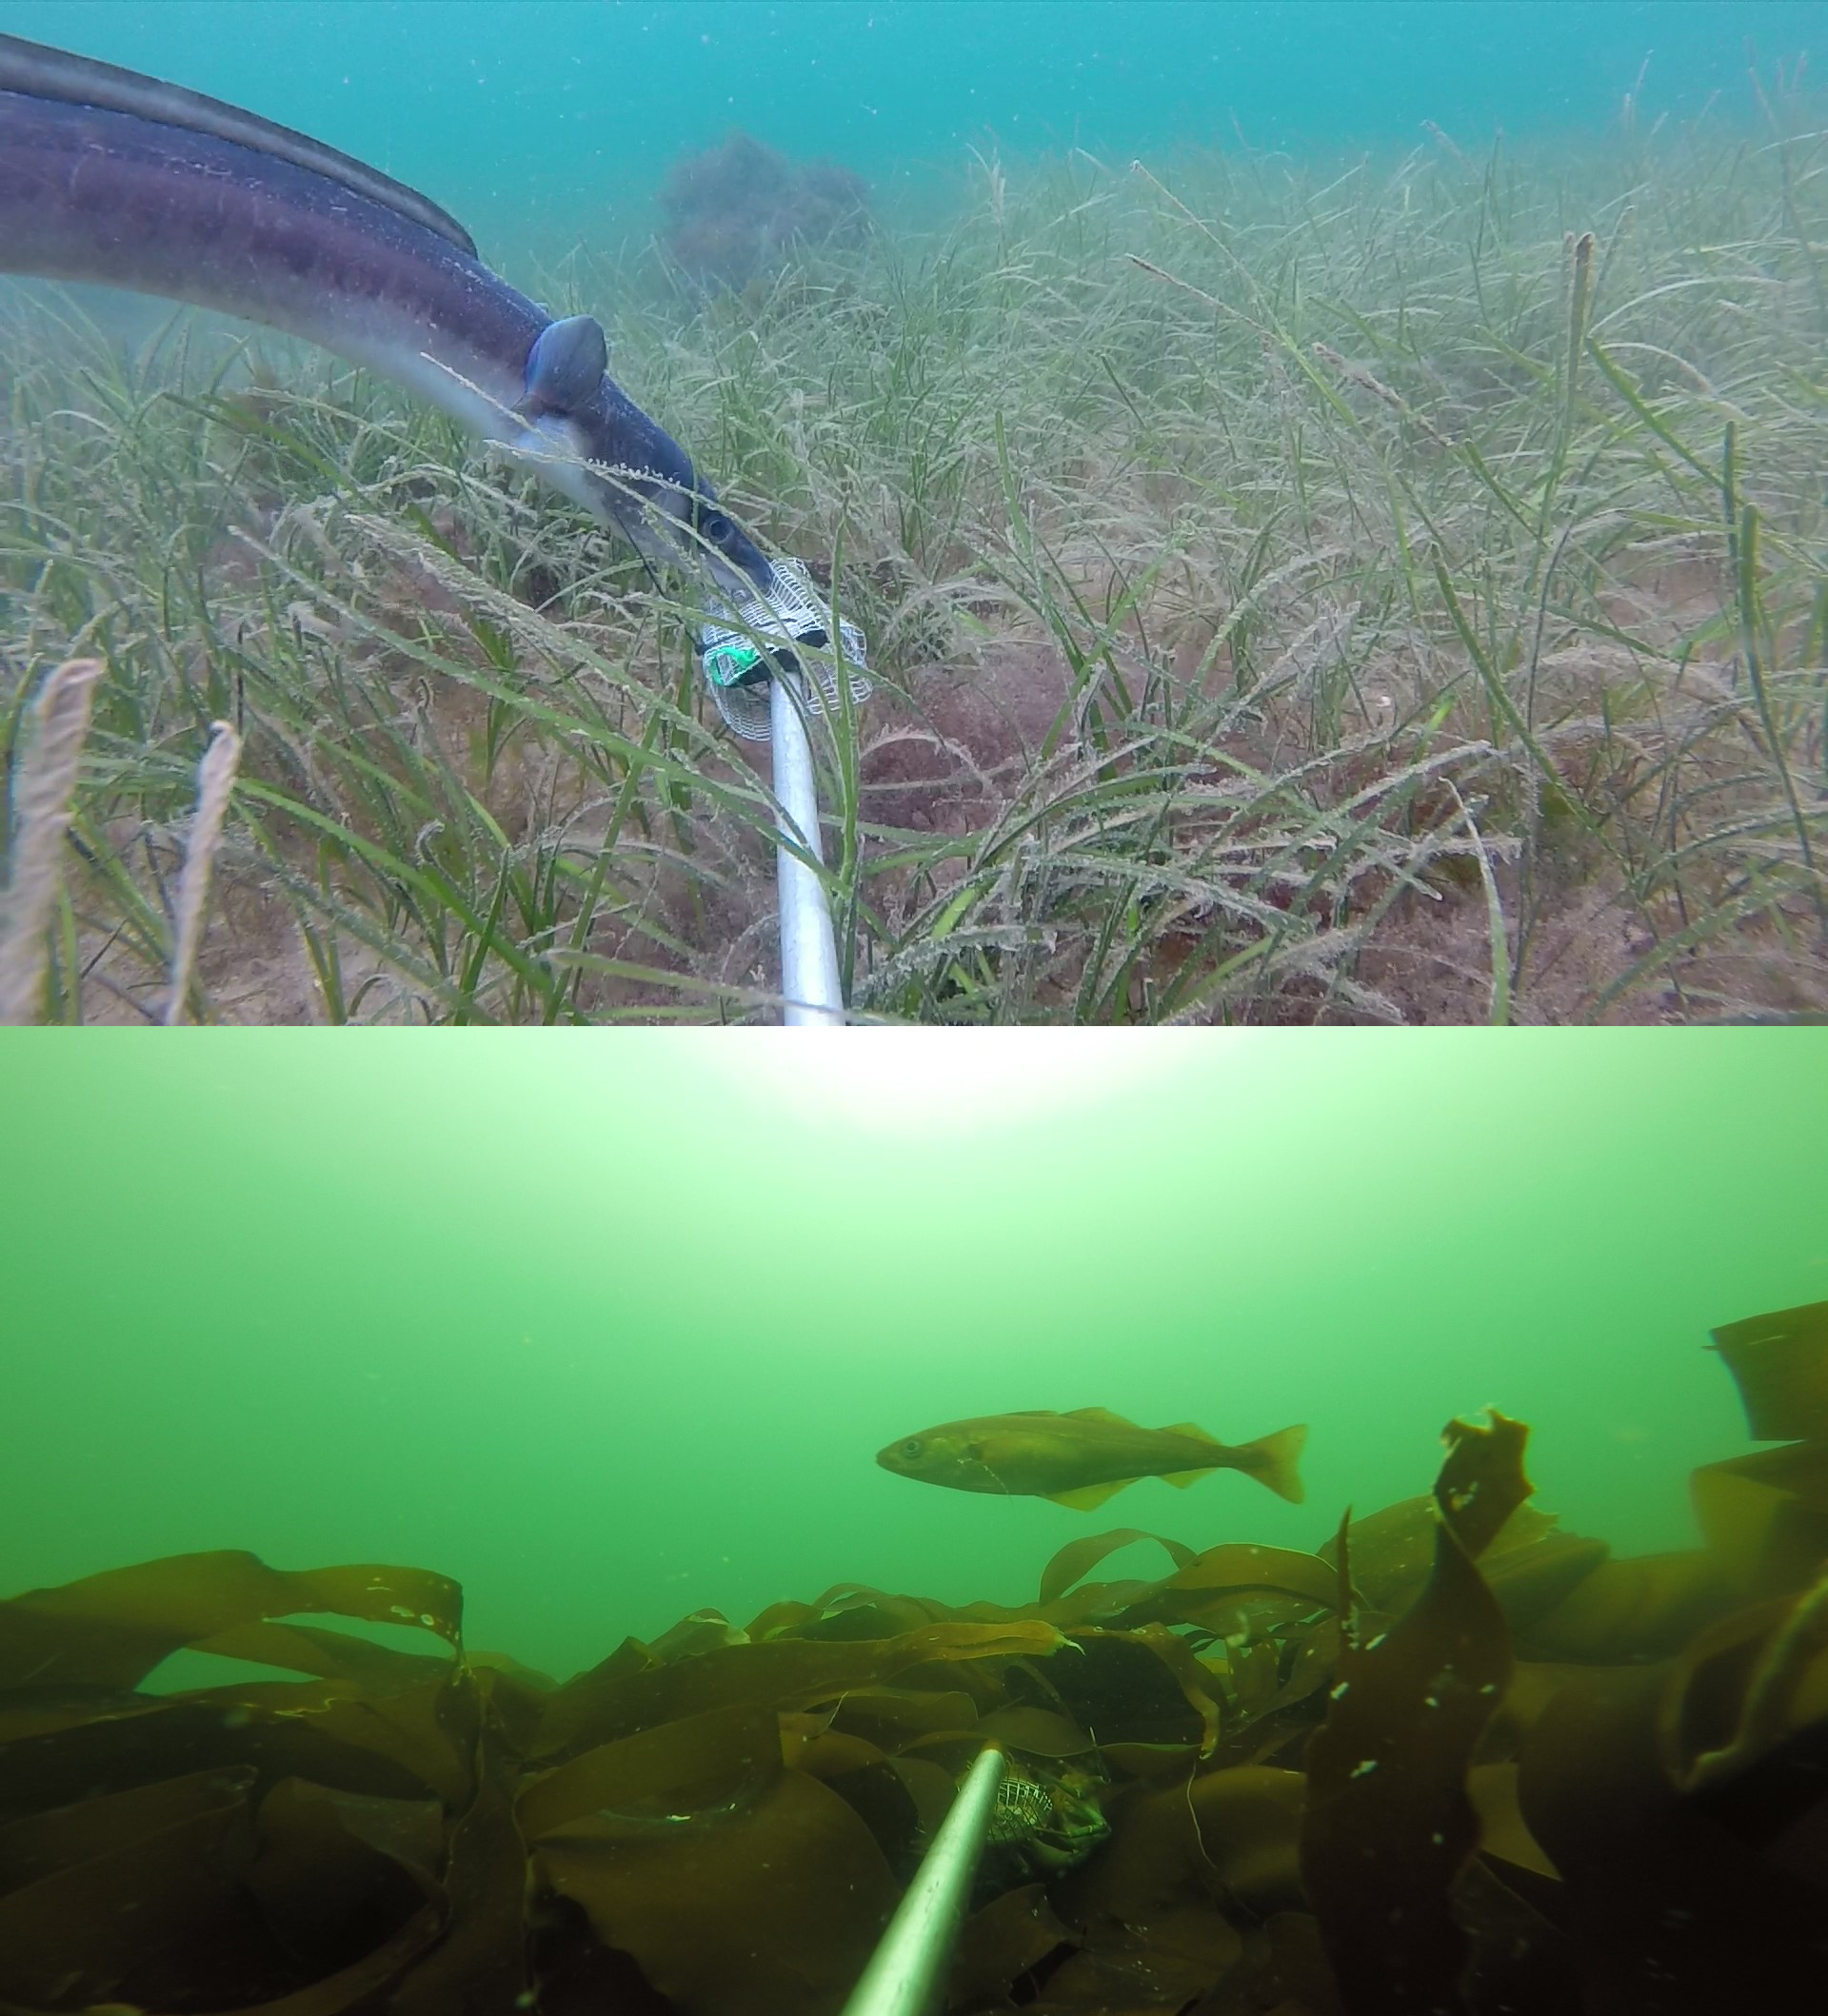
2.2. Fish Assemblage Sampling
2.3. Statistical Analysis
3. Results
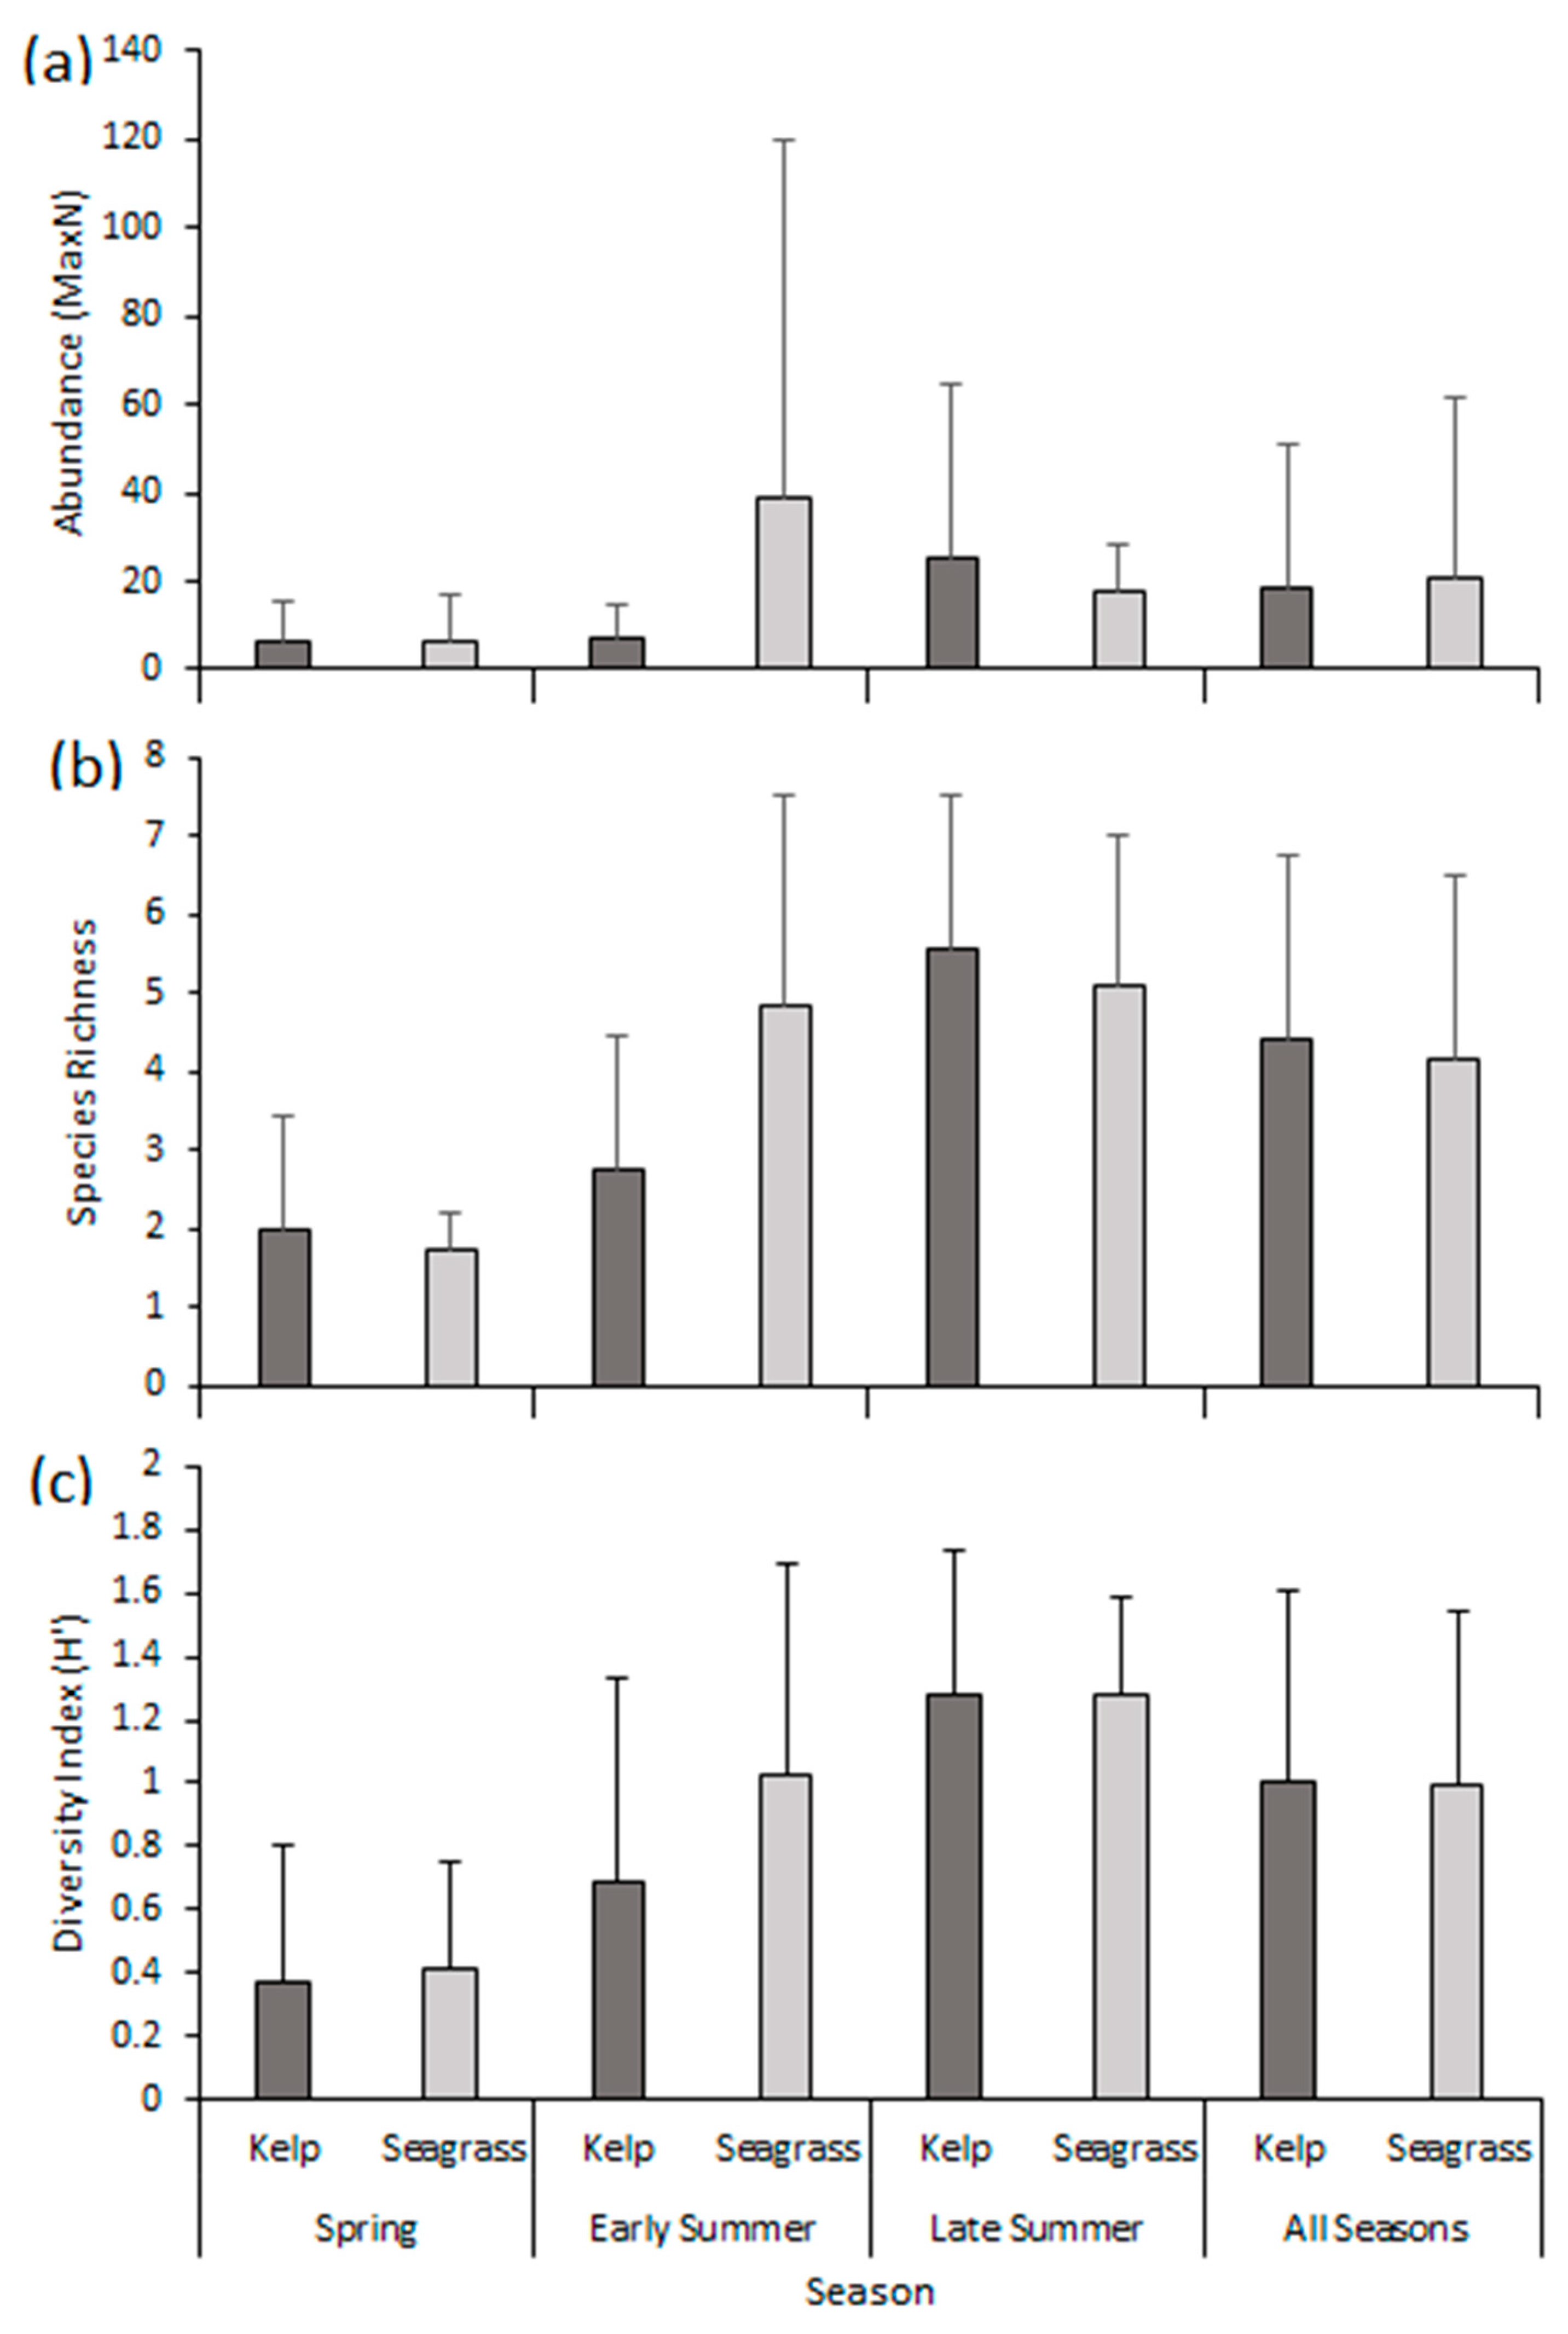
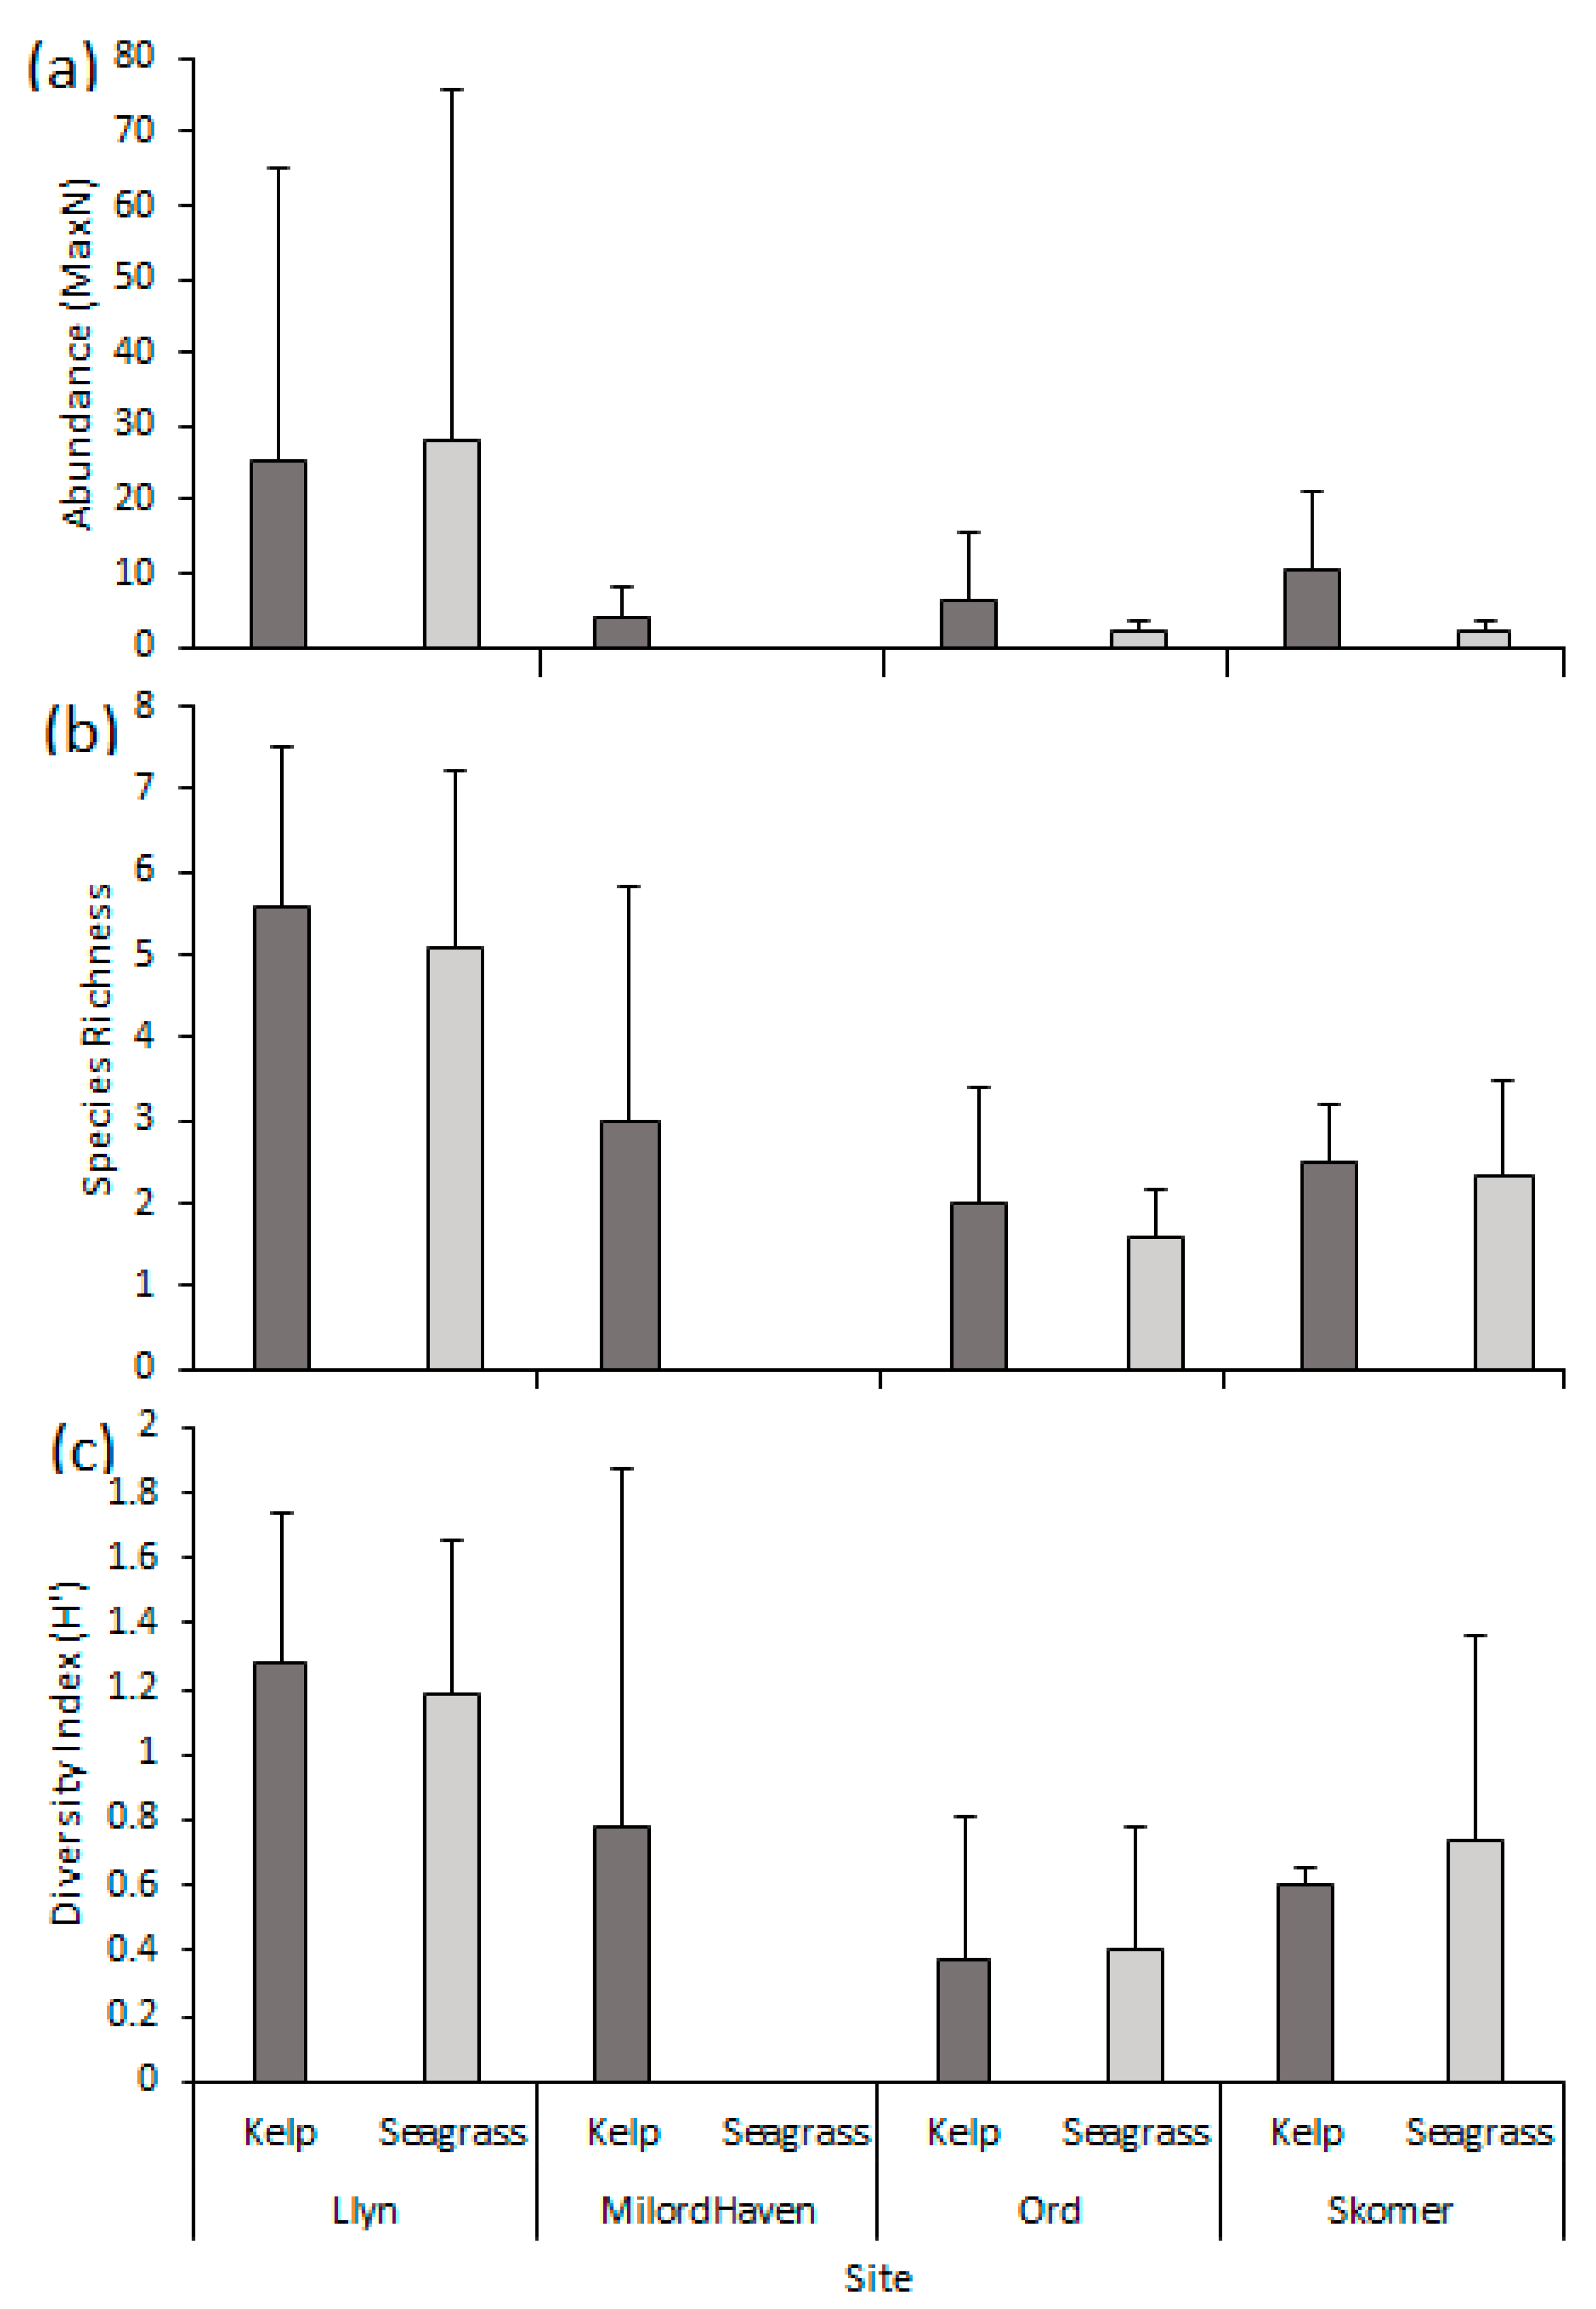
3.1. Abundance
3.2. Species Richness
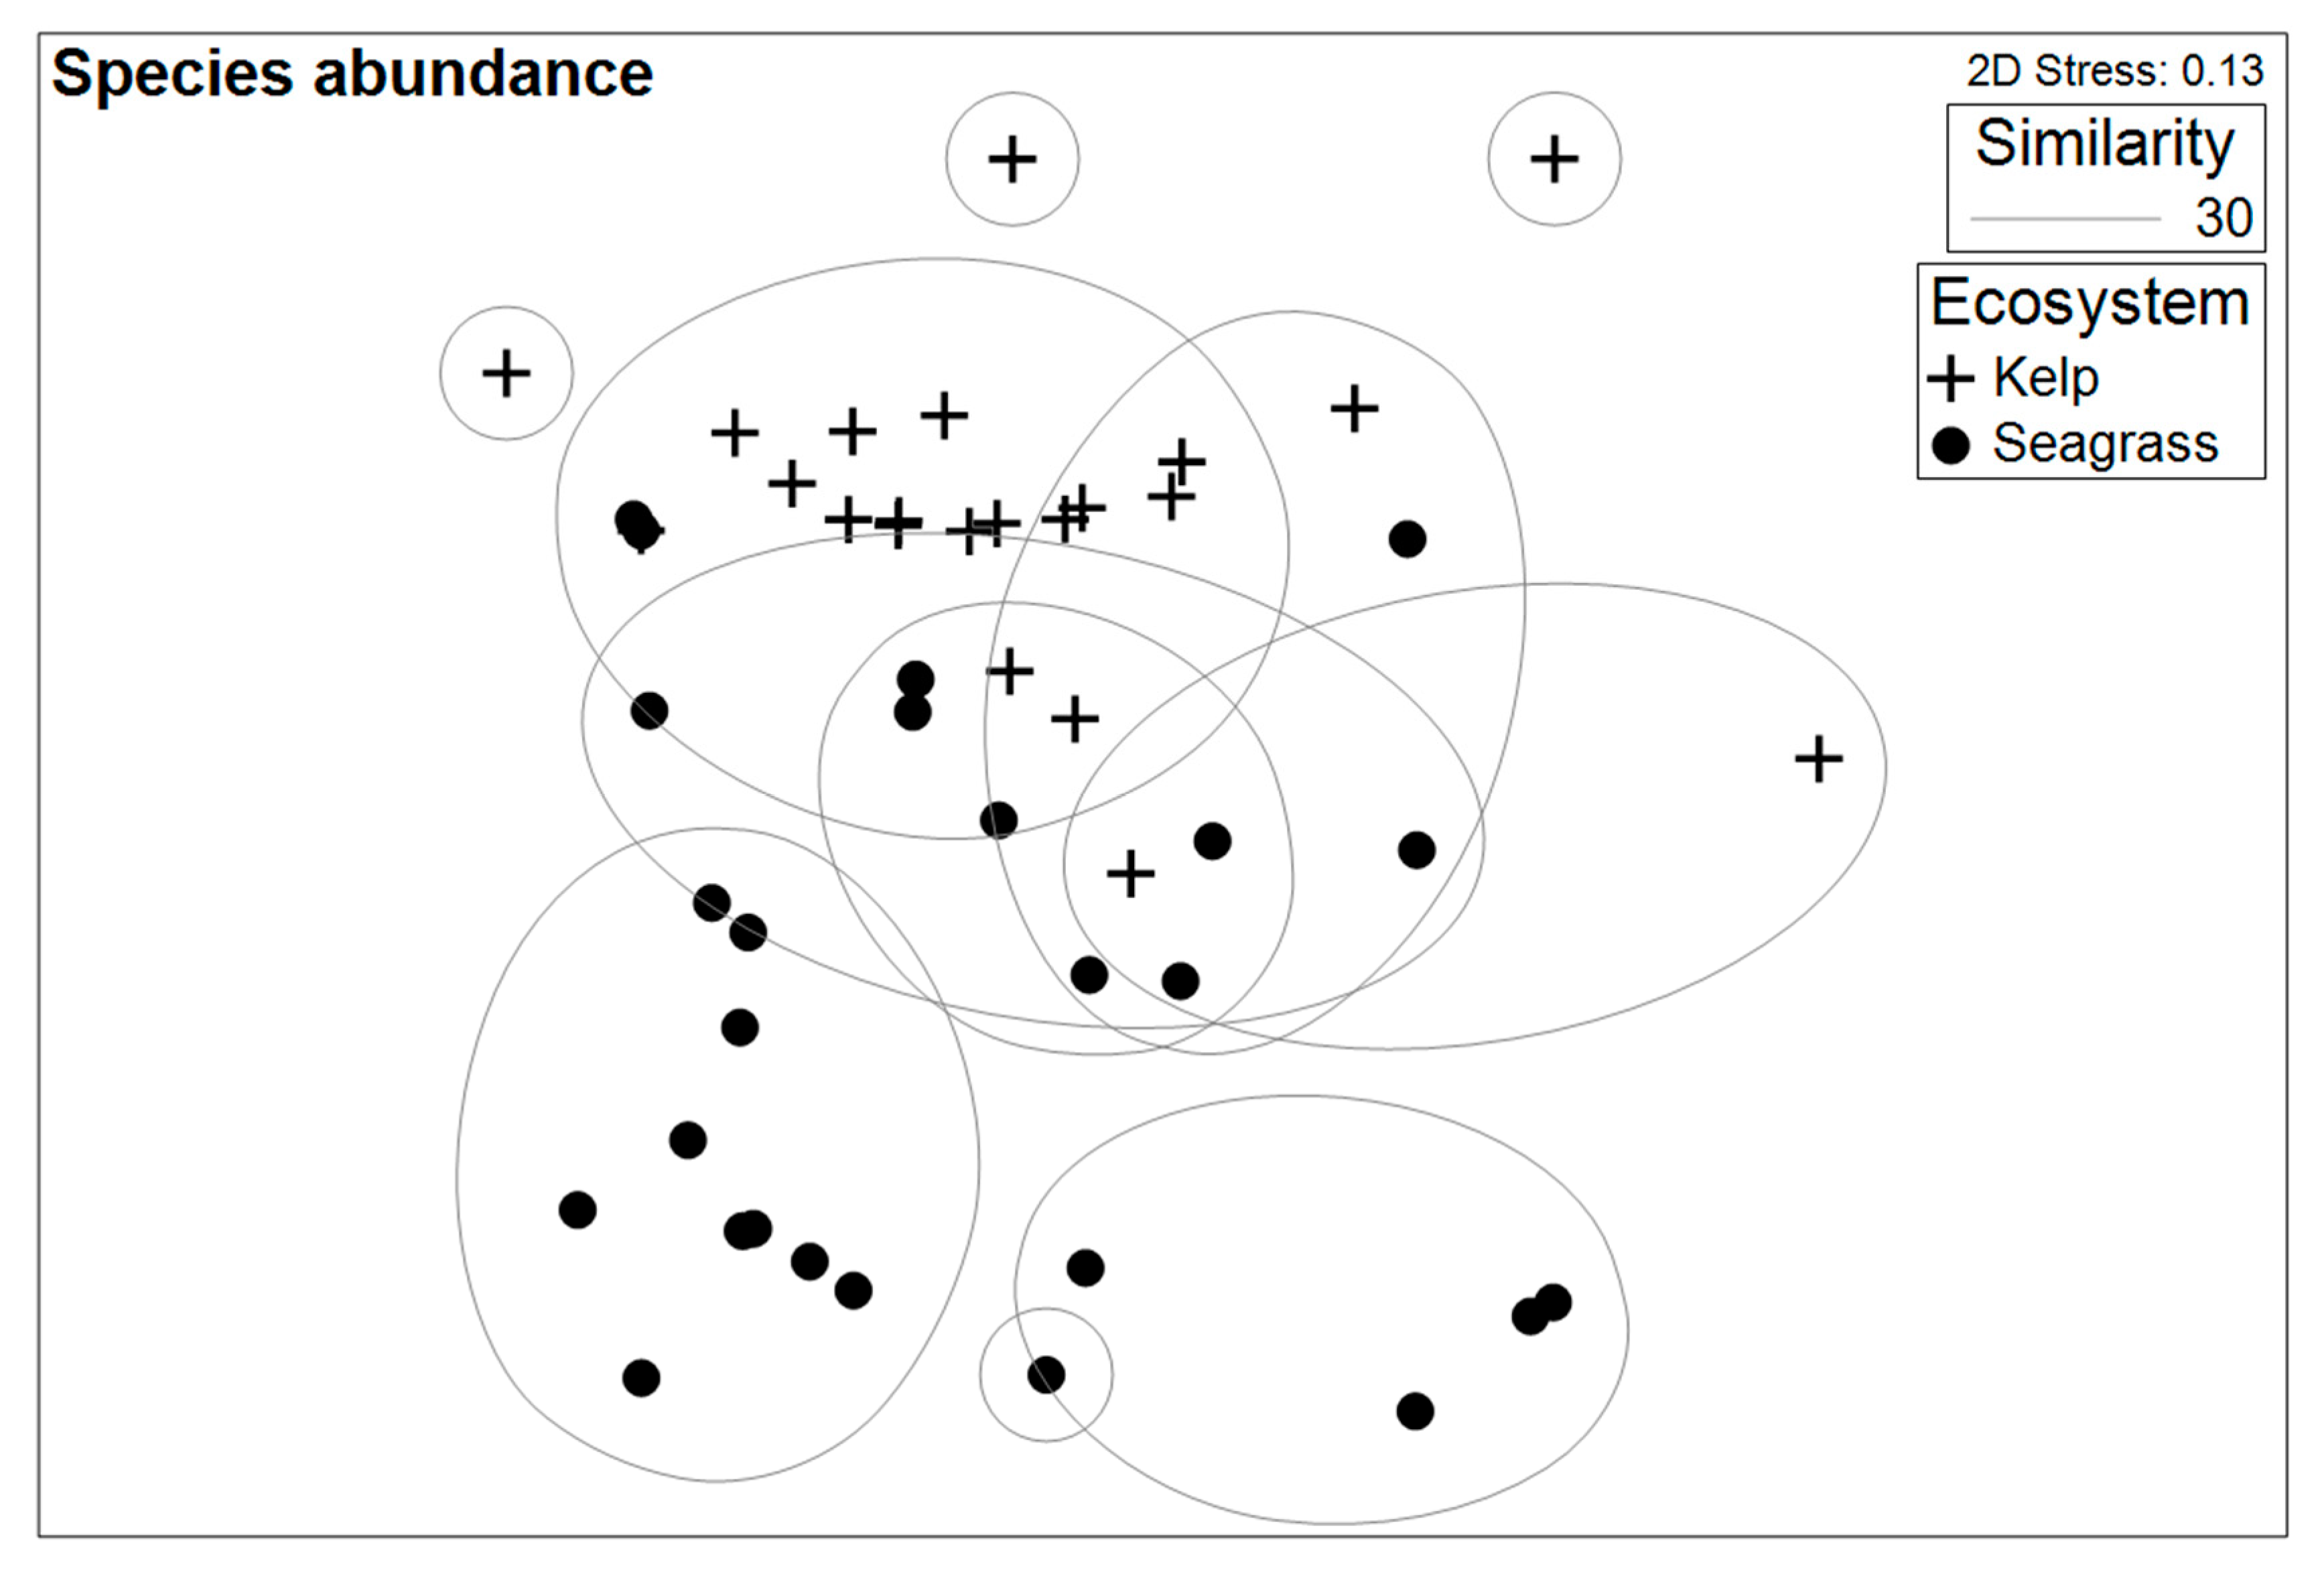
3.3. Species Assemblage
3.4. Commercial Assemblage
4. Discussion
5. Conclusions
Author Contributions
Funding
Acknowledgments
Conflicts of Interest
Appendix A

| Location | Ecosystem | April | May | June | July | August | September |
|---|---|---|---|---|---|---|---|
| Loch Eishort | SG | 5 (3) | |||||
| K | 4 (3) | ||||||
| Milford Haven | SG | (2) | (3) | ||||
| K | (3) | 2 (2) | (3) | ||||
| Skomer | SG | (2) | 3 | (3) | |||
| K | (3) | 2 (1) | (3) | ||||
| Porth Dinllaen | SG | 2 (6) | 4 (1) | 13 (3) | |||
| K | (4) | (1) | 4 (4) | ||||
| Bardsey | K | 10 (13) |
References
- Rice, J.C.; Garcia, S.M. Fisheries, Food Security, Climate Change, and Biodiversity: Characteristics of the Sector and Perspectives on Emerging Issues. ICES J. Mar. Sci. 2011, 68, 1343–1353. [Google Scholar] [CrossRef]
- Béné, C.; Barange, M.; Subasinghe, R.; Pinstrup-Andersen, P.; Merino, G.; Hemre, G.-I.; Williams, M. Feeding 9 Billion by 2050—Putting Fish Back on the Menu. Food Secur. 2015, 7, 261–274. [Google Scholar] [CrossRef]
- FAO. The State of World Fisheries and Aquaculture 2018—Meeting the Sustainable Development Goals; FAO: Rome, Italy, 2018. [Google Scholar]
- Hilborn, R.; Ovando, D. Reflections on the Success of Traditional Fisheries Management. ICES J. Mar. Sci. 2014, 71, 1040–1046. [Google Scholar] [CrossRef]
- Perry, D.; Staveley, T.A.B.; Gullström, M. Habitat Connectivity of Fish in Temperate Shallow-Water Seascapes. Front. Mar. Sci. 2018, 4, 440. [Google Scholar] [CrossRef]
- Nagelkerken, I.; Sheaves, M.; Baker, R.; Connolly, R.M. The Seascape Nursery: A Novel Spatial Approach to Identify and Manage Nurseries for Coastal Marine Fauna. Fish Fish. 2015, 16, 362–371. [Google Scholar] [CrossRef]
- Nordlund, L.M.; Unsworth, R.K.F.; Gullström, M.; Cullen-Unsworth, L.C. Global Significance of Seagrass Fishery Activity. Fish Fish. 2018, 19, 399–412. [Google Scholar] [CrossRef]
- Bertelli, C.M.; Unsworth, R.K.F. Protecting the Hand That Feeds Us: Seagrass (Zostera marina) Serves as Commercial Juvenile Fish Habitat. Mar. Pollut. Bull. 2014, 83, 425–429. [Google Scholar] [CrossRef]
- Dean, T.A.; Haldorson, L.; Laur, D.R.; Jewett, S.C.; Blanchard, A. The Distribution of Nearshore Fishes in Kelp and Eelgrass Communities in Prince William Sound, Alaska: Associations with Vegetation and Physical Habitat Characteristics. Environ. Biol. Fishes 2000, 57, 271–287. [Google Scholar] [CrossRef]
- Smale, D.A.; Burrows, M.T.; Moore, P.; O’Connor, N.; Hawkins, S.J. Threats and Knowledge Gaps for Ecosystem Services Provided by Kelp Forests: A Northeast Atlantic Perspective. Ecol. Evol. 2013, 3, 4016–4038. [Google Scholar] [CrossRef]
- Steneck, R.S.; Graham, M.H.; Bourque, B.J.; Corbett, D.; Erlandson, J.M.; Estes, J.A.; Tegner, M.J. Kelp Forest Ecosystems: Biodiversity, Stability, Resilience and Future. Environ. Conserv. 2017, 29, 436–459. [Google Scholar] [CrossRef]
- Lilley, R.J.; Unsworth, R.K.F. Atlantic Cod (Gadus morhua) Benefits from the Availability of Seagrass (Zostera marina) Nursery Habitat. Glob. Ecol. Conserv. 2014, 2, 367–377. [Google Scholar] [CrossRef]
- Heck Jnr, K.L.; Hays, G.; Orth, R.J. Critical Evaluation of the Nursery Role Hypothesis for Seagrass Meadows. Mar. Ecol. Prog. Ser. 2003, 253, 123–136. [Google Scholar] [CrossRef]
- Christianen, M.J.A.; van Belzen, J.; Herman, P.M.J.; van Katwijk, M.M.; Lamers, L.P.M.; van Leent, P.J.M.; Bouma, T.J. Low-Canopy Seagrass Beds Still Provide Important Coastal Protection Services. PLoS ONE 2013, 8, e62413. [Google Scholar] [CrossRef] [PubMed]
- Waycott, M.; Duarte, C.M.; Carruthers, T.J.B.; Orth, R.J.; Dennison, W.C.; Olyarnik, S.; Calladine, A.; Fourqurean, J.W.; Heck, K.L.; Hughes, A.R.; et al. Accelerating Loss of Seagrasses across the Globe Threatens Coastal Ecosystems. Proc. Natl. Acad. Sci. USA 2009, 106, 12377–12381. [Google Scholar] [CrossRef] [PubMed]
- Hughes, A.R.; Williams, S.L.; Duarte, C.M.; Heck, K.L.; Waycott, M. Associations of Concern: Declining Seagrasses and Threatened Dependent Species. Front. Ecol. Environ. 2009, 7, 242–246. [Google Scholar] [CrossRef]
- Krumhansl, K.A.; Okamoto, D.K.; Rassweiler, A.; Novak, M.; Bolton, J.J.; Cavanaugh, K.C.; Connell, S.D.; Johnson, C.R.; Konar, B.; Ling, S.D.; et al. Global Patterns of Kelp Forest Change over the Past Half-Century. Proc. Natl. Acad. Sci. USA 2016, 113, 13785–13790. [Google Scholar] [CrossRef]
- Griffiths, L.L.; Connolly, R.M.; Brown, C.J. Critical Gaps in Seagrass Protection Reveal the Need to Address Multiple Pressures and Cumulative Impacts. Ocean Coast. Manag. 2020, 183, 104946. [Google Scholar] [CrossRef]
- Vergés, A.; Doropoulos, C.; Malcolm, H.A.; Skye, M.; Garcia-Pizá, M.; Marzinelli, E.M.; Campbell, A.H.; Ballesteros, E.; Hoey, A.S.; Vila-Concejo, A.; et al. Long-Term Empirical Evidence of Ocean Warming Leading to Tropicalization of Fish Communities, Increased Herbivory, and Loss of Kelp. Proc. Natl. Acad. Sci. USA 2016, 113, 13791–13796. [Google Scholar] [CrossRef]
- Sundblad, G.; Bergström, U.; Sandström, A.; Eklöv, P. Nursery Habitat Availability Limits Adult Stock Sizes of Predatory Coastal Fish. ICES J. Mar. Sci. 2014, 71, 672–680. [Google Scholar] [CrossRef]
- Begg, G.A.; Friedland, K.D.; Pearce, J.B. Stock Identification and Its Role in Stock Assessment and Fisheries Management: An Overview. Fish. Res. 1999, 43, 1–8. [Google Scholar] [CrossRef]
- Britten, G.L.; Dowd, M.; Worm, B. Changing Recruitment Capacity in Global Fish Stocks. Proc. Natl. Acad. Sci. USA 2016, 113, 134–139. [Google Scholar] [CrossRef] [PubMed]
- Östman, Ö.; Eklöf, J.; Eriksson, B.K.; Olsson, J.; Moksnes, P.-O.; Bergström, U. Top-down Control as Important as Nutrient Enrichment for Eutrophication Effects in North Atlantic Coastal Ecosystems. J. Appl. Ecol. 2016, 53, 1138–1147. [Google Scholar] [CrossRef]
- Burkholder, J.M.; Tomasko, D.A.; Touchetter, B.W. Seagrasses and Eutrophication. J. Exp. Mar. Bio. Ecol. 2007, 350, 46–72. [Google Scholar] [CrossRef]
- Donadi, S.; Austin, Å.N.; Bergström, U.; Eriksson, B.K.; Hansen, J.P.; Jacobson, P.; Sundblad, G.; van Regteren, M.; Eklöf, J.S. A Cross-Scale Trophic Cascade from Large Predatory Fish to Algae in Coastal Ecosystems. Proceedings. Biol. Sci. 2017, 284, 20170045. [Google Scholar] [CrossRef] [PubMed]
- Tegner, M.; Dayton, P.K. Ecosystem Effects of Fishing in Kelp Forest Communities. ICES J. Mar. Sci. 2000, 57, 579–589. [Google Scholar] [CrossRef]
- Lefcheck, J.S.; Hughes, B.B.; Johnson, A.J.; Pfirrmann, B.W.; Rasher, D.B.; Smyth, A.R.; Williams, B.L.; Beck, M.W.; Orth, R.J. Are Coastal Habitats Important Nurseries? A Meta-analysis. Conserv. Lett. 2019, 12, e12645. [Google Scholar] [CrossRef]
- Lorentsen, S.H.; Sjøtun, K.; Grémillet, D. Multi-Trophic Consequences of Kelp Harvest. Biol. Conserv. 2010, 143, 2054–2062. [Google Scholar] [CrossRef]
- Kritzer, J.P.; DeLucia, M.-B.; Greene, E.; Shumway, C.; Topolski, M.F.; Thomas-Blate, J.; Chiarella, L.A.; Davy, K.B.; Smith, K. The Importance of Benthic Habitats for Coastal Fisheries. Bioscience 2016, 66, 274–284. [Google Scholar] [CrossRef]
- Unsworth, R.K.F.; Peters, J.R.; McCloskey, R.M.; Hinder, S.L. Optimising Stereo Baited Underwater Video for Sampling Fish and Invertebrates in Temperate Coastal Habitats. Estuar. Coast. Shelf Sci. 2014, 150, 281–287. [Google Scholar] [CrossRef]
- Schramm, K.D.; Harvey, E.S.; Goetze, J.S.; Travers, M.J.; Warnock, B.; Saunders, B.J. A Comparison of Stereo-BRUV, Diver Operated and Remote Stereo-Video Transects for Assessing Reef Fish Assemblages. J. Exp. Mar. Bio. Ecol. 2020, 524, 151273. [Google Scholar] [CrossRef]
- Schmid, K.; Reis-Filho, J.A.; Harvey, E.; Giarrizzo, T. Baited Remote Underwater Video as a Promising Nondestructive Tool to Assess Fish Assemblages in Clearwater Amazonian Rivers: Testing the Effect of Bait and Habitat Type. Hydrobiologia 2017, 784, 93–109. [Google Scholar] [CrossRef]
- Langlois, T.; Harvey, E.; Fitzpatrick, B.; Meeuwig, J.; Shedrawi, G.; Watson, D. Cost-Efficient Sampling of Fish Assemblages: Comparison of Baited Video Stations and Diver Video Transects. Aquat. Biol. 2010, 9, 155–168. [Google Scholar] [CrossRef]
- Watson, D.L.; Harvey, E.S.; Fitzpatrick, B.M.; Langlois, T.J.; Shedrawi, G. Assessing Reef Fish Assemblage Structure: How Do Different Stereo-Video Techniques Compare? Mar. Biol. 2010, 157, 1237–1250. [Google Scholar] [CrossRef]
- Mallet, D.; Pelletier, D. Underwater Video Techniques for Observing Coastal Marine Biodiversity: A Review of Sixty Years of Publications (1952–2012). Fish. Res. 2014, 154, 44–62. [Google Scholar] [CrossRef]
- Taylor, M.D.; Baker, J.; Suthers, I.M. Tidal Currents, Sampling Effort and Baited Remote Underwater Video (BRUV) Surveys: Are We Drawing the Right Conclusions? Fish. Res. 2013, 140, 96–104. [Google Scholar] [CrossRef]
- Heagney, E.C.; Lynch, T.P.; Babcock, R.C.; Suthers, I.M. Pelagic Fish Assemblages Assessed Using Mid-Water Baited Video: Standardising Fish Counts Using Bait Plume Size. Mar. Ecol. Prog. Ser. 2007, 350, 255–266. [Google Scholar] [CrossRef]
- Wraith, J.; Bay, J.; Park, M.; Minchinton, T.E.; Broad, A.; Davis, A.R. Bait Type Affects Fish Assemblages and Feeding Guilds Observed at Baited Remote Underwater Video Stations Tim Lynch. Mar. Ecol. Prog. Ser. 2013, 477, 189–199. [Google Scholar] [CrossRef]
- Hardinge, J.; Harvey, E.S.; Saunders, B.J.; Newman, S.J. A Little Bait Goes a Long Way: The Influence of Bait Quantity on a Temperate Fish Assemblage Sampled Using Stereo-BRUVs. J. Exp. Mar. Bio. Ecol. 2013, 449, 250–260. [Google Scholar] [CrossRef]
- Harvey, E.; Cappo, M.; Butler, J.; Hall, N.; Kendrick, G. Bait Attraction Affects the Performance of Remote Underwater Video Stations in Assessment of Demersal Fish Community Structure. Mar. Ecol. Prog. Ser. 2007, 350, 245–254. [Google Scholar] [CrossRef]
- Rhodes, N.; Wilms, T.; Baktoft, H.; Ramm, G.; Bertelsen, J.L.; Flávio, H.; Støttrup, J.G.; Kruse, B.M.; Svendsen, J.C. Comparing Methodologies in Marine Habitat Monitoring Research: An Assessment of Species-Habitat Relationships as Revealed by Baited and Unbaited Remote Underwater Video Systems. J. Exp. Mar. Bio. Ecol. 2020, 526, 151315. [Google Scholar] [CrossRef]
- Jones, R.E.; Griffin, R.; Januchowski-hartley, S.R.; Unsworth, R.K.F. The Influence of Bait on Remote Underwater Video Observations in Shallow-water Coastal Environments Associated with the North-Eastern Atlantic. PeerJ 2020, 8, e9744. [Google Scholar] [CrossRef] [PubMed]
- Gladstone, W.; Lindfield, S.; Coleman, M.; Kelaher, B. Optimisation of Baited Remote Underwater Video Sampling Designs for Estuarine Fish Assemblages. J. Exp. Mar. Bio. Ecol. 2012, 429, 28–35. [Google Scholar] [CrossRef]
- Harasti, D.; Malcolm, H.; Gallen, C.; Coleman, M.A.; Jordan, A.; Knott, N.A. Appropriate Set Times to Represent Patterns of Rocky Reef Fishes Using Baited Video. J. Exp. Mar. Bio. Ecol. 2015, 463, 173–180. [Google Scholar] [CrossRef]
- Clarke, K.; Gorley, R. PRIMER v5, v6 & v7: User Manual/Tutorial; Primer-E: Plymouth, UK, 2015; Volume 91, pp. 192–296. [Google Scholar]
- Anderson, M.J. Permutational Multivariate Analysis of Variance (PERMANOVA). Wiley StatsRef Stat. Ref. Online 2017, 1–15. [Google Scholar] [CrossRef]
- Watson, D.L.; Harvey, E.S.; Kendrick, G.A.; Nardi, K.; Anderson, M.J. Protection from Fishing Alters the Species Composition of Fish Assemblages in a Temperate-Tropical Transition Zone. Mar. Biol. 2007, 152, 1197–1206. [Google Scholar] [CrossRef]
- Grant, W.; Bowen, B. Shallow Population Histories in Deep Evolutionary Lineages of Marine Fishes: Insights from Sardines and Anchovies and Lessons for Conservation. J. Hered. 1998, 89, 415–426. [Google Scholar] [CrossRef]
- Fishbase. Gobiusculus flavescens, Two-Spotted Goby. Available online: http://www.fishbase.org/summary/74 (accessed on 5 January 2018).
- Patzner, R.A. The Biology of Gobies; Science Publishers: Hauppauge, NY, USA, 2011. [Google Scholar]
- Fosså, J.H.; Helge, J. The Ecology of the Two-spot Goby (Gobiusculus flavescens Fabricius): The Potential for Cod Enhancement. ICES Mar. Sei. Syrap 1991, 192, 147–155. [Google Scholar]
- Pihl, L.; Baden, S.; Kautsky, N.; Rönnbäck, P.; Söderqvist, T.; Troell, M.; Wennhage, H. Shift in Fish Assemblage Structure Due to Loss of Seagrass Zostera marina Habitats in Sweden. Estuar. Coast. Shelf Sci. 2006, 67, 123–132. [Google Scholar] [CrossRef]
- Borg, Å.; Pihl, L.; Wennhage, H. Habitat Choice by Juvenile Cod (Gadus morhua) on Sandy Soft Bottoms with Different Vegetation Types. Oceanogr. Lit. Rev. 1998, 45, 556–557. [Google Scholar]
- Pinnegar, J.K.; Wright, P.J.; Maltby, K.; Garrett, A. The Impacts of Climate Change on Fisheries, Relevant to the Coastal and Marine Environment around the UK. MCCIP Sci. Rev. 2020, 2020, 456–581. [Google Scholar] [CrossRef]
- Fishbase. Pollachius pollachius, Pollack: Fisheries, Gamefish. Available online: http://www.fishbase.org/summary/34 (accessed on 5 January 2018).
- Charrier, G.; Durand, J.; Quiniou, L.; Laroche, J. An Investigation of the Population Genetic Structure of Pollack (Pollachius pollachius) Based on Microsatellite Markers. ICES J. Mar. Sci. 2006, 63, 1705–1709. [Google Scholar] [CrossRef]
- Cohen, D.M. Gadiform Fishes of the World (Order Gadiformes): An Annotated and Illustrated Catalogue of Cods, Hakes, Grenadiers, and Other Gadiform Fishes Known to Date; FAO UN: Quebec City, QC, Canada, 1990. [Google Scholar]
- Alonso-Fernández, A.; Otero, J.; Villegas-Ríos, D.; Bañón, R. Drivers of Body Size Changes in a Pollachius pollachius Stock in NE Atlantic Coastal Waters. Mar. Ecol. Prog. Ser. 2014, 511, 223–235. [Google Scholar] [CrossRef]
- Peters, J.R.; McCloskey, R.M.; Hinder, S.L.; Unsworth, R.K.F. Motile Fauna of Sub-Tidal Zostera Marina Meadows in England and Wales. Mar. Biodivers. 2015, 45, 647–654. [Google Scholar] [CrossRef]
- Stoner, A.W.; Ottmar, M.L. Relationships between Size-Specific Sediment Preferences and Burial Capabilities in Juveniles of Two Alaska Flatfishes. J. Exp. Mar. Bio. Ecol. 2003, 282, 85–101. [Google Scholar] [CrossRef]
- Atkinson, C.J.L.; Bergmann, M.; Kaiser, M.J. Habitat Selection in Whiting. J. Fish Biol. 2004, 64, 788–793. [Google Scholar] [CrossRef]
- Henderson, P.A.A. Long-Term Study of Whiting, Merlangius merlangus (L) Recruitment and Population Regulation in the Severn Estuary, UK. J. Sea Res. 2019, 155, 101825. [Google Scholar] [CrossRef]
- Elliott, S.; Turrell, W.; Heath, M.; Bailey, D. Juvenile Gadoid Habitat and Ontogenetic Shift Observations Using Stereo-Video Baited Cameras. Mar. Ecol. Prog. Ser. 2017, 568, 123–135. [Google Scholar] [CrossRef]
- Henderson, C.J.; Gilby, B.L.; Lee, S.Y.; Stevens, T. Contrasting Effects of Habitat Complexity and Connectivity on Biodiversity in Seagrass Meadows. Mar. Biol. 2017, 164, 117. [Google Scholar] [CrossRef]
- Unsworth, R.; De León, P.; Series, S.G.; Jompa, J.; Smith, D.; Bell, J. High Connectivity of Indo-Pacific Seagrass Fish Assemblages with Mangrove and Coral Reef Habitats. Mar. Ecol. Prog. Ser. 2008, 353, 213–224. [Google Scholar] [CrossRef]
- Perry, D.; Staveley, T.A.B.; Hammar, L.; Meyers, A.; Lindborg, R.; Gullström, M. Temperate Fish Community Variation over Seasons in Relation to Large-Scale Geographic Seascape Variables. Can. J. Fish. Aquat. Sci. 2017. [Google Scholar] [CrossRef]
- Unsworth, R.K.F.; Nordlund, L.M.; Cullen-Unsworth, L.C. Seagrass Meadows Support Global Fisheries Production. Conserv. Lett. 2019, 12, e12566. [Google Scholar] [CrossRef]


| Metrics | Milford Haven | Skomer | Porthdinllaen | Bardsey Island | Loch Eishort |
|---|---|---|---|---|---|
| Coordinates | 51.703711, −5.079408 | 51.738621, −5.279614 | 52.941880, −4.561587 | 52.752350, −4.794178 | 57.164910, −5.941416 |
| Zostera marina | ✓ | ✓ | ✓ | ✕ | ✓ |
| Laminaria spp. | ✓ | ✓ | ✓ | ✓ | ✓ |
| Industry | ✓ | ✕ | ✕ | ✕ | ✕ |
| Statutory Protection | ✕ | ✓ | ✓ | ✓ | ✓ |
| Depth Range (m) | 3.0–6.2 | 2.6–6.3 | 3.0–7.5 | 2.0–13.5 | 2.5–6.1 |
| Ecosystem | Species | Similarity Contribution (%) |
|---|---|---|
| Kelp | Gobiusculus flavescens | 35.13 |
| Pollachius pollachius | 22.07 | |
| Labrus bergylta | 20.81 | |
| Seagrass | Scyliorhinus canicula | 30.44 |
| Merlangius merlangus | 24.7 | |
| Callionymus lyra | 12.31 | |
| Pomatoschistus microps | 8.88 |
| Species | Dissimilarity Contribution (%) |
|---|---|
| Gobiusculus flavescens | 12.73 |
| Pollachius pollachius | 9.53 |
| Merlangius merlangus | 8.92 |
| Scyliorhinus canicula | 8.92 |
| Species | Ecosystem | Abundance |
|---|---|---|
| Gadus morhua | Kelp | 0.18 ± 0.85 |
| Seagrass | 0.22 ± 0.42 | |
| Pollachius pollachius | Kelp | 2.18 ± 3.40 |
| Seagrass | 0.63 ± 1.50 | |
| Flatfish | Kelp | 0.00 ± 0.00 |
| Seagrass | 0.22 ± 0.71 | |
| Merlangius merlangus | Kelp | 0.00 ± 0.00 |
| Seagrass | 2.2 ± 4.05 |
© 2020 by the authors. Licensee MDPI, Basel, Switzerland. This article is an open access article distributed under the terms and conditions of the Creative Commons Attribution (CC BY) license (http://creativecommons.org/licenses/by/4.0/).
Share and Cite
Furness, E.; Unsworth, R.K.F. Demersal Fish Assemblages in NE Atlantic Seagrass and Kelp. Diversity 2020, 12, 366. https://doi.org/10.3390/d12100366
Furness E, Unsworth RKF. Demersal Fish Assemblages in NE Atlantic Seagrass and Kelp. Diversity. 2020; 12(10):366. https://doi.org/10.3390/d12100366
Chicago/Turabian StyleFurness, Evie, and Richard K.F. Unsworth. 2020. "Demersal Fish Assemblages in NE Atlantic Seagrass and Kelp" Diversity 12, no. 10: 366. https://doi.org/10.3390/d12100366
APA StyleFurness, E., & Unsworth, R. K. F. (2020). Demersal Fish Assemblages in NE Atlantic Seagrass and Kelp. Diversity, 12(10), 366. https://doi.org/10.3390/d12100366