Article

What is the Long-Term Effect of Bamboo Dominance on Adult Trees in the Araucaria Forest? A Comparative Analysis between Two Successional Stages in Southern Brazil

1
EMBRAPA Forestry - Brazilian Agriculture Research Corporation, Estrada da Ribeira, km 111, Caixa Postal 319, 83411-000 Colombo, Paraná, Brazil
2
Rua Doutor Nelson de Souza Pinto, 420, CEP 82200 060 Curitiba, Paraná, Brazil
*
Author to whom correspondence should be addressed.
Diversity 2019, 11(9), 165; https://doi.org/10.3390/d11090165
Submission received: 25 July 2019 / Revised: 4 September 2019 / Accepted: 10 September 2019 / Published: 16 September 2019

Abstract

:
Bamboos are opportunistic species that rapidly colonize open areas following forest disturbance, forming dense clusters that alter the regenerative processes and maintain lower levels of tree diversity. Widespread forest degradation, especially in Latin America and Asia, and human-induced introduction have allowed native and non-native bamboo species to thrive, hindering successional pathways that would otherwise lead to more diverse forests; such a large-scale phenomenon is a key concern in the conservation of forest resources around the globe. Despite previous research on this phenomenon, little is known about the long-term effects of bamboo dominance on forest structure and composition and the corresponding interaction with natural regeneration. As such, we sought to evaluate the long-term effects of bamboo dominance on the dynamics of adult forest populations considering two forest types (Bamboo Forest—BF and Araucaria Forest—AF) over an 11-year period in the Embrapa Research Station in Caçador, Brazil. We monitored 20 plots (15 × 15 m) in each forest type where we tagged, identified, and measured the height and diameter of all the trees taller than 1.5 m (H) and diameter at breast height (DBH) greater than 3.18 cm. Comparisons were based on forest species diversity and structure parameters. In BF, diversity of species increased after the bamboo die-off that occurred in 2006 with a subsequent reduction in the number of pioneer species overtime. However, secondary species remained stagnant demonstrating that recruitment and transition into higher size classes is restricted to the immediate die-off aftermath. On the other hand, plant diversity and structure in the relatively bamboo-free AF were stable with secondary species accounting for the most richness. Our results confirm that BF maintains significantly lower levels of diversity that are restricted to pioneer species; AF structure and diversity are not significantly affected by bamboo die-off and recolonization; and BF tree species are caught in a closed cycle of arrested successional development. The widespread presence of bamboos as dominant species in the region should become a part of the conversation pertaining to forest management and conservation in Brazil and other countries in south America and Asia.

1. Introduction

As an opportunistic species, bamboos have traits such as clonality, leaves with a relatively low C cost, and high rates of photosynthesis, that can lead to them becoming invasive or rapidly colonizing areas following forest degradation or disturbance [1,2]. This can affect the capacity of recruits from the seed bank of forest species to develop successfully [3,4,5,6,7,8] and ultimately lead to lower levels of tree diversity [9]. Despite the information already present in the literature regarding the influence of bamboos on forest dynamics, little is known about the long-term effects of bamboo dominance on adult forest populations and the corresponding interaction with natural regeneration. As such, we present an 11-year study that comparatively evaluates the diversity and structure of the adult populations in two forest types (an old-growth and a bamboo forest) within a region of subtropical humid forest of Southern Brazil that complements natural regeneration monitoring [8].
As the incidence of forests subjected to varying levels of disturbance becomes the norm around the planet, there is an increasing need to understand the ecological pathways that lead to their regeneration. In south America, some authors have raised concerns about the impact of bamboo dominance (Merostachys spp., Guadua spp., Chusquea spp.) on the conservation of natural forests in the region [10,11] as a consequence of intense forest degradation. The effect of limiting natural forest regeneration because of the creation of an environment unsuitable for other species survival [12] has been described in short-term [9,10,12] and medium-term studies [8]. However, we still have little information on whether the restrictive effects of bamboo on natural regeneration plays a similar role in the development of the adult forest structure and how this dynamic might unfold in the long-term. Ultimately, the studies based on regeneration dynamics show that forests dominated by bamboos not only maintain lower levels of diversity, but also indicate a trend of continued forest degradation where trees tend to be gradually replaced by bamboos [6,7].
The subtropical humid forest of Southern Brazil (regionally known as Araucaria Forest) occurs throughout the Southern Brazilian highlands, where the vegetation is formed by a mixture of temperate and tropical flora. Several bamboo species occur naturally in this forest type, including Merostachys skvortzovii, M. multiramea, Chusquea meyeriana, and bamboo clusters used to be sparsely-distributed throughout the old-growth forests of the region [13,14]. Because of extensive forest degradation, including land conversion for agriculture, forest fires and logging, the presence of bamboo is becoming increasingly common in the remaining forest remnants. The Santa Catarina state forest inventory [15] published in 2013 noted that approximately half of the studied plots contained native bamboos, and there is potential for widespread decline in the quality of those forest fragments. Today, bamboo cover is mainly composed of M. skvortzovii (taquara-lixa), a native invasive species [16] with a life cycle of 30–32 years [17,18,19]. Its cycle ends with a synchronized flowering and seed dispersal after which a general die-off occurs; a new life cycle starts with seed germination that leads to a process of recolonization. The last die-off in the study region occurred between 2004 and 2006, with natural bamboo reestablishment observed in the beginning of as early as 2007. Despite the conservation issues, small-scale farmers throughout the region conducted a type of forest management through the use of bamboos to stake tomatoes, eggplants, and other crops.
As the first analysis in the region that aims to evaluate the long-term effects of bamboo dominance on the dynamics of adult forest populations, the present study offers insights necessary for the development of forest management practices and informed environmental regulations aiming at guaranteeing/restoring the integrity of forest ecosystems, particularly those affected by invasive species. Our general hypothesis is that the negative impact of a native bamboo species on forest diversity and structure continues beyond the short- and medium-term effects previously detected in the natural regeneration [7,9,10,12], creating conditions unsuitable for tree species to thrive and ultimately affecting the long-term diversity and structure of bamboo-dominated forests. Specifically, we predict that: (i) Bamboo Forest (BF) maintains significantly lower levels of diversity that are restricted to pioneer species; (ii) in Araucaria Forest (AF), the structure and diversity is not significantly affected by bamboo die-off and recolonization; and (iii) BF tree species have a synchronized dynamic linked to the bamboo die-off in a closed cycle of arrested successional development.

2. Materials and Methods
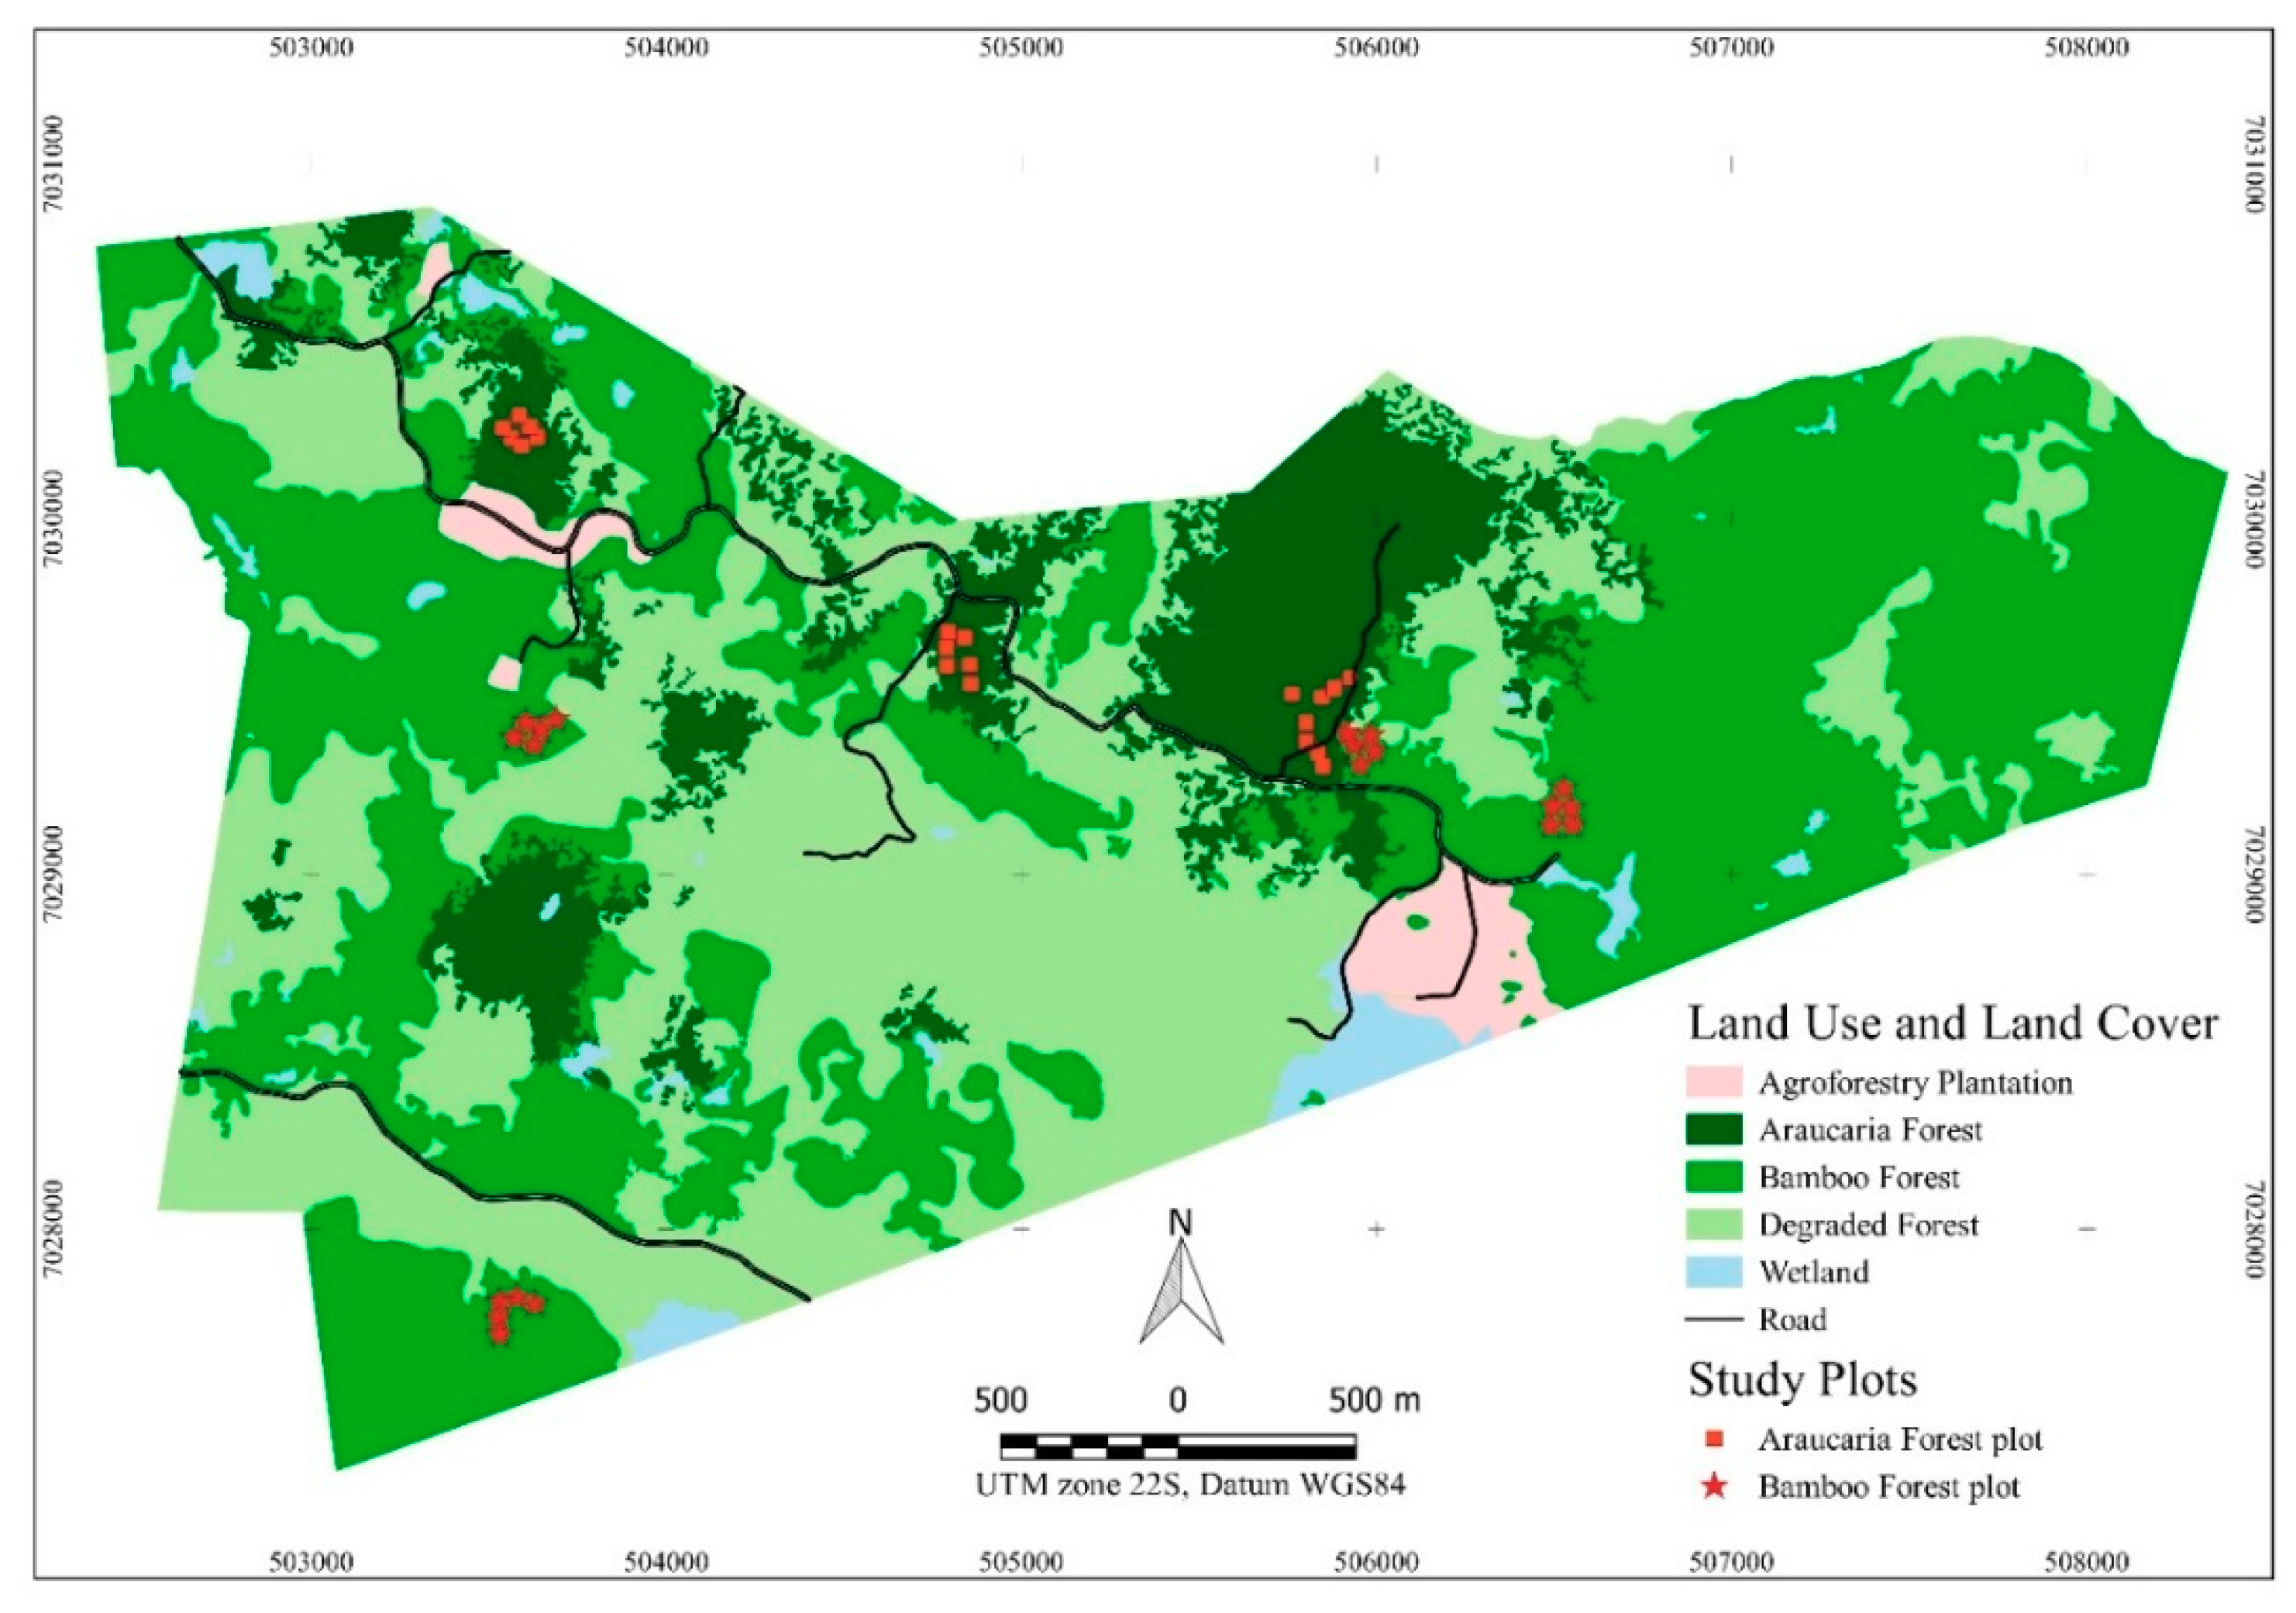
2.1. Study Area

This study was conducted in the Embrapa Research Station in Caçador (ERSC), Santa Catarina state, Brazil (26°50’32.69” and 26°52’36.73” S, 50°54’51.69” and 51°58’40.36” W). The region has a subtropical highland climate (Cfb) with high annual precipitation (approximately 1694 mm) and elevations above 800 m [14,20]. Because of the high level of endemic species and limited remaining original forest cover (< 5%), the subtropical humid forest of Southern Brazil (Araucaria forest) is considered as a hotspot for the conservation of biodiversity [21,22]. Around 20–25% of its range is currently covered by secondary forests because of strict environmental laws that prohibit any management; however, the legal restriction has made these forests susceptible to illegal deforestation and further degradation by invasive species [23].
The ERSC includes an area of 1157 ha (Figure 1) and has been under the stewardship of the government since 1948. The area was set aside because of large populations of Araucaria angustifolia (Bertol.) Kuntze and Ocotea porosa (Nees and C. Mart.) Barroso [24] in order to protect those species that were already threatened by overexploitation, as extensive harvesting throughout the late 19th and 20th centuries led them to be listed as threatened [25]. Different levels of selective logging and clearcutting occurred in the ERSC prior to and after 1948 which resulted in forest patches at different successional stages that vary from near pristine conditions to young forests. The pristine, or old-growth, forests in the ERSC, herein called Araucaria Forest (AF), are widely recognized as the region’s late successional stage [13,14,26]. As a response to the modification of the original forest structure and composition, various native bamboo species have shown intense population growth, creating near monospecific stands in some patches [11,27] and are referred to herein as Bamboo Forest (BF). Additionally, the ERSC also contains forest patches (referred as degraded forests in Figure 1) that have been subjected to various levels of degradation [28], especially logging and fire, and have lost the structural and compositional characteristics typical of old-growth forests (not included in the present study).

2.2. Methods

2.2.1. Data Collection

We conducted a comparative analysis of the tree dynamics in the two forest types over an 11-year period (2007–2018) with data collected in 2007, 2010, 2012, 2014, 2016, and 2018. The AF has a canopy dominated by A. angustifolia, with a wide variety of species occurring in the other strata where the bamboo M. skvortzovii is a sporadic component of the understory. The second forest type, BF, is young, secondary forest with a simplified structure and species composition with a single tree overstory layer of pioneer species (Mimosa scabrella, Vernonanthura discolor, and Piptocarpha angustifolia) and a dense understory layer at around 6 to 9 meters in height dominated by M. skvortzovii. In the study region, secondary forests dominated by pioneer species tend to follow a reasonably predictable successional pathway toward AF. As AF is expected to have a more stable population dynamic, it is ideal for comparative studies to aim at understanding the influence of an invasive [16,29] bamboo on the structure, diversity, and successional pathways of the young forests in Southern Brazil. As such, we initially analyzed the differences in tree species diversity and structure of the adult trees between the two forest types over time. Then, we evaluated the dynamics in terms of species’ ecological categories and its relation to succession.
We collected data from 40 plots of 225 m2 (15 × 15 m) randomly distributed in AF and BF (20 plots in each forest type, Figure 1), with a minimum distance of 100 m among plots. We tagged and measured the height and diameter of all trees with a minimum height of 1.5 m (H) and diameter at breast height (DBH) of 3.18 cm; these values are the threshold for trees to be considered as adult while smaller individuals were included as part of the recruitment population, described in Kellermann and Lacerda [8]. Based on Budowski [30], specialized literature [31], and personal experience, we classified species into ecological groups as: pioneer, secondary (including initial and late secondary groups), and late successional [8].

2.2.2. Data Analysis

To characterize the species diversity between forest types and among years for each forest type we used different diversity parameters based on collected and extrapolated data. For collected data, we used EstimateS v9.1 (Colwell 2013) to calculate the number of shared species between forest types (Sshared; without replacement configuration), number of species exclusive to each forest type (SExcl), and the total number of species (Stotal). We also used the iNEXT Online software (Hsin-Chu, Taiwan) [32] to calculate both empirical and extrapolated diversity as the effective number of species based on Hill numbers described by their q-values (q D): 0D, is the abundance of individual species, i.e., only presence is counted, simply representing species richness; 1D weighs species in proportion to their frequency and is the algebraic logarithmic transformation of Shannon–Wiener Index; 2D is the inverse of the Simpson concentration which places more weight on abundant species and discounts rare species [33]. Comparisons between forest types and among years using Hill numbers were considered significantly different in the case of non-overlapping confidence intervals. The different Hill numbers allow for the characterization and comparison between forest types’ diversity based on different aspects of their species composition and abundance, while SExcl and Sshared highlights the number of species that are exclusive to a forest type and how their diversity influences the overall diversity (Stotal).
We also constructed coverage-based rarefaction and extrapolation curves using iNEXT following Chao et al. [33]. iNEXT estimates were calculated using 500 bootstrap replications, a confidence interval of 0.95, and endpoint to be twice the smallest reference sample size or the maximum reference sample size, whichever is larger [33,34,35]. iNEXT is used to standardize samples to a common sample size or sample completeness. This method allows for the comparison of diversity estimates for equally large (with a common sample size) or equally complete (with a common sample coverage) samples enabling fair analysis of diversity between communities that may have different species pools or sampling intensities [31]. Complementary to the analysis based on empirical data, we also used the coverage-based rarefaction and extrapolation calculation of Hill numbers with a common baseline (completeness) [34]. Sample coverage represents the proportion of the total number of individuals in an assemblage that belong to the species represented in the sample.
We tested for differences in species diversity and composition over time between AF and BF using the nonparametric multi-response permutation procedures (MRPP) statistical analysis along with the indicator species analysis (ISA) in the PC-ORD v7.06 software (Wild Blueberry Media LLC, Corvalis, OR, USA) [36]. MRPP is a nonparametric test to assess the significant difference between two or more groups of sampling units that does not require distributional assumptions typical of parametric tests as these are rarely found in ecological data [37].
We used mixed models with repeated measures (MMRM) to assess the significance between forest types in relation to the number of individuals in the NCSS 2019 software (NCSS LLC, Kaysville, USA) [38]. For MMRM settings, we followed the recommendations in the NCSS manual [38] and the method outlined in Kellermann and Lacerda [8] in which AIC (Akaike information criterion) was used to compare model covariance structures among analyses where the lowest AIC value was chosen. Additionally, the settings were based on a single fixed factor (forest type, ecological group, or size class, depending on the analysis) without covariates and set the type of likelihood equation as restricted maximum likelihood (REML).
Forest structure analysis compared AF and BF during the 2007–2018 period and between years for AF and BF separately, and also for ecological classes for each forest type using the following parameters: density (no. of tree ha−1), basal area (m2 ha−1), and mean height (m), mean diameter at breast height—DBH (cm). Forest structure parameters were calculated using Mata Nativa 4 software (Cientec, Vicosa, Brazil) [39] and mixed models with repeated measures (MMRM) to assess the significance of the comparisons for the above listed parameters using the settings described previously. Height and DBH were also graphically depicted in classes for a detailed overview of the forest type structure with the minimum value being the threshold used for sampling inclusion (see data collection) and the overall maximum values found for height and DBH.

3. Results

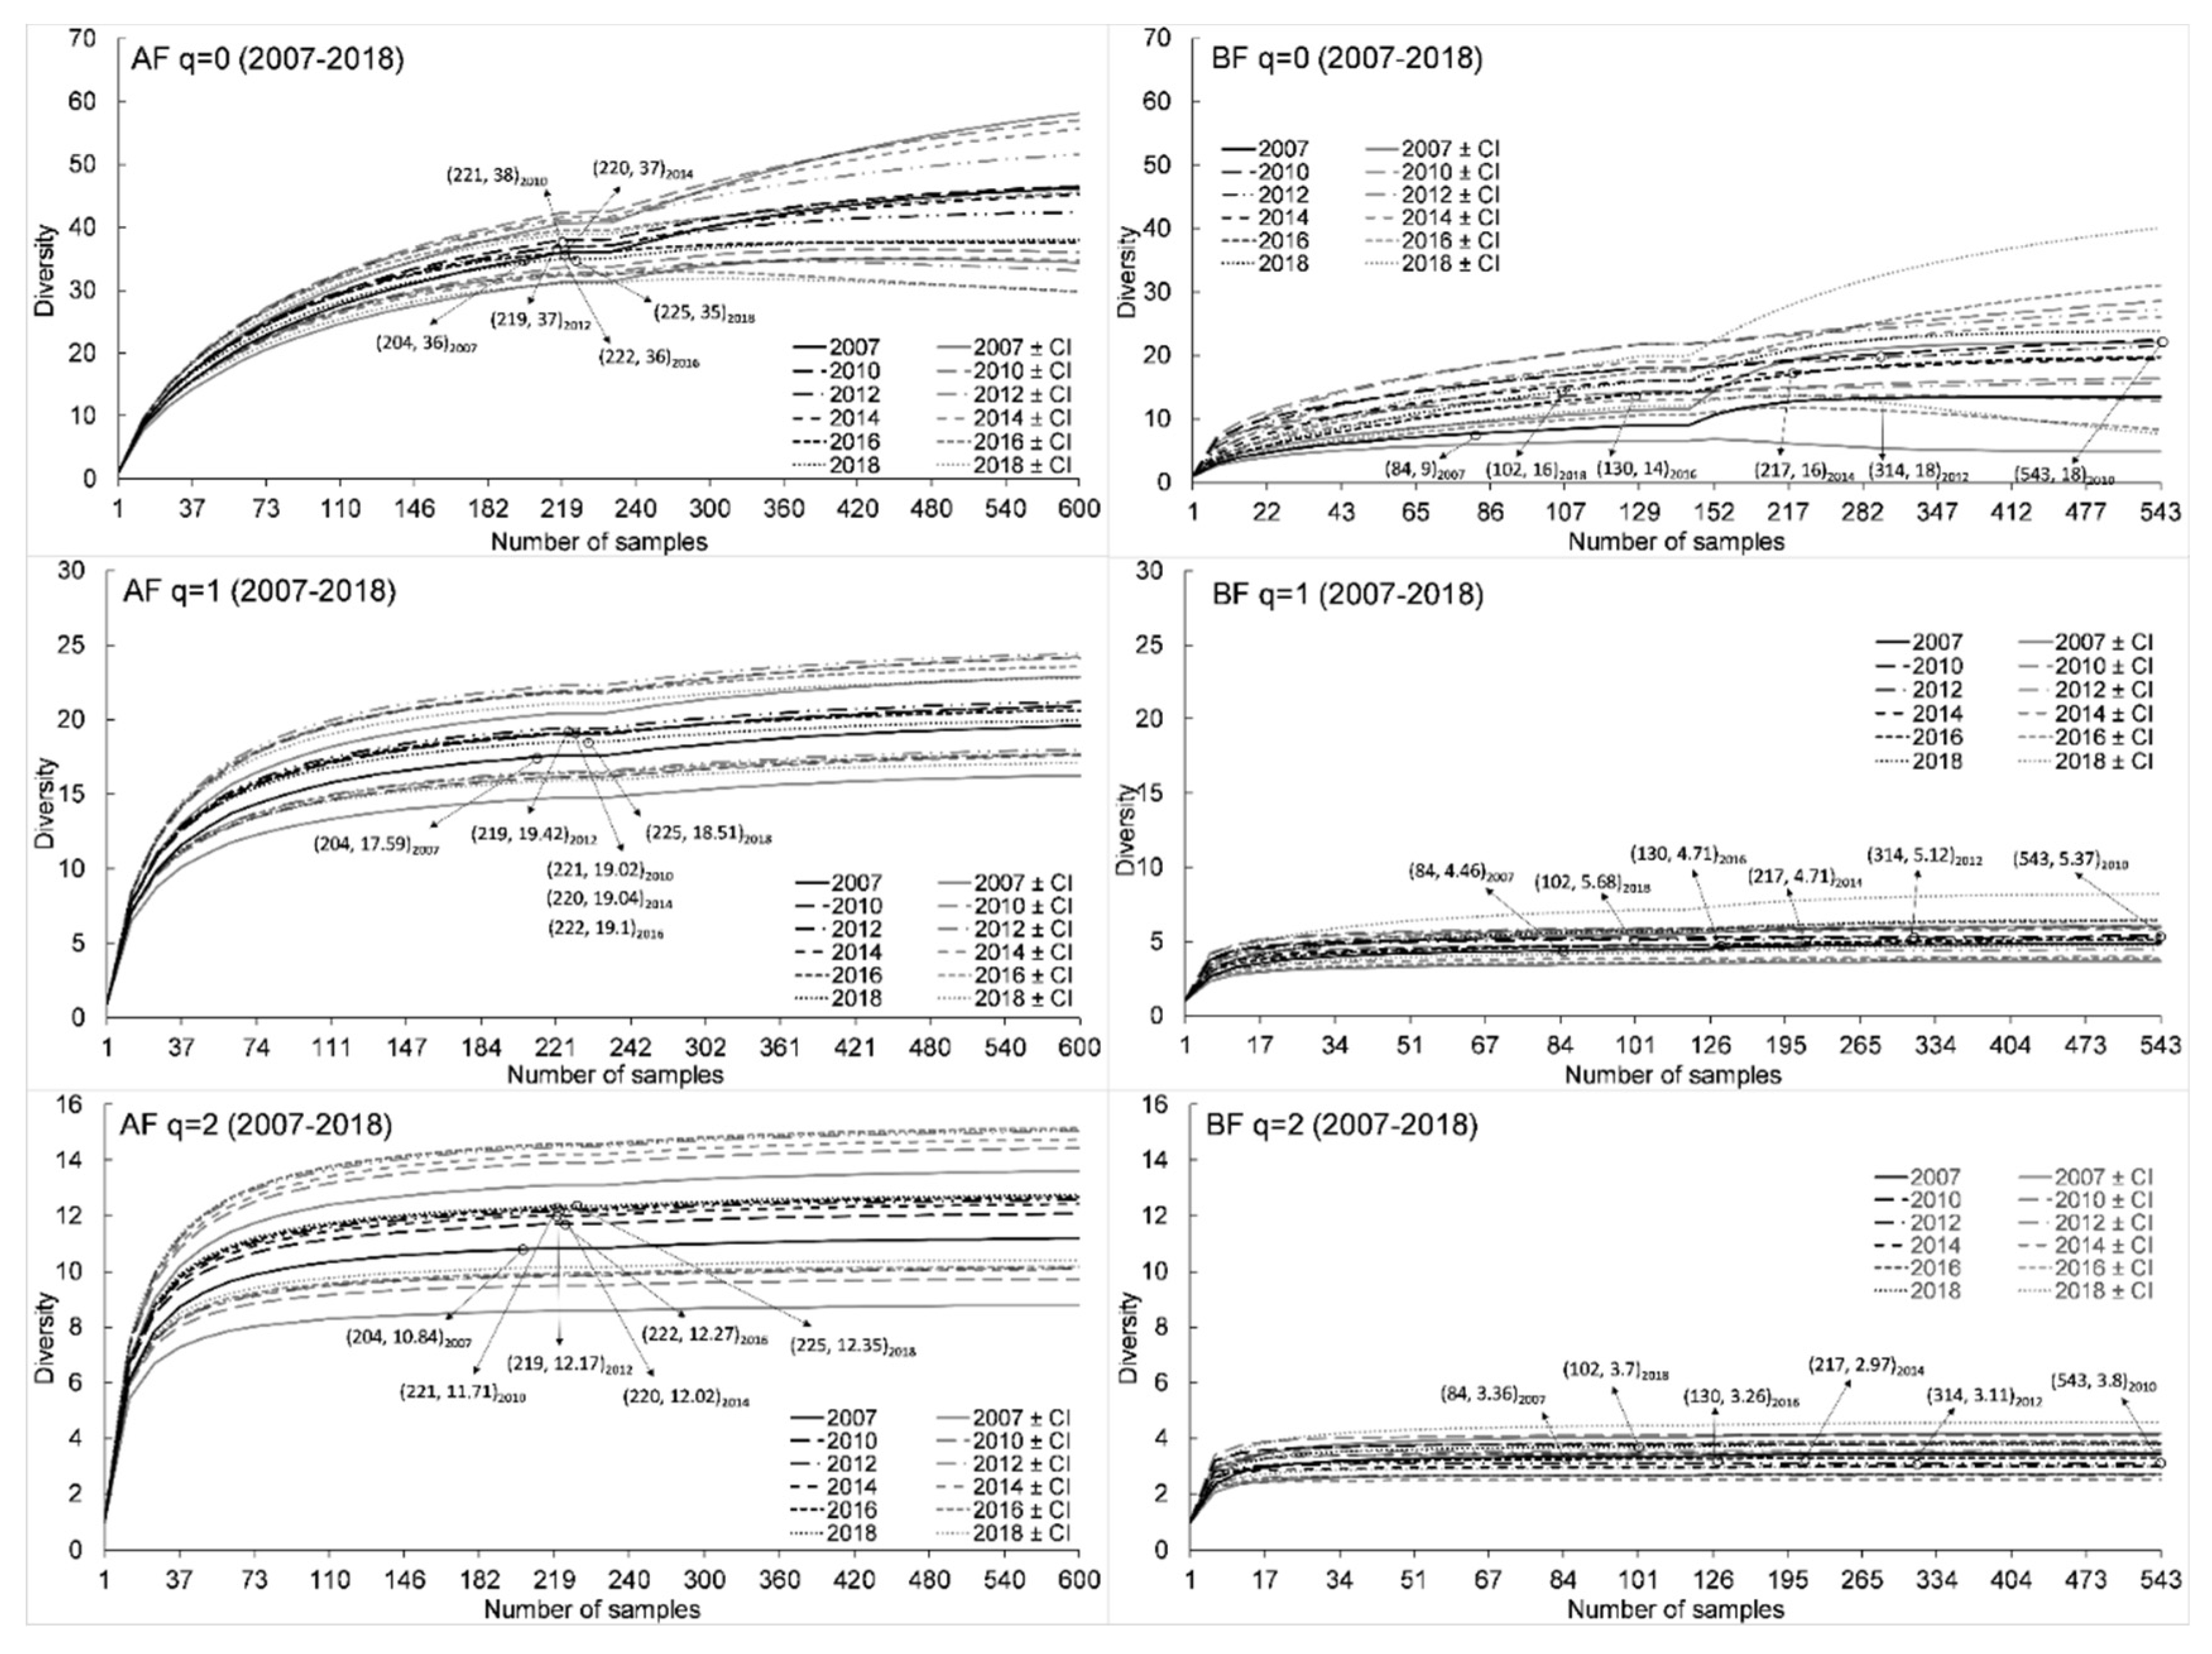
3.1. Species Diversity and Composition

The results based on empirical data showed that AF consistently maintained significantly higher values for all orders of Hill numbers over the years (Table 1, Figure A1). For species richness (0D), the effective number of species in AF were around twice the values in BF, varying between 35 and 38 in AF and 9 and 18 in BF; an exception was in 2007 in which AF had four times the value observed in BF. The diversity based on 1D and 2D showed AF with around three to four times more effective number of species than BF.
Overall richness (BF and AF together) increased sharply in the second survey (2010) reaching 52 species after which it declined consistently until 2018 when it reverted to the initial level recorded in 2007 (43 species). This pattern was also observed for the number of exclusive species (SExcl) that declined consistently for both forest types except for BF in 2010 when the value doubled in relation to the previous year (Table 1).
Coverage-based calculations of Hill numbers showed that the estimated mean values were consistently higher than the observed values for all Hill numbers, where the most prominent differences were found for richness (0D; 0–49%) and the smallest for Simpson (2D; 0–3%) (Table 2). The estimated Hill numbers also showed that there were no significant differences among years for both AF and BF (Table 2) but significant differences between forest types for all years (Table A1).
Species composition analysed by MRPP found significant differences between AF and BF for all years (Table 3). The complementary indicator species analysis showed that AF has a consistent group of six species that differentiates its composition from BF throughout the study (seven species in 2018), and all indicator species in AF are secondary or late successional. On the other hand, BF showed a more variable number of indicator species where it increased from two to six species by 2010 after which it declined in 2014 to three species, maintaining that level until 2018; out of the six indicator species (all years considered), five are pioneers and one is (early) secondary.

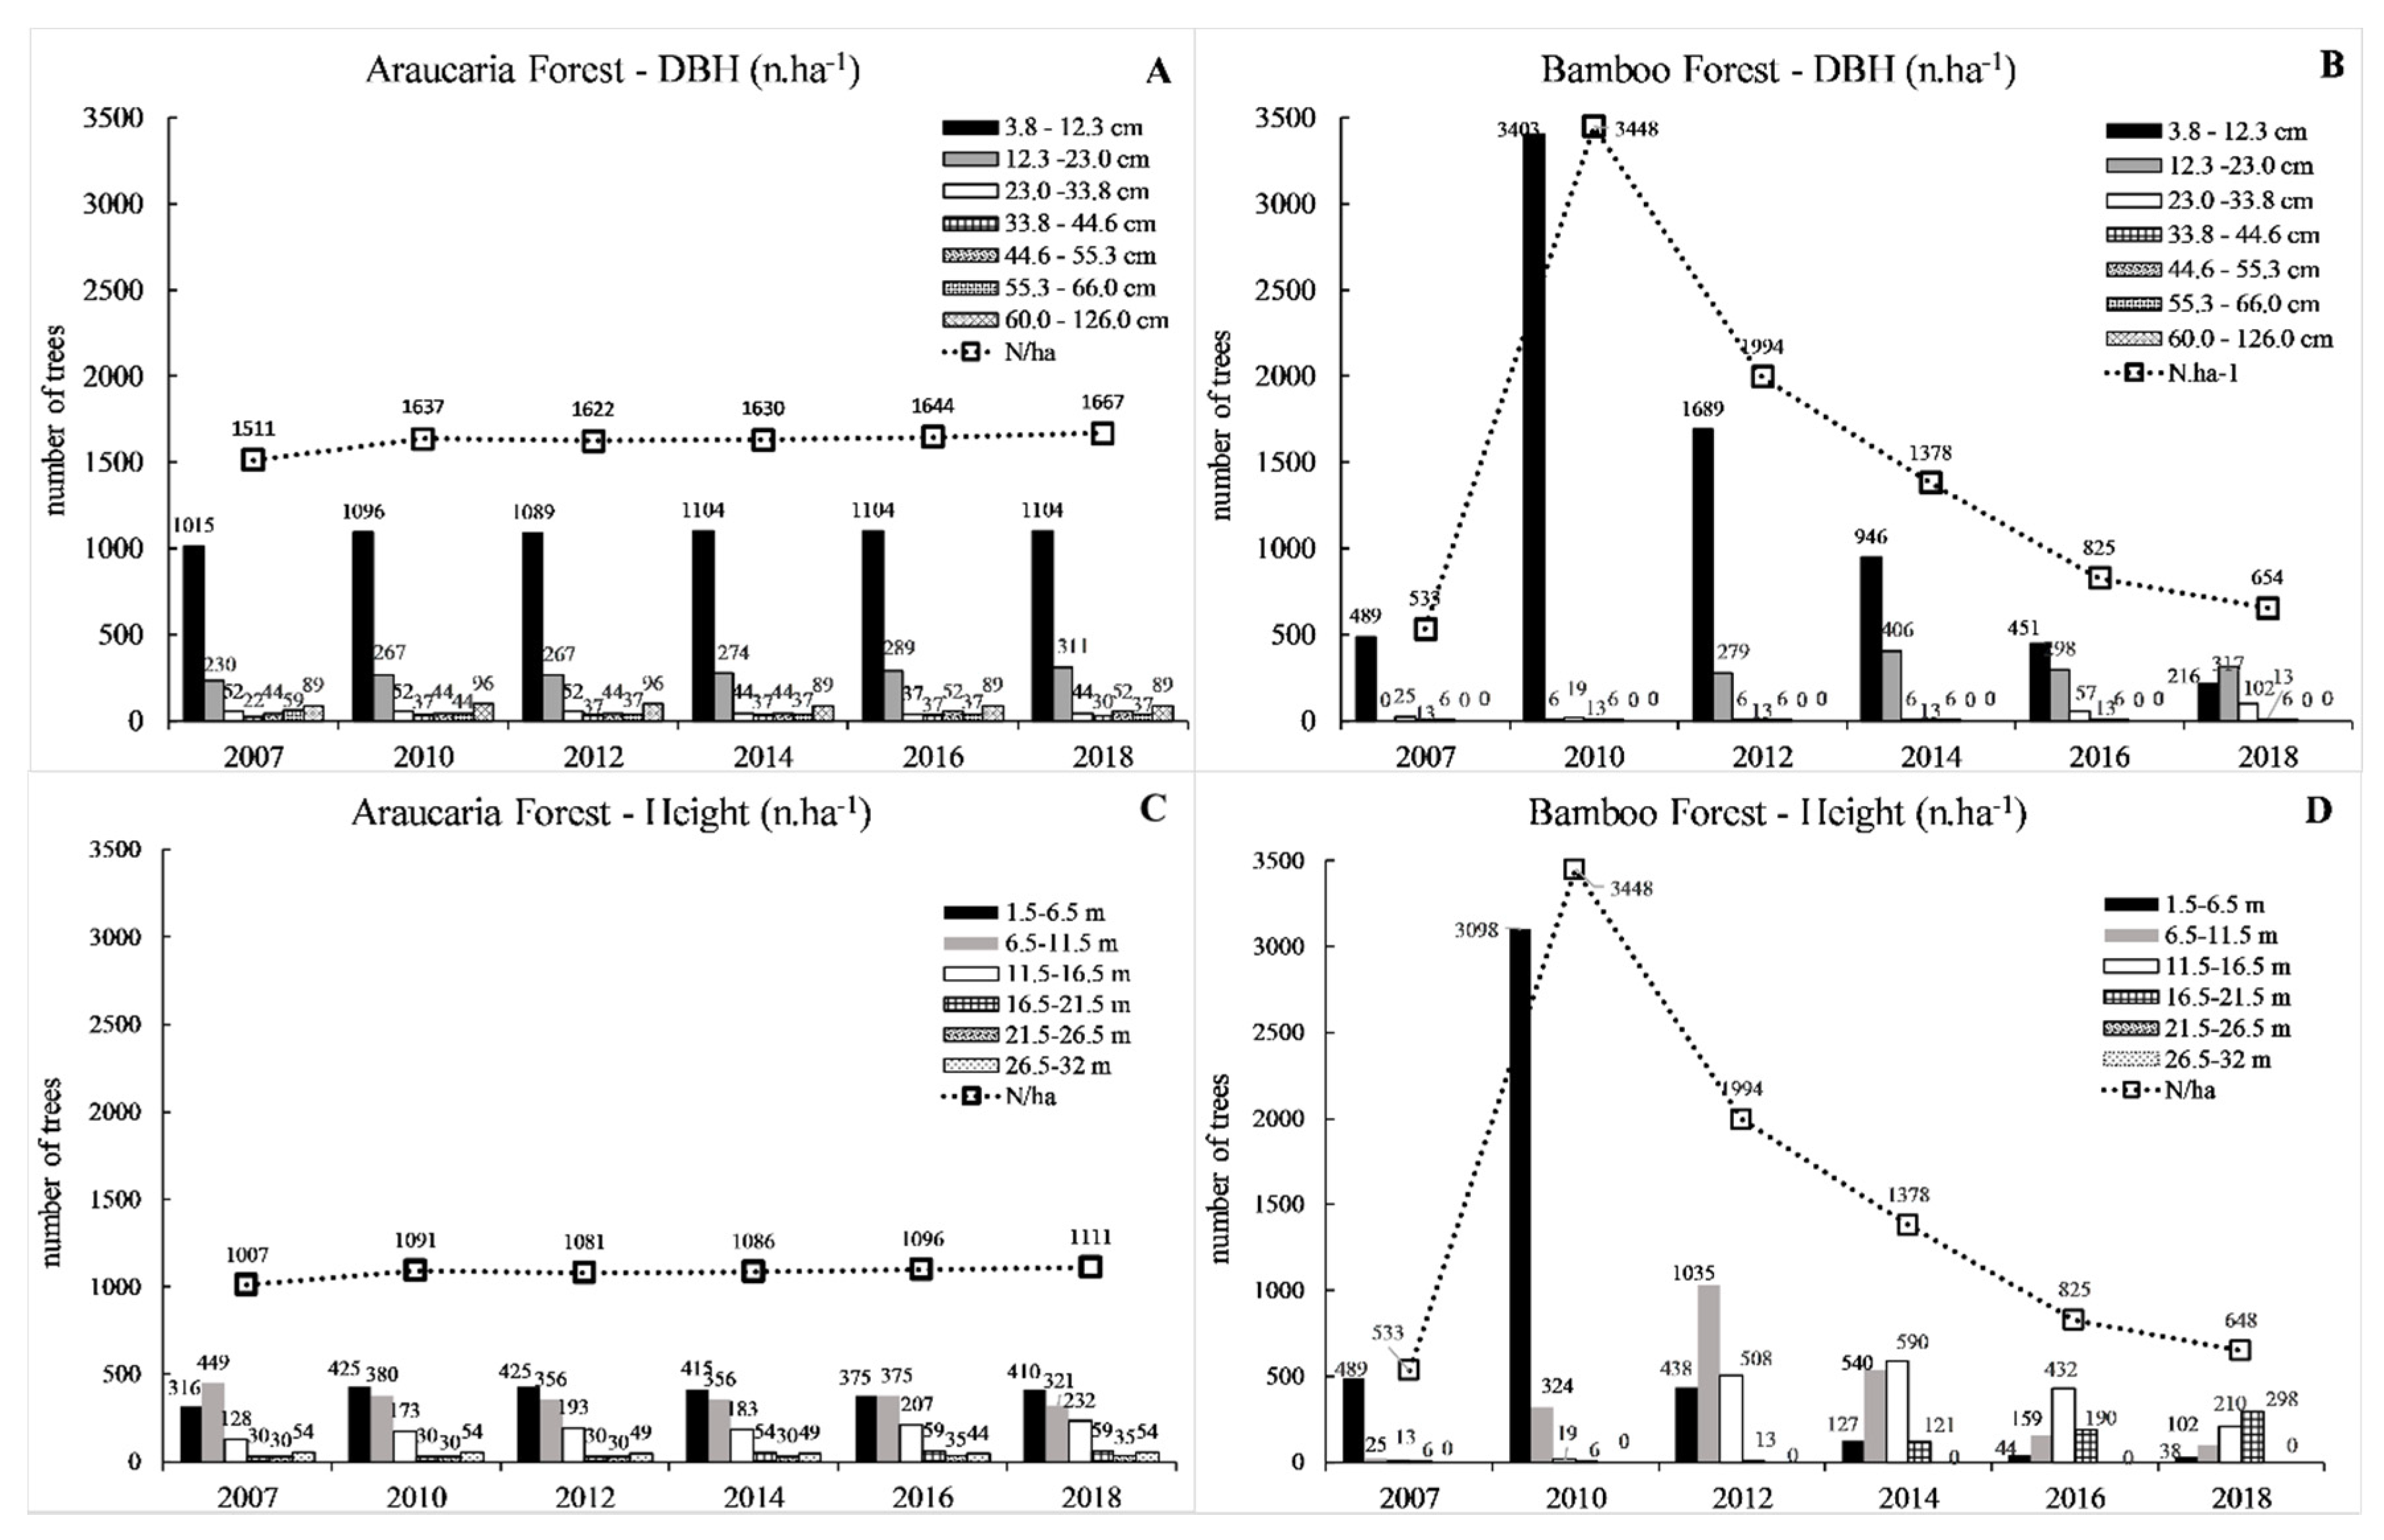
3.2. Forest Structure

In general, the density (number of individuals per hectare) showed different patterns between the forest types; AF had a stable distribution throughout the analysis, ranging from 1007 to 1111 individuals, while in BF the density surged from 533 trees in 2007 to 3448 trees in 2010 after which it plummeted, reaching 648 trees in 2018 (Table 4, Figure 2). The comparison between forest types showed significant results only for 2010 and 2012 (Table A2). Meanwhile, the comparison among years for each forest type showed no significant results in terms of density for AF, while in BF significant differences were observed between most years (Table A2).
Basal area also presented significant differences between AF and BF in all years surveyed (Table A2) while showing different trends: AF was mostly stable (varying from 63.8 and 67.2 m2 ha−1; Table 3), whereas BF showed a general positive trend (varying from 5.1 to 17.5 m2 ha−1). Despite the variations observed, no significant differences were detected in any comparison among years in either of the forest types.
Mean DBH values were significantly different between forest types in all surveyed years apart from 2018. Again, forest types showed different trends with a stable general distribution in AF and more variability in BF. Specifically, AF had most individuals concentrated in the lowest class throughout the survey (Figure 2) while BF showed a sharp increase in individuals from 2007 to 2010 specifically in the lowest class, after which other classes showed a relative increase while the total number of individuals rapidly declined. In relation to height values, forest types were significantly different for all years except for 2012 and 2014 (Table A2). The distribution of trees by height classes in AF resembled a negative exponential pattern by 2010 where the highest concentration of trees is in the lowest classes and density declines as class size increases. In contrast, after a surge in BF’s population in 2010 that was restricted to the lowest height class, the population gradually transitioned toward subsequent height classes leading to a concentration in an intermediate class (16.5–21.5 m). Finally, the comparison among years for each forest type independently were not significant for AF for either mean DBH or height. On the other hand, in BF all comparisons between survey years were significantly different for height (except for 2007–2010) and most comparisons for DBH (except between some consecutive surveys that were not significantly different).
An analysis by species’ ecological groups showed a reasonably stable structure in AF where the secondary species not only dominate richness, but they encompass most of the forest’s density (> 93%) and basal area (> 86%; Table 4) throughout the study. We also detected an initial increase in diversity and density of pioneer species that seems to have reached a stable level. On the other hand, BF showed a much more variable pattern in which, after a sharp increase in density in 2010 where around 98% of the trees were pioneers, secondary species gradually became more common by 2018, reaching 12.7% of the overall density. On the other hand, pioneer relative basal area increased quickly from 56.1% in 2007 (2.9 m2 ha−1) to 82.4% in 2010 (11 m2 ha−1) after which it maintained similar proportions while increasing absolute values (14.9 m2 ha−1 by 2018); conversely, absolute values of secondary species did not show variation despite their relative decrease over time.

4. Discussion

4.1. Species Diversity and Composition

The significant differences in diversity (species richness, Shannon, and effective number of species) between AF and BF over the study period are in general agreement with the pattern observed in the regeneration described by Kellermann and Lacerda [7,8] for the same study area. Adult species diversity in BF showed a spike in 2010 and maintained higher levels in relation to 2007 throughout the analysis (although not significant for all years) while a tendency toward a more evenly balanced species distribution between pioneer and secondary species was also observed. On the other hand, AF was stable over time for all diversity parameters where no significant difference between surveys were detected and secondary species accounted for the most species richness for both adults and regeneration. Interestingly, the richness (Stotal) returned to original levels in 2018 (after a peak in 2010) which is related to an increase in the number of shared species (i.e., secondary) between AF and BF as opposed to pioneer species that are almost exclusively found in BF.
Unlike the result for adults, previous research on forest regeneration carried out in the same area [7,8] showed that the pioneer species regeneration in BF had a consistent decrease in diversity reaching only 10% of the overall diversity by 2014 (compared to 27% in 2007) while secondary species increased from 70 to 80% (2007 and 2014, respectively). Such results are expected for young forests where pioneer species successfully established immediately after bamboo die-off and quickly became adults. Conversely, their recruitment helped to create an environment unsuitable for their own regeneration [40,41], as the canopy cover created by these pioneers reduced the light availability necessary for pioneer species regeneration. This trend was exacerbated by the bamboo recolonization after die-off that began in 2007, which created a dense understory layer that further affected the light conditions and arrested the successional development of BF. Finally, the competitive pressure caused by bamboo recolonization can also explain the arrested development of secondary trees that although successfully recruited had not yet been managed by 2018 to grow past the dense bamboo understory layer (6–9 m).
The species composition analysis also helps to demonstrate the differences between dynamics in both forest types that are correlated to their successional stages. AF showed a stable forest diversity (Table 1) and composition (given by indicator species), whereas BF was characterized by pioneer species with variable diversity throughout the analysis. BF indicator species were initially comprised of both shorter-living shrubby-trees (A. riedeliana, S. erianthum) and longer-living trees (P. angustifolia, M. scabrella, and V. discolor); later, species characteristic of BF were restricted to the canopy-dominant adult individuals of those same tree species. In contrast, AF was consistently characterized by secondary and late successional species which indicates that the bamboo die-off that occurred in its few bamboo clusters did not have a significant impact on this forest composition.
Despite the establishment of a forest canopy by pioneer species in BF that took advantage of a small window of opportunity for development [12], secondary species remained stagnant. This contradicts the expectation of their continuous growth until establishment in the canopy, typical of a subsequent stage in succession. This observation shows that successful recruitment and transition of plants into higher size classes is restricted to the immediate aftermath of bamboo die-off [7,8] as recruits struggle to grow past the highly competitive M. skvortzovii bamboo that quickly recolonized and formed a dense understory layer (3–6 m) by 2010. The results are also consistent with studies that detected a recruitment pulse and growth restricted to the post-die-off phase [1,5,10,42,43] after which recruits no longer grow to reach adult size [8].
On the other hand, the sparse bamboo population in AF did not cause changes in diversity (richness and Shannon), density, and indicator species; however, the die-off is likely responsible for the slight increase in pioneer and secondary species densities observed after 2007 that transformed the distribution of individuals among DBH classes into a negative exponential pattern (further discussed below).

4.2. Forest Structure

The analyses of DBH and height over time demonstrate very active growth dynamics in BF where smaller plants rapidly moved toward higher DBH and height classes, establishing a well-developed young forest structure in just a few years. This process was led by the fast-growing pioneer trees (Table 3) that formed a single-stratum canopy, reaching typical maximum heights (~20 m) by 2018; furthermore, the non-significant values for height in 2012 and 2014 reflect a transition in BF where an initial rapid period of growth in height ended when these pioneer adults dominated the canopy at their maximum heights. On the other hand, DBH is expected to continue to further develop as trees have not yet reached their maximum diameter [31]. Furthermore, the notable increase in pioneer density in 2010 followed by a rapid decline is the result of self-thinning that occurred alongside the increase in basal area, height, and DBH of the dominant trees (Table 3, further discussed below).
The ISA presented important indications about synchronicity between the bamboo and tree regeneration dynamics. The most characteristic pioneer species in BF have life span similar (in length as they are polycarpic) to the 30–32-year bamboo die-off events (M. scabrella < 30 years; P. angustifolia < 60 years) [31]. As such, these species quickly recruit after bamboo die-off and form a homogeneous canopy for around 15 years, at which point the canopy gradually becomes more porous as trees become old and die [44]. This process further reinforces bamboo dominance until a new die-off event that once again kickstarts regeneration in a closed cycle, as initially proposed by Griscom and Ashton [6] and further developed by Kellermann and Lacerda [7]. This recurrent cycle is further supported by regeneration analysis conducted by Kellermann and Lacerda [8] in the same BF plots that showed that pioneer density and diversity plummeted over time while secondary and late successional species proportionally increased; however, the regeneration dynamics showed a general pattern in which the total number of recruits consistently decreased along with a stagnant growth.
Unlike pioneer species, the secondary species in BF did not show consistent increases in terms of height, DBH, and basal area, but only a surge in density between 2007–2010. What is particularly concerning, is the fact that the secondary species maintained height values of 6–9 m, which is similar to those reached by bamboos [8] thus creating a situation in which there is direct competition for light [12] and risks of physical damage [10] caused by bamboos.

4.3. Implications for Conservation

The synchronised M. skvortzovii die-off reported in the region between 2004 and 2006 kickstarted forest succession dynamics, affecting regeneration diversity [7,8], an effect also observed in other forests of South America [1,5,12,43] and Asia [45,46]. Consistent with those studies, our long-term analysis of the adult population presents an even more complete understanding of the influence of bamboos on forest dynamics.
Following significant disturbances in young forests like BF, succession begins through the establishment of a forest canopy comprised of pioneer species; this canopy tends to hinder subsequent pioneer recruitment in favor of secondary and late successional species that eventually replace the pioneers as succession moves toward more complex communities [40,47]. Although the initial stage of succession was observed in BF, the recolonization of bamboos that rapidly dominated the understory [8] seems to have arrested secondary species growth (DBH and height). Furthermore, no late successional trees were present at the beginning of the study, nor did they successfully recruit from regeneration even though seed sources from those species are available in the forest mosaic surrounding BF.
Given the current trend, BF is tending to become a very open canopy forest, further supporting bamboo growth and increasing M. skvortzovii dominance in the understory with sporadic occurrences of the longer-living P. angustifolia (M. scabrella starts senescence at around 15 years and does not reach the bamboo life cycle of 30–32 years), until a new bamboo die-off re-initiates this dynamic. Thus, the BF appears to be a caught in a closed cycle, as proposed by Kellerman and Lacerda [7], in which development into later successional stages is arrested. Further supporting this hypothesis is the regeneration in BF which showed high class shift probabilities (i.e., growth leading to a transition toward higher size classes) coincident with the surge in regeneration after bamboo die-off after which it declined quickly and reached near zero by 2011 [8]. Furthermore, the observed bamboo recolonization not only impeded recruitment by creating unsuitable light conditions for regeneration [5], but also affected tree recruitment because of physical damage from mass loading. Thus, the dynamics between pioneers and bamboo ultimately creates a self-perpetuating disturbance cycle as described by Griscom and Ashton [6]. Finally, in the definitive study by Greig et al. [44], the authors assessed spectral-temporal changes in BF over a 40-year period and found four temporal phases: (i) “bamboo die-off;” followed by (ii) “pioneer regeneration” with quick tree growth and canopy establishment; (iii) “pioneer predominance” with gradual tree canopy decline; and finally (iv) “mature bamboo” with very open canopy and vegetation mostly comprised of bamboo. These phases seem to mirror the dynamics discussed herein for the adult population and the regeneration reported by Kellermann and Lacerda [7,8].
It is pressing that the presence of bamboos as dominant species becomes part of the conversation pertaining forest management and conservation in Brazil and other countries in South America and Asia. As prohibitive legislation in Brazil has not countered the risk of bamboo dominance for forest conservation, alternative solutions should be considered. The implementation of agroforestry based on traditional productive systems in rural Southern Brazil, which have led to forest restoration, increased food security, and income stability, are successful experiences that should be considered by policymakers and conservationists. The cost of maintaining the status-quo might lead to further forest degradation and impoverishment of rural communities.

Author Contributions

Conceptualization, B.K. and A.E.B.L.; methodology, A.E.B.L.; software, A.E.B.L.; validation, A.E.B.L.; formal analysis, A.E.B.L.; investigation, B.K. and A.E.B.L.; resources, B.K. and A.E.B.L.; data curation, B.K. and A.E.B.L.; writing—original draft preparation, A.E.B.L.; writing—review and editing, B.K. and A.E.B.L.; visualization, A.E.B.L.; supervision, A.E.B.L.; project administration, A.E.B.L.; funding acquisition, A.E.B.L.

Funding

This research was funded by Brazilian Agriculture Research Corporation (EMBRAPA), grant number 03.13.07.007.00” and B. Kellermann was funded by CAPES and CNPq”.

Acknowledgments

We thank Arnaldo Soares, Carlos Roberto Urio, and Maria Izabel Radomski (in memoriam) for their assistance with data collection and botanical identification, and Gilberto Terra for initial plot set up and data collection. Finally, we thank Evelyn Nimmo for technical assistance and editing the article.

Conflicts of Interest

The authors declare no conflict of interest. The funders had no role in the design of the study; in the collection, analyses, or interpretation of data; in the writing of the manuscript, or in the decision to publish the results.

Appendix

Table A1. Yearly comparison of estimated Hill numbers (q Dest; q = 0 to 2) between Araucaria and Bamboo Forest, compared at a common percentage of sample coverage with 95% confidence intervals (± CI) and overall coverage. (q = 0 is richness; q = 1 effective number of species where species are weighted in proportion to their frequencies; q = 2 effective number of species where more weight is given to abundant species, discounting rare species). * denotes significant difference at α = 0.05.
200720102012201420162018
AFBFAFBFAFBFAFBFAFBFAFBF
0Dest
(± CI)
43.81 * (8.73)11.23 (4.53)47.5 * (13.52)21.29 (6.03)41.72 * (7.02)22.09 (6.45)42.95 * (7.52)16.84 (3.59)36.46 * (3.48)17.67 (5.8)35 * (3.58)22.41 (9.2)
1Dest
(± CI)
19.12 * (3.45)4.67 (1.16)21.24 * (3.46)5.43 (0.54)20.98 * (3.14)5.24 (0.67)20.69 * (2.96)4.74 (0.94)19.27 * (2.65)4.95 (1.1)18.51 * (2.53)6.26 (1.68)
2Dest
(± CI)
11.12 * (2.34)3.4 (0.69)12.15 * (2.33)3.81 (0.31)12.52 * (2.45)3.12 (0.44)12.35 * (2.28)2.98 (0.41)12.32 * (2.37)3.29 (0.56)12.35 * (1.99)3.76 (0.8)
coverage0.960.990.980.970.960.95
Table A2. Results for statistical significance (p-values) using mixed model statistics for comparisons between Araucaria Forest (AF) and Bamboo Forest (BF) during the 2007–2018 period and between years for AF and BF separately for density (no. of tree.ha−1), basal area (m2.ha−1), mean height (m) and mean diameter at breast height—DBH (cm). * denote significant difference at α = 0.05.
Density (no. of tree ha−1)
YearAF × BFAraucaria Forest—AFBamboo Forest—BF
200720102012201420162018 200720102012201420162018
20070.773622007-1.000001.000001.000001.000001.000002007-0.00000 *0.00000 *0.00236 *1.000001.00000
20100.00000 *2010--1.000001.000001.000001.000002010--0.00000 *0.00000 *0.00000 *0.00000 *
20120.03229 *2012---1.000001.000001.000002012---0.094600.00000 *0.00000 *
20141.000002014----1.000001.000002014----0.231200.01624 *
20161.000002016-----1.000002016-----1.00000
20180.823972018------2018------
Basal Area (m2 ha−1)
YearAF × BFAraucaria Forest—AFBamboo Forest—BF
200720102012201420162018 200720102012201420162018
20070.00842 *2007-1.000001.000001.000001.000001.000002007-1.000001.000001.000001.000001.00000
20100.01353 *2010--1.000001.000001.000001.000002010--1.000001.000001.000001.00000
20120.01705 *2012---1.000001.000001.000002012---1.000001.000001.00000
20140.02122 *2014----1.000001.000002014----1.000001.00000
20160.01835 *2016-----1.000002016-----1.00000
20180.02033 *2018------2018------
Mean Height (m)
YearAF × BFAraucaria Forest—AFBamboo Forest—BF
200720102012201420162018 200720102012201420162018
20070.00000 *2007-1.000001.000001.000001.000001.000002007-1.000000.00000 *0.00000 *0.00000 *0.00000 *
20100.00001 *2010--1.000001.000001.000001.000002010--0.00000 *0.00000 *0.00000 *0.00000 *
20121.000002012---1.000001.000001.000002012---0.00971 *0.00001 *0.00000 *
20140.4727312014----1.000001.000002014----0.04043 *0.00004 *
20160.003594 *2016-----1.000002016-----0.04391 *
20180.000002 *2018------2018------
MEAN DBH (cm)
YearAF × BFAraucaria Forest—AFBamboo Forest—BF
200720102012201420162018 200720102012201420162018
20070.000658 *2007-0.573930.243010.099491.000001.000002007-1.000000.118140.00777 *0.059670.00942 *
20100.000910 *2010--1.000001.000001.000001.000002010--0.080880.00635 *0.00174 *0.00861 *
20120.002664 *2012---1.000001.000001.000002012---0.1017700.01077 *0.00078 *
20140.011045 *2014----1.000001.000002014----0.224770.00295 *
20160.034718 *2016-----1.000002016-----0.01339 *
20181.000002018------2018------
Figure A1. Yearly sample-based rarefaction curves and respective confidence intervals (CI) for AF and BF for Hill numbers (q = 0 to 2). Circles depict incidence data that have been recorded; data to the right of circles are extrapolated.
Diversity 11 00165 g0a1

References

  1. Montti, L.; Villagra, M.; Campanello, P.I.; Gatti, M.G.; Goldstein, G. Functional traits enhance invasiveness of bamboos over co-occurring tree saplings in the semideciduous Atlantic Forest. Acta Oecol. 2014, 54, 36–44. [Google Scholar] [CrossRef]
  2. Judziewicz, E.J.; Clark, L.G.; Londoño, X.; Stern, M.J. American Bamboos; Smithsonian Institution Press: Washington, DC, USA, 1999. [Google Scholar]
  3. Abe, M.; Izaki, J.; Miguchi, H.; Masaki, T.; Makita, A.; Nakashizuka, T. The effects of Sasa and canopy gap formation on tree regeneration in an old beech forest. J. Veg. Sci. 2002, 13, 565–574. [Google Scholar] [CrossRef]
  4. Holz, C.A.; Veblen, T.T. Tree regeneration responses to Chusquea montana bamboo die-off in a subalpine Nothofagus forest in the southern Andes. J. Veg. Sci. 2006, 17, 19. [Google Scholar] [CrossRef]
  5. Campanello, P.I.; Genoveva Gatti, M.; Ares, A.; Montti, L.; Goldstein, G. Tree regeneration and microclimate in a liana and bamboo-dominated semideciduous Atlantic Forest. For. Ecol. Manag. 2007, 252, 108–117. [Google Scholar] [CrossRef]
  6. Griscom, B.W.; Ashton, P.M.S. A self-perpetuating bamboo disturbance cycle in a neotropical forest. J. Trop. Ecol. 2006, 22, 587. [Google Scholar] [CrossRef]
  7. Kellermann, B.; Lacerda, A.E.B. Bambus nativos como espécies invasoras no sul do Brasil. In Bambus no Brasil: Da Biologia à Tecnologia; Drumond, P.M., Wiedman, G., Eds.; Embrapa: Brasília, Brazil, 2017; pp. 179–196. [Google Scholar]
  8. Kellermann, B.; Lacerda, A.E.B. Arrested development? Investigating the role of bamboo in Araucaria Forest succession in Southern Brazil. J. Plant Ecol. 2019. [Google Scholar] [CrossRef]
  9. Larpkern, P.; Moe, S.R.; Totland, Ø. Bamboo dominance reduces tree regeneration in a disturbed tropical forest. Oecologia 2011, 165, 161–168. [Google Scholar] [CrossRef]
  10. Budke, J.C.; Alberti, M.S.; Zanardi, C.; Baratto, C.; Zanin, E.M. Bamboo dieback and tree regeneration responses in a subtropical forest of South America. For. Ecol. Manag. 2010, 260, 1345–1349. [Google Scholar] [CrossRef]
  11. Kellermann, B. Monitoramento da Regeneração Natural em Fragmento de Floresta Ombrófila Mista e Morfoanatomia de Plântulas e Tirodendros de Piptocarpha Angustifolia Dusén ex Malme (Asteraceae); Federal University of Paraná: Curitiba, Brazil, 2011. [Google Scholar]
  12. Montti, L.; Campanello, P.I.; Gatti, M.G.; Blundo, C.; Austin, A.T.; Sala, O.E.; Goldstein, G. Understory bamboo flowering provides a very narrow light window of opportunity for canopy-tree recruitment in a neotropical forest of Misiones, Argentina. For. Ecol. Manag. 2011, 262, 1360–1369. [Google Scholar] [CrossRef]
  13. Klein, R.M. O aspeto dinâmico do pinheiro brasileiro. Sellowia 1960, 48, 17–51. [Google Scholar]
  14. Leite, P.F.; Klein, R.M. Vegetação. In Geografia do Brasil: Região Sul; IBGE: Rio de Janeiro, Brazil, 1990; pp. 113–150. [Google Scholar]
  15. Vibrans, A.C.; Sevegnani, L.; de Gasper, A.L.; Lingner, D.V. Floresta Ombrófila Mista; Edifurb: Blumenau, Brazil, 2013. [Google Scholar]
  16. Valéry, L.; Fritz, H.; Lefeuvre, J.C.; Simberloff, D. Invasive species can also be native. Trends Ecol. Evol. 2009, 24, 585. [Google Scholar] [CrossRef] [PubMed]
  17. Sendulsky, T. Merostachys multiramea (Poaceae: Bambusoideae: Bambuseae) and Similar Species from Brazil. Novon 1995, 5, 76–96. [Google Scholar] [CrossRef]
  18. Pereira, C. Sobre as ‘ratadas’ no sul do Brasil e o ciclo vegetativo das taquaras. Arq. Inst. Biol. São Paulo 1941, 12, 175–195. [Google Scholar]
  19. M, G.; Vellozo, L.; Kubiak, G. Sobre as “ratadas” do primeiro planalto paranaense. Arq. Biol. Tecnol. 1946, 1, 185–195. [Google Scholar]
  20. IBGE. Manual Técnico da Vegetação Brasileira; IBGE: Rio de Janeiro, Brazil, 2012.
  21. Myers, N.; Mittermeier, R.A.; Mittermeier, C.G.; da Fonseca, G.A.B.; Kent, J. Biodiversity hotspots for conservation priorities. Nature 2000, 403, 853–858. [Google Scholar] [CrossRef]
  22. Mittermeier, R.A.; van Dijk, P.P.; Rhodin, A.G.J.; Nash, S.D. Hotspots Revisited: Earth’s Biologically Richest and Most Endangered Ecoregions; CEMEX: Mexico City, Mexico, 2004. [Google Scholar]
  23. Lacerda, A.E.B. Conservation strategies for Araucaria Forests in Southern Brazil: Assessing current and alternative approaches. Biotropica 2016, 48, 537–544. [Google Scholar] [CrossRef]
  24. Rosot, M.A.D.; De Oliveira, Y.M.M.; De Mattos, P.P.; Garrastazu, M.C.; Shimizu, J.Y. Monitoramento na Reserva Florestal da Embrapa/Epagri (RFEE) em Caçador, SC. Documentos 2007, 158, 35. [Google Scholar]
  25. Brasil. Portaria do Ministério do Meio Ambiente no. 443, de 17 de dezembro de 2014. Diário Of. União 2014, 245, 110–121. [Google Scholar]
  26. Klein, R.M. Aspectos Dinâmicos da Vegetação do Sul do Brasil. Sellowia 1984, 36, 5–54. [Google Scholar]
  27. Lacerda, A.E.B.; Rosot, M.A.D.; Filho, A.F.; Garrastazú, M.C.; Nimmo, E.R.; Kellermann, B.; Radomski, M.I.; Beimgraben, T.; Mattos, P.P.; Oliveira, Y.M.M. Sustainable Forest Management in Rural Southern Brazil: Exploring Participatory Forest Management Planning. In Sustainable Forest Management—Case Studies; Martin-Garcia, J., Diez, J.J., Eds.; InTech: London, UK, 2012. [Google Scholar] [Green Version]
  28. FAO Assessing Forest Degradation. Towards the Development of Globally Applicable Guidelines—Forest Resources Assessment Working Paper 177; FAO: Roma, Italy, 2011. [Google Scholar]
  29. Valéry, L.; Fritz, H.; Lefeuvre, J.C.; Simberloff, D. In search of a real definition of the biological invasion phenomenon itself. Biol. Invasions 2008, 10, 1345–1351. [Google Scholar] [CrossRef]
  30. Budowski, G. Distribution of tropical american rain Forest species in the light of sucessional processes. Turrialba 1965, 15, 40–42. [Google Scholar]
  31. Carvalho, P.E.R. Espécies arbóreas brasileiras; Embrapa Informação Tecnológica: Brasília, Brazil, 2003. [Google Scholar]
  32. Chao, A.; Ma, K.H.; Hsieh, T.C. iNEXT (iNterpolation and EXTrapolation Online, Hsin-Chu, Taiwan. Available online: http://chao.stat.nthu.edu.tw/wordpress/software_download/2016 (accessed on 10 April 2019).
  33. Chao, A.; Otelli, N.I.J.G.; Sieh, T.C.H.; Ander, E.L.L.S.; Olwell, R.O.K.C. Rarefaction and extrapolation with Hill numbers: A framework for sampling and estimation in species diversity studies. Ecol. Monogr. 2014, 84, 45–67. [Google Scholar] [CrossRef]
  34. Chao, A.; Jost, L. Coverage-based rarefaction and extrapolation: Standardizing samples by completeness rather than size. Ecology 2012, 93, 2533–2547. [Google Scholar] [CrossRef] [PubMed]
  35. Chao, A.; Chiu, C.H. Nonparametric Estimation and Comparison of Species Richness. eLS 2016, 1–11. [Google Scholar] [CrossRef]
  36. McCune, B.; Mefford, M.J. PC-ORD. Multivariate Analysis of Ecological Data, version 7.06; Wild Blueberry Media LLC: Corvallis, OR, USA, 2018. [Google Scholar]
  37. McCune, B.; Grace, J.B. Analysis of Ecological Communities; MjM Software Design: Gleneden Beach, OR, USA, 2002. [Google Scholar]
  38. NCSS. 2019 Statistical Software; NCSS, LLC: Kaysville, UT, USA, 2019. [Google Scholar]
  39. Cientec. Software Mata Nativa 4: Sistema para análise fitossociológica, elaboração de inventários e planos de manejo de florestas nativas; Cientec: Viçosa, Brazil, 2016. [Google Scholar]
  40. Gómez-Pompa, A.; Vázquez-Yanes, C. Successional Studies of a Rain Forest in Mexico. In Forest Succession, Concepts and Application; West, D.C., Shugart, H.H., Botkin, D.B., Eds.; Springer: New York, NY, USA, 1981; pp. 246–266. [Google Scholar]
  41. Van Breugel, M.; Bongers, F.; Martínez-Ramos, M. Species Dynamics During Early Secondary Forest Succession: Recruitment, Mortality and Species Turnover. Biotropica 2007, 39, 610–619. [Google Scholar] [CrossRef]
  42. Montti, L.; Campanello, P.I.; Goldstein, G. Flowering, die-back and recovery of a semelparous woody bamboo in the Atlantic Forest. Acta Oecol. 2011, 37, 361–368. [Google Scholar] [CrossRef]
  43. González, M.E.; Veblen, T.T.; Donoso, C.; Valeria, L. Tree regeneration responses in a lowland Nothofagus-dominated forest after bamboo die-off in South-Central Chile. Plant Ecol. 2002, 161, 59–73. [Google Scholar] [CrossRef]
  44. Greig, C.; Robertson, C.; Lacerda, A.E.B. Spectral-temporal modelling of bamboo-dominated forest succession in the Atlantic Forest of Southern Brazil. Ecol. Model. 2018, 384, 316–332. [Google Scholar] [CrossRef]
  45. Taylor, A.H.; Jinyan, H.; ShiQiang, Z. Canopy tree development and undergrowth bamboo dynamics in old-growth Abies-Betula forests in southwestern China: A 12-year study. For. Ecol. Manag. 2004, 200, 347–360. [Google Scholar] [CrossRef]
  46. Noguchi, M.; Yoshida, T. Factors influencing the distribution of two co-occurring dwarf bamboo species (Sasa kurilensis and S. senanensis) in a conifer-broadleaved mixed stand in northern Hokkaido. Ecol. Res. 2005, 20, 25–30. [Google Scholar] [CrossRef]
  47. Walker, L.R.; del Moral, R. Primary Succession and Ecosystem Rehabilitation; Cambridge University Press: Cambridge, UK, 2003. [Google Scholar]
Figure 1. Land-use/land-cover map of the study area in the Embrapa Research Station in Caçador (ERSC), Santa Catarina state, Brazil, and the location of the plots in the Araucaria Forest and Bamboo Forest.
Diversity 11 00165 g001
Figure 2. Population distribution based on DBH (m2) and height (m) classes for AF (A,C) and BF (B,D) and total density (n ha−1) between 2007 and 2018.
Diversity 11 00165 g002
Table 1. Calculated species tree layer diversity for Araucaria Forest (AF) and Bamboo Forest (BF) based on empiric Hill numbers (q D; q = 0 to 2), number of species exclusive to one forest (Sexcl), number of shared species between forests (Sshared), and total number of species in both forests (Stotal) (q = 0 is richness; q = 1 effective number of species where species are weighted in proportion to their frequencies; q = 2 effective number of species where more weight is given to abundant species, discounting rare species). * denotes significant differences based on non-overlapping confidence intervals, see Figure A1 for details).
YearAraucaria ForestBamboo ForestSummary
0D1D2DSexcl0D1D2DSexclSsharedStotal
20073617.610.8349 *4.2 *3.4 *7243
2010381911.73418 *5.4 *3.8 *14452
20123719.412.23218 *5.1 *3.1 *13550
20143719123216 *4.7 *3 *11548
20163619.112.33114 *4.7 *3.3 *9545
20183518.512.32816 *5.7 *3.7 *8843
Table 2. Estimated Hill numbers (q Dest; q = 0 to 2) for Araucaria Forest and Bamboo Forest during the 2007–2018 period. Araucaria Forest results compared at 0.97% of sample coverage and Bamboo Forest at 0.98%, with 95% confidence intervals (± CI) (q = 0 is richness; q = 1 effective number of species where species are weighted in proportion to their frequencies; q = 2 effective number of species where more weight is given to abundant species, discounting rare species).
Araucaria Forest
200720102012201420162018Coverage
0Dest (± CI)45.36 (10.55)45.25 (8.83)40.93 (6.43)43.91 (8.81)37.31 (4.59)36.93 (5.07)0.97
1Dest (± CI)19.03 (3.26)20.59 (3.18)20.54 (3.09)20.57 (3.24)19.55 (2.76)19.04 (2.81)0.97
2Dest (± CI)11.16 (2.41)12.04 (2.34)12.44 (2.41)12.36 (2.31)12.36 (2.37)12.52 (2.56)0.97
Bamboo Forest
200720102012201420162018Coverage
0Dest (± CI)12.45 (6.63)18 (3.68)21.41 (5.89)18.63 (5.4)19.35 (9.48)23.66 (12.39)0.98
1Dest (± CI)4.76 (1.12)5.37 (0.49)5.23 (0.76)4.84 (0.86)5.08 (1.14)6.42 (1.70)0.98
2Dest (± CI)3.43 (0.76)3.8 (0.3)3.12 (0.48)2.98 (0.46)3.3 (0.56)3.78 (0.82)0.98
Table 3. Test of significance for the differences between groups using the MRPP (multi-response permutation procedures) based on species abundance and indicator species analysis (ISA). A = chance-corrected within-group agreement; measure of distance based on Sorensen distance.
YearMRPPIndicator Species Analysis (ISA)
Ap-ValueAF Indicator SpeciesBF Indicator Species
20070.102110.000151 *Araucaria angustifolia; Casearia decandra; Cupania vernalis; Myrceugenia miersiana; Ocotea porosa; Trichilia elegansAegiphila riedeliana; Piptocarpha angustifolia
20100.2866110.000027 *Araucaria angustifolia; Casearia decandra; Cupania vernalis; Myrceugenia miersiana; Ocotea porosa; Trichilia elegansAegiphila riedeliana; Piptocarpha angustifolia; Mimosa scabrella; Solanum erianthum; Ocotea puberula; Vernonanthura discolor
20120.3102980.000201 *Araucaria angustifolia; Casearia decandra; Cupania vernalis; Myrceugenia miersiana; Ocotea porosa; Trichilia elegansPiptocarpha angustifolia; Mimosa scabrella; Ocotea puberula; Solanum erianthum; Vernonanthura discolor
20140.2768130.000168 *Araucaria angustifolia; Casearia decandra; Cupania vernalis; Myrceugenia miersiana; Ocotea porosa; Trichilia elegansPiptocarpha angustifolia; Mimosa scabrella; Vernonanthura discolor
20160.2208120.00005 *Araucaria angustifolia; Casearia decandra; Cupania vernalis; Myrceugenia miersiana; Ocotea porosa; Trichilia elegansPiptocarpha angustifolia; Mimosa scabrella; Vernonanthura discolor
20180.1908650.000039 *Araucaria angustifolia; Casearia decandra; Cupania vernalis; Myrceugenia miersiana; Ocotea porosa; Trichilia elegans; Nectandra megapotamicaPiptocarpha angustifolia; Mimosa scabrella; Vernonanthura discolor
* Significant after Bonferroni correction for α = 0.05. Only significant species are shown in ISA results.
Table 4. Results of the analysis between AF and BF based on richness (0D), number of trees (N; individuals per ha), basal area (BA; m2) and their respective percentages, and mean height and diameter at breast height (DBH) (meters and centimeters, respectively) and their respective standard deviation (SD) for each ecological group by year.
Araucaria Forest—AFBamboo Forest—BF
0D (%)N (%)BA (%)Height Mean (SD)DBH Mean (SD)0D (%)N (%)BA (%)Height Mean (SD)DBH Mean (SD)
2007
Pioneer2 (5.6)10 (1.0)0.1 (0.1)7.25 (1.8)9.5 (7.3)6 (66.6)514 (96.4)2.9 (56.1)4.1 (2.3)5.4 (6.4)
Secondary32 (88.9)957 (95.1)57.5 (86.6)10 (6.6)16.5 (22.5)3 (33.3)19 (3.6)2.2 (43.9)9.9 (3.3)34 (22.4)
Late suc.2 (5.6)40 (3.9)8.5 (13.2)14.3 (3.3)48.4 (23.1)-----
Total36100766.110.2 (6.6)17.7 (23)95335.14.3 (2.5)6.4 (9)
2010
Pioneer3 (7.9)20 (1.8)0.1 (0.2)5.6 (2.3)6.8 (5.4)12 (66.6)3365 (97.6)11.0 (82.4)5 (1.5)5.8 (2.9)
Secondary33 (86.8)1031 (94.5)59 (87.7)9.7 (6.7)15.9 (21.8)6 (33.3)83 (2.4)2.6 (17.6)6.2 (3.9)11 (16.2)
Late suc.2 (5.3)40 (3.6)8.1 (12.1)14.3 (3.5)46.5 (22.9)-----
Total38109167.29.8 (6.6)16.9 (22.4)18344813.65 (1.6)5.9 (3.8)
2012
Pioneer3 (8.1)30 (2.7)0.1 (0.2)5.7 (1.8)6.3 (4.5)11(61.1)1880 (94.3)12.5 (83.3)9.5 (3.2)8.2 (4.2)
Secondary32 (86.5)1016 (93.6)57.2 (87.2)9.7 (6.6)16 (21.6)7 (38.9)114 (5.7)2.5 (16.7)7.2 (3.4)10 (13.8)
Late suc.2 (5.4)40 (3.7)8.3 (12.6)14.3 (3.5)46.9 (23.1)-----
Total37108665.69.7 (6.5)16.9 (22.1)18199415.09.4 (3.2)8.3 (6.6)
2014
Pioneer3 (8.1)30 (2.7)0.1 (0.2)6 (2.2)6.9 (4.3)9 (56.2)1295 (94.0)13.6 (84.5)11.7 (3.6)10.5 (4.9)
Secondary32 (86.5)1016 (93.6)55.2 (86.5)9.9 (6.5)15.57 (43.8)83 (6.0)2.5 (15.5)8 (4)12.5 (15.8)
Late suc.2 (5.4)40 (3.6)8.5 (13.3)15.6 (3.7)47.6 (23.2)-----
Total37108663.810 (6.5)16.5 (21.9)16137816.111.5 (3.7)10.6 (6)
2016
Pioneer3 (8.3)35 (3.2)0.2 (0.3)6.7 (2.1)6.8 (4.1)8 (57.1)768 (93.1)12.3 (83.5)13.9 (3.4)12.6 (6.8)
Secondary31 (86.1)1021 (93.2)55.3 (86.1)10.1 (6.6)15.6 (21.2)6 (42.9)57 (6.9)2.4 (16.5)9.4 (4.2)15.5 (18.5)
Late suc.2 (5.6)40 (3.6)8.8 (13.6)16.5 (4.1)48.3 (23.7)-----
Total36109664.310.2 (6.5)16.5 (21.8)1482514.713.6 (3.6)12.8 (8)
2018
Pioneer4 (11.4)35 (3.1)0.2 (0.4)6.1 (3.3)7.1 (5.6)7 (43.7)565 (87.3)14.9 (85.3)16.1 (3.3)17.2 (6.6)
Secondary29 (82.9)1036 (93.3)56.9 (86.4)10 (6.8)15.7 (21.3)9 (56.3)83 (12.7)2.6 (14.7)8.2 (4.8)12.7 (16)
Late suc.2 (5.7)40 (3.6)8.7 (13.2)17.8 (5.8)48.3 (23.2)-----
Total35111165.810.1 (6.9)16.6 (21.9)1664817.515 (4.4)16.6 (8.4)

