Article

Increased Peatland Nutrient Availability Following the Fort McMurray Horse River Wildfire

by
Christine van Beest
1,
Richard Petrone
1,*,
Felix Nwaishi
2,
James Michael Waddington
3 and
Merrin Macrae
4
1
Hydrometeorology Research Group, Department of Geography & Environmental Management, University of Waterloo, 200 University Ave West, Waterloo, ON N2L 3G1, Canada
2
Department of Earth & Environmental Sciences, Mount Royal University, 4825 Mount Royal Gate SW, Calgary, AB T3E 6K6, Canada
3
School of Geography & Earth Sciences, McMaster University, 1280 Main Street West, Hamilton, ON L8S 4K1, Canada
4
Biogeochemistry Lab, Department of Geography & Environmental Management, University of Waterloo, 200 University Ave West, Waterloo, ON N2L 3G1, Canada
*
Author to whom correspondence should be addressed.
Diversity 2019, 11(9), 142; https://doi.org/10.3390/d11090142
Submission received: 12 March 2019 / Revised: 8 July 2019 / Accepted: 18 July 2019 / Published: 22 August 2019
(This article belongs to the Special Issue The Effects of Fire on Peatland Ecosystems)

Abstract

:
Northern peatlands are experiencing increased wildfire disturbance, threatening peatland biogeochemical function and ability to remain major stores of carbon (C) and macronutrients (nitrogen—N, and phosphorus—P). The impacts of climate change-driven drying on peatland nutrient dynamics have been explored previously; however, the impacts of wildfire on nutrient dynamics have not been examined when comparing burned and unburned areas in a post-fire fen. This study assessed the impact of wildfire on N and P bioavailability, change in CNP stoichiometric balance and feedback on plant nutrient limitation patterns in a fen peatland, one-year post-wildfire, by comparing Burned and Unburned areas. Water extractable P increased up to 200 times in shallow leachate, 125 times in groundwater and 5 times in peat. Surface ash leachate had increased concentrations in Ammonium (NH4+) and Nitrate (NO3), and through groundwater mobility, increased extractable N concentrations were observed in peat throughout the entire fen. The net mineralization of N and P were minimal at the Burned areas relative to Unburned areas. Fire affected plant nutrient limitation patterns, switching from dominantly N-limited to NP co-limited and P-limitation in moss and vascular species respectively. The top 20 cm of the Burned area C concentrations was higher relative to the Unburned area, with increased CN and CP ratios also being found in the Burned area. These findings suggest that the long-term effects of elevated C, N, and P concentrations on plant productivity and decomposition must be re-evaluated for fire disturbance to understand the resiliency of peatland biogeochemistry post-wildfire.

1. Introduction

Peatlands cover approximately 12% of Canada’s land surface and are an important feature in the western boreal forest (WBF) of Canada [1]. Fens cover 63% of boreal peatlands and store over half of the carbon (C) stock [2,3]. Fen ecosystems functions such as C sequestration, macro nutrient retention, and improvement of downstream water quality are threatened due to anthropogenic climate change, leading to warmer and drier conditions [4]. Peatland drying leads to lower water table (WT) positions, increasing the vulnerability of boreal peatlands to wildfire and smoldering combustion carbon losses. Extreme combustion has been linked to accelerated post-fire peat oxidation which reinforces the drying and lowering of the WT [5].
The burning of these upper layers of rich organic matter releases enormous quantities of C into the atmosphere, but the drying and burning of peat also oxidizes macronutrients [6]. The biogeochemical feedback of the increased supply of macronutrients in post-wildfire peatlands has not been studied. Little is known about the effect that changes in P and N may have on the nutrient limitation patterns of peatland plant communities and stoichiometric balances of CNP in plant nutrient sources (i.e., peat and groundwater). While a large post-fire pulse of macronutrients released by wildfire combustion of trees, shrubs, moss, and peat may enhance post-fire moss and shrub regeneration and productivity, it is anticipated that too much nutrient release could push the peatland towards a regime shift [5], as peatland form and function are strongly linked to nutrient availability [7]. As such, there is an urgent need to develop a better understanding of how wildfire may contribute to the release of stored macronutrients and their effect on the internal cycling of C, N, and P among other functional attributes to the peatland biogeochemical process.
The aim of this study is to quantify changes in major aspects of soil-plant-water nutrient biogeochemistry over the first post-wildfire growing in a fen peatland. The specific objectives of this study are to: i) quantify the differences in available nutrient (N and P) concentrations and net mineralization rates in hummock and hollow peat between Burned and Unburned areas over the growing season; and ii) compare the C, N, and P stoichiometric balance from pre- and post-fire to understand how disturbance changes nutrient limitation patterns and the feedback on vegetation recovery and decomposition.

2. Materials and Methods

2.1. Study Area Pre-Fire

Our research was carried out in the Poplar Creek Fen (hereafter referred to as Poplar) located approximately 20 km north of Fort McMurray, Alberta (56°22′N, 111°14′W) in the Athabasca Oil Sands Region (AOSR). Poplar is classified as a moderate-rich treed fen surrounded by a mosaic of upland coniferous forest (Figure 1) [8]. Peat depths at Poplar range between 0.4 and 1.6 m, underlain by fluvial sand and fractured bedrock from the McMurray lowland formation [8]. While Poplar has experienced some indirect industrial disturbance, including increased atmospheric deposition of NO3 and NH4+ [9] and the development of cutlines in the surrounding landscape, the peatland is used as a reference study area relative to the many, much more directly impacted areas in the AOSR. As such, there is an extensive (pre-fire) data history of the area, including vegetation, nutrients, carbon, and hydrology data [8,10,11,12]. The porewater pH ranges between 6.5 to 6.8, soil organic matter between 81 to 88% and a relatively low EC for fen in the ASOR between 150 and 300 µmhos/cm [8,10]. Poplar is an intermediary between a drier bog and wet fen, containing traditional peatland micro-topographic features with dry hummocks and wet hollows [10].
The surrounding uplands are a mixture of Populus tremuloides (trembling aspen), Picea mariana (black spruce) and Pinus banksiana (Jack Pine), with groundcover dominated by Ledum groenlandicum (Labrador Tea), Equisetum sylvaticum (Wood Horsetail), Sphagnum fuscum and Tomenthypnum nitens (Brown moss) [11]. The center of the fen area has more classic peatland species including Larix laricina (Tamarack), stunted black spruce, Sphagnum fuscum, Sphagnum girgensohnoii, other Sphagnum spp.., Betula pumila (Dwarf Birch), Vaccinium oxycoccos (Small Cranberry), and Carex spp. [11]. Concentrations of extractable forms of nitrogen, (i.e., NO3 and NH4+) have been shown to steadily decrease over the growing season, as have net ammonification rates, whereas net nitrification rates increase due to the decreasing WT and aerobically favorable conditions [13]. A previous study found that pools of water extractable P were lowest in the middle of the growing season, with the highest net mineralization of P also occurring in the middle of the growing season [13]. Nwaishi et al. [13] looked at the carbon fluxes of the areas showing that over the growing season Poplar functions as a carbon sink.
Local recharge is the main water source for Poplar, unlike many fens that are recharged from regional aquifers, leading to greater fluctuations in WT levels [12]. Water table levels during the 2015 growing season averaged 20 cm below ground surface with lower WT positions found closer to the upland margins [12]. Elmes et al. [12], also found that the vertical hydraulic gradients in the margins were strongest when WTs were high and weakest when precipitation was low, resulting in less recharge. A longer record of WT positions throughout the study area shows that Poplar experiences extended dry periods, with a persistently low WT due to lack of precipitation-driven recharge.

2.2. Study Area Post-Fire

During May of 2016, the Horse River wildfire (MWF-009) consumed approximately 590,000 ha of the WBF surrounding Fort McMurray, Alberta. Poplar was almost entirely engulfed by the wildfire, burning both the upland mixed coniferous forest and the moderately rich fen. Areas of the fen burned at differing depths of burn depending on vegetation, location and water levels. The center of the fen was untouched by the fire and surrounding areas were severely burned (Figure 1). In the ‘Burned’ area, post-fire vegetation includes black spruce, Labrador tea, and wood horsetail, as well as Carex spp., Maianthemum trifolium (Three-Leaved Solomon’s Seal) and Sphagnum fuscum, Brown mosses and Polytrichum spp. [11]. The Burned hollows were completely burnt, and the mixed moss hummocks singed with brown dead vegetation, and, all black spruce trees were completely charred and dead. The Unburned area at the center of the fen had noticeably higher water levels and an abrupt transition of the types of tree and vascular and non-vascular species, with stunted Tamarack trees and Sphagnum moss dominating the ground cover. Following the fire, the Unburned area had live vegetation and little trace of any fire interactions with both hummocks and hollows. For the study, two transects were selected for the Burned areas, on either side of the Unburned area at the center of the fen (Figure 1). Each transect had the same sampling design, with all instrumentation focused in an approximately 20 × 20 m area.

2.3. Study Area Burn Severity

Peat burn severity was quantified along each transect through depth of burn (DOB) measurements following the protocols commonly used [14,15]. This protocol estimated DOB by measuring the distance between the burned surface and the reconstructed surface using multiple reference points/markers such as adventitious roots [14] and/or surfaces unaltered by the fire [16]. This method assumes a flat pre-fire surface between multiple reference points, and the difference between the reconstructed surface and the burn surface was taken as the DOB (n = 400). An ash layer post-fire did not factor into DOB measurements as peat has a low mineral content and there was little to no ash layer at the surface (<2 cm) [17]. Lukenbach et al. [15] and Kasischke et al. [14] found that these DOB methods were conservative, since adventitious roots of black spruce are, on average, 5 cm below the peat surface; therefore, when adventitious roots were used as the reference point, 5 cm was added to the DOB measurements. DOB was measured 1 year post-fire, and measurements at the Burned areas ranged between 9.9 to 16.7 cm.

2.4. Soil Properties, Nutrient Dynamics and Stock Calculations

Extractable (bio-available pools) and net mineralization rates of nitrogen (N) and phosphorus (P) were determined in all three transects during the full growing season, and soil moisture and soil temperature were taken over an integrated 10 cm depth (Delta-T Devices, UK, WET Sensor) on a weekly basis. To fully understand differences in nutrient cycling due to both peat burning and seasonal changes, buried-bag nutrient mineralization incubation experiments after [6,18,19] were conducted three times during the growing season: Early (May), Middle (mid-June to mid-July), and Late (mid-August to mid-September), with each incubation period lasting for 28 days. Briefly, two adjacent “paired” peat cores, approximately 10 cm deep, were taken from all three transects (4 hummock and 4 hollows), using a “dutch corer” and live vegetation was removed from both cores. One of the paired cores, the “pre-incubation” core, was taken to the lab, homogenized, put on ice in a cooler, and processed within 24 h for 2M KCl-extractable concentrations of ammonium (NH4+) and nitrate (NO3), and water extractable phosphorus (WEP) (using the methods outlined in Macrae et al., 2012). The second core, the “post-incubation” core, was used for in situ net mineralization and was loosely wrapped in polyethylene and placed back in the hole from which it had been removed for an incubation period of 28 days, then subsequently analyzed following the same procedure as the first core. Extractants were gravity filtered through ashless filters (Whatman no. 42) and subsequently analyzed using colorimetric analysis at the Biogeochemistry Lab at University of Waterloo (Bran Luebbe AA3, Seal Analytical, Seattle, U.S.A., Methods G-102-93 (NH4+), G-109-94 (NO3 + NO2), and G-103-93 (SRP)). The drying of samples can enhance extractable nutrient pools [10,13,20]; therefore, field moist samples were used for all nutrient extractions. Moisture content, using a drying oven for 24 h at 80 °C, with a subsample of each core was determined so that extractable nutrient pools and net mineralization rates could be expressed in per unit dry weight. Net nitrification, net ammonification, and net P mineralization rates (mg g−1 dry peat day−1) were estimated for all three incubation periods by taking an average of the difference between the post-incubation and pre-incubation extractable pools to quantify the difference in NO3, NH4+, and SRP. Negative values for the net mineralization of NO3, NH4+, and SRP indicates net immobilization, and negative NH4+ could indicate nitrification and negative of NO3 could indicate denitrification. Positive values rates indicate net nutrient release (net mineralization) into pore water.
Peat cores (20 cm length, 5 cm diameter) were extracted at peak growing season to measure the C:N, C:P, and N:P ratios in the upper layers of the peat. Four cores were taken at each transect (2 hollow cores, 2 hummock cores) and frozen until transported to the University of Waterloo for analyses of percent organic matter by loss on ignition, bulk density, and porosity [21]. Total C and N in peat was determined using EA-IRMS at the Environmental Isotope Laboratory, University of Waterloo, and total P, Fe, and K concentrations were measured after digestion procedures [22] using ICP analysis at the Centre for Cold Regions and Water Science, Wilfrid Laurier University.

2.5. Groundwater and Shallow Leachate Dynamics

Surface water infiltration (shallow leachate through the litter and surface peat layers) was measured using 500 mL plastic lysimeters buried 5 cm below the surface of the peat with a mesh screening to allow only water to be collected. This water represents water that has passed through the surface vegetation and litter layer but is isolated from the peat matrix, and thus does not represent porewater or interstitial water. It is, therefore, referred to as shallow leachate in this paper. Water samples were collected within 24 h of rainfall events. Each transect had 4 infiltration lysimeters and 4 wells, split evenly between hollows and hummocks.
Shallow groundwater (referring to subsurface flow below the water table in this study) levels were measured weekly from shallow wells (5 cm ID, ~1 m depth, screened through the entire well length). Water samples were collected monthly from these wells between May and September, and wells were purged 24 h prior to sampling to permit adequate recharge [23]. Thus, the water chemistry samples reported herein refer to an integrated sample from the entire well length. Prior to sampling, the water in wells was gently mixed throughout the screened depth to provide a representative sample, and water was drawn from each well approximately 15 cm above the bottom of the well [24].
Collected water samples were split into 3 subsamples. The first subsample was filtered into a specimen cup using a cellulose acetate filter (0.45 µm pore size, Flipmate, Delta Scientific) and frozen to test for anions, cations and the mineral forms of N and P. A second subsample was filtered the same way for the determination of dissolved Kjeldahl N and P. A third subsample (shallow leachate) was left unfiltered for the analysis of total Kjeldahl N and P, including particulate matter. Subsamples for determinations of total and dissolved Kjeldahl N and P were preserved with acid (0.2% final H2SO4 final concentration) for storage and subsequently digested. The N and P species were analyzed using colorimetric analysis (described above). Major ions were analyzed using a Dionex ICS3000. Lab analyses were completed in the Biogeochemistry Lab at the University of Waterloo.

2.6. Vegetation Sampling and Nutrient Analysis

Vegetation from each transect was also sampled at peak growing season (late June) for the analyses of C:N, C:P, and N:P ratios. All different plant species were recorded at each transect and for each species approximately 100g of live vegetation was collected and frozen until transported to the University of Waterloo for analyses. Vegetation was then dried and ground into powder form before total C and N in vegetation was determined using EA-IRMS at the Environmental Isotope Laboratory, University of Waterloo. Total P, Fe, and K concentrations were measured after digestion procedures [22] using ICP analysis at the Centre for Cold Regions and Water Science, Wilfrid Laurier University. Multiple plant species were present at all transects, and analysis was done on individual species and for the different microtopographical units. However, differences were not found among the species, so to simplify analysis, vegetation was qualified as either a moss or vascular species.

2.7. Statistical Analysis

All statistical analyses were performed with R [25]. All data for this paper were analyzed and tested for normality. Across the entire data set, even with log transformations, the data set was not normal and nonparametric testing was used. However, within individual factors, data were either normally distributed or could be transformed to meet the assumption of normality and parametric statistics could be used. It is worthy of note that this study is a classic example of an unreplicated experiment being accepted as the best option [26], given that it is only by chance that a site with previous nutrient and long-term hydrological research can undergo such non-manipulated wildfire disturbance. For this reason, our statistical analyses were carefully implemented, and we were cautious in the interpretation of our results to avoid inferring causal relationships on the basis of observation from this pseudoreplicated experiment (c.f. [27] for a discussion regarding pseudoreplication in landscape-scale natural experiments). To address the first objective of the study, we ran both three-way and two-way non-parametric ANOVA tests (Sheirer-Ray-Hare) to test the effects of microtopographic and temporal variability and burning on shallow leachate and groundwater nutrient concentrations, peat nutrient concentrations and net mineralization rates. However, significant interactions were found. Consequently, we ran a series of one-way ANOVA tests. The statistical analyses employed were appropriate for our overarching objective, which is to identify changes in soil chemistry due to fire. The main interaction among abiotic controls would be with microtopography and DOB, which is already well documented in the literature (c.f. [28,29]). For example, it has been well established that peatland microtopography exerts a strong control on peat burn severity as measured in depth of burn and/or carbon loss via combustion in the Boreal Plains (e.g., [30,31,32,33]). Feathermoss dominated hollow microforms having poor moisture retention and higher depth of burn than the low burn severity, high-moisture retention traits of Sphagnum fuscum hummocks [34,35]. Thus, all data were analyzed for the effects of three main reasons for potential variable differences: (1) the effect of wildfire, (2) differences between microforms, and (3) temporal change over the growing season. For the second objective, Kruskal-Wallis analyses were done to compare pre- and post-fire C. N and P stoichiometric balance for both peat and plants. Differences among groups were considered significant if p < 0.05.

3. Results

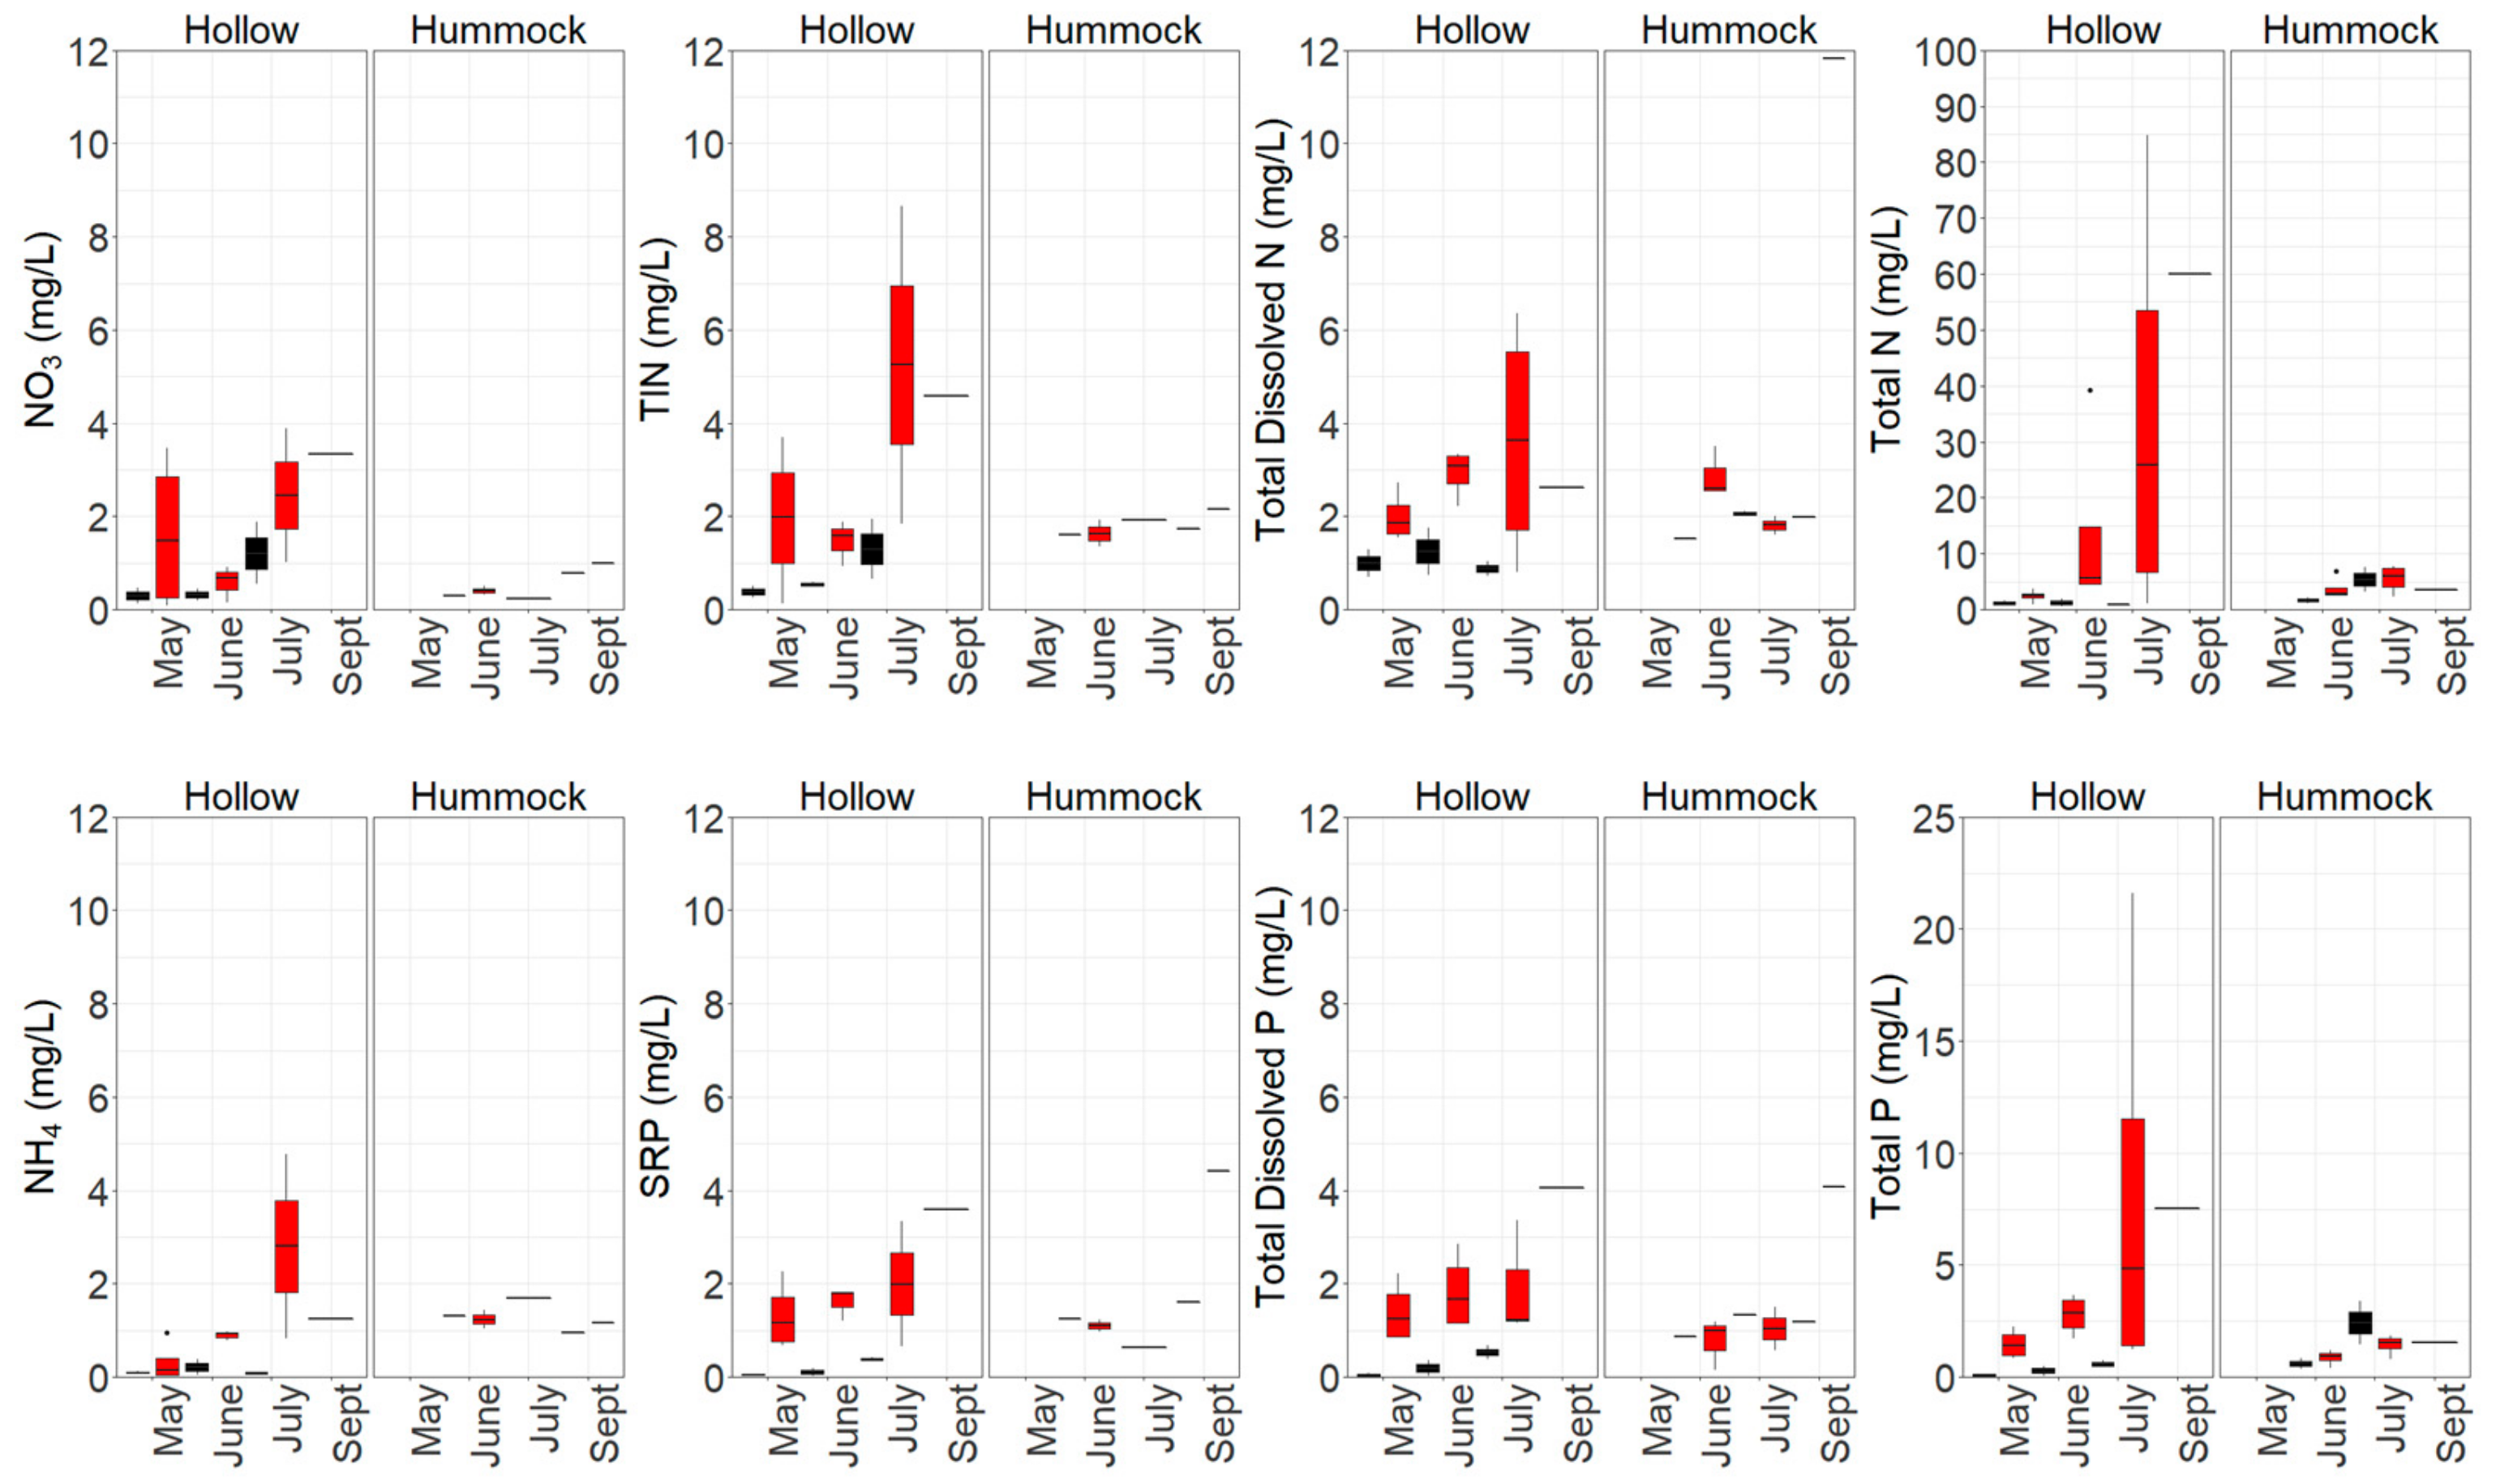
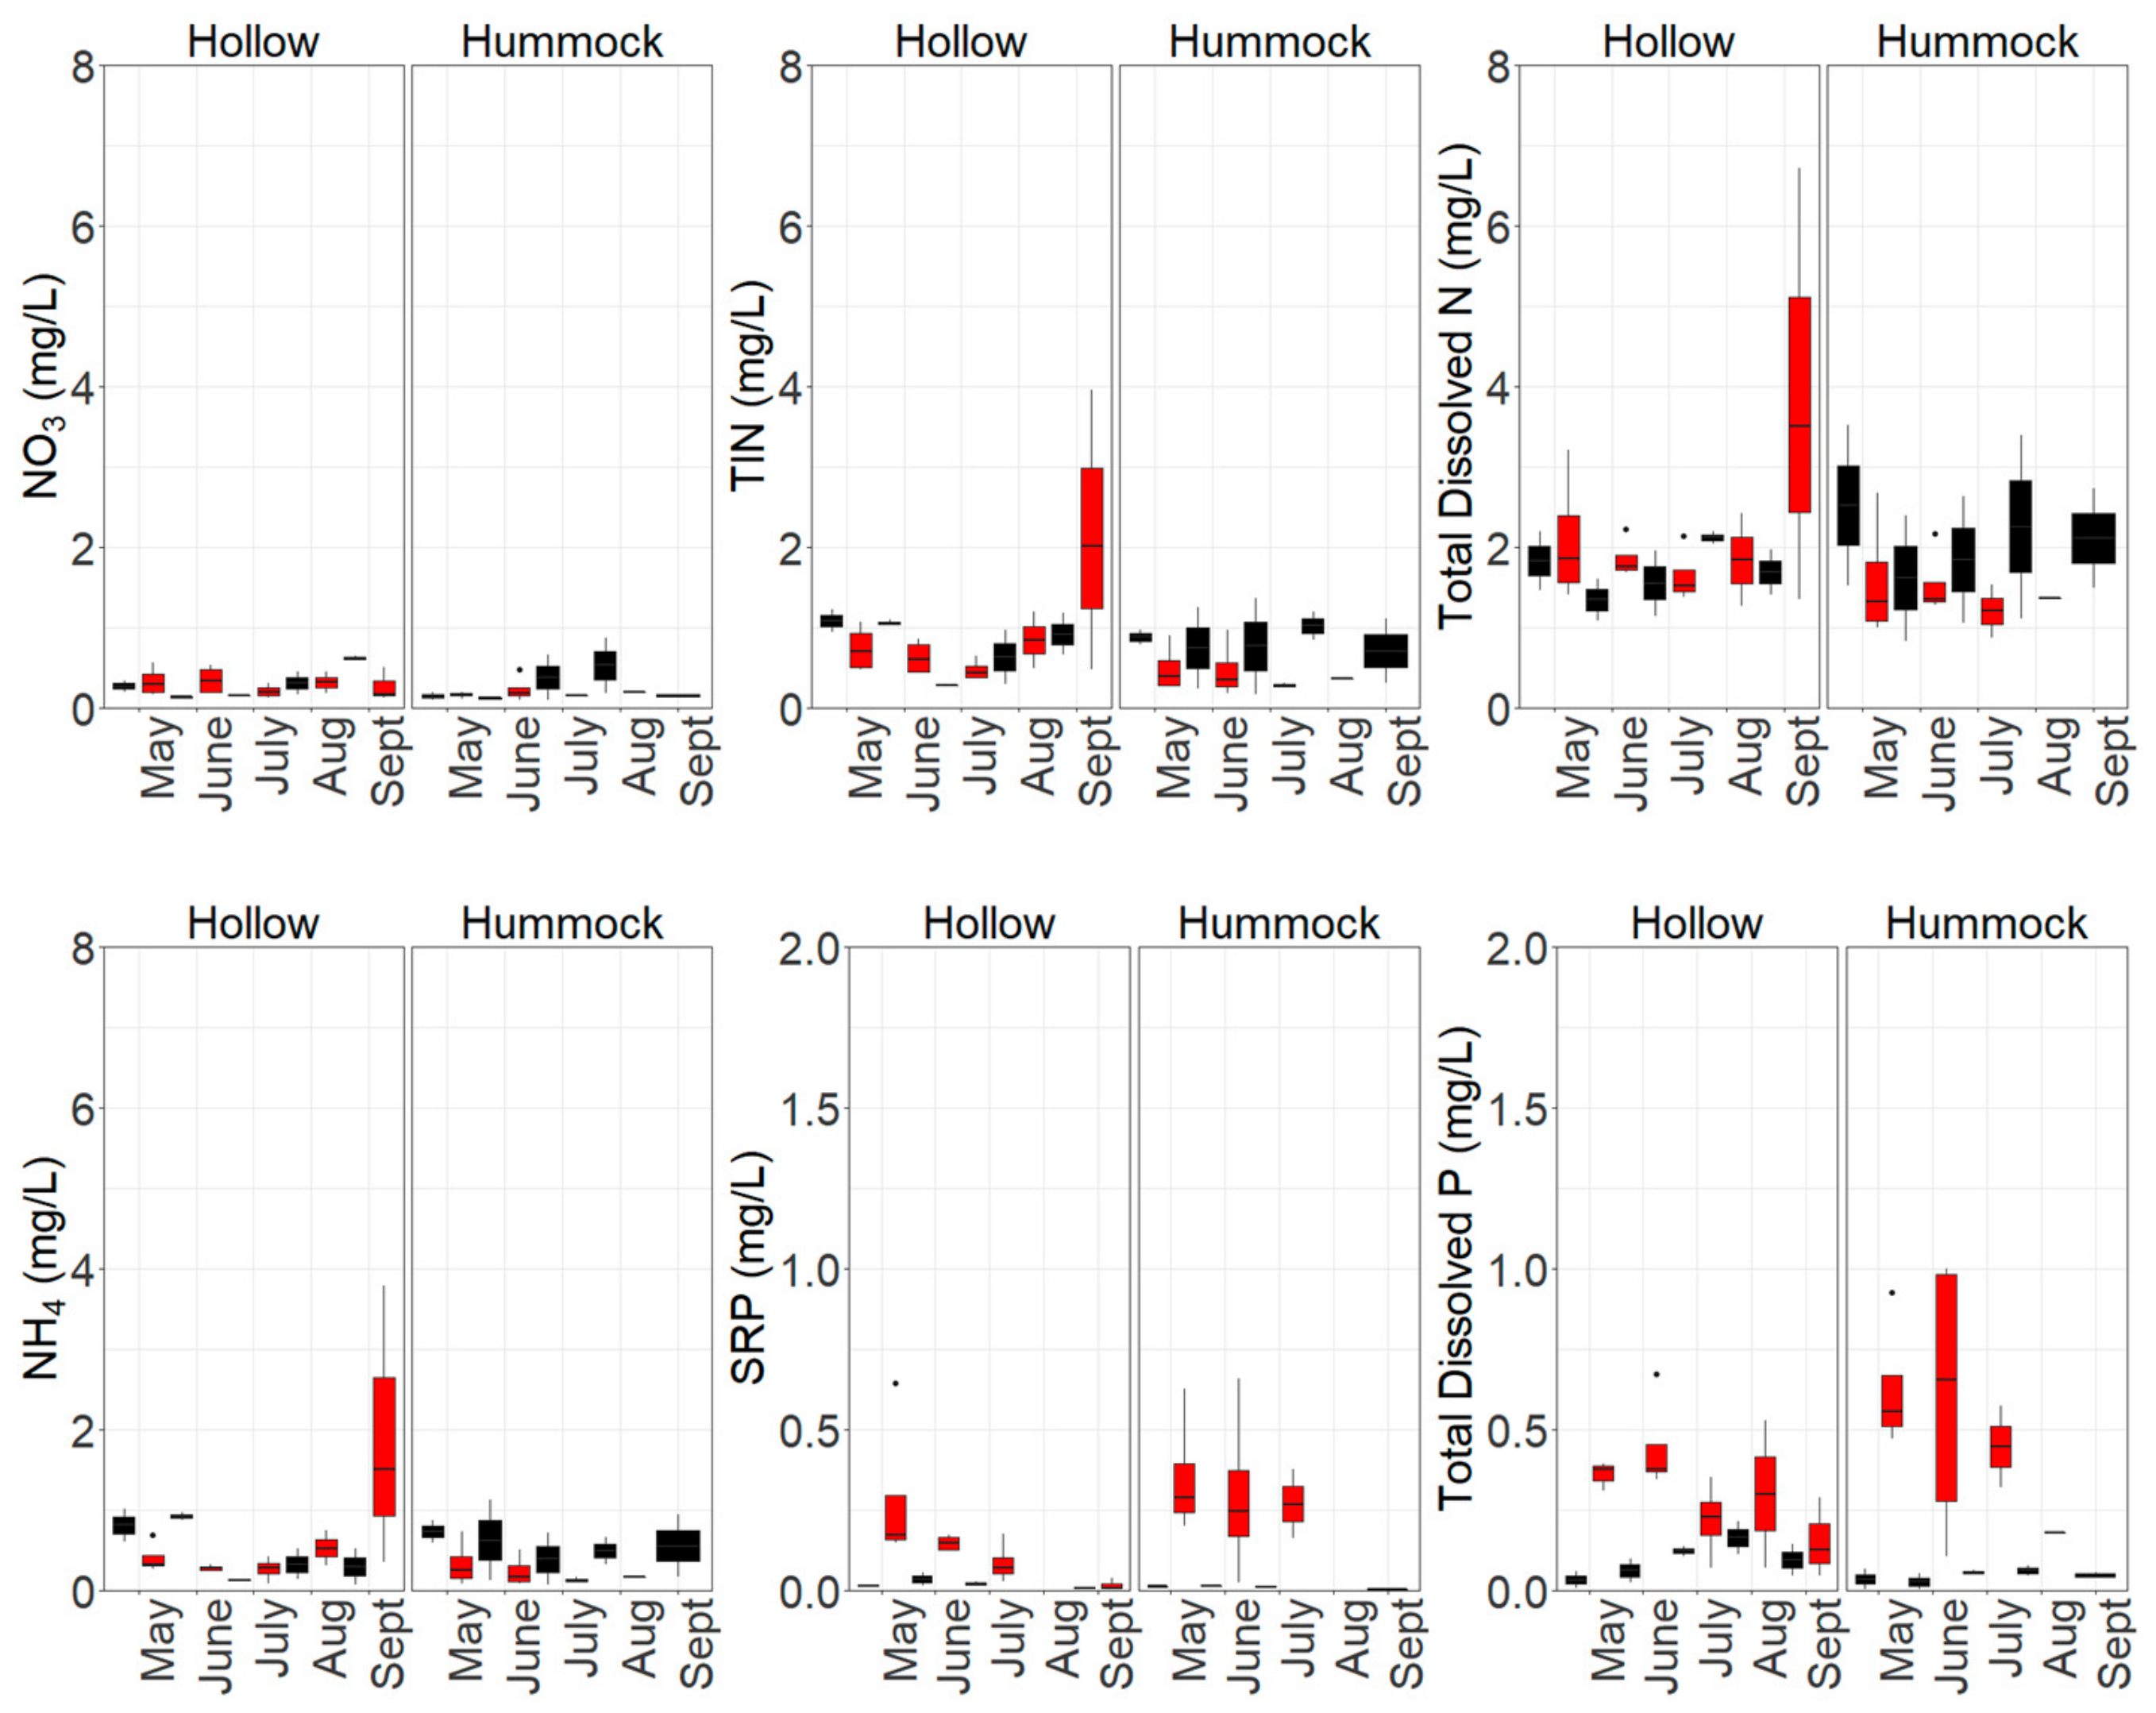
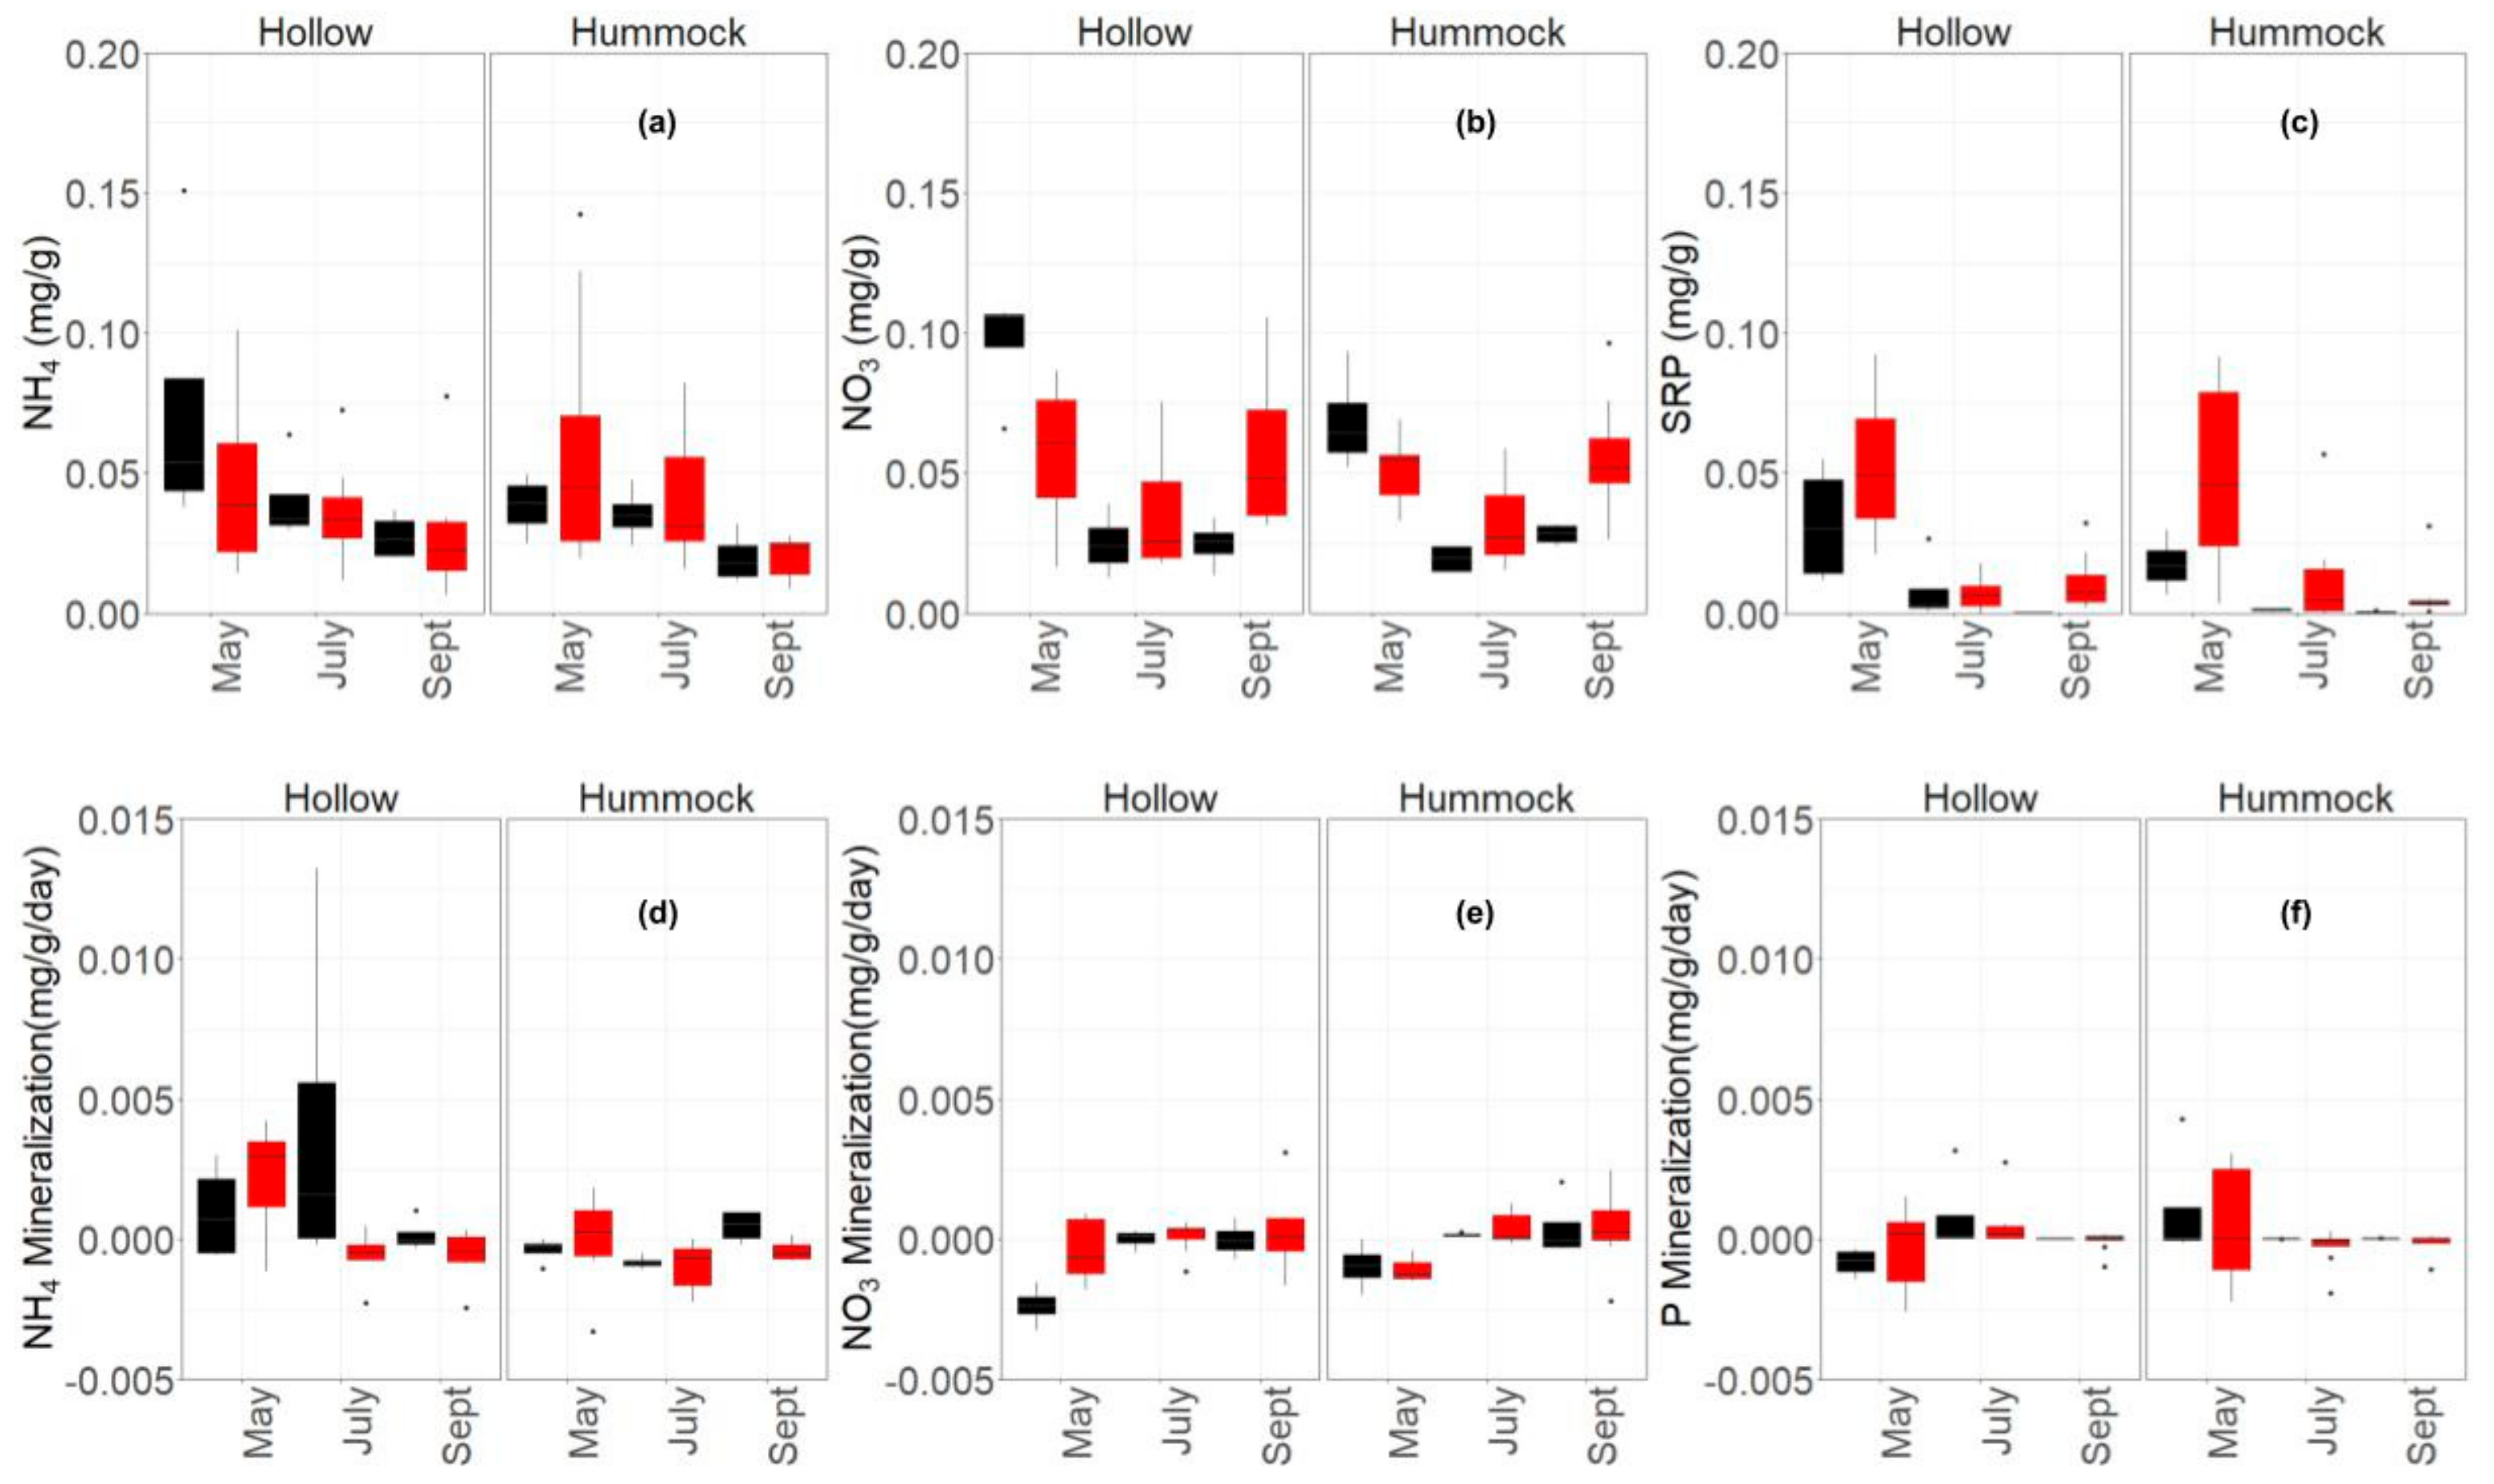
3.1. Nutrient Availability and Dynamics in Shallow Leachate, Groundwater and Peat

There were significant differences in water chemistry between the Burned and Unburned areas, and between microforms over the growing season. The concentrations of major forms of extractable nutrients (NH4+, NO3, TDN, TN, and SRP) in shallow leachate were significantly greater (p < 0.05) at the Burned areas relative to the Unburned area. Differences in shallow leachate were also observed between microforms. For example, within the Burned area, hollows (with deeper depth of burn) had greater concentrations of total N than hummocks (p < 0.01). Indeed, burned hollows had concentrations in excess of 60 mg/L N, more than 10 times greater than the largest concentration observed in the Unburned area. Although there was no significant difference in total P concentrations in shallow leachate between Burned and Unburned areas, it appears that burning still had an effect, as it reversed trends between microforms (Figure 2), where higher TP concentrations were observed in the Unburned hummocks, but in the Burned areas, hollows had higher concentrations. No significant temporal trends were observed for the inorganic N forms; however, TDN and SRP increased toward the end of the season although this was apparent at both the Burned and Unburned areas.
Water table position in the study areas showed a typical difference (p < 0.01) between microforms due to differences in elevation, where it was closer to the surface in hollows than in hummocks. The water table decreased steadily throughout the study period and was deeper in the Burned areas due to their proximity to the uplands. Unlike the shallow leachate, differences in groundwater nutrients between areas were only observed for P. All of the P forms (SRP, TDP) were significantly greater (p < 0.01) in the Burned areas in comparison to the Unburned area (Figure 3). Differences in groundwater chemistry were also observed between microforms, with significantly (p < 0.05) higher concentrations of SRP in hummocks than hollows for the Burned areas, but the reverse was found for the Unburned areas. Temporally, NH4+ in groundwater increased significantly (p < 0.05) towards the end of the season, while SRP decreased significantly (p < 0.05) toward the end season. This temporal trend was consistent in both areas and between microforms (Figure 3).
Extractable NH4+ concentrations decreased significantly (p < 0.01) over the season in peat. Net ammonification did not differ over the growing season but was significantly reduced (p < 0.05) in the Burned area, at varying rates between microforms, with lower rates (p < 0.001) in the hummocks (Figure 4). Similar patterns with microtopography were observed for net NO3 mineralization, but unlike ammonification, the rate varied significantly (p < 0.001) over the growing season. Nitrate was immobilized early in the season, whereas net mineralization occurred in the late season (p < 0.001), with Burned areas experiencing less immobilization and more mineralization (p < 0.05). Although concentrations of extractable forms of inorganic N varied temporally, this pattern was consistent across areas, where NH4+ concentrations did not vary between areas and NO3 concentrations were higher in the Burned area.
Concentrations of SRP followed a similar seasonal trend as NH4+ in peat, decreasing significantly (p < 0.001) over the season (Figure 4). However, there is a clear and significant (p < 0.05) contrast in SRP concentrations between areas, with concentrations 5 times greater in the Burned areas, especially in hollows. In the Burned area, deeper burning, with DOB ranging from 9.9 to 16.7 cm, resulted in increased availability of P. Mineralization of P varied significantly (p < 0.001) across the DOB range within microforms, with net immobilization observed in deeper burned hollows and increased mineralization in the shallow burned hummocks.

3.2. Carbon and Nutrients Stoichiometric Balance of Peat and Vegetation

Total N and P concentrations and N:P ratios were significantly higher (p < 0.05) in the upper peat layers of the Unburned area in comparison to the Burned areas (Figure 5). However, concentrations of total C, K, and the C:N and C:P ratios in peat were significantly (p < 0.05) higher in Burned areas (Table 1). Total N concentrations and C:P ratios showed significant (p < 0.01) increase with depth in the peat column, whereas C:N ratios decreased with depth (p < 0.01) in both the Unburned and Burned areas. There was a significant (p < 0.001) difference in Fe concentrations and Fe:P ratios in peat between microforms, with higher concentrations and ratios found in hollows at both areas.
Concentrations and stoichiometric analysis of macronutrients in vegetation were categorized as mosses or vascular plants (Table 2) with the N:P ratio for nutrient limitation shown in Figure 5. Total C and K in vegetation differed significantly (p < 0.05) between areas, with lower concentrations of total C and higher concentrations of K at the Burned areas. Total C and N concentrations were significantly higher (p < 0.01) in vascular plants than mosses for both the Burned and Unburned areas (Table 2). Stoichiometric balance within the vegetation did not differ between areas, but both C:N and N:P ratios differed significantly (p < 0.05) with vegetation type, with mosses having a larger C:N ratio (Table 2) and vascular plants a larger N:P ratio (Figure 5) at all areas.

4. Discussion

4.1. Increased Nutrient Availability Following Burning

In this study, Burned areas are located in the peatland margins and the Unburned area is located in the center of the fen. The Burned areas likely burned during the fire due to the margins typically having lower WTs and more feather moss then Sphagnum moss [15,37]. The burning of margins with the center of the fen remaining intact is common in the boreal region [15]. There are likely to be biogeochemical differences in the margins vs the center of the fen pre-fire; however, there are clear differences in macronutrient concentrations between the Burned and Unburned areas that go beyond the pre-fire chemistry. Averages for the large spatial area of Poplar have been examined by Nwaishi et al. [36] and Wood et al. [10], and we see that nutrient concentrations in the Burned are much higher than, and C:N:P ratios are very different from, those found in the pre-fire studies.
This study shows that burning had no effect on NH4+, and led to increases in both NO3 and P in the WBF. This concurs with previous findings on P, but contrasts with previous findings on N in other peatland studies that have generally shown a decrease in the total amounts of N, and an increase in the availability of P [38,39,40]. In a previous study [26] in the same fen (Poplar), pre-fire NH4+ comprised 80–90% of the TIN concentrations in peat. However, in Poplar post-fire, the average make-up for both the Burned and Unburned areas was, on average, 48–57% NO3 in peat. The specific mechanisms for this increase in NO3 are not clear, and additional studies to determine the cause of this are needed. The magnitude of increase in NO3 concentration observed in the Burned area was unprecedented in this area, even under dry conditions, although previous studies in Poplar [8,10,36] provided evidence on the potential for large oxidation of N following lowering of the WT over the growing season. Indeed, this increase in NO3 concentration led to a dramatic shift in the ratio of dominant forms of inorganic N, and this has important implications on post-fire N mobility and off-area exports given the high mobility of NO3 relative to NH4+. The excess NO3 observed in the Burned area may have been supplied to the Unburned areas through groundwater-surface connectivity or wind erosion of ash. Our results support this proposition, given that NO3 was considerably higher in surface leachate in the Burned areas, which are hydrologically connected to the Unburned area.
In the study fen, little net mineralization occurred in the Burned areas, especially when compared to pre-fire studies, which show high levels of net nitrification and net P mineralization for peatlands in the WBF [8,10,36]. The lower rates of mineralization observed in the Burned area could be attributed to the loss of microbial biomass through the burning of the upper peat layer, which represents a critical niche for the microbial communities that mediate nutrient mineralization processes in peatlands [17,41]. These findings suggest that peatland fire could indirectly modify the cycling of N and P through the direct effect of fire on the surface peat layer and microbial communities that dominate this critical niche.
Another significant finding of this study was the increase in available P after a fire. Similar to the work of Sulwiński et al. [38], where a peatland 11 years post-fire had concentrations of available P that were 6 times higher. Our results show that available P was 5 times higher in the Burned areas compared to the Unburned area. The median seasonal values in the Burned areas were 0.0093 mg/g and 0.0017 mg/g of peat for hollows and hummocks, respectively; however, we see that this concentration of P in the Burned areas was highest in the early season and decreased steadily throughout the growing season. The increase of P in peat due to burning was also found in a laboratory study by Wang et al. [42], where the organic P in peat was converted to inorganic P, increasing the availability of inorganic P more than twofold. In peatlands, P is geochemically reactive, especially in mineral-rich fens, where availability of P is limited by mineral control. Thus, the fate of inorganic P following fire is not clear.
The relationship between fire and P supply are dependent on several interacting factors such as pH, redox conditions and the availability of ions (e.g., Ca2+, Mg2+, and/or Fe3+ in fens) [38,43]. For instance, it is well documented in the literature that fire causes the release of P from organic matter, especially following partial combustion of organic matter, where bioavailable P is increased (i.e., sodium bicarbonate-extractable P), which is accompanied by an increase in pH. Moreover, desorption of P may occur from the Fe and Al hydrous oxides as a consequence of this increased pH and/or changes in redox conditions due to hydrophobicity post-fire. On the other hand, in mineral-rich fens, an increase in pH post fire may also lead to reactions between P and Ca2+ or Mg2+. Hence, some studies have observed no change in P availability post fire [44]. The observed increase in concentrations of available P in the Burned areas was consistent across all potential plant nutrient sources (i.e., peat, groundwater, and shallow leachate). Notably, available P was highest in the Burned hollows, which could be a result of greater burn severity in hollows than hummocks [30,45]. However, the anoxic conditions that are common in hollows may have further increased the mobility of P [46]. Indeed, P concentrations in groundwater and peat in hollows in this region have been correlated in previous studies [21].
Disturbance has been shown to cause increased nutrient input in groundwater due to the oxidation of peat [10,21,36]. Surface water infiltration through the ash layer at the Burned area allows for significantly larger concentrations of available P to be added to the groundwater, which remains apparent in groundwater, where P concentrations are significantly higher than concentrations observed in the Unburned areas. Surface infiltration of available P actually increased over the growing season, but groundwater concentrations decreased, which could be the result of a decreasing WT with a larger portion of the peat column being aerobic for surface water to infiltrate through. This infiltration over greater aerobic depths could have caused increased P retention in deeper peat layers that were unaffected by the fire. The significant increase of P in these nutrient-poor peatlands has the potential to increase P loading to adjacent downstream aquatic ecosystems, or, local vegetation shifts [46]. Furthermore, vegetation shifts from post-fire regrowth can lead to the development of highly productive species, which have the ability to out-compete typical fen species, especially mosses that are critical for slow decomposition rates and net carbon sequestration function [38,47]. The effects of increased P availability can be long-lasting [48]. When coupled with a warmer and drier climate, the resiliency of both the regrowth of fen species and the persistence of P effects have the potential to change fens like Poplar into a carbon source, changing their pre-fire ecosystem function [38,49].

4.2. Wildfire Disturbance on the Nutrient Stoichiometry Balance

Burned area N and P concentrations were higher than those in the Unburned area, which likely affects vegetation, litter quality and the oxidation and turnover of C [43,50,51]. Elevated levels of N and P in the peat could affect microbial breakdown as the mismatch in the stoichiometry of peat and microbes could accelerate decomposition and change C sequestration functionality [36,42]. The N:P ratio for vegetation was examined to assess potential changes in nutrient limitation patterns for plant growth relative to N:P imbalances of peat and groundwater nutrient reservoirs for the Unburned and Burned areas (Figure 5).
Based on the Redfield Ratio, plant growth is commonly classified as N- or P-limited, when the N:P is smaller than 14 or larger than 16, respectively, with the possibility of co-limitation when the ratio falls between 14 and 16 [52,53]. In most peatlands, N is the limiting nutrient due to the low mineralization rates and limited exogenous nutrient inputs in often-isolated peatlands [54,55]. However, this is probably not the case in our study area, because Poplar is located within the vicinity of active industrial development in the Alberta Oil Sands Region [36]. A previous study in Poplar, in the same area as this study but pre-fire (where it is denoted as the “Rich Fen”) by Nwaishi et al. [36], found that both mosses and vascular vegetation were N-limited, while the peat and groundwater nutrient balances were dominated by N. This is consistent with other findings, which show that N:P ratios in plants do not reflect the N and P concentrations in peat or other potential nutrient sources [56]. Nwaishi et al. [36] also showed that disturbance associated with road-construction through a peatland modified the pattern of N:P limitation, leading to a shift from N-limitation toward NP co-limitation. Although this was a different type of disturbance compared to Poplar’s natural disturbance, the results agree with the theory the oxidation of organic peat material as result of disturbance (either from drying or from fire) can modify the N:P ratios of plants and potential nutrient sources in peatlands.
In this study, the N:P ratios of mosses at the Unburned and Burned areas were 16 and 15, respectively, while vascular species were 29 and 24, respectively (Figure 5). This suggests the mosses were co-limited and vascular plants were P-limited in both areas. In contrast, peat had average N:P ratios of 43 and 51, respectively, indicating N limitation (Figure 5). Both shallow leachate and groundwater were N-limited. For example, shallow leachate in both the Burned and Unburned areas had average N:P ratios of 4 and 6, respectively. Groundwater had higher P concentrations relative to N in the Burned areas, and the reverse was true in the Unburned area, which is indicative of the higher P concentrations in the Burned areas. The stoichiometric ratios shown here contrast with the work of Nwaishi et al. [36], where vegetation was N-limited and any potential nutrient sources (peat and groundwater) were P-limited. We suggest that the change in nutrient limitation shown by plants is very likely due to the wildfire disturbance, and the shifting stoichiometric ratios in both plants and water are related. Future studies should determine the specific mechanisms behind these shifts.
Clear differences in peat stoichiometry were observed between the Burned and Unburned areas of the peatland. Our results show that C:N and C:P ratios were higher in Burned peat than in Unburned (Table 1 and Table 2). Notwithstanding the increase in concentration of available P in the Burned peat, there was no significant decrease in the C:P ratio of peat. This suggests that the P released through the oxidation of burned peat does not affect the C: P ratio of the residual peat, which is mostly comprised of the recalcitrant C fraction. The P released from burned peat facilitates increased biomass productivity. Thus, an imbalance between high biomass production and lower decomposition of recalcitrant residual peat has the potential to support net carbon storage in peatlands post-fire [36,57,58,59]. The fire also impacted the N stock, decreasing N stock by as much as 33% and changing the C:N ratio [40]. Additionally, the Burned areas exceeded both critical threshold ratios (>40 and >200 for C:N and C:P, respectively) for microbially mediated substrate mineralization [60]. The potential presence of this microbial substrate limitation suggests that newly introduced labile substrates from pioneer plants will be allocated towards the recovery of microbial biomass [36,60], further increasing potential for short-term carbon storage.

5. Conclusions

This study tested the effect of wildfire on peatland nutrient availability and cycling. Our results indicate that fire increased nutrient availability, with the severity of burn playing a key role in increased nutrient availability and plant regrowth. The significant increase in availability of P post fire, with only a slight elevation of inorganic N, created a disproportionality between the two macro nutrients that control ecosystem biogeochemical processes. This disproportionality in macronutrient concentrations potentially modified the pattern of N:P balance in vegetation, shifting from pre-fire N-limited conditions of vegetation towards NP co-limitation. Based on existing knowledge of peatland nutrient biogeochemistry, the observed increase in bioavailable P in the Burned areas of our study site has the potential to increase biomass productivity, with high atmospheric CO2 uptake, and reduced microbial respiration due low microbial biomass and a recalcitrant quality of the post-fire peat substrate. Most of the biogeochemical parameters measured in this study also suggest that nutrient conditions in the Burned areas of our site will support a net C storage. However, the feedback effect of elevated P on plant productivity and C storage has not yet been quantified. Although our study is limited by the spatial and temporal scope, it presents an important set of new information that allows for direct comparison of pre- and post-wildfire nutrient biogeochemistry in a specific peatland, providing baseline information for future meta-analysis of wildfire effects on peatland biogeochemical processes.

Author Contributions

Conceptualization, C.v.B., R.P. and F.N.; Data curation, C.v.B.; Formal analysis, C.v.B., R.P.; Funding acquisition, R.P.; Investigation, C.v.B.; Methodology, R.P., C.v.B., F.N. and J.M.W.; Project administration, R.P.; Resources, R.P. and M.M.; Software, C.v.B.; Supervision, R.P.; Visualization, R.P., F.N., J.M.W. and M.M.; Writing—original draft, C.v.B.; Writing—review & editing, C.v.B., R.P., M.M., F.N. and J.M.W.

Funding

This research was funded through: (1) an NSERC Collaborative Research and Development Grant (CRD), # 418557-2011, entitled “Evaluating the success of fen creation in the post oil sands landscape” with funding from Suncor Energy Inc., Shell Canada Ltd., Imperial Oil Resources Ltd. This initiative is a part of a Joint Industry Project convened under Canada’s Oil Sands Innovation Alliance (COSIA), Land Environmental Priority Area (EPA) led by Suncor Energy with Shell Canada and Imperial Oil; (2) a Canada First Research Excellence Fund Grant—Boreal Water Futures, as part of the Global Water Futures Program.

Acknowledgments

Thank you to Emily Bobbett and her colleagues at Keyano College for providing access to their laboratory for sample preparation, to Vito Lam for the assistance with the nutrient analysis, and to Scott Davidson and James Elliott for assistance with the statistical analysis in R. Special thanks to Natasa Popovic, Matt Coulas, Owen Sutton, Eric Kessel, and Adam Green for assistance with field sampling.

Conflicts of Interest

The authors declare no conflict of interest. The funders had no role in the design of the study; in the collection, analyses, or interpretation of data; in the writing of the manuscript, or in the decision to publish the results.

References

  1. Bridgham, S.D.; Megonigal, J.P.; Jason KKeller, J.K.; Bliss, N.B.; Trettin, C. The carbon balance of North American wetlands. Wetlands 2006, 26, 889–916. [Google Scholar] [CrossRef]
  2. Vitt, D.H.; Halsey, L.A.; Bauer, I.E.; Campbell, C. Spatial and temporal trends in carbon storage of peatlands of continental western Canada through the Holocene. Can. J. Eartth Sci. 2000, 37, 683–693. [Google Scholar] [CrossRef]
  3. Vitt, D.H.; Wieder, R.K.; Scott, K.D.; Faller, S. Decomposition and peat accumulation in rich fens of boreal Alberta, Canada. Ecosystems 2009, 12, 360373. [Google Scholar] [CrossRef]
  4. Tarnocai, C. The effect of climate change on carbon in Canadian peatlands. Glob. Planet. Chang. 2006, 53, 222–232. [Google Scholar] [CrossRef]
  5. Kettridge, N.; Turetsky, M.R.; Sherwood, J.H.; Thompson, D.K.; Miller, C.A.; Benscoter, B.W.; Flannigan, M.D.; Wotton, B.M.; Waddington, J.M. Moderate drop in water table increases peatland vulnerability to post-fire regime shift. Sci. Rep. 2015, 5, 8063. [Google Scholar] [CrossRef] [PubMed]
  6. Macrae, M.L.; Devito, K.J.; Strack, M.; Waddington, J.M. Effect of water table drawdown on peatland nutrient dynamics: Implications for climate change. Biogeochemistry 2013, 112, 661–676. [Google Scholar] [CrossRef]
  7. Rydin, H.; Jeglum, J. The biology of Peatlands. In Biology Habitats; Oxford University Press: Oxford, UK, 2013; p. 354. [Google Scholar]
  8. Nwaishi, F.; Petrone, R.M.; Price, J.S.; Andersen, R. Towards developing a functional-based approach for constructed peatlands evaluation in the Alberta oil sands region, Canada. Wetlands 2015, 35, 211–225. [Google Scholar] [CrossRef]
  9. Proemse, B.C.; Mayer, B.; Fenn, M.E.; Ross, C. A multi-isotope approach for estimating industrial contributions to atmospheric nitrogen deposition in the Athabasca oil sands region in Alberta, Canada. Environ. Pollut. 2013, 182, 80–91. [Google Scholar] [CrossRef] [PubMed]
  10. Wood, M.E.; Macrae, M.L.; Strack, M.; Price, J.S.; Osko, T.J.; Petrone, R.M. Spatial variation in nutrient dynamics among five different peatland types in the Alberta oil sands region. Ecohydrology 2015, 9, 688–699. [Google Scholar] [CrossRef]
  11. Borkenhagen, A.K. Reference Fens: Vegetation Community Types; Unpublished Report Prepared for NSERC CRD Suncore Energy Inc. Pilot Fen Project; Department of Forest and Rangeland Stewardship, Colorado State University: Fort Collins, CO, USA, 2013. [Google Scholar]
  12. Elmes, M. Hydrology of a Moderate–Rich Fen Watershed Prior to, and Following Wildfire in the Western Boreal Plain, Northern Alberta, Canada; UWSpace, University of Waterloo: Waterloo, ON, Canada, 2018; Available online: http://hdl.handle.net/10012/13740 (accessed on 1 April 2018).
  13. Nwaishi, F.; Petrone, R.M.; Macrae, M.L.; Price, J.S.; Strack, M.; Slawson, R.; Andersen, R. Above and below-ground nutrient cycling: A criteria for assessing the biogeochemical functioning of a constructed fen. Appl. Soil Ecol. 2016, 98, 177–194. [Google Scholar] [CrossRef]
  14. Kasischke, E.S.; Turetsky, M.R.; Ottmar, R.D.; French, N.H.F.; Hoy, E.E.; Kane, E.S. Evaluation of the composite burn index for assessing fire severity in Alaskan black spruce forests. Int. J. Wildland Fire 2008, 17, 515–526. [Google Scholar] [CrossRef]
  15. Lukenbach, M.C.; Devito, K.J.; Kettridge, N.; Petrone, R.M.; Waddington, J.M. Hydrogeological controls on post-fire moss recovery in peatlands. J. Hydrol. 2015, 530, 405–418. [Google Scholar] [CrossRef]
  16. Mack, M.; Schuur, E.; Syndonia Bret-Harte, M.; Shaver, G.; Chapin, F.S., III. Ecosystem C storage in Arctic tundra reduced by long-term nutrient fertilization. Nature 2004, 431, 440. [Google Scholar] [CrossRef] [PubMed]
  17. Elliott, D.R.; Caporn, S.J.; Nwaishi, F.; Nilsson, R.H.; Sen, R. Bacterial and fungal communities in a degraded ombrotrophic peatland undergoing natural and managed re-vegetation. PLoS ONE 2015, 10, e0124726. [Google Scholar] [CrossRef] [PubMed]
  18. Hart, S.C.; Nason, G.E.; Myrold, D.D.; Perry, D.A. Dynamics of gross nitrogen transformations in an old-growth forest: The carbon connection. Ecology 1994, 75, 880–891. [Google Scholar] [CrossRef]
  19. Hart, S.C.; Stark, J.M.; Davidson, E.A.; Firestone, M.K. Nitrogen mineralization, immobilization, and nitrification. In Methods of Soil Analysis: Part 2—Microbiological and Biochemical Properties, SSSA Book Ser. 5.2; Bottomley, P.S., Angle, J.S., Weaver, R.W., Eds.; SSSA: Madison, WI, USA, 1994; pp. 985–1018. [Google Scholar] [CrossRef]
  20. Pote, D.H.; Daniel, T.C.; Moore, P.A.; Nichols, D.J.; Sharpley, A.N.; Edwards, D.R. Relating extractable soil phosphorus to phosphorus losses in runoff. Soil Sci. Soc. Am. J. 1996, 60, 855–859. [Google Scholar] [CrossRef]
  21. Plach, J.M.; Wood, M.E.; Macrae, M.L.; Osko, T.J.; Petrone, R.M. Effect of a semi-permanent road on N, P, and CO2 dynamics in a poor fen on the Western Boreal Plain, Canada. Ecohydrology 2017, 10, e1874. [Google Scholar] [CrossRef]
  22. Parkinson, J.A.; Allen, S.E. A wet oxidation procedure suitable for the determination of nitrogen and mineral nutrients in biological material. Commun. Soil Sci. Plant Anal. 1975, 6, 1–11. [Google Scholar] [CrossRef]
  23. Griffiths, N.A.; Sebestyen, S.D. Dynamic vertical profiles of peat porewater chemistry in a northern peatland. Wetlands 2016, 36, 1119–1130. [Google Scholar] [CrossRef]
  24. Badiou, P.; Page, B. Wetland Road Crossings Hydrological Monitoring Design and Data Summary; Ducks Unlimited Canada, Institute for Wetland and Waterfowl Research: Stonewall, MB, Canada, 2014; 49p. [Google Scholar]
  25. R Development Core Team. R: A Language and Environment for Statistical Computing; R Development Core Team: Vienna, Austria, 2013; Available online: ftp://ftp.uvigo.es/CRAN/web/packages/dplR/vignettes/intro-dplR.pdf (accessed on 1 April 2019).
  26. Hurlbert, S.H. Pseudoreplication and the design of ecological field experiments. Ecol. Monogr. 1984, 54, 187–211. [Google Scholar] [CrossRef]
  27. Davies, G.M.; Gray, A. Don’t let spurious accusations of pseudoreplication limit our ability to learn from natural experiments (and other messy kinds of ecological monitoring). Ecol. Evol. 2015, 5, 5295–5304. [Google Scholar] [CrossRef]
  28. Hokanson, K.J.; Moore, P.A.; Lukenbach, M.C.; Devito, K.J.; Kettridge, N.; Petrone, R.M.; Mendoza, C.A.; Waddington, J.M. A Hydrogeological landscape framework to identify peatland wildfire smouldering hotspots. Ecohydrol. Lett. 2018, 11. [Google Scholar] [CrossRef]
  29. Lukenbach, M.C.; Kettridge, N.; Devito, K.J.; Petrone, R.M.; Waddington, J.M. Burn severity alters peatland moss water availability: Implications for post-fire recovery. Ecohydrology 2016, 9, 341–353. [Google Scholar] [CrossRef]
  30. Benscoter, B.W.; Wieder, R.K. Variability in organic matter lost by combustion in a boreal bog during the 2001 Chisholm fire. Can. J. For. Res. 2003, 33, 2509–2513. [Google Scholar] [CrossRef]
  31. Shetler, G.; Turetsky, M.; Kane, E.S.; Kasischke, E.S. Sphagnum mosses limit total carbon consumption during fire in Alaskan black spruce forests. Can. J. For. Res. 2008, 38, 2328–2336. [Google Scholar] [CrossRef]
  32. Benscoter, B.W.; Thompson, D.K.; Waddington, J.M.; Flannigan, M.D.; Wotton, M.; DeGroot, W.; Turetsky, M.R. Interactive effects of vegetation, soil moisture, and bulk density on the burning of thick organic soils. Int. J. Wildfire 2011, 20, 418–429. [Google Scholar] [CrossRef]
  33. Hokanson, K.J.; Lukenbach, M.C.; Devito, K.J.; Kettridge, N.; Petrone, R.M.; Waddington, J.M. Groundwater connectivity controls peat burn severity in the Boreal Plains. Ecohydrology 2016, 9, 574–584. [Google Scholar] [CrossRef]
  34. Thompson, D.K.; Waddington, J.M. Peat properties and water retention in boreal forested peatlands subject to wildfire. Water Resour. Res. 2013, 49, 3651–3658. [Google Scholar] [CrossRef]
  35. Thompson, D.K.; Wotton, B.M.; Waddington, J.M. Estimating the heat transfer to an organic soil surface during crown fire. Int. J. Wildland Fire 2015, 24, 120–129. [Google Scholar] [CrossRef]
  36. Nwaishi, F.; Plach, J.M.; Petrone, R.M.; Morison, M.Q.; Macrae, M.L. Nutrient balance and carbon storage in the soil-plant system of boreal peatlands within the vicinity of active industrial development in Western Canada. Sci. Total Environ. 2019. under revision. [Google Scholar]
  37. Mayner, K.M.; Moore, P.A.; Wilkinson, S.; Petrone, R.M.; Waddington, J.M. Delineating boreal plains bog margin ecotones across hydrogeological settings for wildfire risk management. Wetl. Ecol. Manag. 2019, in press. [Google Scholar] [CrossRef]
  38. Sulwiński, M.; Mętrak, M.; Suska-Malawska, M. Long-term fire effects of the drained open fen on organic soils. Arch. Environ. Prot. 2017, 43, 11–19. [Google Scholar] [CrossRef] [Green Version]
  39. Laubhan, M.K. Effects of prescribed fire on moist-soil vegetation and soil macronutrients. Wetlands 1995, 15, 159–166. [Google Scholar] [CrossRef]
  40. Neff, J.C.; Harden, J.W.; Gleixner, G. Fire effects on soil organic matter content, composition, and nutrients in boreal interior Alaska. Can. J. For. Res. 2005, 35, 2178–2187. [Google Scholar] [CrossRef]
  41. Mandic-Mulec, I.; Ausec, L.; Danevčič, T.; Levičnik-Höfferle, Š.; Jerman, V.; Kraigher, B. Microbial community structure and function in peat soil. Food Technol. Biotechnol. 2014, 52, 180–187. [Google Scholar]
  42. Wang, G.; Yu, X.; Bao, K.; Gao, C.; Lin, Q.; Lu, X. Effect of Fire on phosphorus forms in Sphagnum moss and peat soils of ombrotrophic bogs. Chemosphere 2014, 119, 1329–1334. [Google Scholar] [CrossRef]
  43. Manzoni, S.; Trofymow, J.A.; Jackson, R.B.; Porporato, A. Stoichiometric controls on carbon, nitrogen, and phosphorus dynamics in decomposing litter. Ecol. Monogr. 2010, 80, 89–106. [Google Scholar] [CrossRef]
  44. Dikici, H.; Yilmaz, H.C. Peat Fire Effects on Some Properties of an Artificially Drained Peatland. J. Environ. Qual. 2006, 35, 866–870. [Google Scholar] [CrossRef]
  45. Benscoter, B.W.; Wieder, R.K.; Vitt, D.H. Linking microtopography with post-fire succession in bogs. J. Veg. Sci. 2005, 16, 453–460. [Google Scholar] [CrossRef]
  46. Grygoruk, M.; Bańkowska, A.; Jabłońska, E.; Janauer, G.A.; Kubrak, J.; Mirosław-Świątek, D.; Kotowski, W. Assessing habitat exposure to eutrophication in restored wetlands: Model supported ex-ante approach to rewetting drained mires. J. Environ. Manag. 2015, 152, 230–240. [Google Scholar] [CrossRef]
  47. Verhoeven, J.T.; Koerselman, W.; Meuleman, A.F. Nitrogen- or phosphorus-limited growth in herbaceous, wet vegetation: Relations with atmospheric inputs and management regimes. Trends Ecol. Evol. 1996, 11, 494–497. [Google Scholar] [CrossRef]
  48. Zak, D.; Gelbrecht, J.; Zerbe, S.; Shatwell, T.; Barth, M.; Cabezas, A.; Steffenhagen, P. How helophytes influence the phosphorus cycle in degraded inundated peat soils—Implications for fen restoration. Ecol. Eng. 2014, 66, 82–90. [Google Scholar] [CrossRef]
  49. Schrautzer, J.; Sival, F.; Breuer, M.; Runhaar, H.; Fichtner, A. Characterizing and evaluating successional pathways of fen degradation and restoration. Ecol. Eng. 2013, 25, 108–120. [Google Scholar] [CrossRef]
  50. Moore, T.R.; Trofymow, J.A.; Siltanen, M.; Prescott, C. Patterns of decomposition and carbon, nitrogen, and phosphorus dynamics of litter in upland forest and peatland sites in central Canada. Can. J. For. Res. 2005, 35, 133–142. [Google Scholar] [CrossRef]
  51. Güsewell, S.; Gessner, M.O. N:P ratios influence litter decomposition and colonization by fungi and bacteria in microcosms. Funct. Ecol. 2009, 23, 211–219. [Google Scholar] [CrossRef]
  52. Wang, M.; Moore, T.R.; Talbot, J.; Richard, P.J. The cascade of C:N:P stoichiometry in an ombrotrophic peatland: From plants to peat. Environ. Res. Lett. 2014, 9, 24003. [Google Scholar] [CrossRef]
  53. Koerselman, W.; Meuleman, A.F. The Vegetation N:P Ratio: A New Tool to Detect the 563 Nature of Nutrient Limitation. J. Appl. Ecol. 1996, 33, 1441–1450. [Google Scholar] [CrossRef]
  54. Aerts, R.; Wallen, B.; Malmer, N. Growth-Limiting Nutrients in Sphagnum-Dominated Bogs Subject to Low and High Atmospheric Nitrogen Supply. J. Ecol. 1992, 80, 131–140. [Google Scholar] [CrossRef]
  55. Gunnarsson, U.; Rydin, H. Nitrogen fertilization reduces Sphagnum production in bog communities. New Phytol. 2000, 147, 527–537. [Google Scholar] [CrossRef]
  56. Güsewell, S.; Koerselman, W. Variation in nitrogen and phosphorus concentrations of wetland plants. Perspect. Plant Ecol. Evol. Syst. 2002, 5, 37–61. [Google Scholar] [CrossRef]
  57. Bradford, M.A.; Fierer, N.; Reynolds, J.F. Soil carbon stocks in experimental mesocosms are dependent on the rate of labile carbon, nitrogen and phosphorus inputs to soils. Funct. Ecol. 2008, 510, 964–974. [Google Scholar] [CrossRef]
  58. Lavoie, M.; Mack, M.C.; Schuur, E.A. Effects of elevated nitrogen and temperature on carbon and nitrogen dynamics in Alaskan arctic and boreal soils. JGR Biogeosci. 2011, 116. [Google Scholar] [CrossRef] [Green Version]
  59. Limpens, J.; Granath, G.; Gunnarsson, U.; Aerts, R.; Bayley, S.; Bragazza, L.; Bubier, J.; Buttler, A.; Van den Berg, L.J.; Francez, A.J.; et al. Climatic modifiers of the response to nitrogen deposition in peat-forming sphagnum mosses: A meta-analysis. New Phytol. 2011, 191, 496–507. [Google Scholar] [CrossRef]
  60. Verhoeven, J.T.A. Nutrient dynamics in minerotrophic peat mires. Aquat. Bot. 1986, 25, 117–137. [Google Scholar] [CrossRef]
Figure 1. Map of the Poplar study area denoting the Burned and Unburned areas after the wildfire, and the three study transects: two burned and one unburned area of the fen.
Diversity 11 00142 g001
Figure 2. Shallow leachate concentrations over the growing season, comparing the Unburned (red) and Burned (black) areas and the microtopographical differences observed.
Diversity 11 00142 g002
Figure 3. Groundwater nutrient concentrations over the growing season, comparing the Unburned (red) and Burned (black) areas and the microtopographical differences observed.
Diversity 11 00142 g003
Figure 4. Extractable (ac) and mineralization rates (df) for ammonium (NH4+) (a) and (d), nitrate (NO3) (b) and (e), and phosphorus (SRP) (c) and (f) over the growing season (May to September 2017), with 3 study periods (early, middle, and late). Burned areas (black) and Unburned areas (red) are differentiated, with microtopography shown in different panels for hollow and hummocks.
Diversity 11 00142 g004
Figure 5. N:P ratios comparing pre-fire data from Nwaishi et al. [36] in the same location. Pre-fire (grey), Unburned (red), and Burned (black) areas are shown for potential sources of imbalance (groundwater, surface infiltration, and peat), as well as moss and vascular vegetation, illustrating the shifting nutrient limitations after wildfire disturbance.
Diversity 11 00142 g005
Table 1. Carbon and macronutrient concentrations and nutrient ratios are shown from peak season period, comparing the Unburned and Burned areas and the microtopographical differences. Standard deviations of samples are provided in parentheses. n/d is the result of samples being below the detection limit of the ICP analysis.
TransectMicroformDepth (cm)Macronutrient ConcentrationsNutrient Ratios
CNPFeKC:NC:PN:PFe:P
(mg/g)Ratio
UnburnedHollow0–5415.8 (20.6)17.2 (5.2)1.8 (1.6)2.7 (1.1)1.6 (0.9)27 (10.4)393 (364.5)12 (6)3 (3.2)
5–10415 (13.4)19.2 (4.4)0.9 (0)3.2 (2.7)17.3 (3.7)23 (6.1)475 (29.9)24 (0.1)4 (3.1)
10–15434.9 (24.3)18.1 (5.3)0.7 (0.1)2.3 (1.4)14.8 (19.5)25 (5.6)597 (5.1)27 (7.6)3 (1.7)
15–20404.6 (40.9)16.6 (7.1)0.7 (0)2.9 (2.3)20.2 (26.3)27 (8.7)609 (38.1)26 (15.2)4 (3)
UnburnedHummock0–5445.5 (41.1)14.3 (4.9)0.6 (0.2)1.2 (0.3)18.6 (12)35 (13.9)722 (217.3)20 (5.2)2 (0)
5–10438.2 (10.8)17.7 (5.5)0.7 (0.2)1.3 (0.6)n/d27 (11.5)653 (176.1)22 (6.6)2 (0.3)
10–15405.6 (88.2)19.8 (8.5)0.6 (0.2)1.4 (0.1)n/d24 (10)586 (3.7)23 (11.5)2 (0.6)
15–20422.5 (17.7)21.7 (2.8)0.8 (0.1)1.2 (0.2)n/d20 (2.5)539 (96.9)31 (7)2 (0.4)
BurnedHollow0–5457.4 (26.9)10.3 (1.3)0.8 (0.2)2.9 (1.7)80.5 (66.4)45 (8)673 (306.4)16 (6.1)4 (1.3)
5–10479.2 (31.4)12.2 (2.5)0.6 (0.2)1.4 (0.7)34.7 (20)42 (14.1)903 (397.1)20 (1.4)2 (0.7)
10–15461.7 (55.1)12.8 (3.1)0.5 (0.2)1.7 (1.7)25.5 (20.7)40 (18.6)977 (580.1)20 (4.2)3 (2.8)
15–20460.7 (10.5)14.3 (2.8)0.8 (0.3)2 (1.8)19.6 (18.3)34 (8.2)688 (275.9)20 (7)2 (1.3)
BurnedHummock0–5477 (17.7)9.5 (1.9)0.5 (0)0.6 (0.4)40.4 (15.4)52 (11.2)975 (79.7)17 (0.8)1 (0.9)
5–10478.3 (14)11 (3.8)0.6 (0.2)0.8 (0.5)24.3 (35)49 (20.3)812 (249.9)19 (2.3)1 (0.4)
10–15471.5 (14.3)13.4 (2.8)0.7 (0.3)0.8 (0.6)3.4 (4.1)38 (12.8)849 (460)20 (4.5)1 (0.4)
15–20462.4 (24.1)14.6 (2.5)0.7 (0.2)1.3 (1.3)12.8 (15.7)33 (8.8)715 (281.9)21 (3.3)2 (1.8)
Table 2. Macronutrient concentrations and nutrient ratios are shown for both moss and vascular vegetation from peak season, comparing the Unburned and Burned areas and the microtopographical difference observed. Standard deviations of samples are provided in parentheses.
TransectVegetation TypeMacronutrient ConcentrationsNutrient Ratios
CNPFeKC:NC:PN:P
(mg/g)Ratio
UnburnedMoss443 (3.2)8.8 (1.4)1.1 (1.3)341.9 (333.5)1.4 (0.9)51.3 (8.5)380 (230.4)7.1 (3.3)
UnburnedVascular512.9 (31.5)17.8 (5.4)0.8 (0.9)232 (280.5)1.7 (1.1)31.9 (12.4)445.9 (336.8)13.2 (7.1)
BurnedMoss449 (38.5)8.7 (2.4)0.9 (0.7)52.8 (101)2 (1.2)54.6 (12.7)345.1 (241.3)6.3 (4.4)
BurnedVascular476.5 (47.2)17.4 (5.6)1.1 (0.8)12.1 (10.7)1.6 (0.4)30.9 (12.5)314.4 (78.8)11.7 (5.6)

