Article

Seasonal Physiological Parameters and Phytotelmata Bacterial Diversity of Two Bromeliad Species (Aechmea gamosepala and Vriesea platynema) from the Atlantic Forest of Southern Brazil

by
Adriana Giongo
1,
Renata Medina-Silva
1,2,
Leandro V. Astarita
2,
Luiz Gustavo dos A. Borges
1,
Rafael R. Oliveira
1,
Taiz L. L. Simão
2,
Kelsey A. Gano
3,
Austin G. Davis-Richardson
3,
Christopher T. Brown
3,
Jennie R. Fagen
3,
Pedro M. Arzivenco
2,
Calino P. Neto
2,
André D. Abichequer
4,
Catiéli G. Lindholz
2,
Anelise Baptista-Silva
2,
Claudio A. Mondin
2,
Laura R. P. Utz
2,
Eric W. Triplett
3 and
Eduardo Eizirik
2,*
1
Pontifícia Universidade Católica do Rio Grande do Sul (PUCRS), Instituto do Petróleo e dos Recursos Naturais, Porto Alegre, RS 90619-900, Brazil
2
Pontifícia Universidade Católica do Rio Grande do Sul (PUCRS), Escola de Ciências, Porto Alegre, RS 90619-900, Brazil
3
Department of Microbiology and Cell Science, Institute of Food and Agricultural Sciences, University of Florida (UF), Gainesville, FL 32611, USA
4
Departamento de Diagnóstico e Pesquisa Agropecuária, Secretaria da Agricultura, Pecuária e Irrigação (SEAPI-RS), Porto Alegre, RS 90150-004, Brazil
*
Author to whom correspondence should be addressed.
Diversity 2019, 11(7), 111; https://doi.org/10.3390/d11070111
Submission received: 13 May 2019 / Revised: 1 June 2019 / Accepted: 3 June 2019 / Published: 14 July 2019

Abstract

:
The ecology of complex microhabitats remains poorly characterized in most tropical and subtropical biomes, and holds potential to help understand the structure and dynamics of different biodiversity components in these ecosystems. We assessed nutritional and metabolic parameters of two bromeliad species (Aechmea gamosepala and Vriesea platynema) at an Atlantic Forest site and used 16S rDNA metabarcoding to survey the microbial communities inhabiting their tanks. We observed that levels of some nutrients (e.g., nitrogen) varied across seasons consistently in both species, while others (e.g., phenolic compounds) presented considerable differences between the two bromeliads. In contrast, patterns of tank microbial diversity did not follow a similar temporal trend. There was extensive variation in microbial composition among samples, which included intra-specific differences but also some consistent differences between the two bromeliads. For example, Citrobacter, Klebsiella and Pantoea presented significantly different abundances in the two species. Interestingly, the dominant bacterial genera in both species included Pseudomonas and Enterobacter, which have been reported to include plant-beneficial species. Overall, our data contribute to the characterization of the nutritional status of Atlantic Forest bromeliads and the composition of their prokaryotic communities, laying the foundation for detailed investigations targeting the ecological interactions between these plants and their associated microbes.

1. Introduction

Plants within the family Bromeliaceae have terrestrial and/or epiphytic growth habits [1] and bear a suite of anatomical, morphological, and physiological adaptations that allow them to cope with a fluctuating resource supply. Tank-forming bromeliads are capable of retaining water and catching nutrients from organic debris through specialized trichomes located on the inner surface of the leaves [1]. Although nutrient concentrations in these tank microhabitats (called phytotelmata) are rather low when compared to soil, they present a rich source for an epiphytic plant species [2]. Depending on its location, each bromeliad receives different amounts of litter and sunlight, which affect plant metabolism as well as microbial diversity in the tank [3]. In general, there is low nutrient availability in epiphytic habitats, with phosphorus (P) and nitrogen (N) representing the most limiting elements [4]. The levels of plant compounds such as nitrogen, lipids, carbohydrates and organic solutes are affected by the amount of organic debris in the tank, sunlight and leaf development phase [5,6]. Although many bromeliads live in humid environments, nearly 50% of the species exhibit Crassulacean acid metabolism (CAM) [7]. Among them, bromeliad epiphytes show high plasticity in photosynthesis, ranging from C3 to facultative CAM to full CAM [8]. This plasticity improves water-use efficiency and reduces the impact of variable levels of sunlight and water supply [9].
The retained water and nutrients in phytotelmata promote the development of complex aquatic environments [10]. Tank communities include vertebrates [11], invertebrates [12,13,14], as well as eukaryotic microorganisms [15,16,17,18] and prokaryotes [19,20,21,22,23,24,25,26,27,28]. However, given the diversity of bromeliads and the variety of habitats in which they occur, most of their phytotelmata communities remain poorly known or completely undescribed, precluding a complete understanding of their structure and dynamics.
In addition to its relevance in the context of characterizing biodiversity in poorly known habitats, identifying the prokaryotic communities of bromeliad phytotelmata has the potential of shedding light onto their interaction with the host plants’ metabolism of several compounds. For example, nitrogen is known to be intensively metabolized in bromeliad tanks [29,30,31], raising the hypothesis that microorganisms present in the tank may influence this process. Likewise, Goffredi and co-workers [23] suggested that the bromeliad tank might be the place to find microorganisms related to carbon cycling in tropical forests, such as methanogens. Brandt et al. [25] evaluated the effect of moisture levels on the archaeal community and methanogenesis in bromeliad tanks, concluding that the pathway of methane formation in these micro-ecosystems may be strongly susceptible to periods of drought in Neotropical forest canopies. Altogether, these previous studies indicate that characterizing the microbial communities of bromeliad tanks in different ecological contexts is a necessary first step to understand their roles in these physiological processes. Finally, unknown metabolic pathways of microorganisms are likely to be widely distributed in unexplored natural ecosystems—such as bromeliad tank waters—and may present attractive biotechnological potential [32].
Here we describe the nutritional status and phytotelmata bacterial composition of two tank bromeliad species, Aechmea gamosepala (with a CAM photosynthetic pathway) and Vriesea platynema (with a C3 photosynthetic pathway). Specifically, we aimed to investigate whether there were differences between the two bromeliad species with respect to (i) seasonal patterns of variation in the plant’s physiological parameters; (ii) the composition and seasonal variation of their phytotelmata microbial communities; and (iii) potential correlations between changes in plant physiological parameters and microbial community composition.

2. Materials and Methods

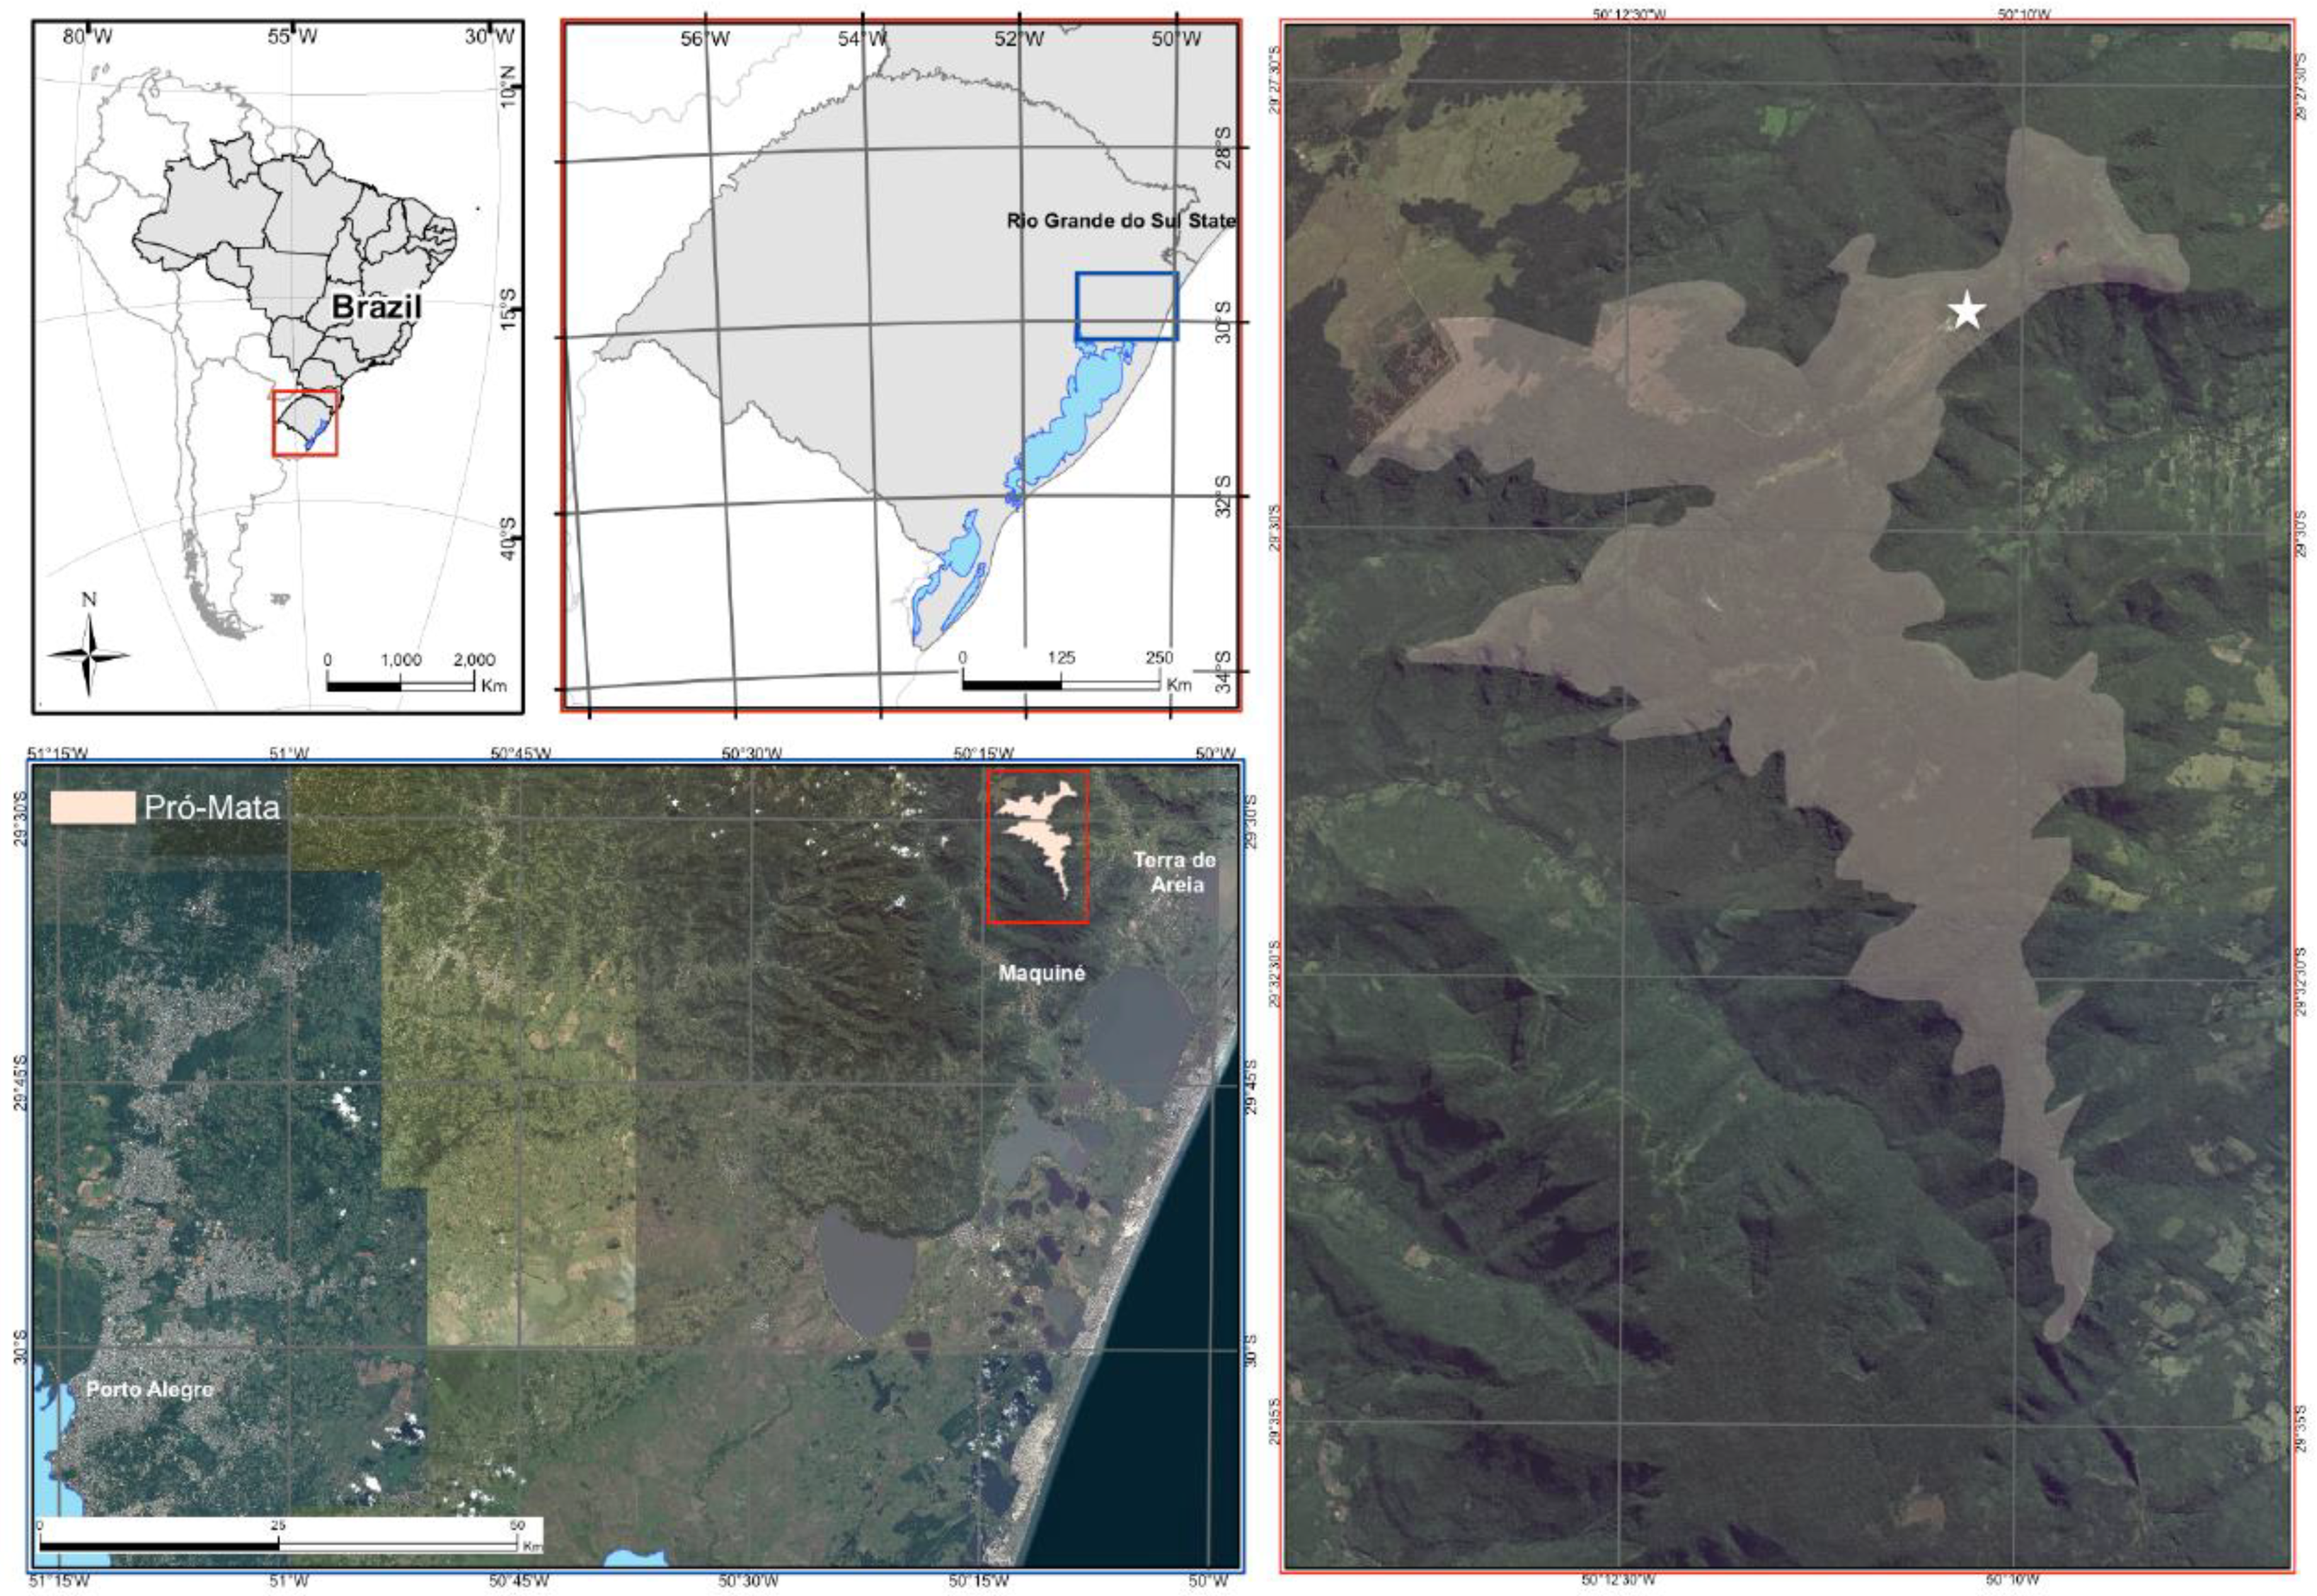
2.1. Sample Collection

Sampling was performed in a high-altitude (900 m a.s.l.) native forest within the Pró-Mata Center for Research and Nature Conservation (CPCN Pró-Mata) located in São Francisco de Paula, Rio Grande do Sul state, southernmost Brazil. The sampled area is located at the limit between the Araucaria (Brazilian pine) forest and the coastal Atlantic forest (29°27’ S to 29°35’ S and 50°08’ W to 50°15’ W) (Figure 1) and harbors a rich diversity of epiphytes. The region’s climate is classified by Köppen as Cfb, moist marine coast climate, with a mean rainfall of about 2250 mm per year, and an annual average temperature of 14.5 °C [33,34].
We collected leaf samples and phytotelmata water (including debris) from five individuals each of A. gamosepala and V. platynema (Figure 2). For analysis purposes, they were designated A1 to A5 for the A. gamosepala individuals, and V1 to V5 for the V. platynema individuals. All sampled individuals were epiphytic, placed under shade conditions below a dense canopy, and distributed along a steep forest trail spanning ca. 450 m from sampling point 1 to point 5 (see Figure 1 in [18]). Sampling was carried out in 2010, with one sampling campaign being performed per season. Water tank temperature ranged from 5 °C in winter samples to 20 °C in summer samples. The average pH in the water tank was 6 for all specimens and sampling times (Table 1).
For quantification of plant nutrients, such as macronutrients (nitrogen, phosphate, and potassium), reducing sugars (soluble pentoses and hexoses), total soluble proteins and phenolic compounds, bromeliad leaves were sampled and immediately stored at −20 °C. All collected leaves were from adult specimens of A. gamosepala and V. platynema, and two leaves from each plant (from the 4th to the 9th visible leaf in the rosette leaf arrangement) were used in the experiments. The leaves were divided into two main parts: the basal leaf portion, forming the tank structure, and the middle-apical ones, which receives more light. Only the middle-apical portion was sampled (>20 cm length) to avoid disturbing the tank. All five individuals from each plant species were investigated. Samples were analyzed in triplicate under the same conditions.
We assessed the total water volume present in the tanks including debris of each target bromeliad. About 2 mL of water and debris were collected using a Pasteur pipette and were mixed with 2 mL of Tris-EDTA SDS (TES) lysis buffer (see [18]). After collection, samples were stored at −20 °C for DNA extraction and microbial DNA metabarcoding analyses. To maximize the opportunity for within-species differences and thus allow a conservative comparison of the microbiota between A. gamosepala and V. platynema, we performed DNA metabarcoding analyses only for the two specimens located at opposite ends of the sampled trail (A1 and A5, V1 and V5, respectively). This strategy was supported by the plant physiological data for both species (see Results), since the only parameter that differed significantly among individuals of the same species sampled on the same day was sugar level between points 1 and 5. The same DNA extracts used here were employed in a separate study focusing on the eukaryotic microbial community [18].

2.2. Plant Nutritional Parameters

Leaf samples were oven-dried at 40 °C for 72 h and ground. Samples [100 mg dry mass (DM)] were then digested with sulfuric acid at 350 °C for 1 h, according to the Kjeldahl method [35]. After cooling, total nitrogen was evaluated by transferring the mixture to a new flask, adding sodium hydroxide (10 M) and titrating with sulfuric acid (0.025 M). Phosphorus and potassium were determined in the digested samples using a colorimetric reaction. Briefly, phosphorus was evaluated by a reaction with ammonium molybdate (0.38%) and chloridric acid (0.87 M). Then, the reaction was supplemented with 1-amino-2-naphthol-4-sulfonic acid, sodium sulfite and sodium metabisulfite. After 15 min, the solution absorbance was measured at 660 nm. The potassium content was determined directly in a flame photometer [36]. Results were expressed as total leaf potassium or phosphorus (%). To assess N/P limitation, we used a method based on critical values of N:P ratios in above-ground plant material, where N:P ratios > 16 indicate P-limitation, N:P ratios < 13.5 indicate N-limitation, and ratios between 13.5 and 16 indicate N/P co-limitation [37].
For plant sugar analyses, leaf samples [0.5 g fresh mass (FM)] were extracted with aqueous methanol (80%; v/v), centrifuged at 2500× g for 10 min at room temperature and the supernatant reserved. The total soluble sugars were determined by the colorimetric Anthrone method [38] and estimated via reading the absorbance (620 nm) of the resulting solution against a glucose standard curve.
Phenolic compounds were analyzed in a spectrophotometer, following Sávio et al. [39]. Briefly, 100 µL of the methanolic extract was mixed with 2.5 mL of Folin–Ciocalteau reagent and 0.7 M Na2CO3. Samples were incubated at 25 °C in the dark for 30 min, and absorbance was measured at 765 nm. Gallic acid was used as the standard. The content of total phenolic compounds was expressed as mg g−1 of DM.
To determine total soluble proteins, leaf samples (0.5 g FM) were ground in 5 mL of 50 mM sodium phosphate buffer (pH 7.0), supplemented with 2% (v/v) Triton X-100 and 1% (w/v) polyvinylpyrrolidone. Extracts were filtered and centrifuged at 2500× g for 15 min at 5 °C, and their supernatant was collected for determination of soluble protein content. The protein content was measured with Bradford’s [40] method, using bovine serum albumin as a standard.
The data were analyzed using ANOVA complemented by Duncan’s test, with alpha = 0.05. The occurrence of extreme values was determined by a BoxPlot assessment. The homogeneity of variances was determined with Levene’s test and, when necessary, data were transformed to adjust them to the normal distribution. Student’s t-test was employed to compare plant species within the same season for each nutritional parameter. Statistical analyses were performed with Statistical Package for the Social Sciences (SPSS) version 22.0 (IBM, Armonk, NY, USA).

2.3. Analysis of Phytotelmata Microbial Communities

Total DNA was extracted from 250-μL phytotelmata water and debris samples using the DNeasy Blood & Tissue kit (Qiagen, Valencia, CA, USA), as described by Simão et al. [18]. Partial 16S rRNA gene sequences were amplified using universal primers 515F and 806R [41], with the addition of a barcode sequence and the required Illumina sequencing adapters [42]. Polymerase chain reactions (PCR) were prepared with 1U of Platinum Taq Polymerase (Life Technologies, Carlsbad, CA, USA), 10 μM of primers and 20 ng of template DNA in a 50-μL total volume reaction. PCR reactions included one initial denaturation step at 94 °C for 3 min, 20 cycles including denaturation for 45 s at 94 °C, annealing for 45 s at 53 °C, and extension for 90 s at 65 °C, with one final extension step for 10 min at 65 °C. PCR products were purified using the PCR Purification kit (Qiagen, Valencia, CA, USA) following the manufacturer’s protocol, except for eluting in sterile water. Amplified DNA was quantified with Qubit dsDNA High Sensitivity (Invitrogen, Carlsbad, CA, USA). Sequencing was conducted on an Illumina HiSeq 1000TM machine (Illumina, San Diego, CA, USA) with paired reads of 101 bp. The sequences obtained were trimmed for quality using a modified version of Trim2 [43,44], and the first 11 bases of the primer region of each paired read were removed to prevent biases due to the degenerate bases in the primer sequences. Since all samples were sequenced in a multiplexed Illumina run, barcode sequences were used to identify each sample from the total sequencing output.
The prokaryotic database used for 16S rRNA analysis was downloaded from the Ribosomal Database Project (RDP) website [45] and formatted using TaxCollector [46]. References for isolates and sequences of all sizes were included. Sequences were trimmed for low-quality bases and short reads and compared to the TaxCollector-modified RDP database using CLC Assembly Cell (version 3.11; CLCBio, Aarhus, Denmark) utilizing the paired reads and global alignment parameters. Two specific parameters were used in this step, a 98% length fraction and similarity values dependent on the desired taxonomic level, i.e., 80% for Domain/Phylum, 90% for Class/Order/Family, 97% for Genus (or corresponding operational taxonomic unit, OTU) and 99% similarity for Species (or corresponding OTU) [47]. Pairs that matched different references at a particular level were classified at the lowest common taxonomic level. Unresolved pairs (i.e. different classifications for the two reads) were discarded. Reads were also analyzed unassembled (i.e., only one read from each successful pair) using the Meta Genome Rapid Annotation of Sequence Technology (MG-RAST) server [48]. We initially focused on the relative abundance of taxa present at frequencies >1% in at least one sample and compared the observed patterns between A. gamosepala and V. platynema samples. We then performed the same assessment for genera of low abundance (relative frequencies 0.01–0.1% in ≥ 1 sample). Finally, we investigated patterns of variation in genera of both high and low abundance regarding potential features that could relate to plant physiology.
Student’s t-test was employed to determine differences among samples regarding proportions of microbial taxa, with alpha = 0.05, using the software SPSS version 22.0. Sequencing results were deposited in the National Center for Biotechnology Information (NCBI) database under BioProject PRJNA400159. To assess whether there were significant differences in the microbial community between plant species and seasons, relative abundance values were compared using paired t-tests. The similarity between communities was calculated using the Bray-Curtis similarity matrix and used in a principal coordinate analysis (PCoA). Diversity measure followed the criteria: a maximum e-value cutoff of 1 × 10⁻¹⁰, minimum percent identity cutoff of 95% and default minimum alignment length cutoff. Statistical analyses were performed with SPSS v.16.

3. Results

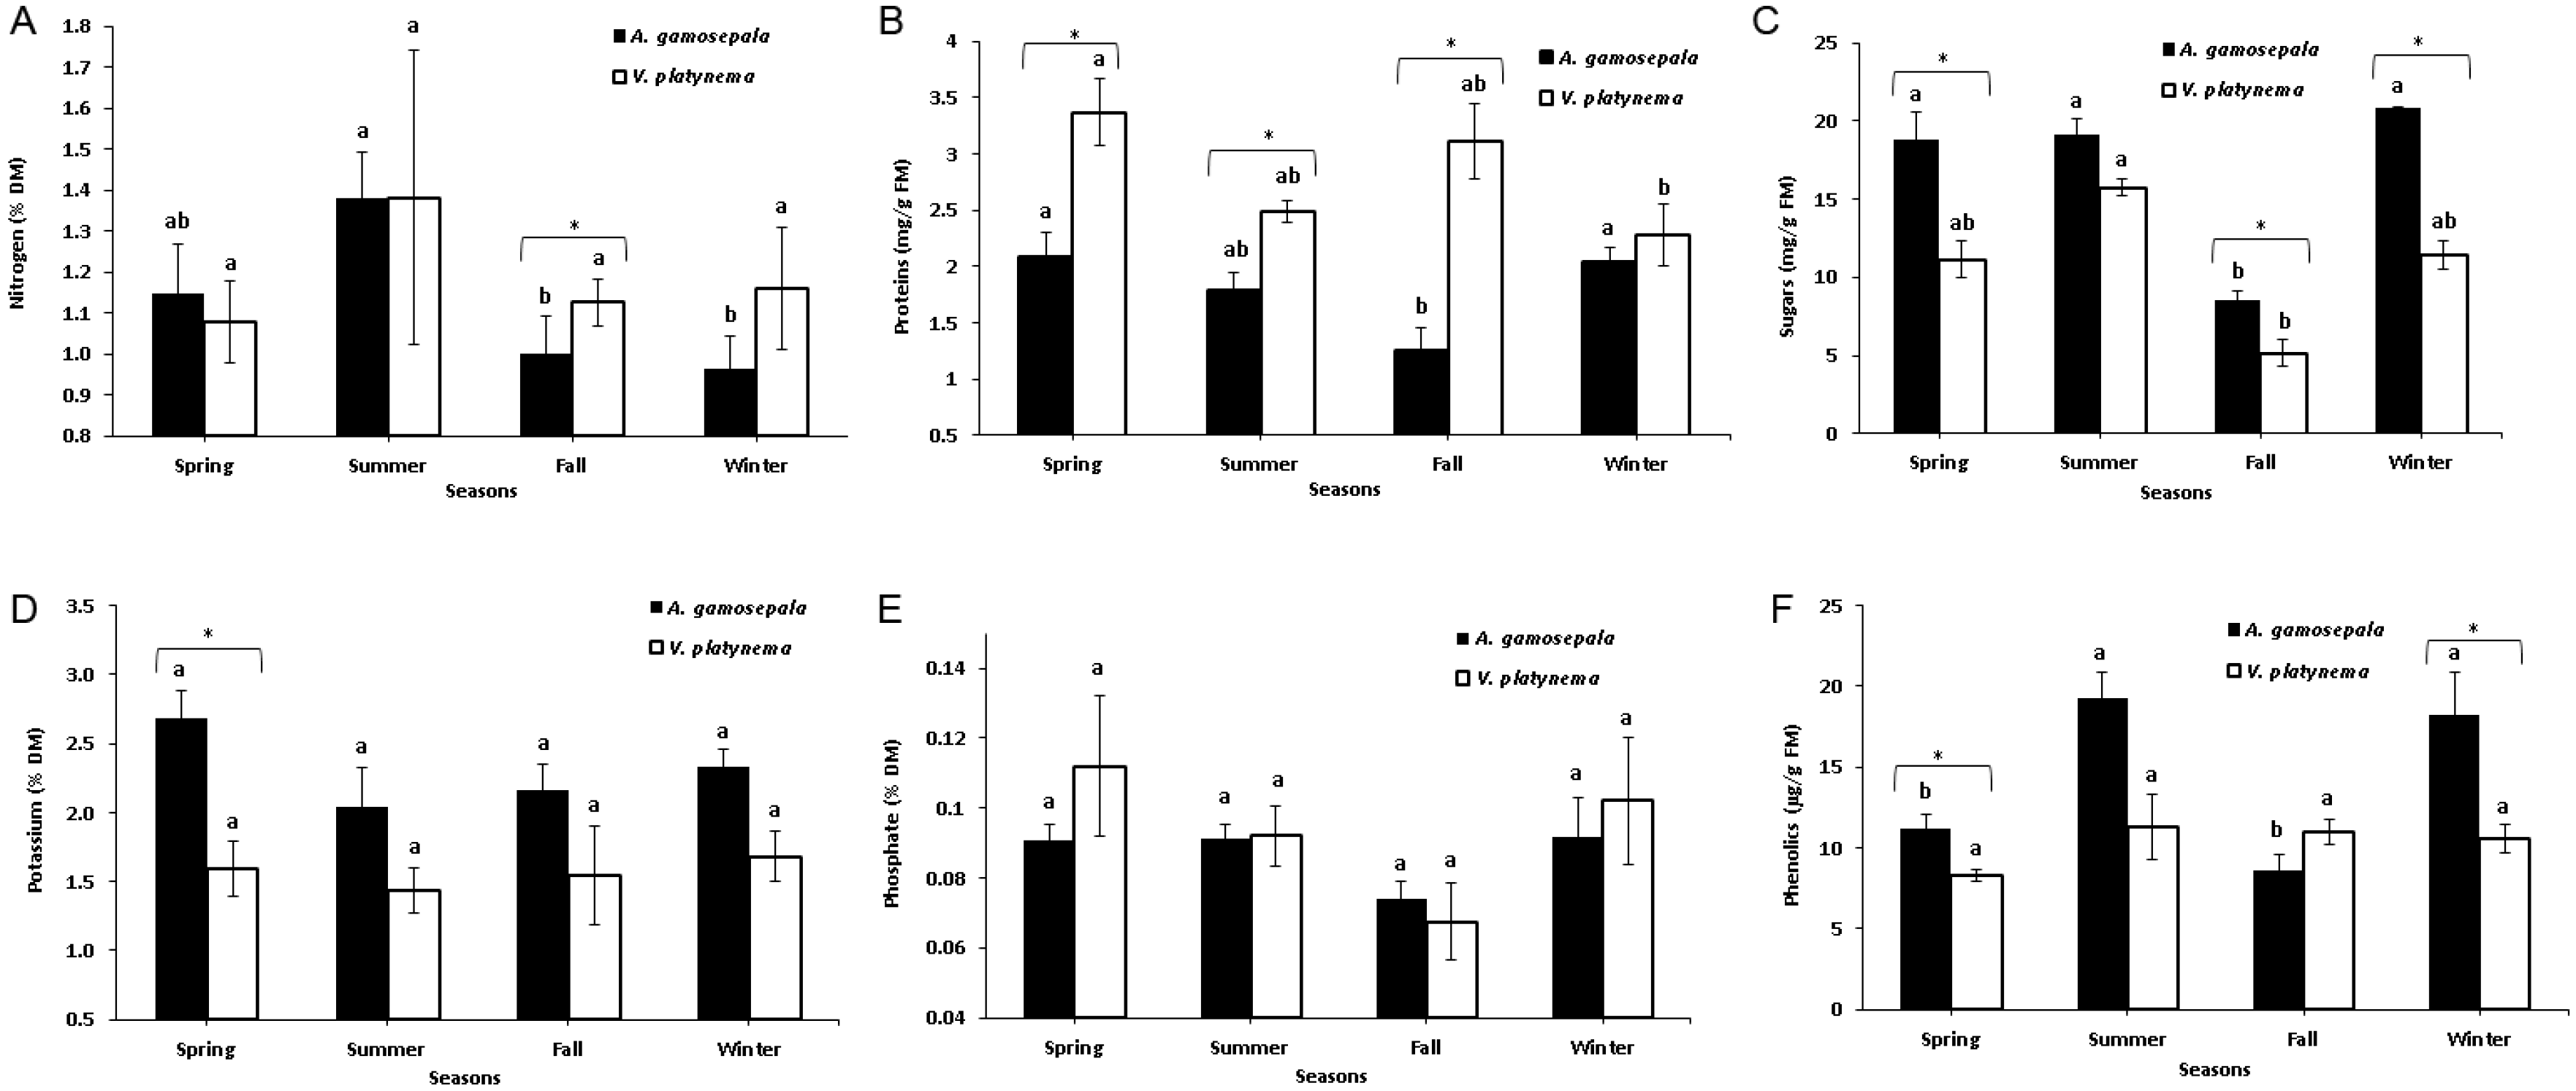
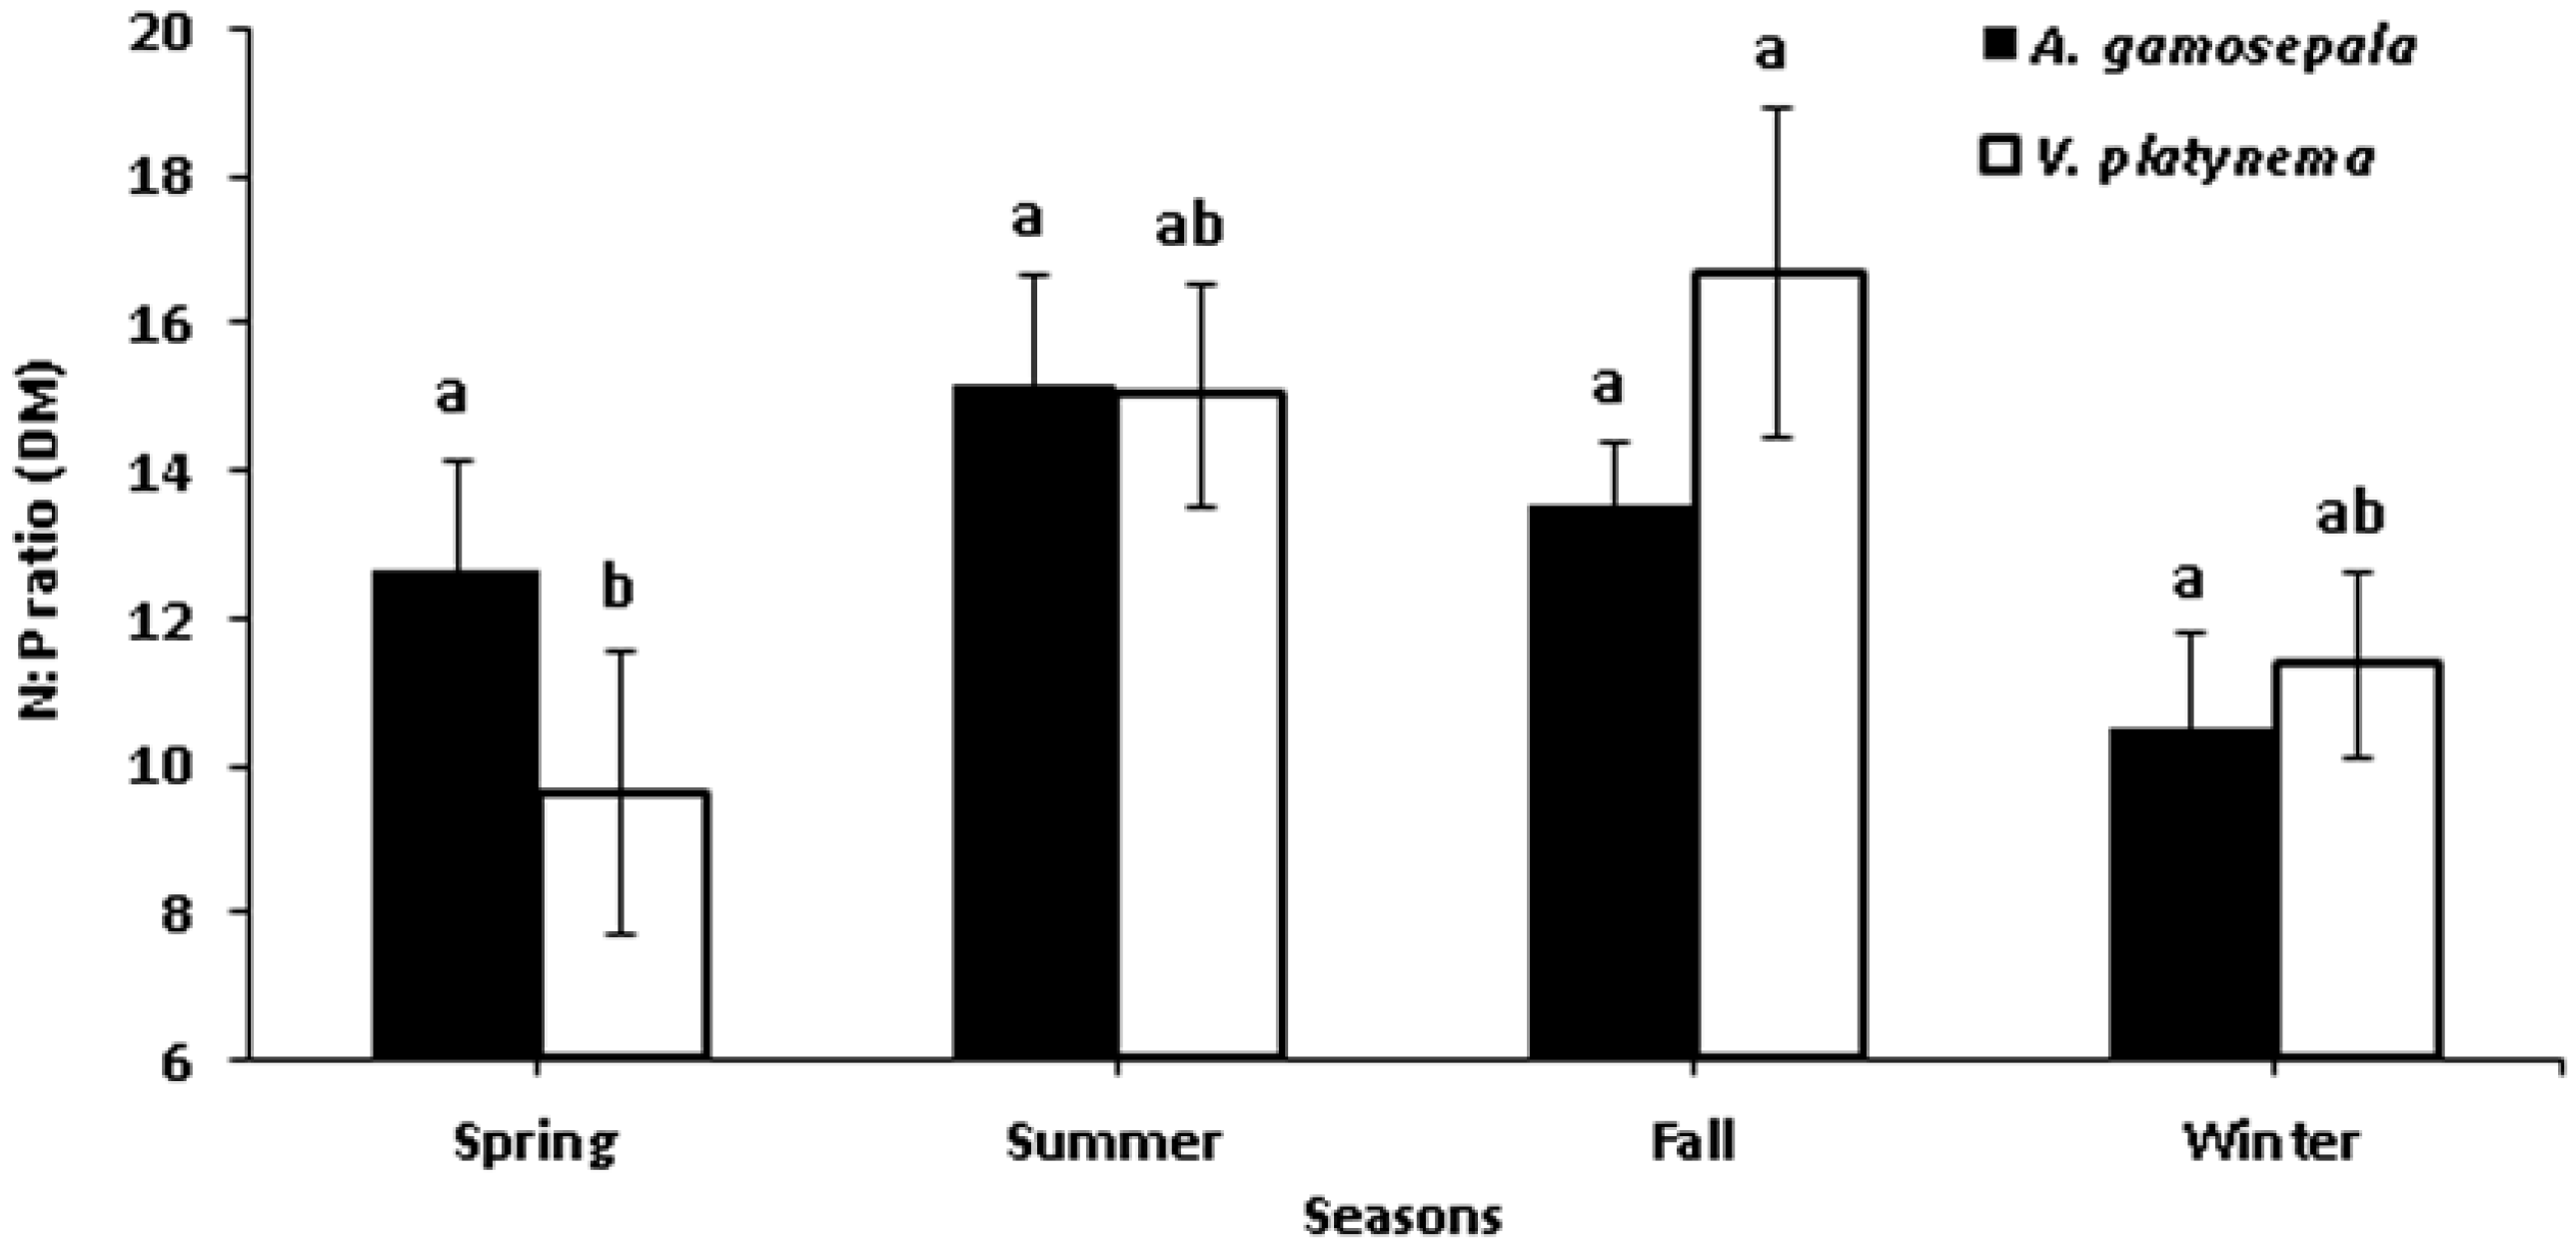
3.1. Physiological Parameters of V. platynema and A. gamosepala

We observed significant intra-specific seasonal differences in some nutritional parameters (nitrogen content, soluble proteins, sugars, and phenolic compounds) for both bromeliads (p < 0.05), and other physiological features that differed between the two species. The protein content in V. platynema samples (2.88 mg g−1 FM) was consistently higher than that observed for A. gamosepala (1.77 mg g−1 FM), independently of the season (p = 0.001), while the amount of nitrogen was similar in both species over time, except in the fall (p = 0.049) (Figure 3A). The nitrogen content in leaves of V. platynema showed no alteration (p = 0.16) among the seasons (Figure 3A), ranging from 1.07% to 1.38% in spring and summer, respectively. Samples from A. gamosepala showed a reduced amount of nitrogen (p = 0.04) in the fall and winter (1% and 0.96% DM, respectively). The highest level of protein (3.3 mg g−1 FM) was observed in the leaves of V. platynema collected in the spring (p = 0.01) and the lowest one in the winter (2.2 mg g−1 FM) (Figure 3B).
No significant interaction was observed between season and sampling point (p = 0.39) for reducing sugars. However, the seasons affected sugar production in both bromeliads. Sugar levels were drastically reduced (p = 0.0001) in V. platynema (5.1 mg g−1 FM) and A. gamosepala (p = 0.002) (8.5 mg g−1 FM) during the fall (Figure 3C). In general, A. gamosepala presented a higher level of sugars, compared to V. platynema (p = 0.001). An interesting observation was that this was the only parameter that exhibited, for both species, intra-specific variation within the same season, always involving sampling points 1 and 5 (Table 2).
We observed no significant interaction between season and potassium or phosphate contents for either A. gamosepala or V. platynema (potassium: p = 0.17 and p = 0.87, respectively; phosphate: p = 0.52 and p = 0.31, respectively) (Figure 3D,E). When both species were analyzed jointly across seasons, there was still no significant variation (p = 0.6 and p = 0.93 for potassium and phosphate, respectively). Nevertheless, a reduction in the level of phosphate was observed in the fall for both species (A. gamosepala: 0.074% DM; V. platynema: 0.067% DM). Also, potassium levels in A. gamosepala were higher (p = 0.006) than those in V. platynema in the spring (Figure 3D). Concerning phenolic compounds, V. platynema did not present significant changes across the seasons (p = 0.17) (Figure 3F), whereas A. gamosepala exhibited significantly higher levels of them (p = 0.002) in the summer and winter (19.2 and 18.2 µg g−1 FM, respectively).
Although N was drastically reduced (p = 0.049) in A. gamosepala in the fall and winter (Figure 3A), the N:P ratio did not change for this species (p = 0.059), showing rates of 12.66, 13.54 and 10.49 in the spring, fall and winter season, respectively (Figure 4). Differently, the observed N:P ratio for V. platynema changed over the seasons (p = 0.041), showing the highest value in the fall (16.68) and the lowest one in the spring (9.61). Interestingly, the N content in V. platynema did not change significantly (p = 0.164) along the one-year period (Figure 3A).

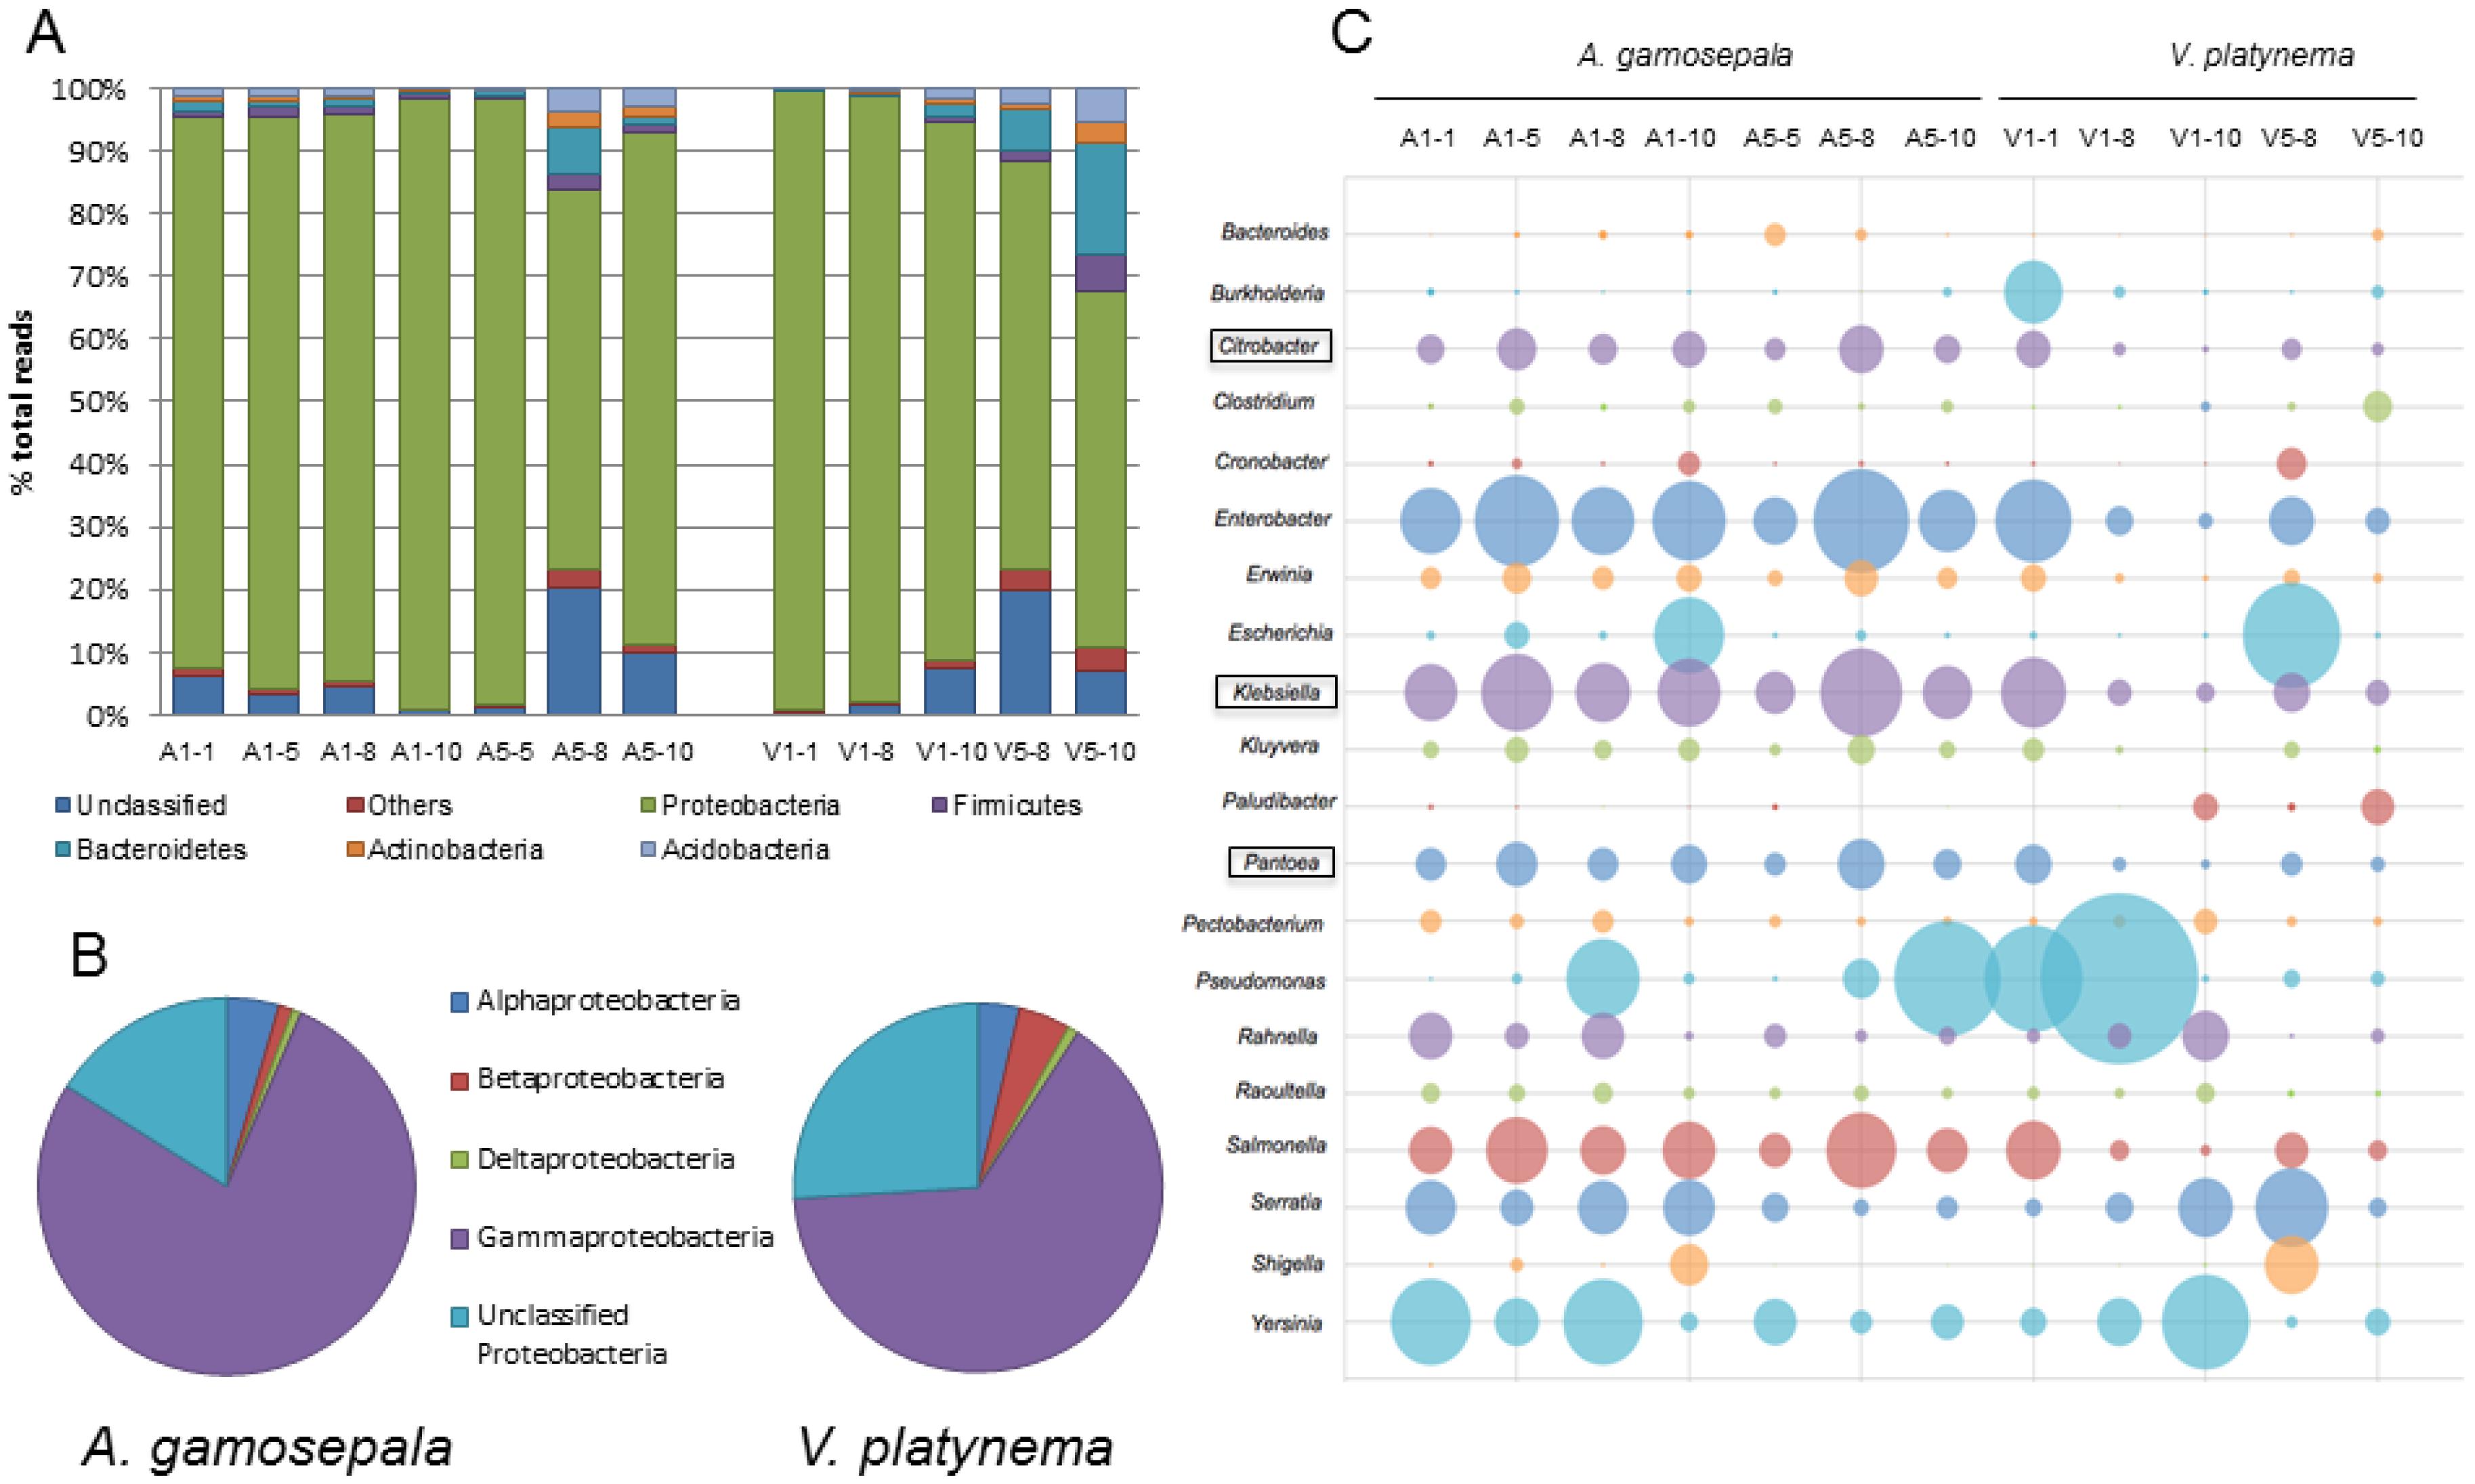
3.2. Microbial DNA Sequencing Data

All A. gamosepala and V. platynema individuals sampled in this study presented tanks filled with water across all the surveyed seasons. The total volume of water present in their tanks ranged from 5 to 29 mL (Table 1), without any detectable drought episode. From the initial 16 collected samples, only 12 yielded sufficient DNA sequencing reads to allow downstream analyses. After trimming low-quality bases and removing short reads, a total of 1,110,704 16S rDNA sequences (491,934 from A. gamosepala and 618,770 from V. platynema) was employed in the downstream analyses, representing an average of 100,973 sequences per sample after filtering.
Our data indicated that bacterial and archaeal domains in bromeliad tanks included 18 phyla, 31 classes, 53 orders, 103 families, 260 genera and 499 species. In general, the bacterial communities of bromeliads were overwhelmingly dominated by a few taxa, with median relative abundances greater than 1%. Analyzing the combined data from all bromeliad water samples, we observed five bacterial phyla (Acidobacteria, Actinobacteria, Bacteroidetes, Firmicutes, and Proteobacteria) presenting relative abundance values higher than 1% of the total reads, among which Proteobacteria was the most frequent (Figure 5A).
To assess the structure of prokaryotic communities of the surveyed bromeliad individuals, we investigated the results obtained for A1 and A5 (A. gamosepala), as well as for V1 and V5 (V. platynema) along one year. No statistical differences were observed among samples from each bromeliad specimen across time (p = 0.730). Therefore, to compare individuals from the same species, we used an average value from all seasonal samples for each specimen. For V. platynema, the results indicated an absence of significant differences between V1 and V5 for all taxonomic levels. Regarding the A. gamosepala individuals A1 and A5, the order Neisseriales presented higher relative abundance in A5 than in A1 (p = 0.048). At the family level, eight families were also significantly more frequent in A5 than in A1 (Table 3). All these bacterial families belonged to rarely observed taxa, being composed by less than 0.2% of the total reads. Four of them belonged to the phylum Actinomycetes (Acidimicrobiaceae, Frankiaceae, Micrococcaceae and Nakamurellaceae). At the genus level, 13 genera were significantly different in abundance between the A1 and A5 specimens. Of this total, only Cronobacter and Escherichia presented abundances higher than 1% in at least one specimen (Figure 5C). All the remaining genera belonged to the rarely observed taxa.

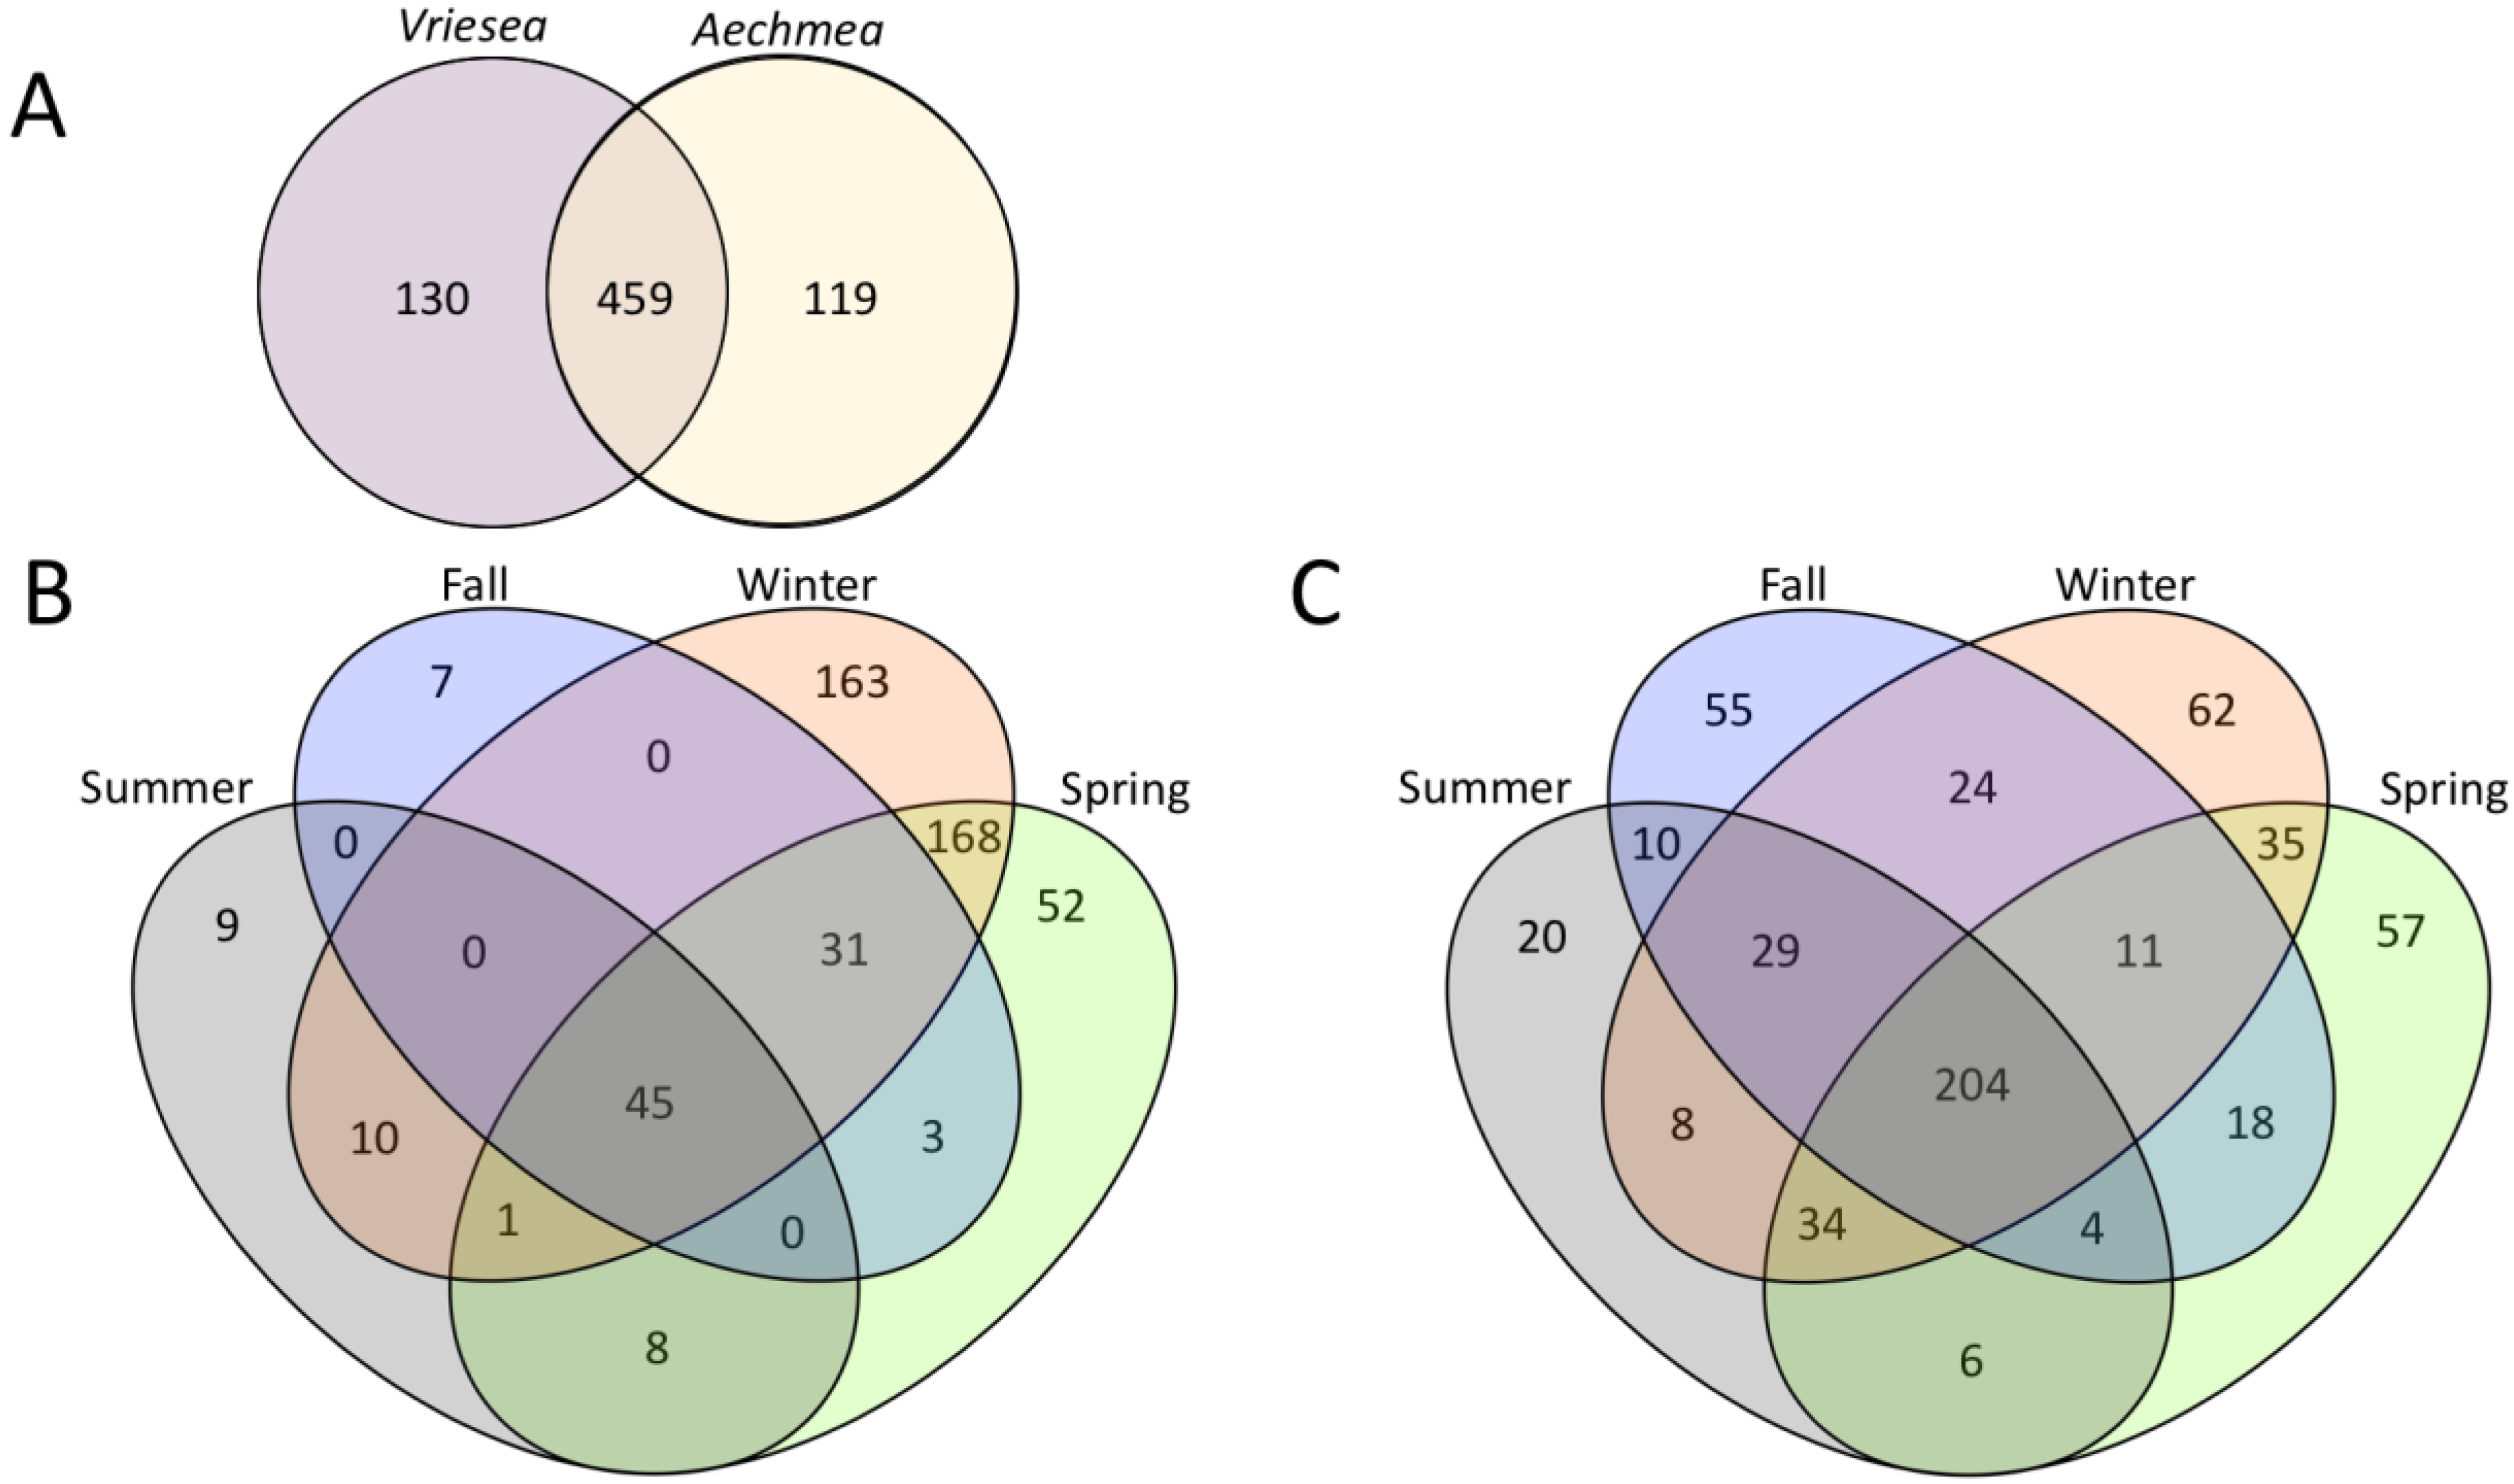
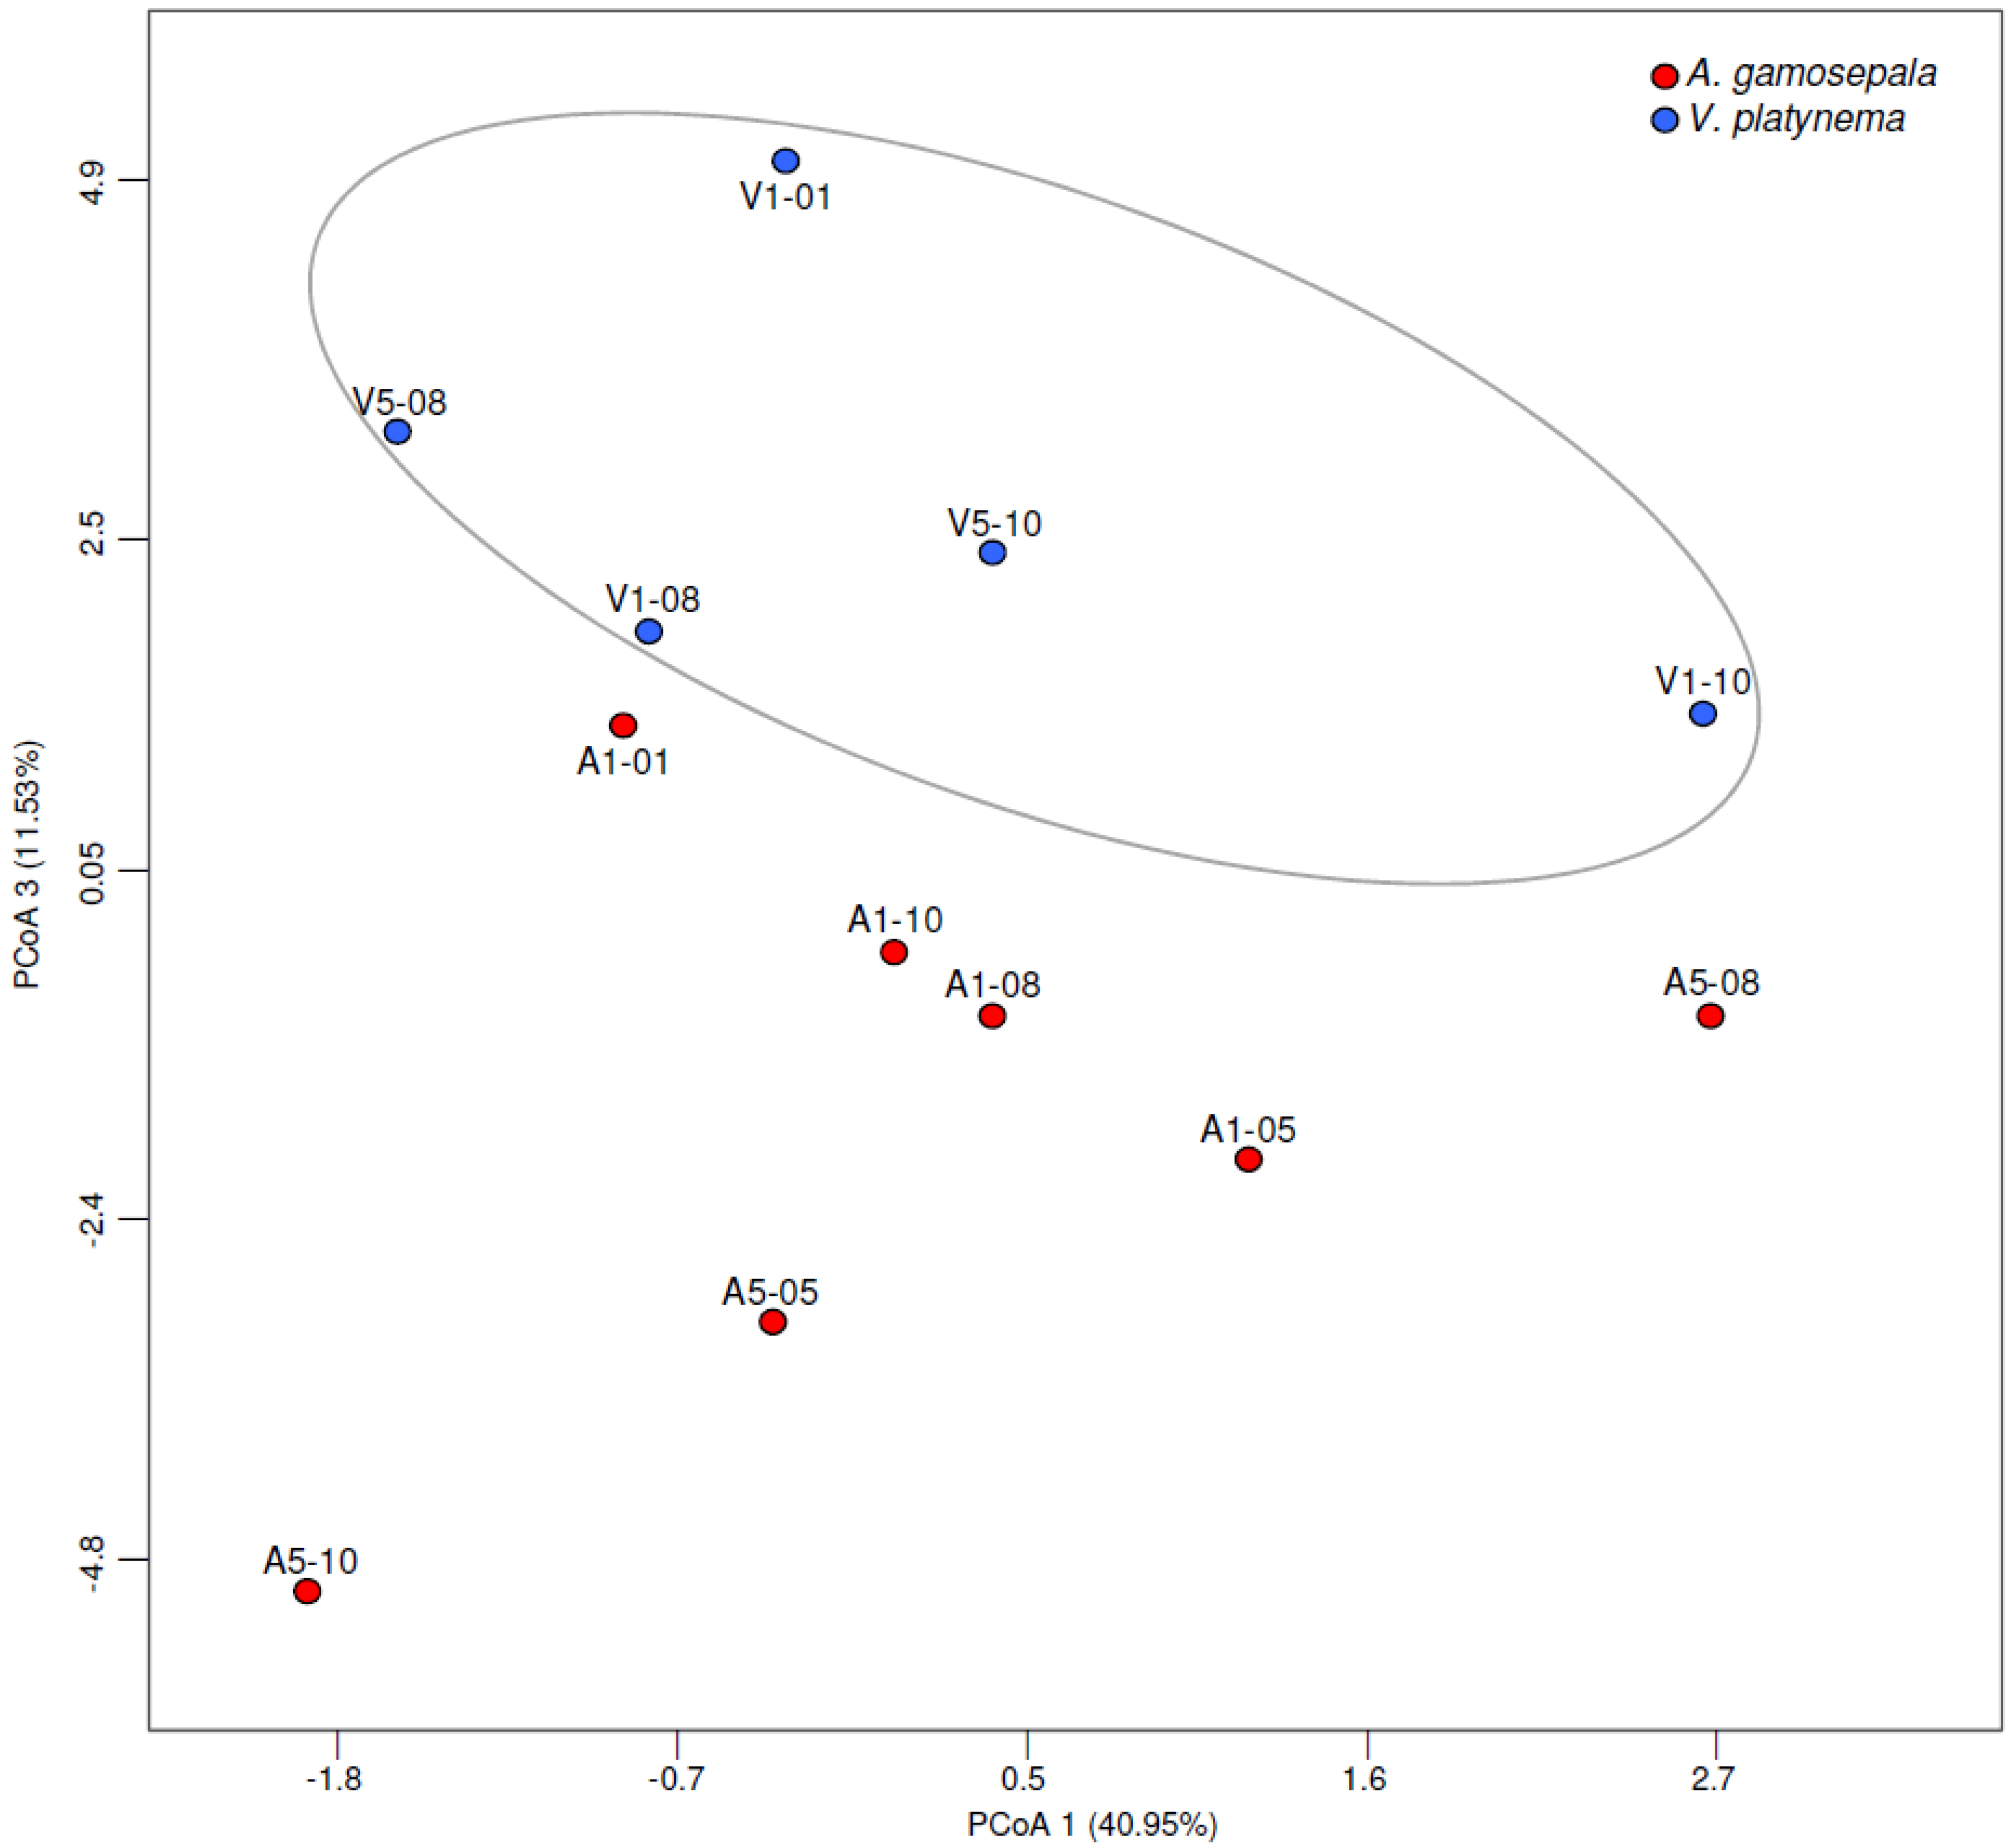
3.3. Differences in the Microbial Communities of A. gamosepala and V. platynema

Proteobacteria was the phylum with the highest relative abundance in both plant species, comprising an average of 86.6% of the total reads in A. gamosepala and 80.4% in V. platynema (Figure 5A). Within this group, there was a dominance of the class Gammaproteobacteria in both bromeliad species, comprising 77% of the total reads in A. gamosepala and 65% in V. platynema (Figure 5B). Among the reads identified at class level, it was followed by Alphaproteobacteria (4.5% and 3.6% of the total reads) and Betaproteobacteria (1.2% and 4.5% of the total reads) in A. gamosepala and V. platynema, respectively. Bacteroidetes was the second most frequent phylum in both bromeliads, representing an average of up to 5.5% of the total bacterial sequences in both bromeliad species (Figure 5A). The few detected archaeal sequences were classified at phylum level as belonging to Euryarchaeota and Crenarchaeota, jointly representing ≤ 0.04% of the total reads in A. gamosepala and ≤ 0.24% of the reads in V. platynema (data not shown).
Of a total of 260 detected genera, 20 presented a relative abundance higher than 1% in at least one sample (Figure 5C). The enterobacteria Citrobacter, Klebsiella, and Pantoea showed significantly higher abundances in A. gamosepala. The majority of the detected genera presented a low relative abundance (below 1% of the reads).
At the species level, 34 OTUs were found at abundances higher than 1% in at least one bromeliad specimen. Most of these OTUs were identified as belonging to species from the families Enterobacteriaceae and Pseudomonadaceae. Of them, Enterobacter sp., Enterobacter asburiae, Erwinia sp., Erwinia tasmaniensis, Klebsiella sp., Klebsiella pneumoniae, Kluyvera ascorbata, Pantoea agglomerans, Salmonella sp. and Salmonella enterica were significantly more frequent in A. gamosepala than in V. platynema. Conversely, Escherichia coli and Pseudomonas sp. were significantly more prevalent in V. platynema than in A. gamosepala (Table 4). As was observed at the genus level, the majority of the detected species had low relative abundances. The number of classified bacterial OTUs shared between the two bromeliad species was 459, while 130 were observed solely in V. platynema and 119 only in A. gamosepala (Figure 6A).
Regarding the taxa of low abundance (relative frequencies 0.01–0.1% in ≥ 1 sample), only a few sequences were classified at genus or species level (less than 0.001%). Nevertheless, 133 genera were observed in both bromeliad species. Half of these genera presented members that have been described as plant-growth promoting bacteria. Among the rare OTUs at the genus level, five were found exclusively in A. gamosepala, and ten in V. platynema. At the species level, 22 OTUs were observed solely in A. gamosepala, and 18 in V. platynema.
The PCoA revealed a separation between the overall profile of Aechmea and Vriesea samples from all seasons, which is an indication that the bacterial community is distinct in each of the bromeliad species (Figure 7). The number of OTUs shared among seasons varied between A. gamosepala and V. platynema (see Figure 6B,C). In V. platynema, 45 bacterial OTUs were observed in all seasons, a pattern seen in 204 OTUs for A. gamosepala. Moreover, A. gamosepala presented a more homogeneous pattern of shared OTUs among seasons relative to V. platynema, which presented a more distinct pattern of OTU diversity for each season. For both species, spring and winter were the seasons that most shared OTUs, with V. platynema presenting much more sharing (168) than A. gamosepala (35).

4. Discussion

In this study, we evaluated nutritional parameters and the structure of bacterial communities from the water tanks of two bromeliad species (A. gamosepala and V. platynema) in different seasons within a one-year interval. Analyses of plant physiology indicated that some nutritional aspects varied according to season and plant species, although unexpected stability in the levels of potassium and phosphate was observed over the sampled period. The high content of sugars and the low amount of soluble proteins found in A. gamosepala leaves may be attributed to CAM photosynthesis. The CAM strategy allows intracellular CO2 to be used more effectively by plants with less catalytic protein [49]. When sugar levels were compared, V. platynema (a C3 plant) reached the same level presented in A. gamosepala only in the summer season. Although CAM photosynthesis represents an adaptation to arid habitats, in a humid forest the CAM strategy is more related to overall carbon gain than for the improvement of water-use efficiency [49]. Moreover, Pierce et al. [50] demonstrated that the CAM pathway in Aechmea dactylina from wet cloud forests might compensate for the low CO2 assimilation in wet leaves.
The bromeliad epiphytes evaluated here presented tanks filled with water and organic debris throughout the seasons, without any drought period recorded at the site during sampling campaigns. These results indicate that stress factors such as drought and pH of the water tank (Table 1) did not play an important role in our data set. In this context, Louca et al. [31] investigated the structure of bacterial and archaeal communities inhabiting the tanks of Aechmea nudicaulis and Neoregelia cruenta from a Brazilian dune forest. In that study, CO2 reducers (oxygenic and anoxygenic phototrophs, as well as methanogenic species) were detected at high abundances, indicating an intense primary production occurring within these communities, which may directly or indirectly contribute with organic carbon supply to the host plant.
In tank bromeliads, the leaf is considered a vital vegetative organ since it uptakes and assimilates the nutrients for the plant [51]. Although natural fluctuations in the supply of K and P were expected, their levels did not change for either plant species along seasons. However, the nitrogen level was drastically reduced in A. gamosepala during fall and winter (Figure 3). These results indicate that K and P are available in a similar amount for both plant species regardless of the season. Interestingly, the N:P ratio indicated that P and N were limiting the growth of V. platynema and A. gamosepala during the summer. Furthermore, the N:P ratio stated that P was also limited in V. platynema during the fall, while N was limited in the spring. Nitrogen and phosphorus availability limit plant growth in most terrestrial ecosystems. In terrestrial N-deficient plants, there is uptake compensation, increasing the rate of N uptake and reducing the P uptake, while in P-deficient plants the opposite occurs [52]. The tank in bromeliads generally presents low contents of nutrients due to fast absorption of these elements [2], since they take up both N and P in a highly efficient manner. Approximately 90% of the phosphorus is withdrawn from the Aechmea fasciata tanks within 12 h, and about 97% of this element reappears in the plant tissue, especially in distal leaf segments [53].
In bromeliads, nutrient uptake is adapted towards the capture of short pulses, and such a combination of high uptake of nutrients and slow growth may lead to accumulation of reserves [54]. The quality of organic matter may also affect the litter decomposition in the tank, resulting in microbial P immobilization and a further decrease in P availability to plants [55]. In general, the diagnostic value of N:P ratios is regarded as much more reliable than that of single nutrient critical values for terrestrial ecosystems [56]. The N:P ratio < 13.5 indicates that N limits the growth of V. platynema (11.37) and A. gamosepala (10.49) in the winter. However, the N:P ratio observed in A. gamosepala (15.15) and V. platynema (15.2) in the summer suggest that plant growth was co-limited (N:P 14 to 16) by N and P together [37,56,57]. According to Wanek & Zotz [4], high foliar N:P ratios (>12) in Vriesea sanguinolenta represented a comprehensive P limitation (or co-limitation by N and P) in this bromeliad. These data suggest that the growth of V. platynema may be limited by the lack of P in the fall. On the other hand, our results indicate that this bromeliad increased the P uptake in the spring.
Using a DNA metabarcoding approach, we identified a diverse set of microbial groups in the bromeliads’ phytotelmata, with considerable homogeneity in some individual microbiomes along the year. Nevertheless, substantial differences in the structure of microbial communities were observed between the bromeliad species, as well as among individuals of the same species. Differences in prokaryotic communities have already been revealed among individuals and species in other bromeliads from the Brazilian Atlantic forest, such as Aechmea nudicaulis, A. lingulata, Vriesea neoglutinosa, and N. cruenta [27,31,58,59]. These studies reported differences in the composition of microbial communities among bromeliad individuals, with some differences occurring among plant species, a similar result found in the present study.
In tanks of V. platynema, the bacterial genera Pseudomonas, Yersinia, Serratia, Escherichia, and Enterobacter presented the highest relative abundance (average higher than 5% of the total sequences). There are many plant-inhabiting Pseudomonas capable of positively interacting with their hosts, producing molecules that promote plant health [60], which indirectly help increase the absorptive surface of the plant [61]. Moreover, Pseudomonas has been reported as the most frequent genus in the leaf epiphytic community in Arabidopsis plants [62]. In the genus Escherichia, the species E. coli has been broadly found in different soil and water bodies in which human fecal contamination is an unlikely source. Some researchers suggest that, in tropical conditions, these bacteria may have originated from animals that lived in the area and persisted in the environment, developing mechanisms to maintain populations of viable cells for extended periods [63].
Our results demonstrated that the genera Enterobacter, Klebsiella, Yersinia, Pseudomonas and Salmonella presented a high relative abundance in the water tank of A. gamosepala. Species of Enterobacter have been reported in beneficial associations with a large number of plant species, such as Chinese cabbage, cowpea, wheat, and maize [64,65]. Also, they can increase the concentration of phosphorous in soybean and wheat [65] and may have contributed to the stability of P levels observed in both bromeliads over time.
Although different studies reported a high diversity of methane-producing archaea in tanks of many bromeliads [23,25,28,31,66], we found few reads (<0.13% of the total) belonging to the genus Methanobacterium, a methanogen archaeon. Goffredi et al. [23] have found archaeal communities dominated by methanogens in different bromeliad species in Costa Rica rainforest using specific archaeal and methanogen primers. Their data and those from Brandt et al. [25,28] indicated that bromeliad-associated methanogen taxa might play an essential role in the cycling of carbon in Neotropical forests. Thus, the low frequency of archaeal sequences obtained in our study may be explained by some bias in the amplification spectrum of the primers used. Although these oligonucleotides were designed to be universal for bacterial and archaeal taxa, they were initially tested for soil archaea, dominated by Crenarchaeota species [41], whereas in bromeliad tanks Euryarchaeota has been described as the most frequent archaeal group [23]. Thus, the primer bias may have driven our data to an underestimated value of the actual archaeal diversity of the investigated bromeliad tanks.
The taxa occurring at low abundance are important in studies on prokaryotic communities since they are typically composed of a high number of relatively rare species. Recent studies have demonstrated that rare microbial species can have crucial roles in biogeochemical cycles and often behave as hidden drivers of microbiome function [67]. Our results revealed that half of the rare genera detected for both bromeliads are described as containing members that express at least one plant growth promotion trait, such as nitrogen fixation, phosphate solubilization, siderophore production, manganese oxidation, or auxin biosynthesis [68]. Bradyrhizobium, Bacillus, Ferruginibacter, Variovorax, and Sphingomonas are examples of genera with plant growth promotion traits that were found at very low abundance in our bromeliad water samples. The ability to promote plant growth might not be detected when these genera are at low abundance, but their growth-promoting properties may be important to plant growth in response to environmental changes [67,69]. Thus, the data from our bromeliad samples indicate that, while most of the bacteria with abundance >1% (such as those from the families Enterobacteriaceae and Pseudomonadaceae) are not usually recognized as beneficial to plant growth, the microbiota with relative abundance below 0.1% was primarily constituted by plant-beneficial species.
Organic N derived from trapped litter and inputs by animals constitutes the most important N source for epiphytes [70]. Moreover, litter accumulated in the tank may favor atmospheric N2 fixation by cyanobacteria that significantly enhance bromeliad nutrition concerning nitrogen [71]. Interestingly, samples collected from the bromeliad tanks presented few cyanobacterial reads (<0.03% of the total) of nitrogen-fixing species, which were detected as belonging to the family Frankiaceae. The well-known nitrogen-fixing genus Frankia occurs mainly in root nodules on actinorhizal plants and occasionally in soil [72]. Nevertheless, the nitrogen content in leaves of A. gamosepala and V. platynema was similar to the levels described for other angiosperms (1% to 5%) [73] and higher than the amount reported for different species of Aechmea and Vriesea, which ranged from 0.68% to 1% DM [4,71,74]. Although few reads from nitrogen-fixing cyanobacteria were identified, the high nitrogen levels in leaves from both bromeliad species may be explained by the occurrence of other nitrogen-fixing bacteria in the water tanks. The genus Pseudomonas has already been reported as including different nitrogen-fixing species [75,76,77,78]. Our data revealed the presence of Pseudomonas reads in all the surveyed bromeliad specimens, across all seasons, with high frequencies, particularly in V. platynema. Other bacterial genera, such as Burkholderia and Enterobacter, can fix atmospheric nitrogen in various plants [64,65,79] and were found at high frequencies in our bromeliad water samples. Thus, the species from these genera that occur in the water tanks may be involved in the nitrogen balance in these phytotelmata. Moreover, a previous study indicated that in detritus from bromeliad tanks, the microbial communities presented a metabolic network adapted to oxygen-limited conditions, including all denitrification steps and the ammonification process [31]. Thus, different microbial functional groups related to N cycling may also contribute to providing nitrogen directly for the plant leaves.
Secondary metabolism plays an important role in the adaptation to different environments and the promotion of plant defense. Phenolic compounds are found in most plant cells and can be considered as a chemical interface between plants and the surrounding environment. Phenolic compounds in A. gamosepala were most abundant in summer and winter, whereas in spring and fall, during the blooming period, the levels of these compounds were significantly lower. Accumulation of phenolic compounds is a distinctive characteristic of plant stress and serves various physiological functions for plants to adapt to environmental disturbances, such as antioxidant protection [80]. For example, individuals of Baccharis dentata revealed a seasonal antioxidant activity, which was high in winter and summer [81]. Phenolic compounds increase significantly in summer when plants are subjected to higher temperatures and light incidence. Moreover, during winter, the combination of cold and lower sunlight conditions can result in excess energy capture relative to processing, photo inhibition of photosynthesis, the formation of reactive oxygen species, and higher photo oxidative damage [80]. In contrast, the levels of phenolic compounds in V. platynema were similar over time, suggesting a different metabolic strategy for stress relief. Such strategies may also be influenced by the microbial composition of the tank water in these bromeliads. As an example, the genus Pseudomonas, which was found in both bromeliad species but mainly in V. platynema, includes species capable of producing phytohormones, biosurfactants, and inhibitors of ethylene [60]. Moreover, some species of the genus Enterobacter (which was also detected in our bromeliad tanks) can produce the phytohormone auxin [65]. Such molecules can interact with the host plant and participate in metabolic routes related to the stress response.
In conclusion, our analyses indicated that the microbial community was different between A. gamosepala and V. platynema. We also observed differences in OTU composition across seasons for both plants, which was most pronounced for V. platynema. Nevertheless, interesting similarities within individuals of each plant species were observed across seasons, mainly in A1 and V1 plants, which were from the same sampling point. This may indicate a trend for microbial stability in the tanks of both bromeliad species, which may be determined by the location of the plant host within the forest. The season seems to be critical to define the plant nutrition status in relation to the abundance of a specific group of bacteria. Thus, it is difficult to identify a specific dependency between prokaryote community and host plant nourishment in native and spontaneously growing bromeliads in the forest. Although the bacterial taxa with the highest relative abundances (>1%) have not been described as belonging to classic plant-beneficial groups, some species have been reported playing a role in nitrogen fixation and production of phytohormones and biosurfactants. Moreover, bacterial genera well known to promote plant growth were found in the phytotelmata of A. gamosepala and V. platynema, but at low abundances.
There are few studies on the prokaryotic and eukaryotic communities from phytotelmata of Southern Brazilian bromeliads [18,24,82]. Our survey presents the description of bacterial communities from bromeliad phytotelmata using DNA metabarcoding, the seasonal physiological changes of the host plants and some of their possible interactions in the Atlantic Forest in southern Brazil. Our results reveal the complexity of these ecological systems and highlight the challenges that lie ahead in terms of establishing detailed connections between the composition of the microbial communities inhabiting the tanks of bromeliads and the various dimensions of the host plant’s physiology. Characterizing these interactions should help lay the foundations for in-depth assessments of their dynamics across space and time, as well as their broader role in the community ecology of their threatened Atlantic Forest biome.

Author Contributions

Conceptualization, R.M.-S., L.V.A., C.A.M., L.R.P.U. and E.E.; Formal analysis, A.G., L.G.d.A.B., R.R.O., T.L.L.S. and E.E.; Funding acquisition, R.M.-S., L.V.A., C.A.M., L.R.P.U., E.W.T. and E.E.; Methodology, A.G., T.L.L.S., K.A.G., A.G.D.-R., C.T.B., J.R.F., P.M.A., C.P.N., A.D.A., C.G.L., A.B.-S., C.A.M., L.R.P.U. and E.E.; Writing—original draft, A.G., R.M.-S. and L.V.A.; Writing—review & editing, R.M.-S., L.V.A., L.R.P.U., E.W.T. and E.E.

Funding

This research was funded by [Conselho Nacional de Desenvolvimento Científico e Tecnológico] grant number [474652/2009-2].

Acknowledgments

This work was developed with a research grant by CNPq.

Conflicts of Interest

The authors declare no conflicts of interest.

References

  1. Benzing, D.H.; Renfrow, A. The Mineral Nutrition of Bromeliaceae. Bot. Gaz. 1974, 135, 281–288. [Google Scholar] [CrossRef]
  2. Stuntz, S.; Zotz, G. Photosynthesis in vascular epiphytes—A survey of diverse taxonomical origin. Flora 2001, 196, 132–141. [Google Scholar] [CrossRef]
  3. Haubrich, C.S.; Pires, A.P.F.; Esteves, F.A.; Farjalla, V.F. Bottom-up regulation of bacterial growth in tropical phytotelm bromeliads. Hydrobiologia 2009, 632, 347–353. [Google Scholar] [CrossRef]
  4. Wanek, W.; Zotz, G. Are vascular epiphytes nitrogen or phosphorus limited? A study of plant 15N fractionation and foliar N:P stoichiometry with the tank bromeliad Vriesea sanguinolenta. New Phytol. 2011, 192, 462–470. [Google Scholar] [CrossRef] [PubMed]
  5. Medina, E.; Ziegler, H.; Luttge, U.; Trimborn, P.; Francisco, M. Light conditions during growth as reveled by 13C values of leaves of primitive cultivars of Ananas comosus, an obligate CAM species. Funct. Ecol. 1994, 8, 298–305. [Google Scholar] [CrossRef]
  6. Pop, M.; Janett, H.-P.; Luttge, U.; Medina, E. Metabolite gradients and carbohydrate translocation in rosette leaves of CAM and C3 bromeliads. New Phytol. 2003, 157, 649–656. [Google Scholar] [CrossRef]
  7. Crayn, D.M.; Winter, K.; Smith, J.A.C. Multiple origins of crassulacean acid metabolism and the epiphytic habit in the neotropical family Bromeliaceae. Proc. Natl. Acad. Sci. USA 2004, 101, 3703–3708. [Google Scholar] [CrossRef]
  8. Silvera, K.; Lasso, E. Ecophysiology and crassulacean acid metabolism of tropical epiphytes. In Tropical Tree Physiology: Adaptations and Responses in a Changing Environment; Goldstein, G., Santiago, L.S., Eds.; Springer: New York, NY, USA, 2016; pp. 25–43. [Google Scholar]
  9. Haslam, R.; Borland, A.; Maxswell, K.; Griffiths, H. Physiological responses of the CAM epiphyte Tillandsia usneoides L. (Bromeliaceae) to variations in light and water supply. J. Plant Physiol. 2003, 160, 627–634. [Google Scholar] [CrossRef]
  10. Benzing, D.H. Vascular Epiphytes. General Biology and Related Biota; Cambridge University Press: Cambridge, UK, 1990; p. 350. [Google Scholar]
  11. Wake, D.B. Adaptive radiation of salamanders in middle American cloud forests. Ann. Mo. Bot. Gard. 1987, 74, 242–264. [Google Scholar] [CrossRef]
  12. Laessle, A.M. A microlimnologicalstudy of Jamaican bromeliads. Ecology 1961, 24, 499–517. [Google Scholar] [CrossRef]
  13. Palacios-Vargas, J.G. Collembola asociados a Tillandsia (Bromeliaceae) en el Derrame Lavico del Chichinautzin, Morelos, Mexico. Southwest. Entomol. 1981, 6, 87–98. [Google Scholar]
  14. Fish, D. Phytotelmata: Terrestrial plants as hosts for aquatic insect communities. In Phytotelmata: Flora and Fauna; Frank, J.H., Lounibos, L.P., Eds.; Plexus: Medford, NJ, USA, 1983. [Google Scholar]
  15. Carrias, J.F.; Cussac, M.E.; Corbara, B. A preliminary study of freshwater protozoa in tank bromeliads. J. Trop. Ecol. 2001, 17, 611–617. [Google Scholar] [CrossRef]
  16. Landell, M.F.; Billodre, R.; Ramos, J.P.; Leoncine, O.; Vainstein, M.H.; Valente, P. Candida aechmeae sp. nov. and Candida vrieseae sp. nov., novel yeast species isolated from the phylloplane of bromeliads in Southern Brazil. Int. J. Syst. Evol. Microbiol. 2010, 60, 244–248. [Google Scholar] [CrossRef] [PubMed]
  17. Brouard, O.; Le Jeune, A.H.; Leroy, C.; Cereghino, R.; Roux, O.; Pelozuelo, L.; Dejean, A.; Corbara, B.; Carrias, J.F. Are algae relevant to the detritus-based food web in tank-bromeliads? PLoS ONE 2011, 6, e20129. [Google Scholar] [CrossRef]
  18. Simão, T.L.L.; Giongo-Borges, A.; Gano, K.A.; Davis-Richardson, A.G.; Brown, C.T.; Fagen, J.R.; Triplett, E.W.; Dias, R.; Mondin, C.A.; da Silva, R.M.; et al. Characterization of ciliate diversity in bromeliad tank waters from the Brazilian Atlantic Forest. Eur. J. Protistol. 2017, 61, 359–365. [Google Scholar] [CrossRef] [PubMed]
  19. Brighigna, L.; Montaini, P.; Favilli, F.; Trejo, A.C. Role of the nitrogen-fixing bacterial microflora in the epiphytism of Tillandsia (Bromeliaceae). Am. J. Bot. 1992, 79, 723–727. [Google Scholar] [CrossRef]
  20. Tsoktouridis, G.; Mantell, S.; Bantinaki, E.; Thangavelu, M. DNA profiling and strategies for in planta localisation of bacteria intimately associated with Billbergia magnifica ssp. acutisepalia. Plant Cell Tissue Organ Cult. 1998, 52, 41–45. [Google Scholar] [CrossRef]
  21. Goffredi, S.K.; Kantor, A.H.; Woodside, W.T. Aquatic microbial habitats within a neotropical rainforest: Bromeliads and pH-associated trends in bacterial diversity and composition. Microb. Ecol. 2010, 61, 529–542. [Google Scholar] [CrossRef]
  22. Pittl, E.; Innerebner, G.; Wanek, W.; Insam, H. Microbial communities of arboreal and ground soils in the Esquinas rainforest, Costa Rica. Plant Soil 2011, 329, 65–74. [Google Scholar] [CrossRef]
  23. Goffredi, S.K.; Jang, G.E.; Woodside, W.T.; Ussler, W., III. Bromeliad catchments as habitats for methanogenesis in tropical rainforest canopies. Front. Microbiol. 2011, 2, 256. [Google Scholar] [CrossRef]
  24. Giongo, A.; Beneduzi, A.; Gano, K.A.; Vargas, L.K.; Utz, L.; Passaglia, L.M.P. Characterization of plant growth-promoting bacteria inhabiting Vriesea gigantea Gaud. and Tillandsia aeranthos (Loiseleur) L.B. Smith (Bromeliaceae). Biota Neotrop. 2013, 13, 80–85. [Google Scholar] [CrossRef]
  25. Brandt, F.B.; Martinson, G.O.; Pommerenke, B.; Pump, J.; Conrad, R. Drying on archaeal community composition and methanogenesis in bromeliad tanks. FEMS Microbiol. Ecol. 2015, 91, 1–10. [Google Scholar] [CrossRef] [PubMed]
  26. Goffredi, S.K.; Jang, G.E.; Haroon, M.F. Transcriptomics in the tropics: Total RNA-based profiling of Costa Rican bromeliad-associated communities. Comput. Struct. Biotechnol. J. 2015, 13, 18–23. [Google Scholar] [CrossRef] [PubMed]
  27. Louca, S.; Jacques, S.M.S.; Pires, A.P.F.; Leal, J.S.; Srivastava, D.S.; Parfrey, L.W.; Farjalla, V.F.; Doebeli, M. High taxonomic variability despite stable functional structure across microbial communities. Nat. Ecol. Evol. 2016. [Google Scholar] [CrossRef] [PubMed]
  28. Brandt, F.B.; Martinson, G.O.; Conrad, R. Bromeliad tanks are unique habitats for microbial communities involved in methane turnover. Plant Soil 2017, 410, 167–179. [Google Scholar] [CrossRef]
  29. Inselsbacher, E.; Cambui, C.A.; Richter, A.; Stange, C.F.; Mercier, H.; Wanek, W. Microbial activities and foliar uptake of nitrogen in the epiphytic bromeliad Vriesea gigantea. New Phytol. 2007, 175, 311–320. [Google Scholar] [CrossRef] [PubMed]
  30. Cambuí, C.A.; Gaspar, M.; Mercier, H. Detection of urease in the cell wall and membranes from leaf tissues of bromeliad species. Physiol. Plant. 2009, 136, 86–93. [Google Scholar] [CrossRef]
  31. Louca, S.; Jacques, S.M.S.; Pires, A.P.F.; Leal, J.S.; González, A.L.; Doebeli, M.; Farjalla, V.F. Functional structure of the bromeliad tank microbiome is strongly shaped by local geochemical conditions. Environ. Microbiol. 2017, 19, 3132–3151. [Google Scholar] [CrossRef]
  32. Xu, J. Microbial ecology in the age of genomics and metagenomics concepts, tools, and recent advances. Mol. Ecol. 2006, 15, 1713–1731. [Google Scholar] [CrossRef]
  33. Mota, F.S. Estudos do clima do estado do Rio Grande do Sul, segundo o sistema de W. Koppen. Rev. Bras. Geogr. 1951, 13, 275–284. [Google Scholar]
  34. Bertoletti, J.J.; Teixeira, M.B. Centro de Pesquisas e Conservação da Natureza Pró-Mata. Termo de Referência. Div. Mus. Ciên. Tec. UBEA/PUCRS 1995, 2, 1–47. [Google Scholar]
  35. Allen, S.E. Chemical Analyses of Ecological Materials; Blackwell Scientific: Oxford, UK, 1974; p. 565. [Google Scholar]
  36. Tedesco, M.J.; Gianello, C.; Bissani, C.A.; Bohnen, H.; Volkweiss, S.J. Análise de Solo, Plantas e Outros Materiais, 2nd ed.; Universidade Federal do Rio Grande do Sul: Porto Alegre, Brazil, 1995; p. 174. [Google Scholar]
  37. Güsewell, S.; Koerselman, W. Variation in nitrogen and phosphorus concentrations of wetland plants. Perspect. Plant Ecol. Evol. Syst. 2002, 5, 37–61. [Google Scholar] [CrossRef]
  38. Yemm, E.W.; Willis, A.J. The estimation of carbohydrates in plant extracts by anthrone. Biochem. J. 1954, 57, 508–514. [Google Scholar] [CrossRef] [PubMed] [Green Version]
  39. Savio, L.E.B.; Astarita, L.V.; Santarém, E.L. Secondary metabolism in micropropagated Hypericum perforatum L. grown in non-aerated liquid. Plant Cell Tissue Organ Cult. 2012, 108, 465–472. [Google Scholar] [CrossRef]
  40. Bradford, M.M. A rapid sensitive method for the quantification of microgram quantities of protein utilising the principle of protein-Dye Binding. Anal. Biochem. 1976, 72, 248–254. [Google Scholar] [CrossRef]
  41. Bates, S.; Berg-Lyons, D.; Caporaso, J.G.; Walters, W.A.; Knight, R.; Fierer, N. Examining the global distribution of dominant archaeal populations in soil. ISME J. 2011, 5, 908–917. [Google Scholar] [CrossRef] [PubMed]
  42. Fagen, J.R.; Giongo, A.; Brown, C.T.; davis-Richardson, A.G.; Gano, K.A.; Triplett, E.W. Characterization of the Relative Abundance of the Citrus Pathogen Ca. Liberibacter asiaticus in the Microbiome of Its Insect Vector, Diaphorina citri, using High Throughput 16S rRNA Sequencing. Open Microbiol. J. 2012, 6, 29–33. [Google Scholar] [CrossRef] [PubMed]
  43. Huang, X.; Wang, J.; Aluru, S.; Yang, S.-P.; Hillier, L.D. PCAP: A Whole-Genome Assembly Program. Genome Res. 2003, 13, 2164–2170. [Google Scholar] [CrossRef] [PubMed] [Green Version]
  44. Giongo, A.; Crabb, D.B.; Davis-Richardson, A.G.; Chauliac, D.; Moberley, J.M.; Gano, K.A.; Mukherjee, N.; Casella, G.; Roesh, L.F.W.; Brandon, W.; et al. PANGEA: Pipeline for Analysis of Next GEneration Amplicons. ISME J. 2010, 4, 852–861. [Google Scholar] [CrossRef]
  45. Cole, J.R.; Chai, B.; Farris, R.J.; Wang, Q.; Kulam, S.A.; McGarrel, D.M.; Garrit, G.M.; Tiedje, J.M. The Ribosomal Database Project (RDP-II): Sequences and tools for high-throughput rRNA analysis. Nucleic Acids Res. 2005, 33, D294–D296. [Google Scholar] [CrossRef]
  46. Giongo, A.; Davis-Richardson, A.G.; Crabb, D.B.; Triplett, E.W. TaxCollector: Tools to modify existing 16S rRNA databases for the rapid classification at six taxonomic levels. Diversity 2010, 23, 1015–1025. [Google Scholar] [CrossRef]
  47. Hong, S.H.; Bunge, J.; Jeon, S.O.; Epistein, S.S. Predicting microbial species richness. Proc. Natl. Acad. Sci. USA 2006, 103, 117–122. [Google Scholar] [CrossRef] [PubMed]
  48. Meyer, F.; Paarmann, D.; D’Souza, M.; Olson, R.; Glass, E.M.; Paczian, T.; Rodriguez, A.; Stevens, R.; Wilke, A.; Wilkening, J.; et al. The metagenomics RAST server—A public resource for the automatic phylogenetic and functional analysis of metagenomes. BCM Bioinform. 2008, 9, 386. [Google Scholar] [CrossRef] [PubMed]
  49. Griffiths, H. Carbon dioxide concentration mechanisms and the evolution of CAM in vascular epiphytes. In Vascular Plants as Epiphytes Evolution and Ecophysiology; Lüttge, U., Ed.; Springer: Berlin, Germany, 1989; pp. 42–86. [Google Scholar]
  50. Pierce, S.; Winter, K.; Griffiths, H. The role of CAM in high rainfall cloud forests: An in situ comparison of photosynthetic pathways in Bromeliaceae. Plant Cell Environ. 2002, 25, 1181–1189. [Google Scholar] [CrossRef]
  51. Takahashi, C.A.; Mercier, H. Nitrogen metabolism in leaves of a tank epiphytic bromeliad: Characterization of a spatial and functional division. J. Plant Physiol. 2011, 11, 1208–1216. [Google Scholar] [CrossRef] [PubMed]
  52. Aerts, R.; Chapin, F.S. The mineral nutrition of wild plants revisited: A re-evaluation of processes and patterns. In Advances in Ecological Research; Academic Press: Cambridge, MA, USA, 2000; Volume 30, pp. 1–67. [Google Scholar]
  53. Winkler, U.; Zotz, G. Highly efficient uptake of phosphorus in epiphytic bromeliads. Ann. Bot. 2009, 103, 477–484. [Google Scholar] [CrossRef] [PubMed]
  54. Chapin, F.S. The mineral nutrition of wild plants. Ann. Rev. Ecol. Syst. 1980, 11, 233–260. [Google Scholar] [CrossRef]
  55. Cardelus, C.L.; Mack, M.C.; Woods, C.; DeMarco, J.; Treseder, K.K. The influence of tree species on canopy soil nutrient status in a tropical lowland wet forest in Costa Rica. Plant Soil 2009, 318, 47–61. [Google Scholar] [CrossRef]
  56. Wassen, M.J.; Venterink, H.O.; Lapshina, E.D.; Tanneberger, F. Endangered plants persist under phosphorus limitation. Nature 2005, 437, 547–550. [Google Scholar] [CrossRef]
  57. Koerselman, W.; Meuleman, A.F.M. The vegetation N:P ratio: A new tool to detect the nature of nutrient limitation. J. Appl. Ecol. 1996, 33, 1441–1450. [Google Scholar] [CrossRef]
  58. Farjalla, V.F.; Srivastava, D.S.; Marino, N.A.; Azevedo, F.D.; Dib, V.; Lopes, P.M.; Rosado, A.S.; Bozelli, R.L.; Esteves, F.A. Ecological determinism increases with organism size. Ecology 2012, 93, 1752–1759. [Google Scholar] [CrossRef] [PubMed]
  59. Carmo, F.L.; Santos, H.F.; Peixoto, R.S.; Rosado, A.S.; Araujo, F.V. Tank bromeliad water: Similar or distinct environments for research of bacterial bioactives? Braz. J. Microbiol. 2014, 45, 185–192. [Google Scholar] [CrossRef] [PubMed]
  60. Pedraza, R.O. Recent advances in nitrogen-fixing acetic acid bacteria. Int. J. Food Microbiol. 2008, 125, 25–35. [Google Scholar] [CrossRef] [PubMed]
  61. Jain, A.; Das, S. Insight into the interaction between plants and associated fluorescent Pseudomonas spp. Int. J. Agron. 2016. [Google Scholar] [CrossRef]
  62. Bodenhausen, N.; Horton, M.W.; Bergelson, J. Bacterial communities associated with the leaves and the roots of Arabidopsis thaliana. PLoS ONE 2013, 8, e56329. [Google Scholar] [CrossRef] [PubMed]
  63. Hagler, A.N.; Rosa, C.A.; Morais, P.B.; Mendonça-Hagler, L.C.; Franco, G.M.; Araujo, F.V.; Soares, C.A. Yeasts and coliform bacteria of water accumulated in bromeliads of mangrove and sand dune ecosystems of southeast Brazil. Can. J. Microbiol. 1993, 39, 973–977. [Google Scholar] [CrossRef]
  64. Bashan, Y.; de-Bashan, L.E.; Prabhu, S.R.; Hernandez, J.P. Advances in plant growth-promoting bacterial inoculant technology: Formulations and practical perspectives (1998–2013). Plant Soil 2014, 378, 1–33. [Google Scholar] [CrossRef]
  65. Ramesh, A.; Sharma, S.K.; Sharma, M.P.; Yadav, N.; Om, J.P. Plant growth-promoting traits in Enterobacter cloacae subsp. dissolvens MDSR9 isolated from soybean rhizosphere and its impact on growth and nutrition of soybean and wheat upon inoculation. Agric. Res. 2014, 3, 53–66. [Google Scholar] [CrossRef]
  66. Martinson, G.O.; Werner, F.A.; Scherber, C.; Conrad, R.; Corre, M.D.; Flessa, H.; Wolf, K.; Gradstein, S.R.; Veldkamp, E. Methane emissions from tank bromeliads in neotropical forests. Nat. Geosci. 2010, 3, 766–769. [Google Scholar] [CrossRef]
  67. Jousset, A.; Bienhold, C.; Chatzinotas, A.; Gallien, L.; Gobet, A.; Kurm, V.; Rillig, M.C.; Rivett, D.W.; Salles, J.F.; van der Heijden, M.G.; et al. Where less may be more: How the rare biosphere pulls ecosystems strings. ISME J. 2017, 11, 853–862. [Google Scholar] [CrossRef]
  68. Ahemad, M.; Kibret, M. Mechanisms and applications of plant growth promoting rhizobacteria: Current perspective. J. King Saud Univ. Sci. 2014, 26, 1–20. [Google Scholar] [CrossRef] [Green Version]
  69. Sogin, M.L.; Morrison, H.G.; Huber, J.A.; Welch, M.D.; Huse, S.M.; Neal, P.R.; Arrieta, J.M.; Herndl, G.J. Microbial diversity in the deep sea and the underexplored “rare biosphere”. Proc. Natl. Acad. Sci. USA 2006, 103, 12115–12120. [Google Scholar] [CrossRef] [PubMed]
  70. Richardson, B.A. The bromeliad microcosm and the assessment of faunal diversity in a neotropical forest. Biotropica 1999, 31, 321–336. [Google Scholar] [CrossRef]
  71. Leroy, C.; Carrias, J.-F.; Céréghino, R.; Corbara, B. The contribution of microorganisms and metazoans to mineral nutrition in bromeliads. J. Plant Ecol. 2015, 9, 241–255. [Google Scholar] [CrossRef]
  72. Normand, P.; Benson, D.R.; Berry, A.M.; Tisa, L.S. The family Frankiaceae. In The Prokaryotes; Rosenberg, E., DeLong, E.F., Lory, S., Stackebrandt, E., Thompson, F., Eds.; Springer: New York, NY, USA, 2015; pp. 339–356. [Google Scholar]
  73. Lorenzo, N.; Mantuano, D.; Mantovani, A. Comparative leaf ecophysiology and anatomy of seedlings, young and adult individuals of the epiphytic aroid Anthurium scandens (Aubl.) Engl. Environ. Exp. Bot. 2010, 68, 314–322. [Google Scholar] [CrossRef]
  74. Mardegan, S.F.; Nardoto, G.B.; Higuchi, N.; Reinert, F.; Martinelli, L.A. Variation in nitrogen use strategies and photosynthetic pathways among vascular epiphytes in the Brazilian Central Amazon. Rev. Bras. Bot. 2011, 34, 21–30. [Google Scholar] [CrossRef] [Green Version]
  75. Silby, M.W.; Winstanley, C.; Godfrey, S.A.C.; Levy, S.B.; Jackson, R.W. Pseudomonas genome: Diverse and adaptable. FEMS Microbiol. Rev. 2011, 35, 652–680. [Google Scholar] [CrossRef]
  76. Fox, A.R.; Soto, G.; Valverde, C.; Russo, D.; Lagares, A., Jr.; Zorreguieta, A.; Alleva, K.; Pascuan, C.; Frare, R.; Mercado-Blanco, J.; et al. Major cereal crops benefit from biological nitrogen fixation when inoculated with the nitrogen-fixing bacterium Pseudomonas protegens Pf-5 X940. Environ. Microbiol. 2016, 18, 3522–3534. [Google Scholar] [CrossRef]
  77. Patten, C.L.; Jeong, H.; Blakney, A.J.; Wallace, N. Draft genome sequence of a diazotrophic, plant growth-promoting rhizobacterium of the Pseudomonas syringae complex. Genome Announc. 2016, 4, e01023-16. [Google Scholar] [CrossRef]
  78. Saha, C.; Mukherjee, G.; Agarwal-Banka, P.; Seal, A. A consortium of non-rhizobial endophytic microbes from Typha angustifolia functions as probiotic in rice and improves nitrogen metabolism. Plant Biol. 2016, 18, 938–946. [Google Scholar] [CrossRef]
  79. Coenye, T.; Vandamme, P. Diversity and significance of Burkholderia species occupying diverse ecological niches. Environ. Microbiol. 2003, 5, 719–729. [Google Scholar] [CrossRef] [PubMed]
  80. Cheynier, V.; Comte, G.; Davies, K.M.; Latanzio, V.; Martens, S. Plant phenolics: Recent advances on their biosynthesis, genetics, and ecophysiology. Plant Physiol. Biochem. 2013, 72, 1–20. [Google Scholar] [CrossRef] [PubMed]
  81. Sartor, T.; Xavier, V.B.; Falcão, M.A.; Mondin, C.A.; Dos Santos, M.A. Seasonal changes in phenolic compounds and in the biological activities of Baccharis dentata (Vell.) G.M. Barroso. Ind. Crops Prod. 2013, 1, 355–359. [Google Scholar] [CrossRef]
  82. Ambrosini, A.; Giongo, A.; Beneduzi, A.; Colbachini, N.; Friedisch, L.; Passaglia, L.M.P. LBactérias promotoras de crescimento vegetal em Vriesea gigantea Gaudchi. (Bromeliaceae). Rev. Bras. Biociências 2007, 5, 1169–1170. [Google Scholar]
Figure 1. Sampling site (white star) at the Center for Research and Nature Conservation Pró-Mata, northeastern Rio Grande do Sul state, southernmost Brazil.
Diversity 11 00111 g001
Figure 2. The two species of tank-forming bromeliads sampled in the Center for Research and Nature Conservation Pró-Mata. (A) Aechmea gamosepala (Wittm.); (B) A. gamosepala (Wittm.) flower detail; (C) Vriesea platynema (Gaud.); (D) V. platynema (Gaud.) flower detail. Photos: CPCN Pró-Mata Collection.
Diversity 11 00111 g002
Figure 3. Nutritional parameters in leaves of Aechmea gamosepala and Vriesea platynema sampled in different seasons: (A) nitrogen; (B) proteins; (C) sugars; (D) potassium; (E) phosphate; (F) phenolic compounds. Different letters indicate significant differences within species between seasons (ANOVA, Duncan’s test, p ≤ 0.05). Asterisks indicate significant differences between bromeliad species within a given season (Student Test, p ≤ 0.05). Bars represent standard errors of the mean.
Diversity 11 00111 g003
Figure 4. N:P ratio in leaves of Aechmea gamosepala and Vriesea platynema sampled in different seasons. The ratio was calculated from the percentages of the elements N and P present in the dry mass (DM). Bars represent standard errors of the mean.
Diversity 11 00111 g004
Figure 5. The relative abundance of prokaryotes present in Aechmea gamosepala and Vriesea platynema tank at frequencies higher than 1%. (A) Microbial abundance at phylum level for different specimens of A. gamosepala (A1 and A5) and V. platynema (V1 and V5) along the different seasons (numbered according to the month of sampling: 1—summer; 5—fall; 8—winter; 10—spring). (B) Average abundance of Proteobacteria classes in A. gamosepala and V. platynema. (C) Microbial abundance at genus level for the same samples depicted in (A). Boxes indicate genera with significant differences (p ≤ 0.05) in abundance between the bromeliad species.
Diversity 11 00111 g005
Figure 6. Venn diagrams showing the unique and shared bacterial operational taxonomic units (OTUs) (A) between the two bromeliad species, A. gamosepala and V. platynema; (B) different seasons for V. platynema and (C) different seasons for A. gamosepala.
Diversity 11 00111 g006
Figure 7. Two-dimensional projection of the DNA metabarcoding analysis using principal coordinate analysis (PCoA) based on a Bray–Curtis distance matrix (A). The axes represent two of the synthetic variables (PCo1 and PCo3), with the percentage of the total variance explained by each of them in parentheses. Each point represents the microbial community from one specimen, colored according to the bromeliad species: red dots indicate A. gamosepala (A1 and A5) and blue dots indicate V. platynema (V1 and V5, delimited by ellipse), in a specific season (01—Summer; 05—Fall; 08—Winter; 10—Spring).
Diversity 11 00111 g007
Table 1. Field data from the sampled bromeliads and their water tanks.
Bromeliad speciesPlant ID SeasonAir Temperature
(°C)
Plant Height at Tree Stem (m)Water Tank
SamplepHTemperature (°C)Volume Collected (mL)
Aechmea gamosepalaA1A1-1Summer202.86.52020
A1A1-5Fall1361413
A1A1-8Winter10655
A1A1-10Spring175.51617
A5A5-5Fall132.461413
A5A5-8Winter10655
A5A5-10Spring175.51617
Vriesea platynemaV1V1-1Summer202.56.52029
V1V1-8Winter10655
V1V1-10Spring175.51617
V5V5-8Winter102.4655
V5V5-10Spring175.51617
Table 2. Levels of reducing sugars in leaves (mg/g FM) of Aechmea gamosepala and Vriesea platynema sampled in different sites (1 to 5) and seasons. Different letters in the column indicate significant differences within species and season (ANOVA, Duncan’s test, p ≤ 0.05).
SeasonsSitesA. gamosepalaV. platynema
Spring110.236 c11.399 a
215.641 b9.673 a
318.324 a11.450 a
419.839 a6.910 a
519.424 a5.810 b
Summer115.139 ana
216.02 a14.602 a
3nana
418.887bna
5na12.721 a
Fall115.954 a1.380 c
26.250 bc2.813 c
37.061 b2.558 c
44.819 c5.499 b
57.624 b12.099 a
Winter116.208 c20.817 a
219.143 b10.528 b
318.795 b6,928 c
418,569 b8.736 cd
522.813 a11.454 b
na—Sample not available.
Table 3. Mean percentage of total reads (relative abundance) for the significantly different prokaryote taxa in Aechmea gamosepala specimens A1 and A5. Significantly higher values are depicted in bold.
SpecimenRelative Abundancep
A1-1A1-2A1-3A1-4A5-1A5-2A5-3
Order
Neisseriales0.010.010.030.000.140.000.010.05
Families
Acidimicrobiaceae0.00540.00440.005200.00580.07880.00640.031
Clostridiales Family XI.
Incertae Sedis
00000.00060.00430.00130.018
Frankiaceae0.00140000.00120.00640.00900.042
Micrococcaceae000.002600.01750.00430.01410.028
Nakamurellaceae0.005400.005200.00640.03830.01280.031
Neisseriaceae0.00540.0088000.02630.14270.00900.048
Oxalobacteraceae0.02160.02630.02620.00160.02920.50260.18630.032
Phyllobacteriaceae0.00270.00440.002600.00350.06390.00770.048
Genera
Acinetobacter0.02300.04820.07350.03770.01580.00850.01800.05
Amycolatopsis00000.00060.00210.00900.031
Arthrobacter000.002600.01640.00430.01280.018
Buttiauxella0.36360.67430.51160.76800.36400.20230.32380.05
Candidatus Cuticobacterium0.02300.03500.03670.04420.01810.01060.02180.028
Candidatus Nardonella0.08650.17080.11810.18180.07480.05960.06040.048
Candidatus Stammerula0.11620.13140.15220.22430.08410.05110.07580.034
Cronobacter *0.07840.29771.37990.10150.06310.02560.03980.034
Escherichia *0.20541.734013.45520.30780.19280.09370.10280.034
Massilia0.00140.00440.002600.00410.03830.02700.019
Nakamurella0.005400.005200.00580.02770.01030.034
Solibium00000.00120.00430.00130.034
Xanthomonas0.00140.00440.00520.0016000.00130.032
* Relative abundance higher than 1% in at least one specimen.
Table 4. Average of relative abundances of the most frequent bacterial species observed in A. gamosepala and V. platynema. A total of 1,110,704 16S rRNA sequences were analyzed.
Diversity 11 00111 i001

