Article

Seasonal Diversity of Endophytic Bacteria Associated with Cinnamomum camphora (L.) Presl.

by
Abubakr Abdelwhab Hamd Elmagzob
1,2,
Muhammed Mustapha Ibrahim
3,4 and
Guo-Fang Zhang
1,*
1
Forestry College, Fujian Agriculture and Forestry University, Fuzhou 350002, China
2
National Center for Research, Khartoum 11111, Sudan
3
Department of Soil Science, University of Agriculture Makurdi, Makurdi 972211, Nigeria
4
Key Research Laboratory of Soil Ecosystem Health and Regulation, College of Resources and Environment, Fujian Agriculture and Forestry University, Fuzhou 350002, China
*
Author to whom correspondence should be addressed.
Diversity 2019, 11(7), 112; https://doi.org/10.3390/d11070112
Submission received: 18 May 2019 / Revised: 30 June 2019 / Accepted: 1 July 2019 / Published: 15 July 2019
(This article belongs to the Section Microbial Diversity and Culture Collections)

Abstract

:
Investigations on the density, diversity, and distribution of endophytic bacterial community associated with leaves of Cinnamomum camphora (L.) Presl. were carried out during three seasons using 16s rDNA high-throughput sequencing technology. Samples were collected from five species in Nanping (A, B, C, D, and E) and one from Fuqin (F) in the Fujian province, China in the months of April, July, and October (represented by 1, 2 and 3), indicating spring, summer, and early winter, respectively. Results from 16s rDNA sequences revealed 10,844,124 effective sequences. The highest OTUs (Operational taxonomic units) was highest in the A1 sample (1086), while the lowest was in C2 (509). Our observations showed that samples taken in October had the highest diversity of endophytes as indicated by the Shannon index (B3 = 5.3337), Chao1 (E3 = 1233.10), abundance-based coverage estimator (ACE) (A3 = 1764.72), and the Simpson indices of diversity (C3 = 0.1655) irrespective of the species. The order of the endophytes richness in the samples was April > July > October. The Ribosomal Database Project (RDP) classifier showed that the obtained sequences belonged to nine major phyla: Proteobacteria, Firmicutes, Bacteroidetes, Actinobacteria, Gemmatimonadetes, Acidobacteria, Planctomycetes, Chloroflexi, and Fusobacteria. Proteobacteria accounted for the highest proportion in each sample, ranging from 35.15% to 89.72%. These sequences belonged mainly to 10 orders: Rhizobiales, Clostridiales, Peseudomonadales, Burkholderiales, Bacteroidales, Enterobacteriales, Rhodocyclales, Sphingomonadales, Lactobacillales, and Bacillales. Also, other taxa with possible taxonomic statuses, which were unclassified, were present.

1. Introduction

Over time, endophytes interaction with host plants has been characterized as being a functional relationship which could be pathogenic, saprophytic, and mutualistic, in addition to their highly recognized commensal lifestyle [1,2]. The mutualistic associations of endophytes with host plants promote plant growth, health, and resistance to multiple stresses [3,4]. An example of such mutualistic associations is that of the rhizobia-legume symbiosis, which results in biological nitrogen fixation [5]. Endophytes have been reported to be present in the tissues of all known plant species. They are unique, showing multi-dimensional interactions within the host plant due to their ability to colonize and thrive in these plant tissues [6]. They are characterized by being able to colonize the internal tissue of their host plants during their whole lifecycle without causing any known damage or infection to the host plant [7].
Several studies have documented the isolation of endophytic bacteria from various plant tissues, such as roots, stems, leaves, flowers, and seeds [1,8]. Bacterial endophytes play important roles in improving plant growth, increasing tolerance to biotic factors, and producing secondary metabolites [3,9,10,11]. Cinnamomum camphora (C. camphora), a member of the family Lauraceae, has been extensively studied and found to host a large number of endophytic bacteria [12]. This species is widely distributed in China and is a common arbor species both in rural and urban regions, and its wild population has been indexed [13]. It is among the most important arbor species in East Asia, both economically and culturally. This species has been traditionally used as a source of timber, medicine, ornament, and pesticide for thousands of years [14]. Isolation of endophytes from C. camphora has shown that they are able to inhibit pathogens and are effective in the utilization of cellulose [15,16].
Recent advancement in molecular biology research techniques and methods such as the use of 16S rDNA technology is increasingly leading to a better understanding of the diversity of endogenous bacteria isolated from the environment. This understanding is paving ways for in-depth exploration of the relationships between endogenous bacteria and their host plants. However, due to the abundant contents of metabolites in camphoraceae plants [17] and the complex metabolic process of endophytes, it has been difficult to explore the co-evolution process between camphoraceae plants and endophytes. Exploring the diversity and distribution of endophytes in various plant parts is an important tool that can provide valuable resources for plant growth promotion and biotransformation [18]. Although numerous studies have focused on C. camphora and its secondary metabolites, no studies have been done to characterize endophytic microorganisms in C. camphora during different sampling times. Moreover, the use of high-throughput sequencing technologies has not been reported in studying endophytic bacteria in this tree. High-throughput sequencing based on 16S rDNA technology can reflect the colony structure characteristics of culturable and non-culturable bacteria in samples to a greater extent and also explore their diversity. Hence, the aim of this research was; therefore, to explore the diversity of endophytic bacteria associated with the leaves of C. camphora during different seasons using high-throughput sequencing.

2. Materials and Methods

2.1. Location of the Study

Plant samples were collected from Nanping Forest, and from Lingshi Forest Park in Fuqin City, Fujian Province. The geographic coordinates of Nanping Forest are 26°58′ N and 118°12′ E, while those of Lingshi forest in Fuqin are 25°40′ N and 119°13′ E. These study areas belong to the subtropical monsoon climate, with an average annual temperature of 20 °C to 30 °C and average annual sunshine time of 2000 h. The areas have a frost-free period of 340–360 days and average annual precipitation of over 1600 mm. The study areas are artificial forests with mixed vegetation that are being maintained.

2.2. Sample Collection

A total of six trees were marked for sampling; five trees from Nanping and coded as follows: NP 209, NP PC-1, NP 195, NP MDA-1, and NP 187(NP represents Nanping, followed by the code for each species) and one tree from Fuqin (FU). The only selected tree in Fuqin was the most abundant species in the region. A summary of the sampling times and coding used are presented in Table 1. The leaf samples for analysis were collected randomly from the upper canopy of each tree and kept in aseptic sampling bags correctly labeled according to the sampling dates. The three sampling dates were April (X), July (Y), and October (Z), which represented three seasons. April sampling represented spring samples while July and October samples represented early summer and early winter, respectively.

2.3. Laboratory Analyses

2.3.1. Sample Preparation for Analysis

Leaf samples were washed using running tap water to dislodge any soil or dust particles. This was followed by vigorous shaking with sterile water to remove any epiphytic microbes. Washed leaf samples were immersed in 70% ethanol solution for 30 s followed by immersion in 100 mL of 2% sodium hypochlorite containing 0.1% Tween 20. To remove the disinfectant, the leaves were rinsed five times in two washes with RNase-free sterile water and finally dried on sterile paper towels at room temperature. To confirm that the surface sterilization process was successful, the surface-sterilized leaves were rolled on a potato dextrose agar (PDA) medium containing dehydrated potato infusion: 200 g/L potato, 20g/L glucose, and 18 g/L agar. The aliquots of the sterile distilled water from the final rinse solutions were plated onto PDA plates as controls to detect possible contaminants. Aliquots from the leaf samples without growth on the PDA control plates were considered to be effectively surface-sterilized. After successful surface sterilization, all samples were immediately put on ice and stored at −80 °C until total DNA extraction.
One gram (1 g) of leaf from each sample was sliced using a sterile scalpel. Samples were macerated in liquid nitrogen using a sterile mortar and pestle. After maceration, the leaf tissue extracts were serially diluted in phosphate buffer solution and plated in triplicate on VM-ethanol plates (0.4 g/L KH2PO4, 0.6 g/L K2HPO4, 1.1 g/L NaCl, 0.5 g/L NH4Cl, 0.2 g/L MgSO4, 26 mg/L CaCl2, 10 mg/L MnSO4, 2 mg/L Na2MoO4, 0.66 mg/l Fe(III)-EDTA, 1 g/L yeast extract, 3 g/L bacto peptone, 6 mL/L ethanol, pH 6.8) to recover any endophyte present in the plant tissue. Dilution series (up to 10−7) were made, and 0.1 mL aliquots were spread on VM-ethanol plates in three replicates. All plates were incubated at 30 °C for 5–7 days. After selecting the most suitable plate (with colonies ranging between 30 and 300), the average numbers of colony-forming units (CFU) were determined in the replicates. The number of bacterial cells recovered was expressed as CFU g−1 fresh tissue weight. Pure cultures were prepared by sub-culturing on VM-ethanol and incubated at 30 °C. The purified colonies were stored in a refrigerator at 4 °C for further studies and for long-term storage, the isolates were preserved in 20% glycerol stocks at −20 °C.

2.3.2. Extraction of DNA and PCR Amplification

Genomic DNA was extracted from the bacterial isolates obtained from the leaves using the DNeasy Plant Mini Kit (Takara Bioengineering Company) following the manufacturer’s protocol. The extracted genomic DNA was prepared and used as a template. 1.5 kb 16S rRNA genes were amplified using bacterial universal primers (Biomarker biotechnology, Beijing, China) 27F (5′-AGAGTTTGATCCTGGCTCAG-3′) and 1492R (5′-GGTTACC TTGTTACGA CTT-3′) [19]. The PCR mixture included 0.5 μM of each primer, 23.5 μL of nuclease-free water, 25 μL master mix, and 1 μL of DNA template, making up a total of 50 μL. Similarly, the positive control contained all the above in addition to the DNA template from Pseudomonas putida identified using 16S rDNA-based analysis from previous studies. In the negative control, the DNA template was substituted with nuclease-free water.
Using the thermo-cycler (Biomarker Co., Ltd., Beijing, China), the Polymerase Chain Reaction (PCR) reaction was carried out as follows: 1 cycle of pre-denaturation at 94 °C for 4 min, 30 cycles of denaturation was done at 94 °C for 1 min, annealing at 50 °C for 30 s, extension at 72 °C for 1 min, and a final extension at 72 °C for 10 min. The amplified PCR products were visualized on 1% agarose gel with a 1 kb ladder (Thermo Corporation, Kodak Gel logic 2200 gel imager) and further sequencing of PCR products was carried out to identify the specific bacterial isolates.

2.3.3. 16.S rDNA Library Construction and High-Throughput Sequencing

After amplification, the PCR products were combined in equimolar ratios into one single tube. Then, the desired sequences were extracted using the Qiagen Gel Extraction Kit (Qiagen, Germany). The libraries were then constructed using the TruSeq® DNA PCR-Free Sample Preparation Kit (Illumina, Inc., San Diego, CA, USA), according to the manufacturer’s recommendations, and index codes were subsequently added. The library quality was assessed using Qubit® 2.0 Fluorometer (Thermo Fisher Scientific, Beijing, China) and Agilent Bioanalyzer 2100 system. The library was then sequenced using the Illumina HiSeq 2500 platform, and 250 bp paired-end reads were generated. The image data files were transformed into original sequencing sequences (sequenced reads) by Base Calling analysis. The results were stored in FASTQ format, including sequence information from the sequencing sequences (reads) and corresponding sequencing quality information.

2.4. Data Preprocessing and Bioinformatics

Data preprocessing: According to the overlap relationship between the Paired End (PE) reads, the double-ended sequence data obtained by Hiseq sequencing is merged into a sequence Tag using the FLASH v1.2.7 software, and the quality of Reads and the effect of Merge were filtered by quality control using Raw Trimmomatic v0.33 software. The operational taxonomy units (OTU) representative sequence was obtained by the default OTU analysis method of Mothur v.1.39.5 [20]. After calculating the uncorrected pairwise distance between sequences and using clustering and 97% similarity clustering, the longest sequence was selected as the representative sequence in each OTU cluster. Finally, according to different distances, they were divided into OTUs.
The UCLUST [21] in the QIIME [22] (version 1.8.0) software was used to cluster Tags and get OTU at 97% similarity level. The bacterial sequences were trimmed and assigned to individual samples based on their barcodes. The chimeric sequences were identified and eliminated using UCHIME. The phylogenetic affiliation of each 16S rRNA gene sequence was analyzed with the aid of a Ribosomal Database Project (RDP) Classifier (RDP Release 11) against the Silva (SSU123) 16S rRNA database at a confidence threshold of 70% [23]. Rarefaction analysis using Mothur v.1.39.5 was conducted to reveal the alpha and beta diversity; observed species, including chao1, the Shannon index, the Simpson index, abundance-based coverage estimator (ACE), good-coverage, the unweighted pair-group method with arithmetic means (UPGMA), and the T-test analysis were performed by QIIME. For ecological association, principal component analysis (PCA) and principal coordinate analysis (PCoA) were performed using the PAST software [24].

3. Results

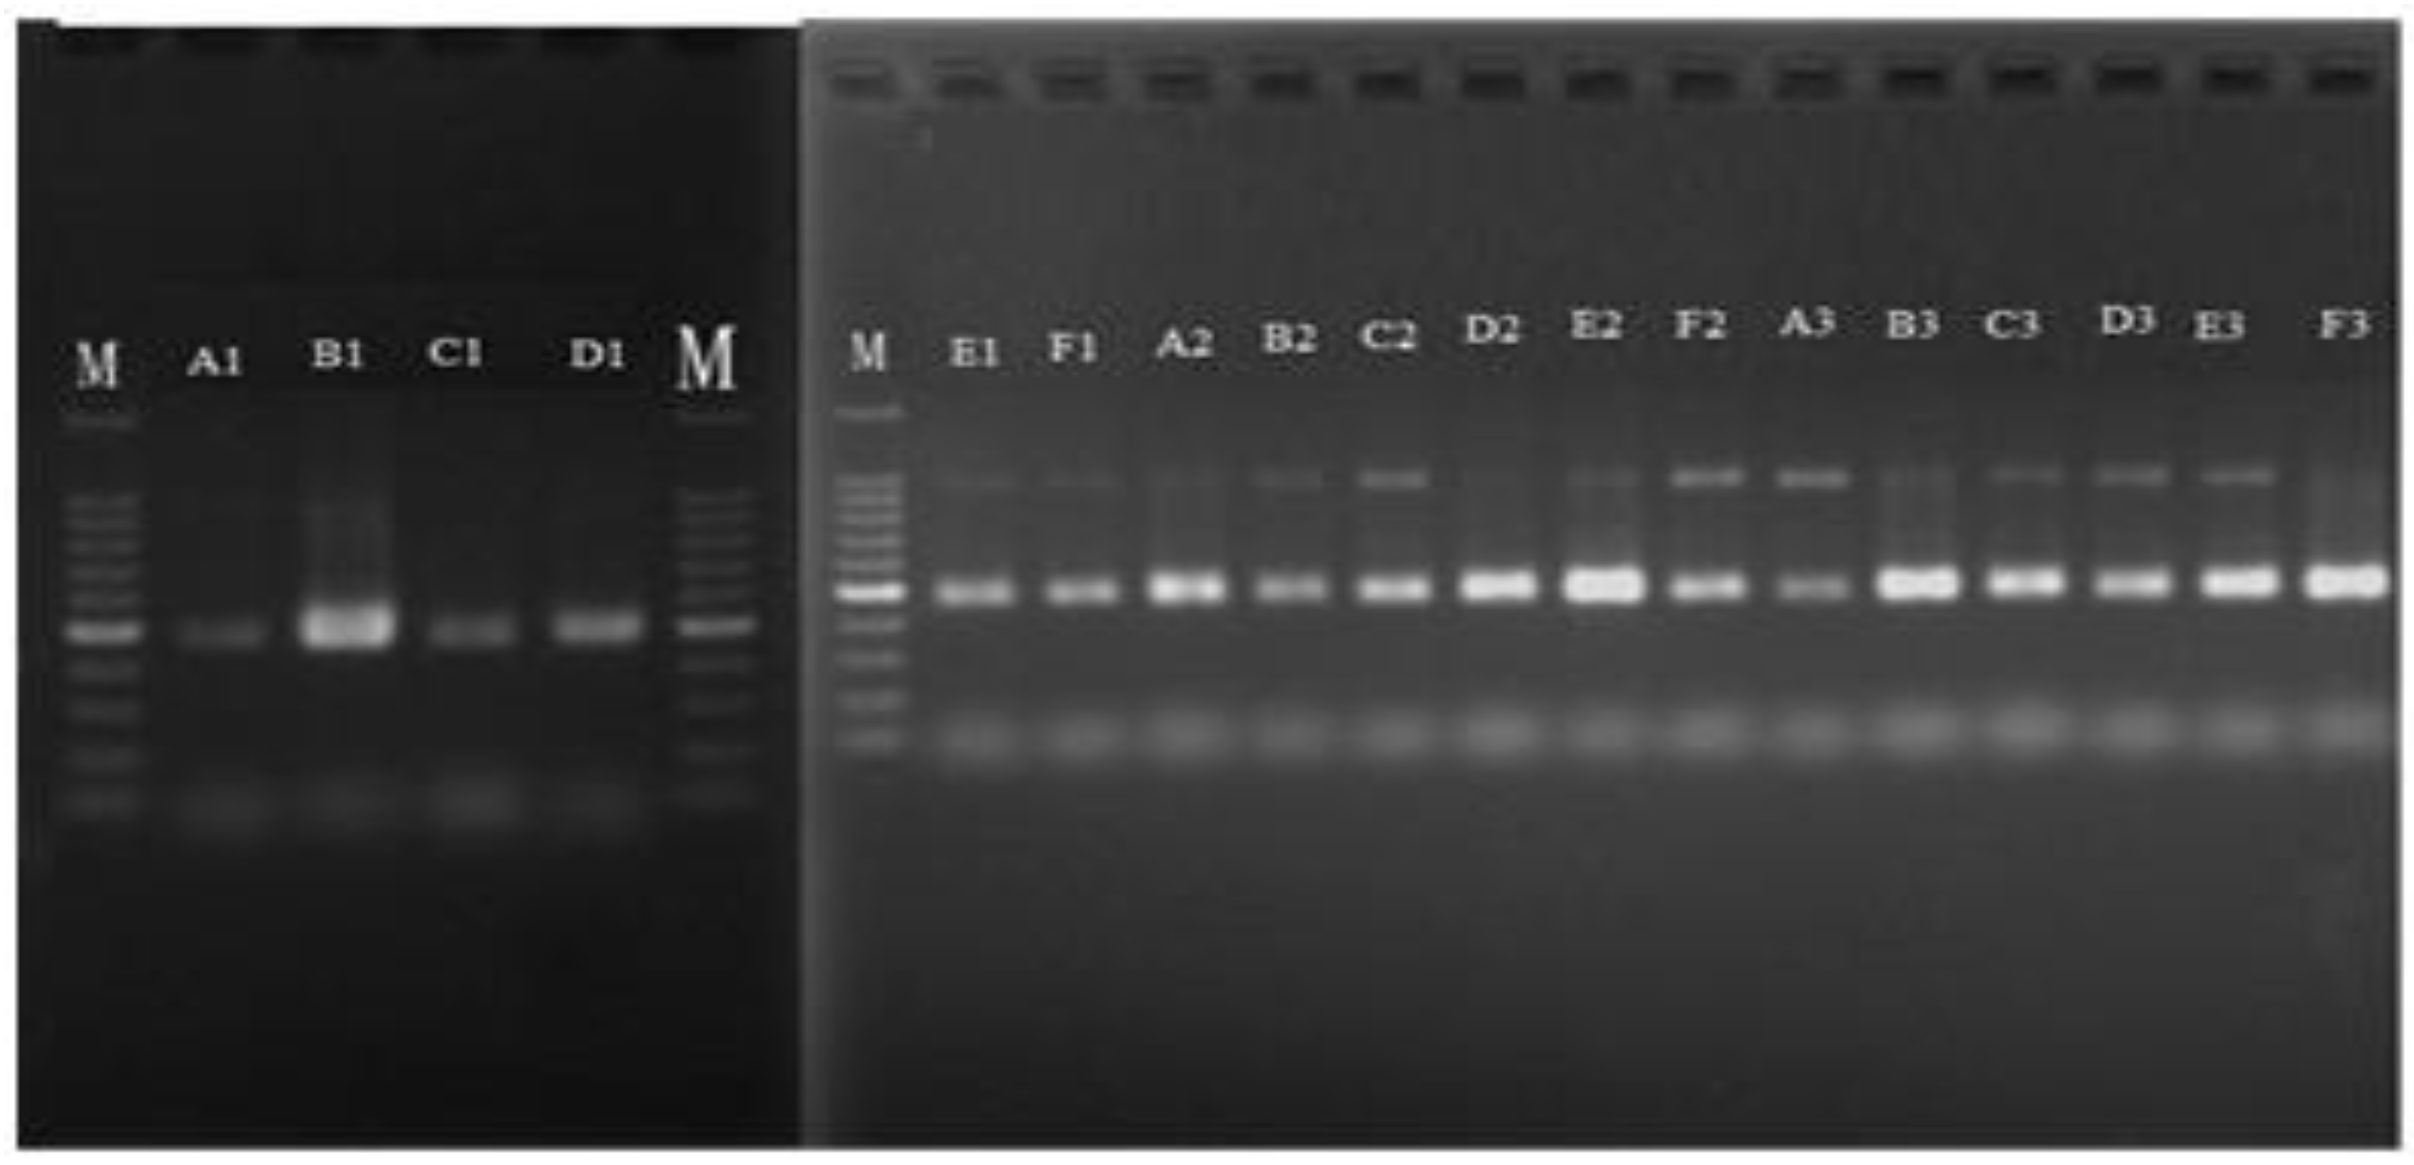
3.1. Extraction and Quantitative Detection of Total DNA from Samples

The total DNA and DNA concentration of isolates extracted from the 18 samples were detected by agarose gel electrophoresis, as shown in Figure 1. The results showed that the DNA bands were clear and complete, which met the requirements of the follow-up test.

3.2. Processing of Sequence Information

A total of 11,816,388 pairs of reads were obtained after sequencing of 18 C. camphora leaf samples. A total of 10,844,124 reads were generated after splicing and filtering of double-ended reads. At least 386,289 reads were generated from each sample, and 602,451 clean tags were generated on average. The lowest sequencing quantity was found in the C. camphora leaf samples A3, F3, and C3, and the highest in D3. The average length of the sequence ranged from 435 bp to 445 bp (Table 2), so the sequence length of this experiment could cover the full length of V3f/V4r region.

3.3. Alpha Diversity of Bacterial Communities in Cinnamomum camphora Leaves

The OTU coverage estimator values ranged from 99.9% to 100% (Table 3), indicating that the sequence numbers per sample were high enough to capture the majority of the 16S rRNA gene sequences to show bacterial diversity. The alpha diversity parameters of the samples are displayed in Table 3. The highest richness value was in the A1 (1086), while the lowest was in C2 (509). However, the highest Shannon index value was in B3 (5.3337), while the C3 sample showed the lowest (3.6222). It was observed that E3 had the highest Chao1 (1233.1), and A3 had the highest ACE (1764.7163), while the C2 sample had the lowest Chao1 (602.84), and F1 had the lowest ACE (617.7194), respectively. The Simpson indices of diversity parameters varied from 0.1655 in C3 samples to 0.0242 in F2 samples.

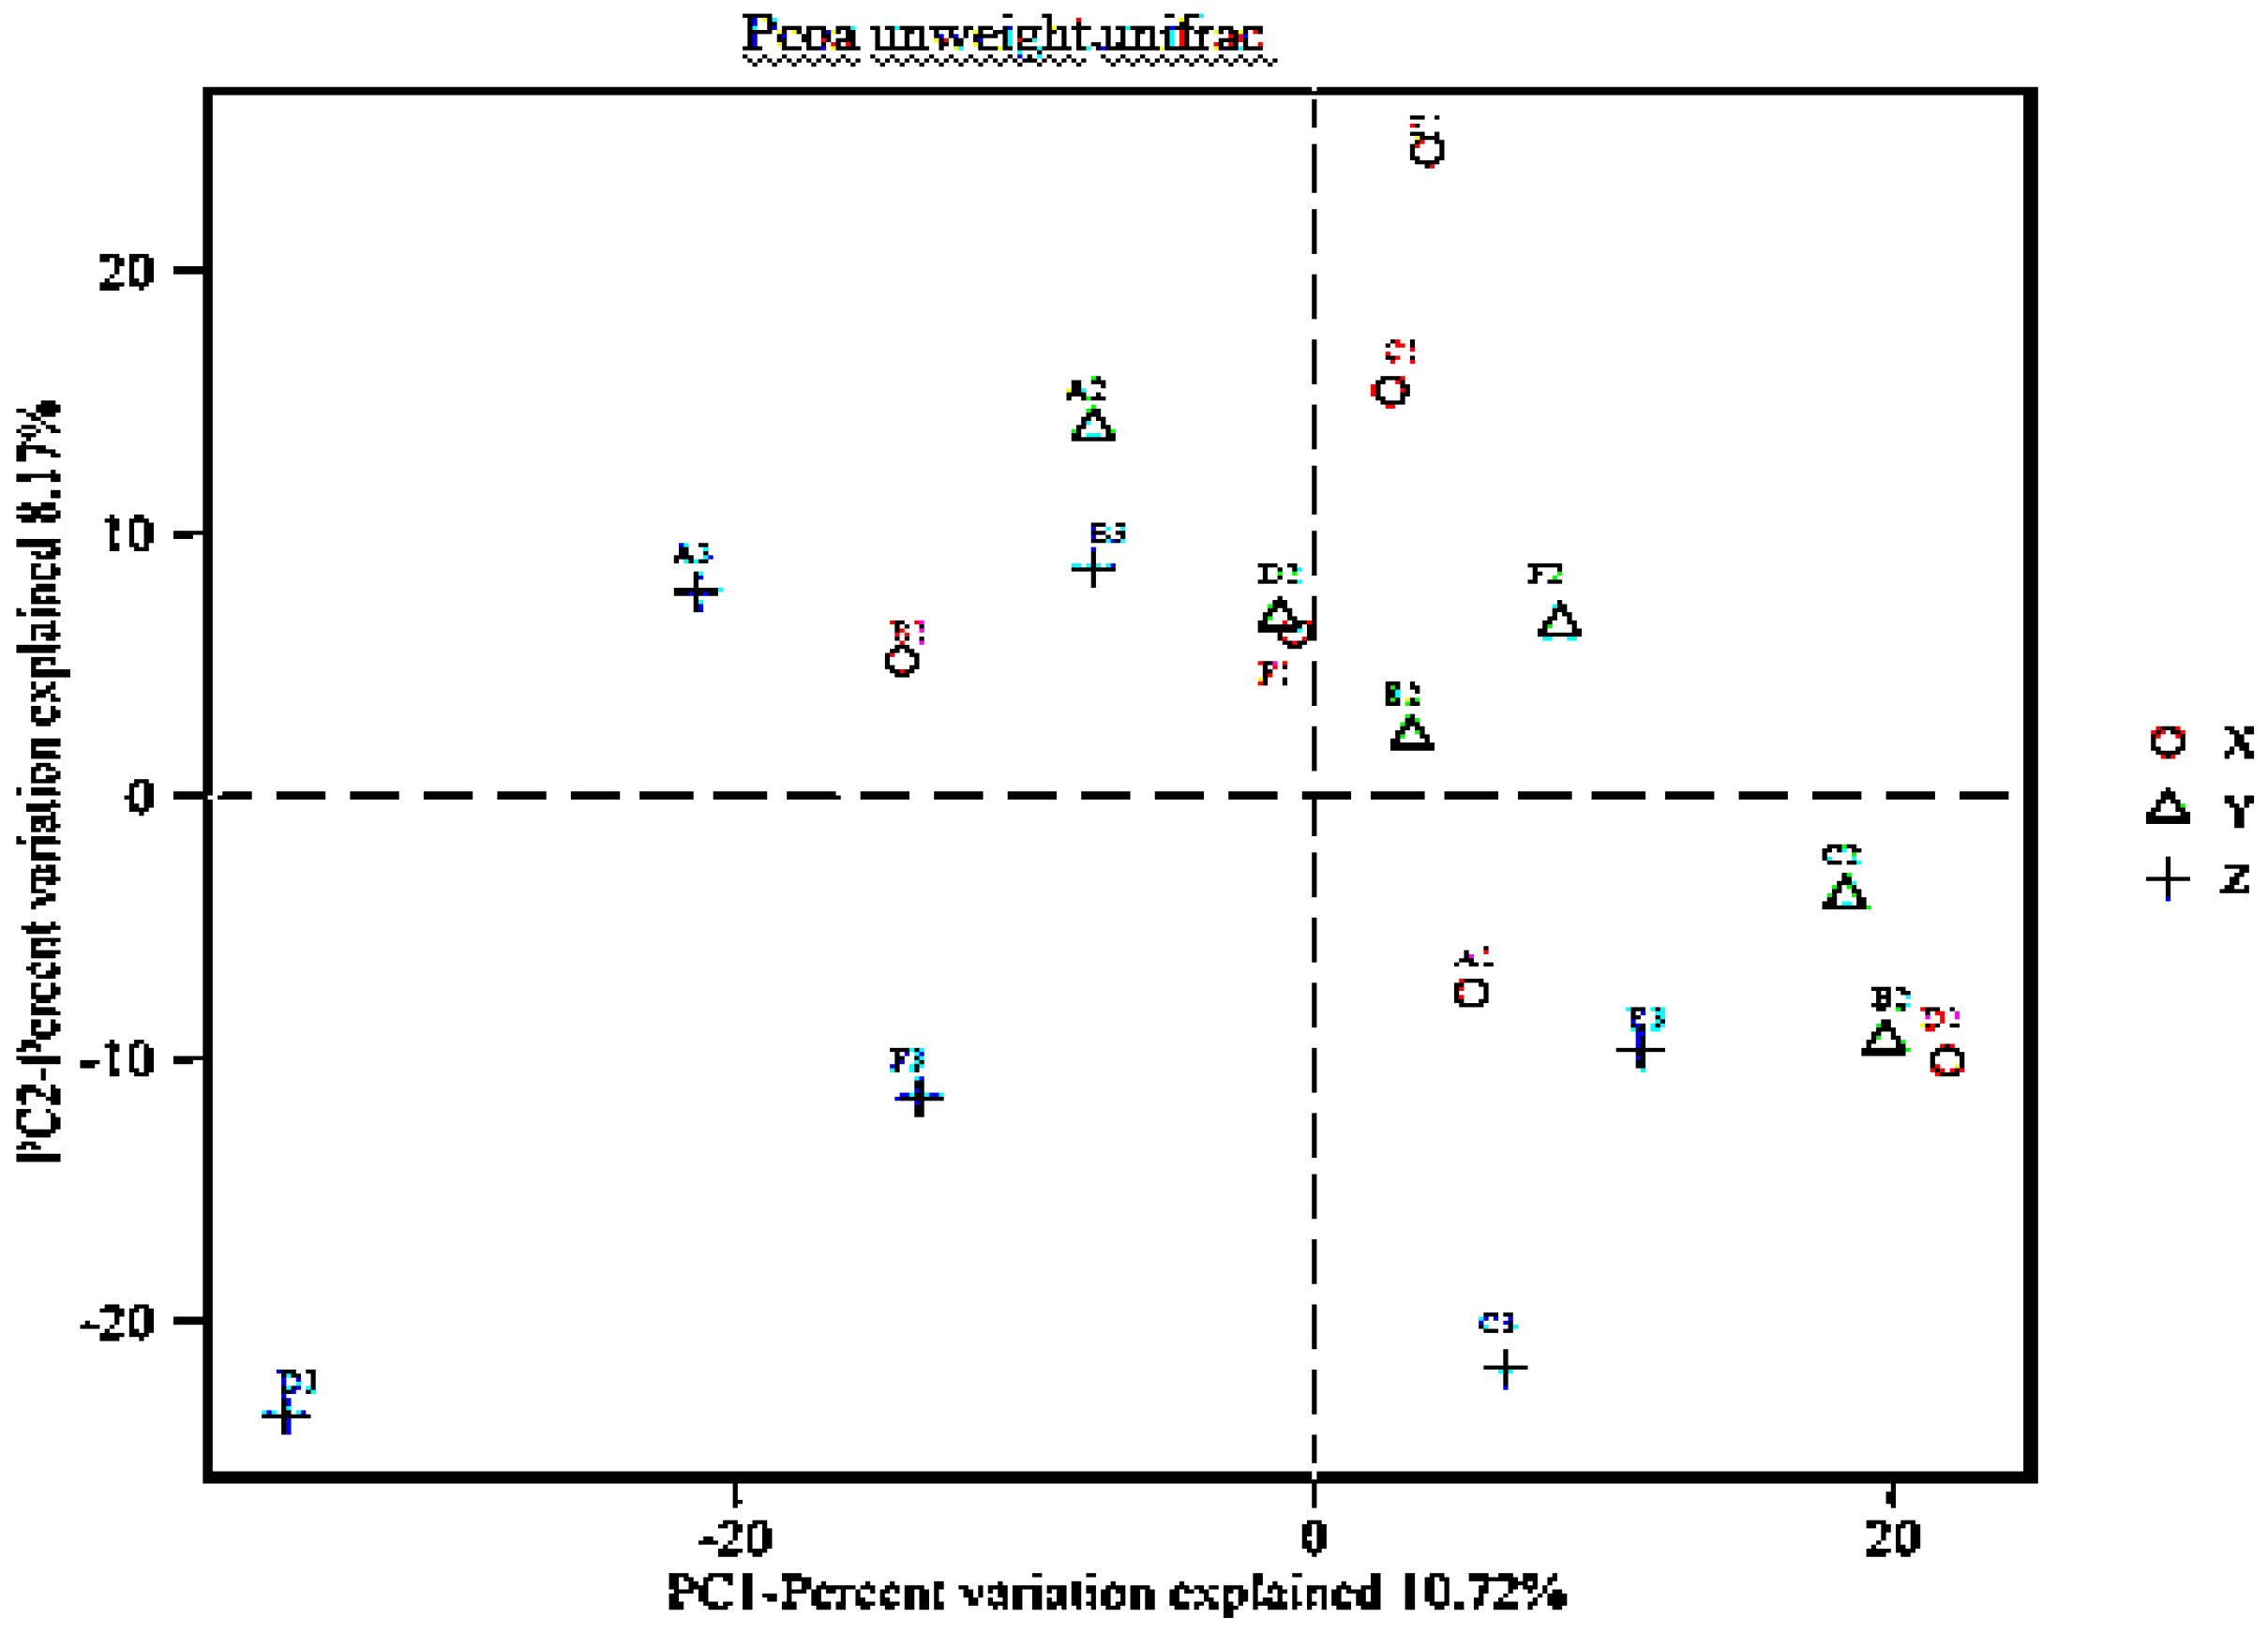
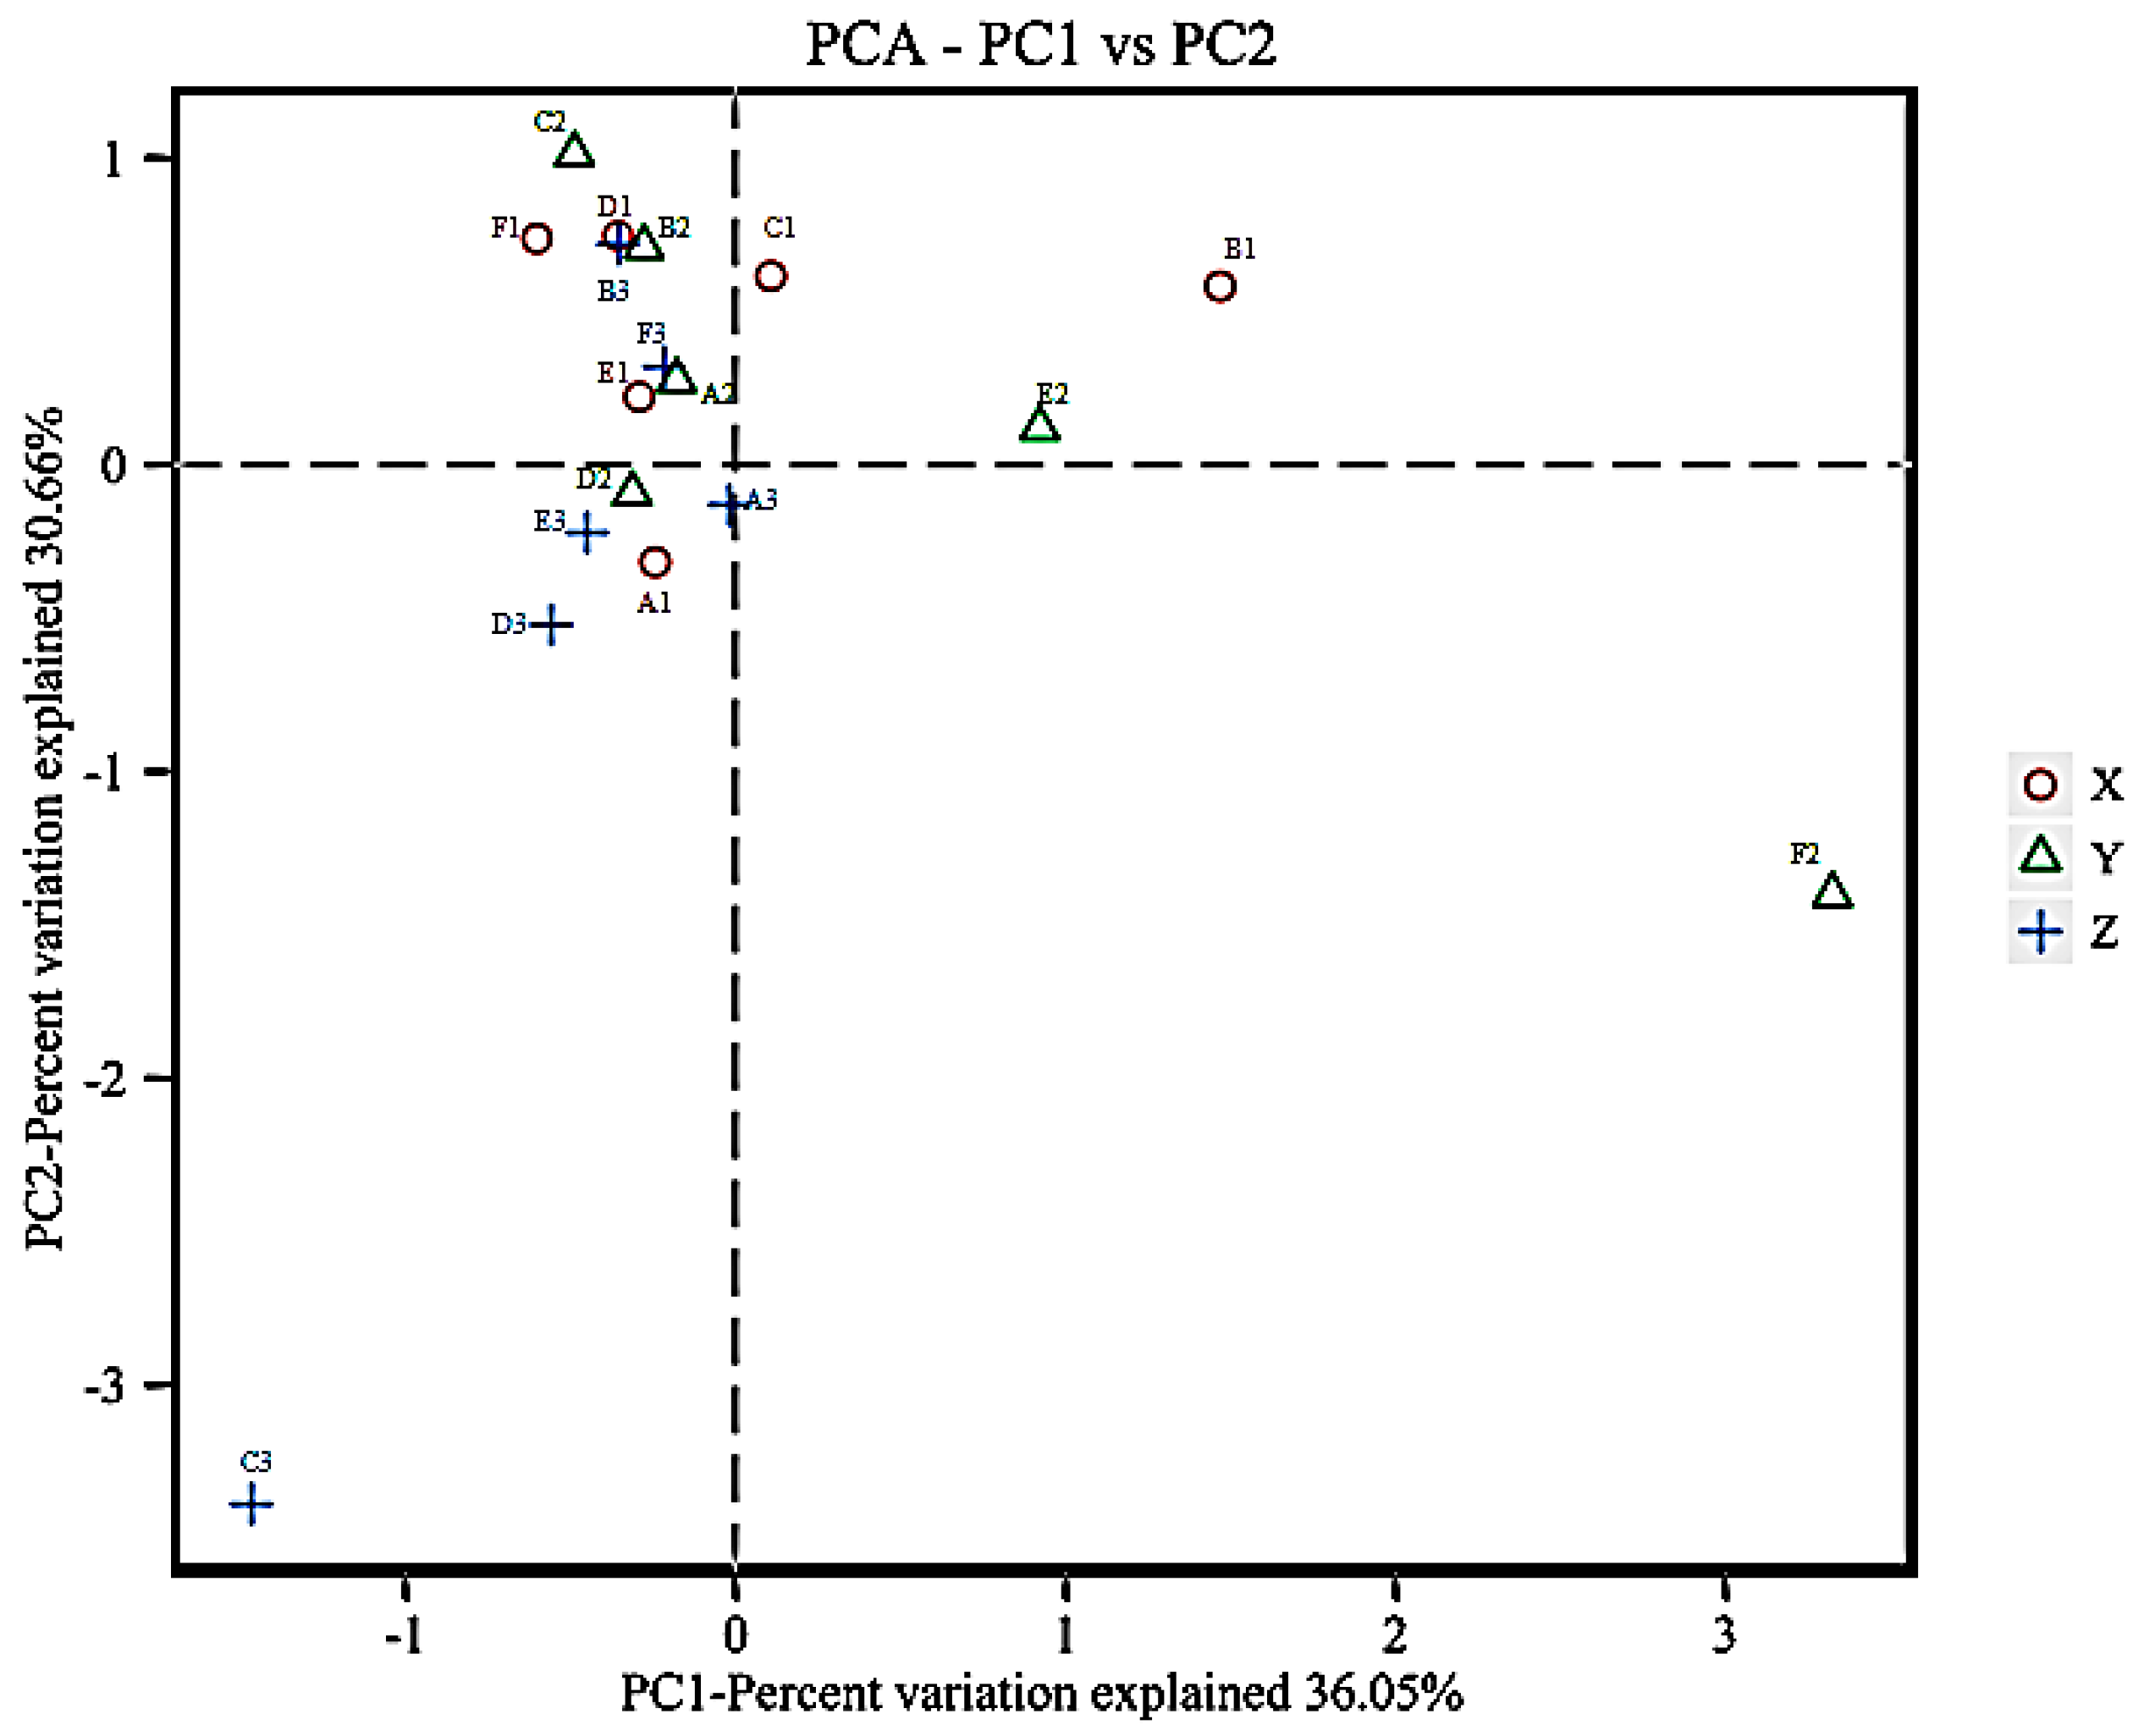
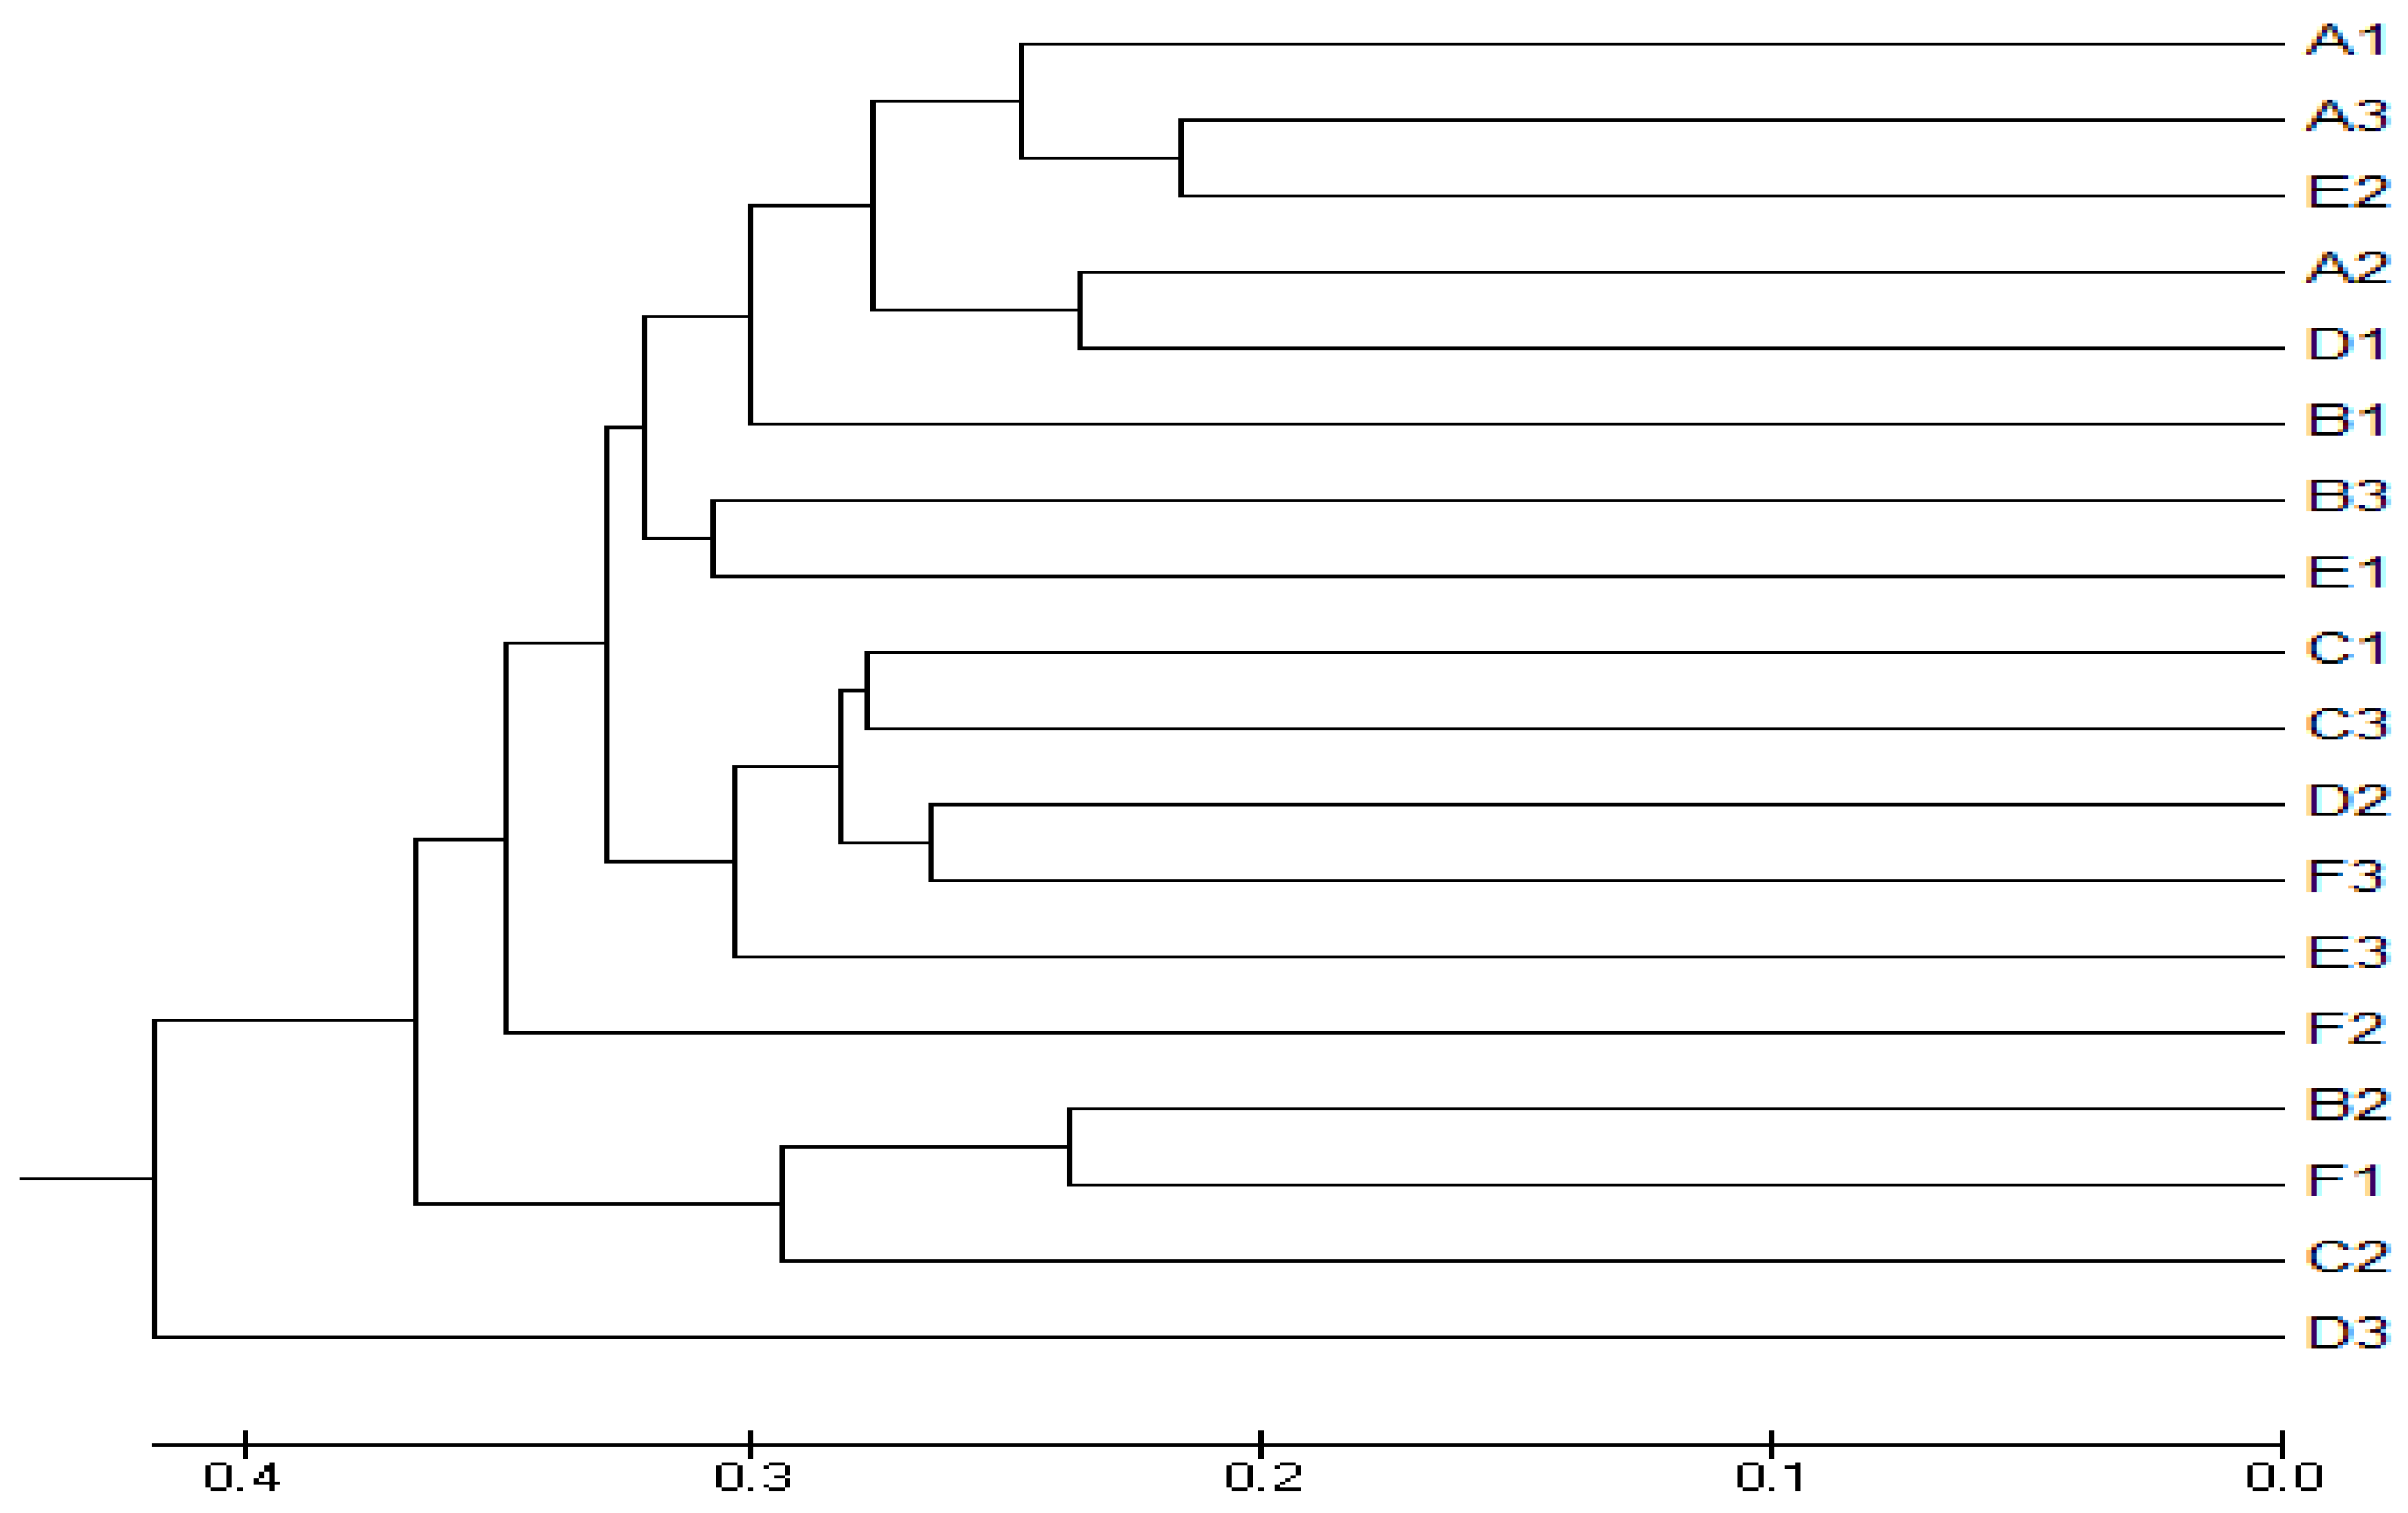
3.4. Beta Diversity Analysis

The principal coordinate analysis (PCoA) and the unweighted pair-group method with arithmetic (UPGMA) were performed to view and compare the relationships of the endophytic bacterial communities among the samples. The results of the PCoA according to the unweighted Unifrac distance showed that all the samples did not have a specific cluster pattern although samples D2, F1, and B2, D1 were clustered in the months of April and July, respectively as shown in PC1 (10.72%) and PC2 (8.17%), (Figure 2).
The results of various principal component analyses (PCA) are shown in Figure 3. Principal component 1 and principal component 2 respectively explained 36.05% and 30.66% of the variance of variables, and the cumulative contribution rate was up to 83.7%. A1, A2, and A3 were close to each other. The results obtained showed that there was no observed difference in the community structure of endophytic bacteria among the (A, B, C, D, and E) samples of C. camphora in the Nanping area in spring, summer, and winter although the richness varied. The results showed that the differences of the endophytic bacterial community structure between the Nanping samples were minimal. Also, the community structure of F3 samples in the Fuqin area had little difference in the three seasons. The seasonal differences between the F1 samples and the F2 samples were low in the Fuqin area, while the seasonal differences between the Nanping and Fuqin samples in the two areas were observed in the three seasons in terms of richness.

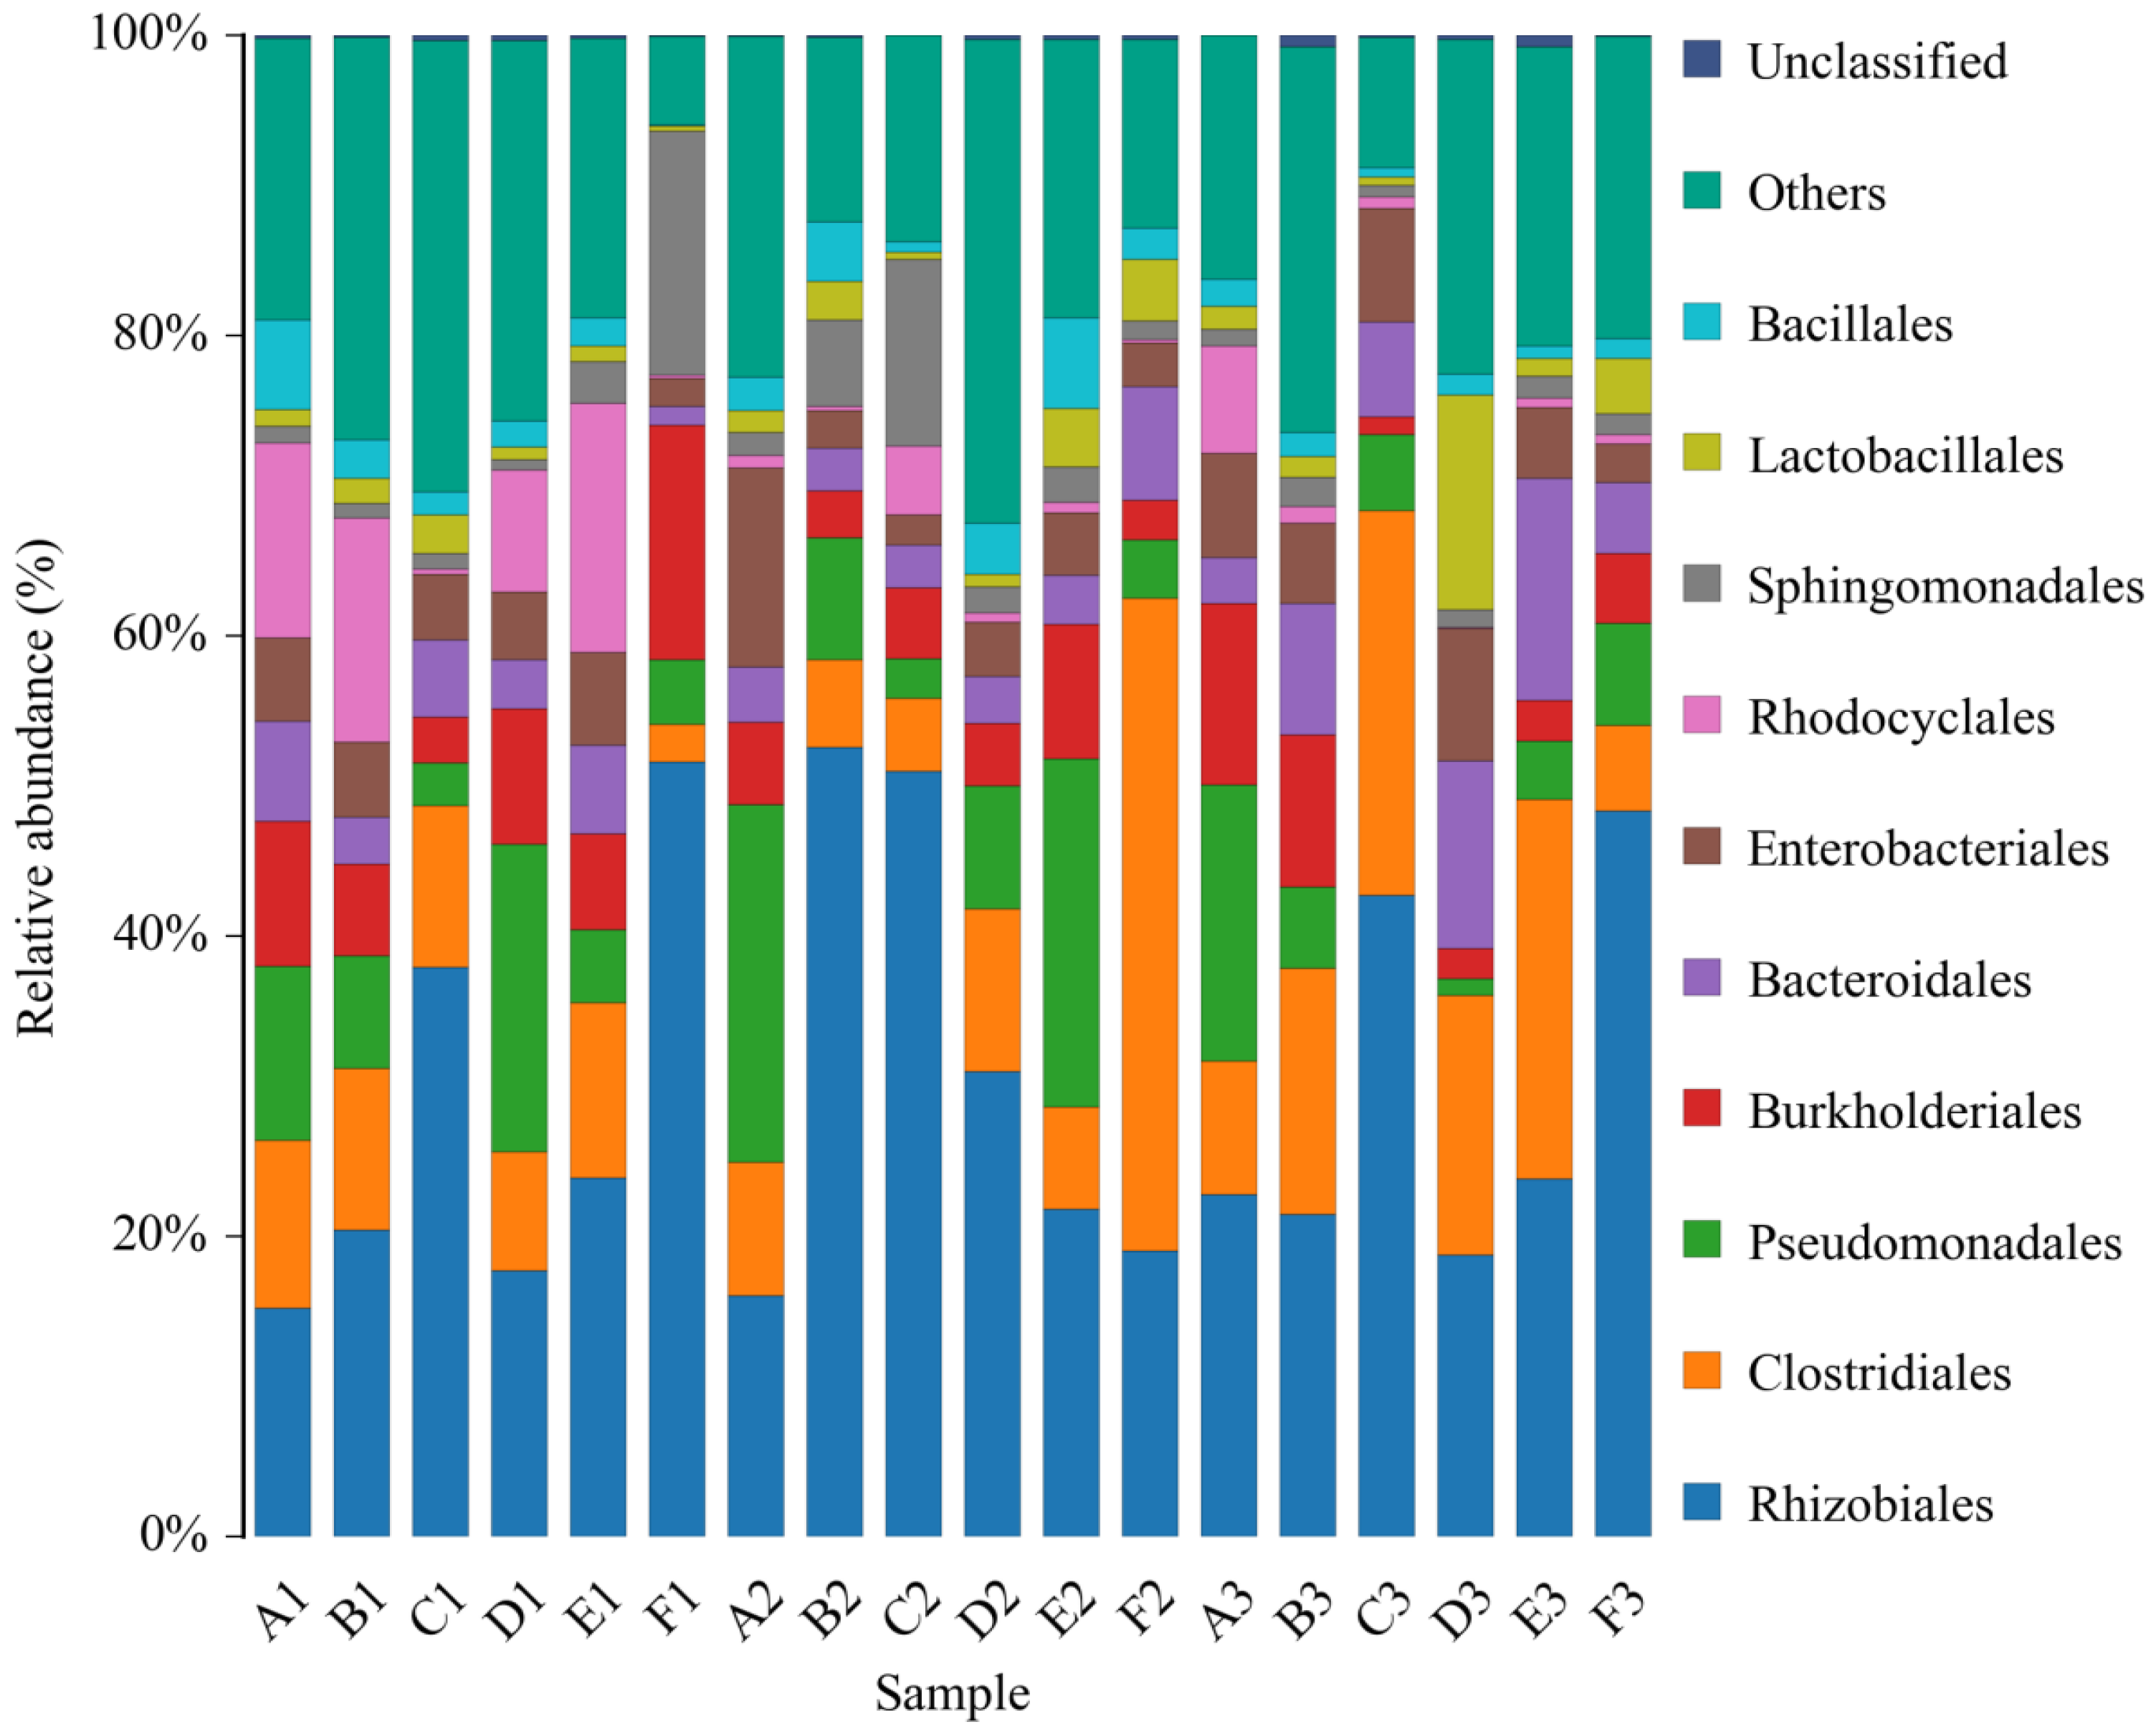
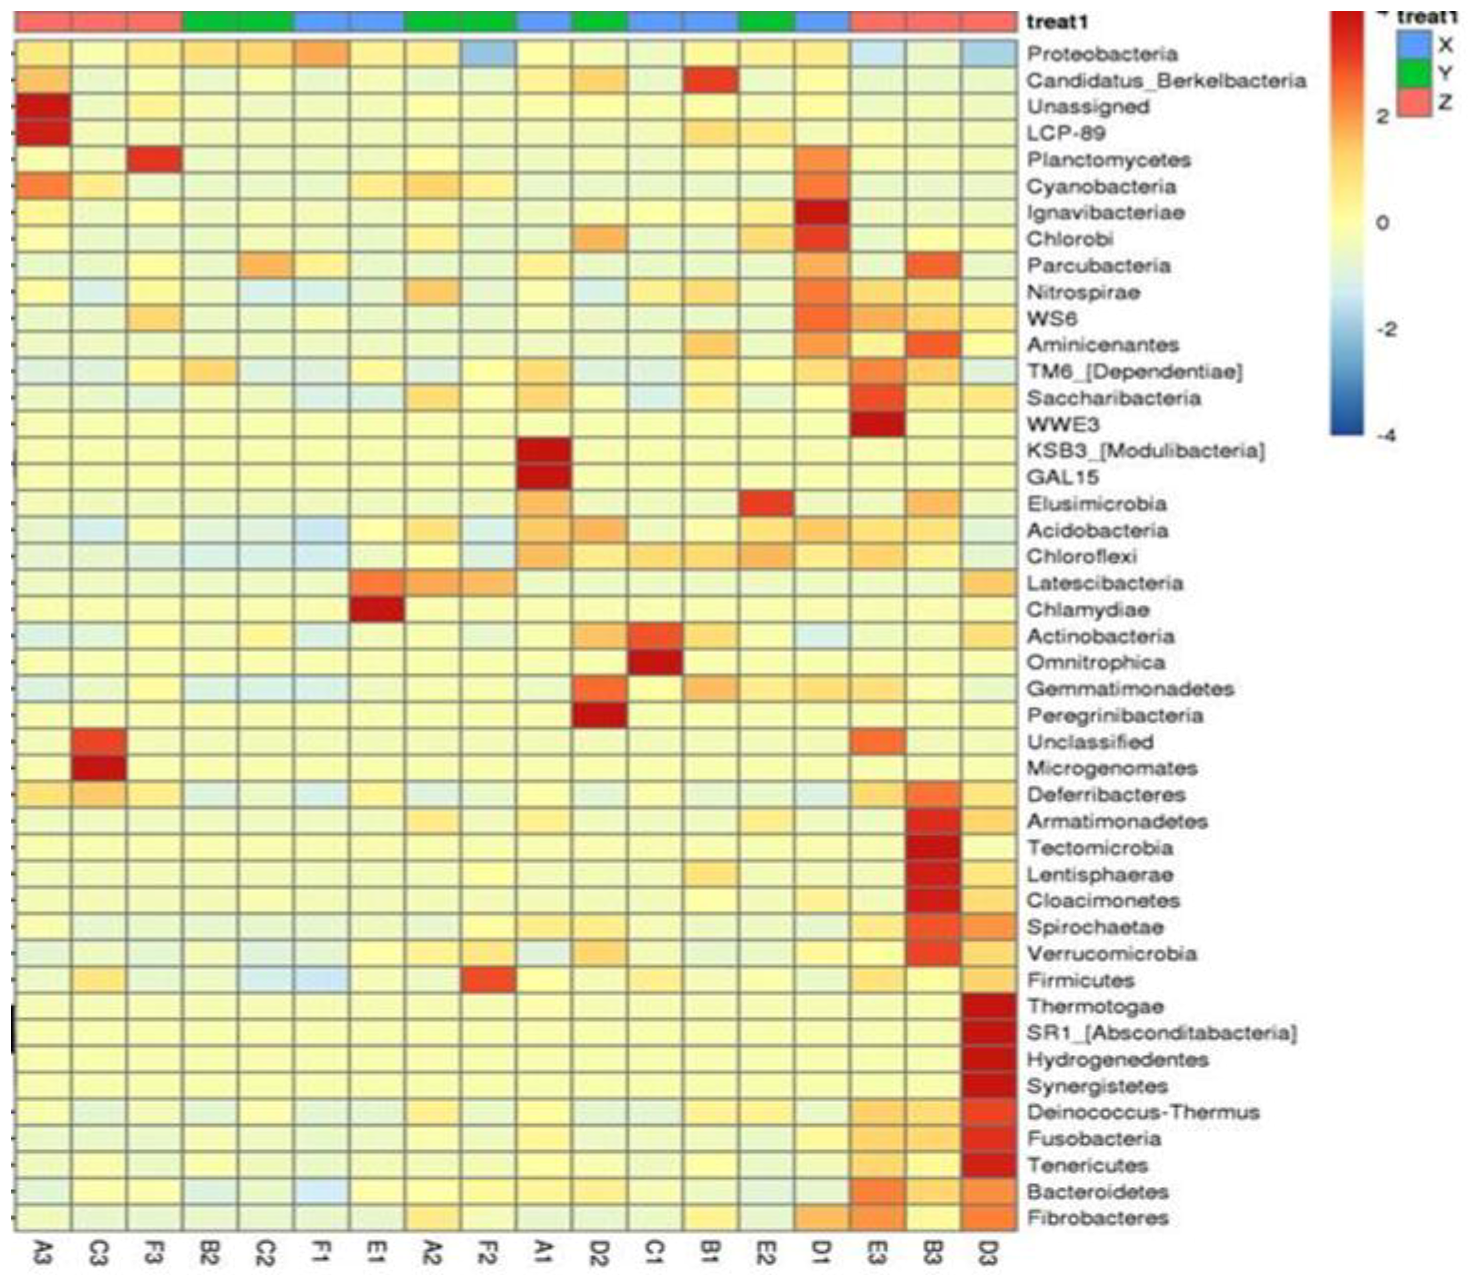
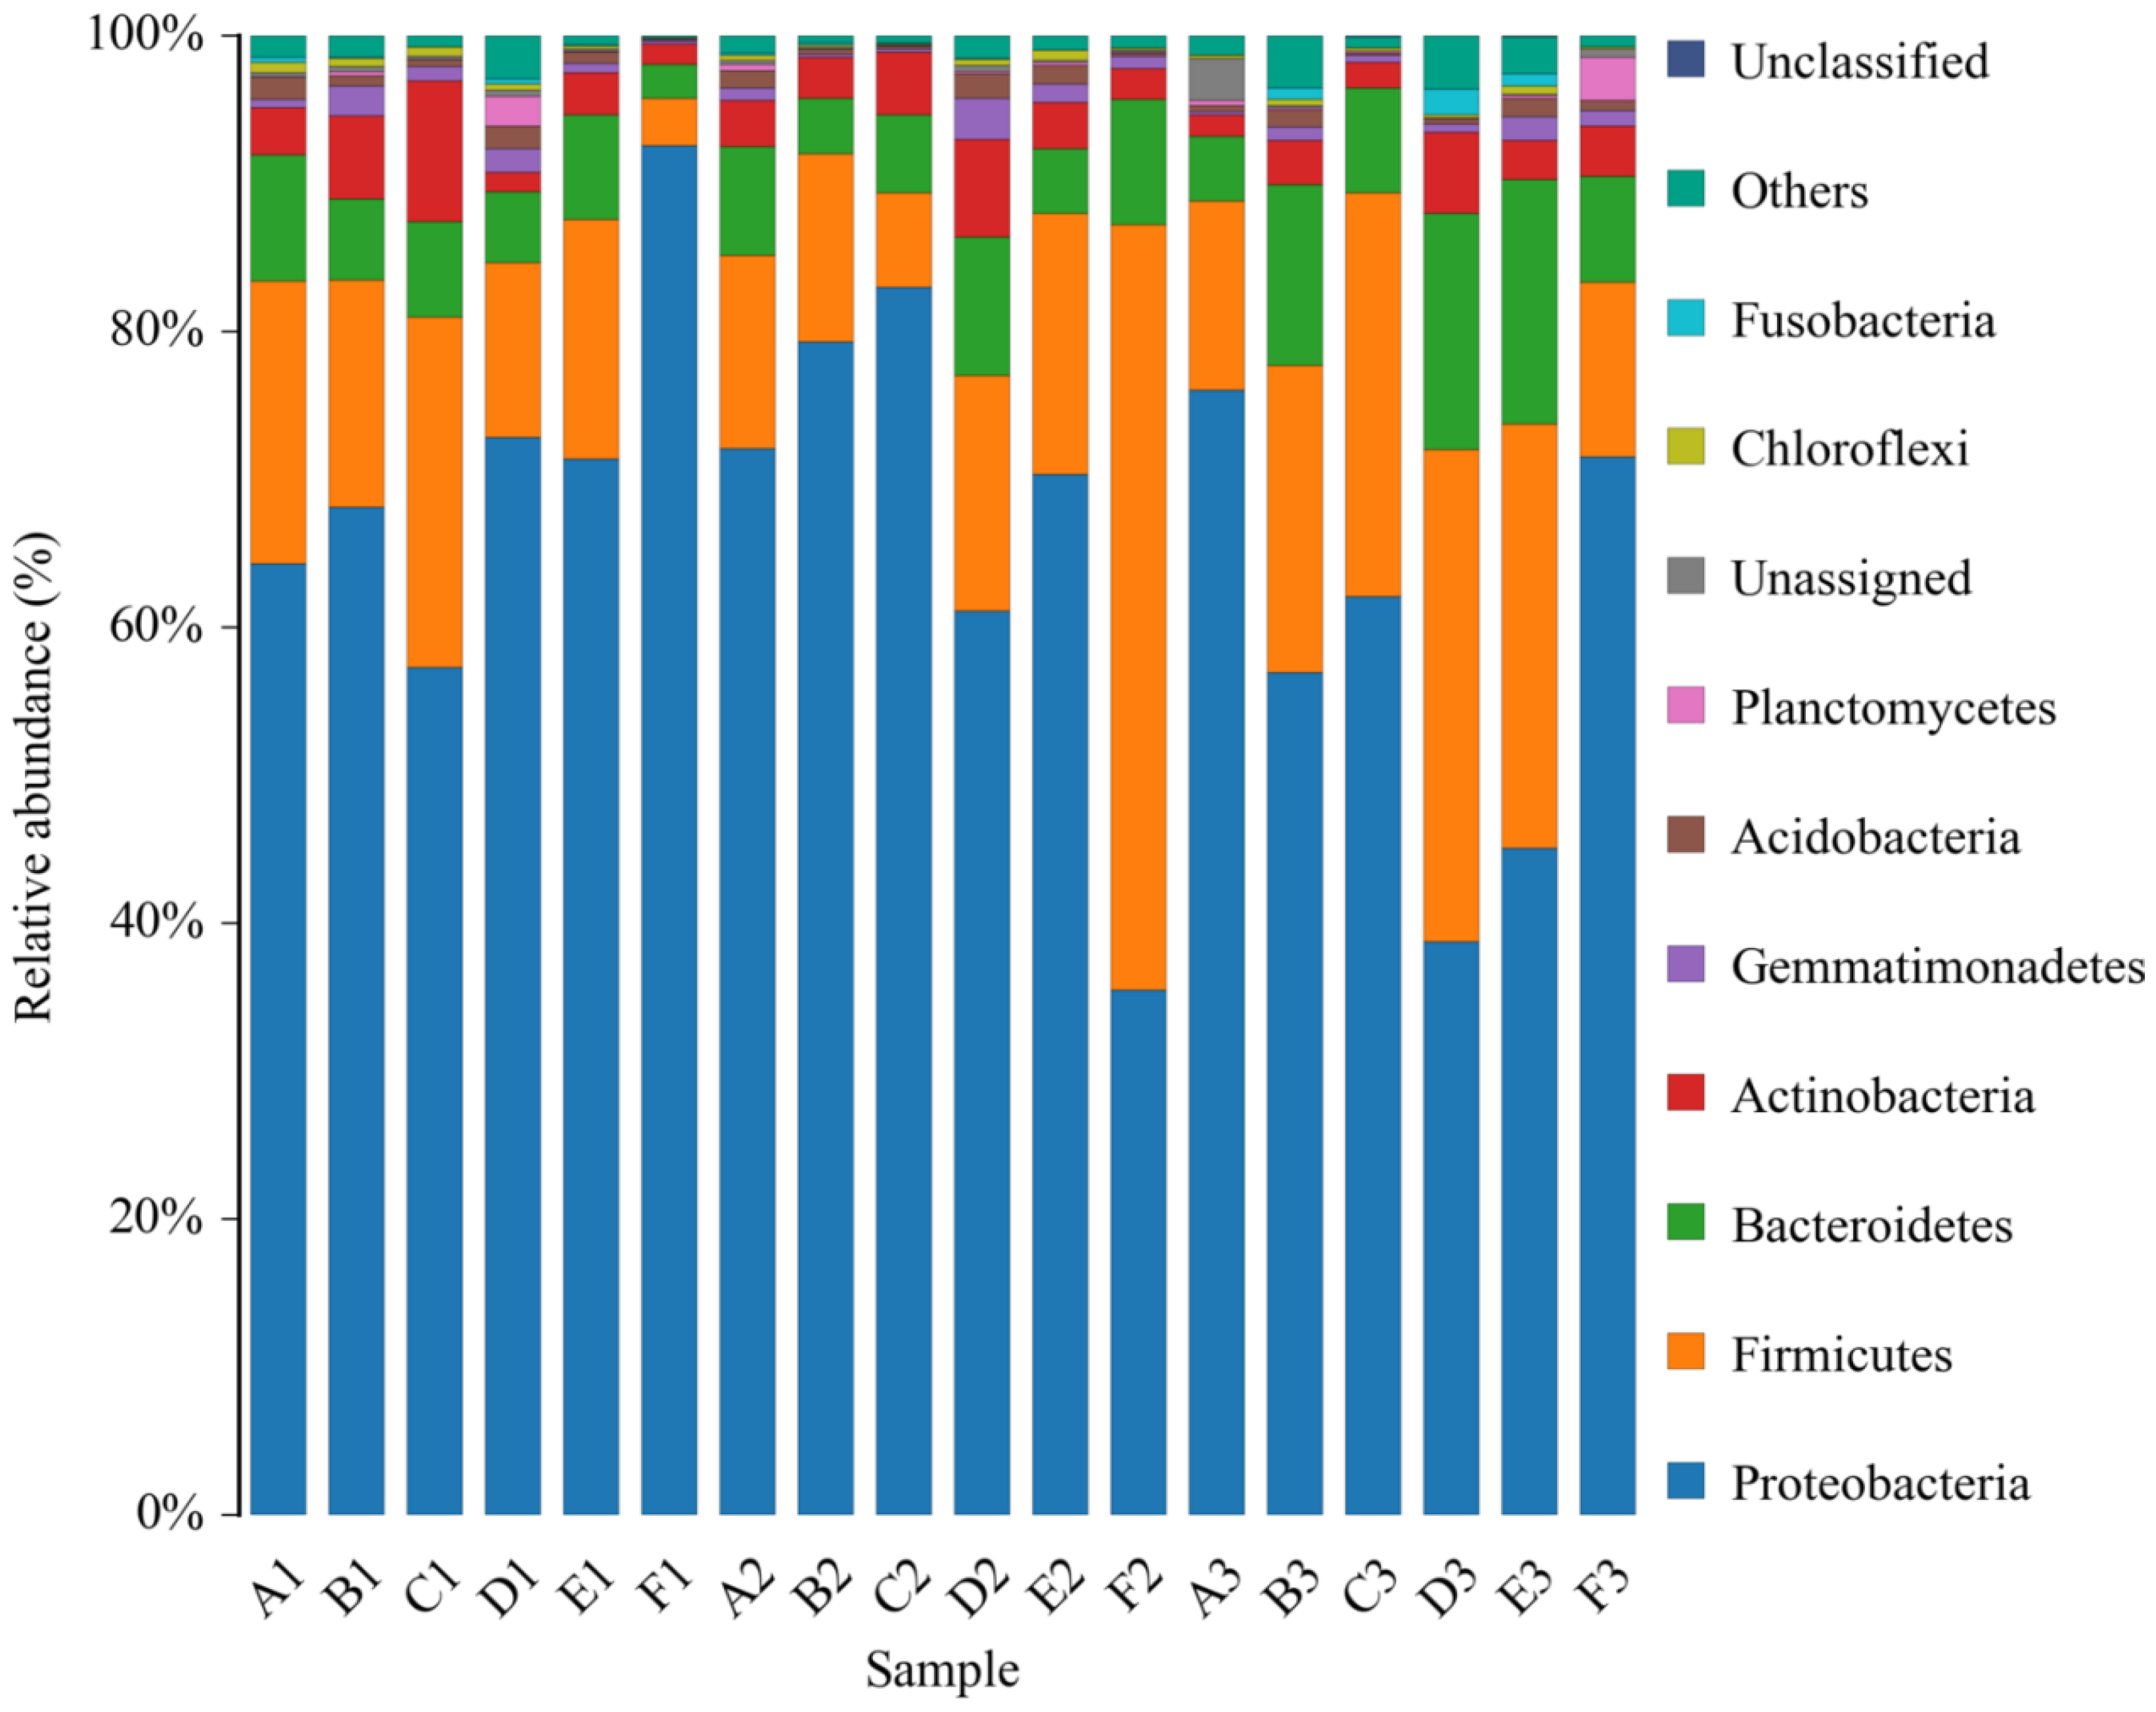
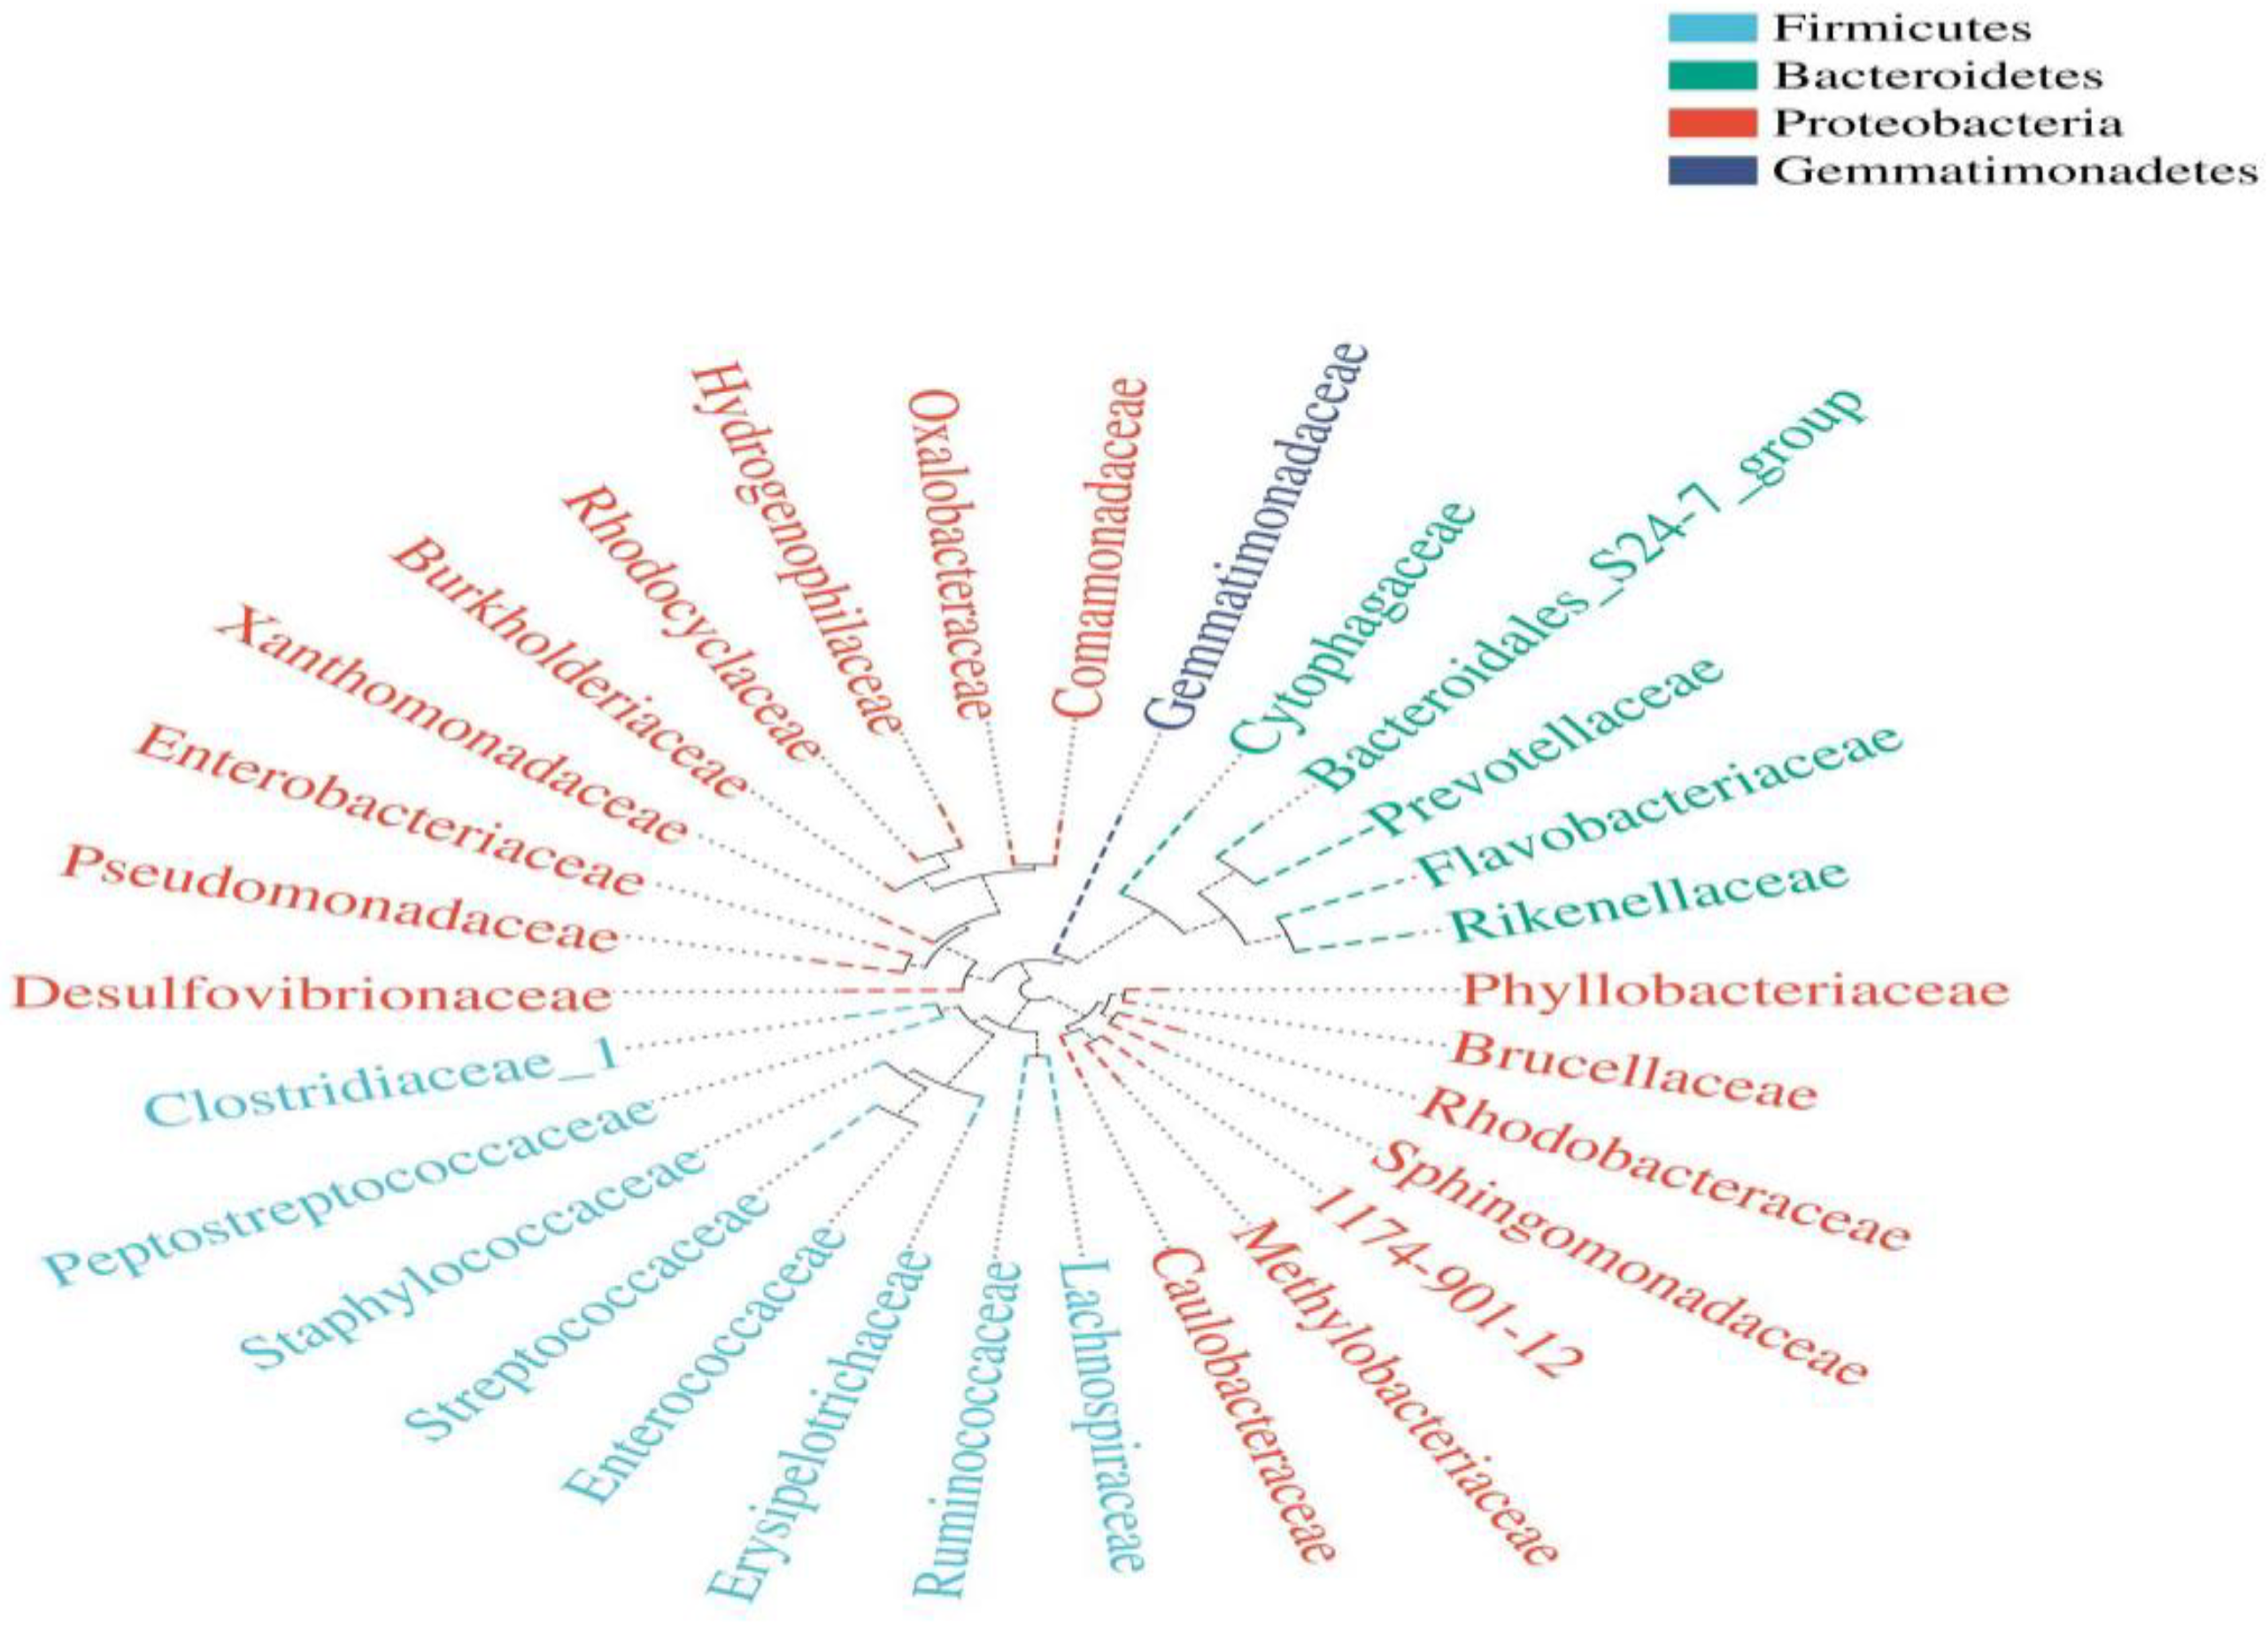
Composition of the Structural Diversity of Bacteria

The distribution of the bacterial population is shown in Figure 4 and Figure 5. The results revealed that the endophytic bacteria of C. camphora were mainly composed of nine phyla (Figure 5): Proteobacteria, Firmicutes, Bacteroidetes, Actinobacteria, Gemmatimonadetes, Acidobacteria, Planctomycetes, Chloroflexi, and Fusobacteria. The bacterial populations from the samples from Nanping and Fuqin were enumerated in Figure 6. Proteobacteria was dominant among the observed sequences at the phylum level. Proteobacteria was present in each sample and accounted for the highest proportion, ranging from 35.15% in sample F2 to 91.5% in sample F1. In addition, Firmicutes was the second most abundant phylum, and the most represented in the F2 samples (49.56%). This was followed by Bacteroides in abundance.
The classification of the unigenes using the RDP classifier indicated that the sequences were classified into 10 orders (Figure 4): Rhizobiales, Clostridiales, Peseudomonadales, Burkholderiales, Bacteroidales, Enterobacteriales, Rhodocyclales, Sphingomonadales, Lactobacillales, and Bacillales. There were still sequences that were not identified in the present classification, indicating that there were likely some unknown new taxonomic groups in the leaves of C. camphora as shown in Figure 5.
At the order level, Rhizobiales dominated in the B2 samples (52.69%) and were the least in A1 (17.5%). It was followed by Clostridiales with the highest value in F2 (41.5%) and the lowest in F1 (4.32%). However, there were some unidentified sequences which existed in all samples with the unclassified sequences found dominantly in B3 and E3 (Figure 5).
A dendrogram of the structural similarity among the endophytic communities of the 18 C. camphora samples studied in the three different seasons (1, April; 2, July; 3, October) is shown on Figure 6.
The cluster analysis showed that the samples were divided into two groups with 41.75% similarity. The first group included six subgroups with the following percentage similarities: 21.6% (A3 and E2), 23.6% (A2 and D1), 23.8% (B2 and F1), 26.5% (D2 and F3), 27.8% (C1 and C3), and 30.8% (B3 and E1). As observed, the difference in seasons and plant species did not affect the similarity of endophytic communities in the leaves, except in C1 and C3 where there was similarity in the species between April (spring) and October (early winter) The second group was composed of D3 alone, suggesting its unique endophytic composition in early winter (October). As compared to other samples, it was observed in Figure 5 that D3 had the highest proportion of Lactobacillales, as well as a proportion of other phyla not listed among the 10 major orders (Figure 4).
Heat map analysis of the relative abundances and distribution of bacterial endophytes phyla showed variations across the samples (Figure 7). In this study, the OTU distribution and abundance of each sample were shown on the heatmap which revealed 43 phyla, and further reflected the similarity and difference in the colony structure of each phylum on the genus level. The heatmap showed that most of the bacteria of C. camphora were distributed in D3, B3, and E3 samples in October in the Nanping region. The samples from this region had the highest number of phyla (14–26).
From the results of the QIIME (Quantitative Insights Into Microbial Ecology) analysis, individual branches in the evolutionary tree (Figure 8) represent a species, the length of which is the evolutionary distance between two species, that is, the degree of variation in species. Species on the same branch show evolutionary affinity.

4. Discussion

The endophytic bacterial community structures associated with the leaves of the C. camphora in different seasons were described and compared. This could provide baseline information for future investigations toward developing a better understanding of the role of these microbial communities in producing several plant metabolites in the plant such as camphor and essential oils the plant is known for.
At present, many researchers have studied endophytic bacteria in many plants, such as eggplant, ryegrass, and sugarcane plants [25,26,27]. More than 129 species of culturable endophytic bacteria have been found in various crops and cash crops, belonging to 54 genera distributed in all plant tissues [28]. The results from this study confirmed that C. camphora has a rich endophytic bacterial group, belonging to nine phyla and 10 orders, reflecting its rich diversity and laying a foundation for the subsequent isolation of endophytic bacteria. Our observations showed that samples taken in October had the highest diversity of endophytes as indicated by the Shannon index, ACE, and the Simpson indices of diversity irrespective of the samples. The most dominant phylum in all the samples was observed to be Proteobacteria, followed by Firmicutes, Bacteroides, and Actinobacteria. This result was in agreement with previous studies where these phyla were observed in different environments [29,30]. More so, these results agree with those obtained by Deng et al., 2019 [31], who detected that Proteobacteria was the dominant bacterial phylum within Pennisetum sinense in China. It has been reported that the composition of bacterial endophytes varies between the different parts of the plant [32] with a variation in the relative abundances among phyla and genera [33]. Reports have also shown that members of these phyla were the most abundant in the endophytic communities of the wildflower (Crocus albiflorus) [34], the radish leaf [35], Arabidopsis, and Citrus leaves [24,36], a xerophilous moss (Grimmia montana) [37], and olive oil leaf [38]. However, there were unidentified sequences which indicated the presence of other new taxa with a possible high taxonomic status in the leaves of the C. camphora.
Contrary to the order of bacterial endophytes observed in this study, Dong et al. [39] observed relative abundances of bacterial endophytes, such Conexibacter, Gemmatimonas, Holophaga, Luteolibacter, Methylophilus, Prosthecobacter, Solirubrobacter, Bradyrhizobium, Novosphingobium, Phenylobacterium, Sphingobium, and Steroidobacter, in the above-ground parts of Panaxnoto ginseng. This showed that the diversity of endophytes varies, depending on the plant species. The different bacterial community composition of C. camphora could be due to the selective pressure that the plant exerts on their associated bacterial population [40]. Endophytic bacteria of plant colonize specific ecological niches even in tissues, which might be the reason for the diversity observed within the bacterial community.
As observed in this study, diversity in endophytic bacteria in the different samples, seasons, and locations studied was observed. Similarly, the similarity indices ranged between 21.6% and 41.75% in all parameters studied indicating the diversity of the populations. However, the abundance/richness of these organisms showed a higher variation across the parameters evaluated. Previous reports have shown that endophytic populations vary from plant to plant and from species to species [41]. Within the same species, it not only varies from region to region but also differs with the change in climatic conditions of the same region [42]. A previous report has shown that the endophytic population and frequency differed among sampling dates for all the organs studied, namely, young leaves, petiole, and twigs of Gingko biloba L [42]. They proved that the occurrence of Phyllosticta sp. in both leaves and petioles was first detected in August and peaked in October, while was absent in May. Phomopsis sp. was detected in twigs throughout the growing season. This was contrary to our observations where the abundance of endophytes varied with samples, location, and sampling dates in the order April > July > October. These variations could be attributed to the abundance of certain metabolites in the plants in different seasons. Berg et al. [43] stated that plant species, cultivar, age, health, and developmental stage were not the only factors that impacted plant microbial communities, but factors external to the host plant, such as soil, geographic factors, and human interference also contributed to the overall plant endophytic microbial structure and function [44]. Our results showed that sampling period had a great influence on the diversity and abundance of endophytes in host plants. However, the abundance of these organisms was mostly altered rather than their diversity.
The dominant taxa present seemed to be fairly representative of the plant growth promoter in the most represented phyla Proteobacteria and Firmicutes. These microbes are adapted to environmental variations as their cycle can survive between wet and dry seasons. Although variation in endophytic diversity and abundance was observed in the samples evaluated, similarity was noticed in the same season among the samples. However, the individual factors of each sample were important to influence the diversity of the endophytic bacteria in them. According to the results of the analysis, it was observed that the community structure of endophytic bacteria among the samples. The PCoA and UPGMA analyses evidently demonstrated that the bacterial diversity was different among the six samples as shown on the heat map. Similarly to our results, previous researchers have demonstrated that both abiotic and biotic conditions (e.g., genotypes of host plants) might affect the diversity and composition of various species of endophytic bacteria [45,46,47,48].
The interaction between plants and microorganisms is one of the main focuses of applied research on plant microorganisms. By studying the interaction between plants and endophytes, the biological effects of endophytes can be understood, and the beneficial effects of bacteria can be utilized. In order to promote plant growth and increase the content of plant secondary products, the microbial growth-promoting mechanisms should be brought into play. In this study, sampling and analysis of C. camphora leaves in different seasons confirmed the rich diversity of endophytic bacteria in C. camphora, which laid a foundation for later screening data, comprehensive utilization of beneficial bacteria, and improvement of C. camphora yield and secondary production content.
In summary, plants have developed expanded tools to screen microbial presence and to control their infection; therefore, only specific endophytes are able to colonize the internal tissues with insignificant damage to the host [49]. Their population densities are highly variable, depending mainly on the microbial species and host genotype, developmental stage, and environment conditions [44]. Mature plant leaf tissues are subjected to temperature, humidity, and UV radiation fluctuations. It can be predicted that these factors acted as a selective and variable component to the carbohydrate-rich leaf niche for the formation of adapted bacterial endophytic communities [50]. Hence, the leaf dwelling microbial community should be able to adjust to these physiological changes as C. camphora evolves in its life cycle.

5. Conclusions

An investigation into the diversity of bacteria in the leaves of C. camphora was conducted from samples collected in different seasons in two regions using high-throughput sequencing. Identification of unique sequences using an RDP classifier showed that Proteobacteria was the dominant phylum amongst the nine phyla obtained in the samples collected and was present in each sample, ranging from 35.15% to 89.72% of the bacterial population. A total of 10,844,124 valid sequences were obtained from leaf tissues at the different sampling times, all of which were located in the V3-V4 region of 16S rRNA gene of bacteria. The diversity of the bacterial sample composition observed among the sampling periods, samples, and regions was low, with the highest diversity recorded in October. However, there was variability in the richness of the endophytes across these parameters where the highest abundance was observed in April, followed by July and October, in that order. The results obtained showed that these sequences mainly belonged to 10 orders: Rhizobiales, Clostridiales, Peseudomonadales, Burkholderiales, Bacteroidales, Enterobacteriales, Rhodocyclales, Sphingomonadales, Lactobacillales and Bacillales. However, there was no firm sequence at the order level, indicating that there are other new taxa with high taxonomic status in the leaves of Cinnamomum camphora (L.) Presl.

Author Contributions

Conceptualization, G.-F.Z.; Formal analysis, A.A.H.E.; Funding acquisition, G.-F.Z.; Investigation, A.A.H.E.; Methodology, A.A.H.E.; Project administration, G.-F.Z.; Resources, G.-F.Z.; Supervision, G.-F.Z.; Validation, G.-F.Z.; Visualization, M.M.I.; Writing—original draft, A.A.H.E.; Writing—review & editing, A.A.H.E. and M.M.I.

Funding

Funding was provided by East-West Poverty Alleviation Collaboration Project (230519), Peak Subject Construction Project of Fujian Agricultural and Forestry University (1201802404), and Science and Technology Innovation Project of Fujian Agricultural and Forestry University (KFA17304A).

Conflicts of Interest

The authors declare no conflict of interest.

References

  1. Rosenblueth, M.; Martínez-Romero, E. Bacterial endophytes and their interactions with hosts. Mol. Plant Microbe Interact. 2006, 19, 827–837. [Google Scholar] [CrossRef] [PubMed]
  2. Fesel, P.H.; Zuccaro, A. Dissecting Endophytic Lifestyle Along the Parasitism/Mutualism Continuum in Arabidopsis. Curr. Opin. Microbiol. 2016, 32, 103–112. [Google Scholar] [CrossRef] [PubMed]
  3. Hardoim, P.R.; Van Overbeek, L.S.; Berg, G.; Pirttilä, A.M.; Compant, S.; Campisano, A.; Döring, M.; Sessitsch, A.J.M.; Reviews, M.B. The hidden world within plants: Ecological and evolutionary considerations for defining functioning of microbial endophytes. Microbiol. Mol. Biol. Rev. 2015, 79, 293–320. [Google Scholar] [CrossRef] [PubMed]
  4. Potshangbam, M.; Devi, S.I.; Sahoo, D.; Strobel, G.A. Functional characterization of endophytic fungal community associated with Oryza sativa L. and Zea mays L. Front. Microbiol. 2017, 8, 325. [Google Scholar] [CrossRef] [PubMed]
  5. Santoyo, G.; Moreno-Hagelsieb, G.; del Carmen Orozco-Mosqueda, M.; Glick, B.R. Plant growth-promoting bacterial endophytes. Microbiol. Res. 2016, 183, 92–99. [Google Scholar] [CrossRef] [PubMed]
  6. Khare, E.; Mishra, J.; Arora, N.K. Multifaceted interactions between endophytes and plant: Developments and prospects. Front. Microbiol. 2018, 9, 2732. [Google Scholar] [CrossRef] [PubMed]
  7. Gouda, S.; Das, G.; Sen, S.K.; Shin, H.-S.; Patra, J.K. Endophytes: A treasure house of bioactive compounds of medicinal importance. Front. Microbiol. 2016, 7, 1538. [Google Scholar] [CrossRef] [PubMed]
  8. Compant, S.; Mitter, B.; Colli-Mull, J.G.; Gangl, H.; Sessitsch, A. Endophytes of grapevine flowers, berries, and seeds: Identification of cultivable bacteria, comparison with other plant parts, and visualization of niches of colonization. Microb. Ecol. 2011, 62, 188–197. [Google Scholar] [CrossRef]
  9. Hassan, S.E.-D. Plant growth-promoting activities for bacterial and fungal endophytes isolated from medicinal plant of Teucrium polium L. J. Adv. Res. 2017, 8, 687–695. [Google Scholar] [CrossRef]
  10. Singh, M.; Kumar, A.; Singh, R.; Pandey, K.D. Endophytic bacteria: A new source of bioactive compounds. 3 Biotech 2017, 7, 315. [Google Scholar] [CrossRef]
  11. Khan, M.; Khatun, A.; Islam, T. Promotion of plant growth by phytohormone producing bacteria. In Microbes in Action; Nova Science Publishers: New York, NY, USA, 2016. [Google Scholar]
  12. Frizzo, C.D.; Santos, A.C.; Paroul, N.; Serafini, L.A.; Dellacassa, E.; Lorenzo, D.; Moyna, P. Essential oils of camphor tree (cinnamomum camphora nees & eberm) cultivated in southern brazil. Braz. Arch. Biol. Technol. 2000, 43, 313–316. [Google Scholar]
  13. Wang, S.; Xie, Y. China Species Red List; Higher Education Press: Beijing, China, 2004; Volume 1. [Google Scholar]
  14. Edwards, V.H. The Aromatherapy Companion: Medicinal Uses/Ayurvedic Healing/Body-Care Blends/Perfumes & Scents/Emotional Health & Well-Being; Storey Publishing: North Adams, MA, USA, 2015. [Google Scholar]
  15. Strobel, G.; Daisy, B.; Castillo, U.; Harper, J. Natural products from endophytic microorganisms. J. Nat. Prod. 2004, 67, 257–268. [Google Scholar] [CrossRef] [PubMed]
  16. Arora, J.; Ramawat, K. An introduction to endophytes. In Endophytes: Biology and Biotechnology; Springer: New York, NY, USA, 2017; pp. 1–23. [Google Scholar]
  17. Zhan, W.; Zeng, L.-T.; Fang, Z.; Shi, S.; Zhang, C.-B.; Weng, Q.-B.; School of Life Sciences, Guizhou Normal University. Isolation of the Endophytic Bacteria from Cinnamomum Camphora and Evaluation of Antioxidant Activity of the Fermentation Product. Sci. Technol. Food Ind. 2016, 75, 71–75. [Google Scholar]
  18. Roose-Amsaleg, C.; Garnier-Sillam, E.; Harry, M. Extraction and purification of microbial DNA from soil and sediment samples. Appl. Soil Ecol. 2001, 18, 47–60. [Google Scholar] [CrossRef]
  19. Chowdhury, M.E.K.; Jeon, J.; Rim, S.O.; Park, Y.-H.; Lee, S.K.; Bae, H. Composition, diversity and bioactivity of culturable bacterial endophytes in mountain-cultivated ginseng in korea. Sci. Rep. 2017, 7, 10098. [Google Scholar] [CrossRef] [PubMed]
  20. Weisburg, W.G.; Barns, S.M.; Pelletier, D.A.; Lane, D.J. 16s ribosomal DNA amplification for phylogenetic study. J. Bacteriol. 1991, 173, 697–703. [Google Scholar] [CrossRef] [PubMed]
  21. Edgar, R.C. Search and clustering orders of magnitude faster than blast. Bioinformatics 2010, 26, 2460–2461. [Google Scholar] [CrossRef] [PubMed]
  22. Caporaso, J.G.; Kuczynski, J.; Stombaugh, J.; Bittinger, K.; Bushman, F.D.; Costello, E.K.; Fierer, N.; Pena, A.G.; Goodrich, J.K.; Gordon, J.I. Qiime allows analysis of high-throughput community sequencing data. Nat. Methods 2010, 7, 335–336. [Google Scholar] [CrossRef] [PubMed]
  23. Amato, K.R.; Yeoman, C.J.; Kent, A.; Righini, N.; Carbonero, F.; Estrada, A.; Gaskins, H.R.; Stumpf, R.M.; Yildirim, S.; Torralba, M. Habitat degradation impacts black howler monkey (alouatta pigra) gastrointestinal microbiomes. ISME J. 2013, 7, 1344–1353. [Google Scholar] [CrossRef] [PubMed]
  24. Hammer, Ø.; Harper, D.; Ryan, P. Past: Paleontological statistics software package for education and data analysis. Palaeontol. Electron. 2001, 4, 1–9. [Google Scholar]
  25. Achari, G.A.; Ramesh, R. Diversity, biocontrol, and plant growth promoting abilities of xylem residing bacteria from solanaceous crops. Int. J. Microbiol. 2014, 2014, 296521. [Google Scholar] [CrossRef] [PubMed]
  26. Fletcher, L.; Harvey, I. An association of a lolium endophyte with ryegrass staggers. N. Z. Vet. J. 1981, 29, 185–186. [Google Scholar] [CrossRef] [PubMed]
  27. Quecine, M.C.; Araújo, W.L.; Rossetto, P.B.; Ferreira, A.; Tsui, S.; Lacava, P.T.; Mondin, M.; Azevedo, J.L.; Pizzirani-Kleiner, A.A. Sugarcane growth promotion by the endophytic bacterium pantoea agglomerans 33.1. Appl. Environ. Microbiol. 2012, 78, 7511–7518. [Google Scholar] [CrossRef] [PubMed]
  28. Suman, A.; Yadav, A.N.; Verma, P. Endophytic microbes in crops: Diversity and beneficial impact for sustainable agriculture. In Microbial Inoculants in Sustainable Agricultural Productivity; Springer: New York, NY, USA, 2016; pp. 117–143. [Google Scholar]
  29. Dalmasso, A.; Civera, T.; Pattono, D.; Cardazzo, B.; Bottero, M.T. Characterization of microbiota in plaisentif cheese by high-throughput sequencing. LWT Food Sci. Technol. 2016, 69, 490–496. [Google Scholar] [CrossRef]
  30. Zhang, L.; Wang, S. Bacterial community diversity on in-shell walnut surfaces from six representative provinces in china. Sci. Rep. 2017, 7, 10054. [Google Scholar] [CrossRef]
  31. Deng, Z.-S.; Zhang, B.-C.; Qi, X.-Y.; Sun, Z.-H.; He, X.-L.; Liu, Y.-Z.; Li, J.; Chen, K.-K.; Lin, Z.-X. Root-associated endophytic bacterial community composition of pennisetum sinese from four representative provinces in china. Microorganisms 2019, 7, 47. [Google Scholar] [CrossRef] [PubMed]
  32. Beckers, B.; De Beeck, M.O.; Weyens, N.; Boerjan, W.; Vangronsveld, J. Structural variability and niche differentiation in the rhizosphere and endosphere bacterial microbiome of field-grown poplar trees. Microbiome 2017, 5, 25. [Google Scholar] [CrossRef] [PubMed]
  33. Jin, H.; Yang, X.-Y.; Yan, Z.-Q.; Liu, Q.; Li, X.-Z.; Chen, J.-X.; Zhang, D.-H.; Zeng, L.-M.; Qin, B. Characterization of rhizosphere and endophytic bacterial communities from leaves, stems and roots of medicinal Stellera chamaejasme L. Syst. Appl. Microbiol. 2014, 37, 376–385. [Google Scholar] [CrossRef]
  34. Reiter, B.; Sessitsch, A. Bacterial endophytes of the wildflower crocus albiflorus analyzed by characterization of isolates and by a cultivation-independent approach. Can. J. Microbiol. 2006, 52, 140–149. [Google Scholar] [CrossRef]
  35. Seo, W.T.; Lim, W.J.; Kim, E.J.; Yun, H.D.; Lee, Y.H.; Cho, K.M. Endophytic bacterial diversity in the young radish and their antimicrobial activity against pathogens. J. Korean Soc. Appl. Biol. Chem. 2010, 53, 493–503. [Google Scholar] [CrossRef]
  36. Bodenhausen, N.; Horton, M.W.; Bergelson, J. Bacterial communities associated with the leaves and the roots of arabidopsis thaliana. PLoS ONE 2013, 8, e56329. [Google Scholar] [CrossRef] [PubMed]
  37. Liu, X.L.; Liu, S.L.; Liu, M.; Kong, B.H.; Liu, L.; Li, Y.H. A primary assessment of the endophytic bacterial community in a xerophilous moss (grimmia montana) using molecular method and cultivated isolates. Braz. J. Microbiol. 2014, 45, 165–173. [Google Scholar] [CrossRef] [PubMed]
  38. Müller, H.; Berg, C.; Landa, B.B.; Auerbach, A.; Moissl-Eichinger, C.; Berg, G. Plant genotype-specific archaeal and bacterial endophytes but similar bacillus antagonists colonize mediterranean olive trees. Front. Microbiol. 2015, 6, 138. [Google Scholar]
  39. Dong, L.; Cheng, R.; Xiao, L.; Wei, F.; Wei, G.; Xu, J.; Wang, Y.; Guo, X.; Chen, Z.; Chen, S. Diversity and composition of bacterial endophytes among plant parts of panax notoginseng. Chin. Med. 2018, 13, 41. [Google Scholar] [CrossRef] [PubMed]
  40. Muresu, R.; Tondello, A.; Polone, E.; Sulas, L.; Baldan, B.; Squartini, A. Antioxidant treatments counteract the non-culturability of bacterial endophytes isolated from legume nodules. Arch. Microbiol. 2013, 195, 385–391. [Google Scholar] [CrossRef] [PubMed]
  41. Nair, D.N.; Padmavathy, S. Impact of endophytic microorganisms on plants, environment and humans. Sci. World J. 2014, 2014, 250693. [Google Scholar] [CrossRef] [PubMed]
  42. Hardoim, P.R.; van Overbeek, L.S.; van Elsas, J.D. Properties of bacterial endophytes and their proposed role in plant growth. Trends Microbiol. 2008, 16, 463–471. [Google Scholar] [CrossRef] [PubMed]
  43. Berg, G.; Mahnert, A.; Moissl-Eichinger, C. Beneficial effects of plant-associated microbes on indoor microbiomes and human health? Front. Microbiol. 2014, 5, 15. [Google Scholar] [CrossRef]
  44. Rout, M.E.; Southworth, D. The root microbiome influences scales from molecules to ecosystems: The unseen majority1. Am. J. Bot. 2013, 100, 1689–1691. [Google Scholar] [CrossRef]
  45. Diouf, D.; Samba-Mbaye, R.; Lesueur, D.; Ba, A.T.; Dreyfus, B.; De Lajudie, P.; Neyra, M. Genetic diversity of acacia seyal del. Rhizobial populations indigenous to senegalese soils in relation to salinity and ph of the sampling sites. Microb. Ecol. 2007, 54, 553–566. [Google Scholar] [CrossRef]
  46. Moulin, L.; Munive, A.; Dreyfus, B.; Boivin-Masson, C. Nodulation of legumes by members of the β-subclass of proteobacteria. Nature 2001, 411, 948–950. [Google Scholar] [CrossRef] [PubMed]
  47. Kaiser, K.; Wemheuer, B.; Korolkow, V.; Wemheuer, F.; Nacke, H.; Schöning, I.; Schrumpf, M.; Daniel, R. Driving forces of soil bacterial community structure, diversity, and function in temperate grasslands and forests. Sci. Rep. 2016, 6, 33696. [Google Scholar] [CrossRef] [PubMed]
  48. Guo, Y.; Chen, X.; Wu, Y.; Zhang, L.; Cheng, J.; Wei, G.; Lin, Y. Natural revegetation of a semiarid habitat alters taxonomic and functional diversity of soil microbial communities. Sci. Total Environ. 2018, 635, 598–606. [Google Scholar] [CrossRef] [PubMed]
  49. Zgadzaj, R.; James, E.K.; Kelly, S.; Kawaharada, Y.; de Jonge, N.; Jensen, D.B.; Madsen, L.H.; Radutoiu, S. A legume genetic framework controls infection of nodules by symbiotic and endophytic bacteria. PLoS Genet. 2015, 11, e1005280. [Google Scholar] [CrossRef]
  50. Ferrando, L.; Mañay, J.F.; Scavino, A.F. Molecular and culture-dependent analyses revealed similarities in the endophytic bacterial community composition of leaves from three rice (oryza sativa) varieties. FEMS Microbiol. Ecol. 2012, 80, 696–708. [Google Scholar] [CrossRef] [PubMed]
Figure 1. Agarose gel electrophoresis of total DNA in Cinnamomum camphora.
Diversity 11 00112 g001
Figure 2. The Unweighted-PCoA analysis of samples (cutoff = 0.03). X: April; Y: July; Z: October.
Diversity 11 00112 g002
Figure 3. The PCA analysis of samples (cutoff = 0.03). X: April; Y: July; Z: October.
Diversity 11 00112 g003
Figure 4. Bacterial Phyla distribution in the samples.
Diversity 11 00112 g004
Figure 5. Order distribution in the samples.
Diversity 11 00112 g005
Figure 6. Dendrogram of Cinnamomum camphora leaf bacteria showing the structural similarity of 18 samples.
Diversity 11 00112 g006
Figure 7. Heatmap showing the relative abundances and distribution of the Operational taxonomic units (OTUs_ across the sample (cutoff = 0.03).
Diversity 11 00112 g007
Figure 8. System evolutionary tree of each sample.
Diversity 11 00112 g008
Table 1. Highlights of the sampling time and coding.
TimeSample ID
NP 209NP PC-1NP 195NP MDA-1NP 187FU
April (X)A1B1C1D1E1F1
July (Y)A2B2C2D2E2F2
October (Z)A3B3C3D3E3F3
NP = Nanping; FU = Fuqin.
Table 2. Valid data statistics of the C. camphora samples.
Sample IDPE ReadsRaw TagsClean TagsEffective TagsAvg Length (bp)
A1635,983596,365574,312553,476444
A2612,984578,687559,132545,451445
A3437,572404,908386,289379,373442
B1629,137588,063566,411543,775442
B2598,480564,240549,649534,123436
B3615,982584,748566,126556,061441
C1621,682583,501563,848557,754439
C2989,097936,449912,801898,117435
C3431,426409,194398,148393,178436
D1682,742640,843616,566607,505445
D2547,166517,633502,378492,925440
D31,096,5591,077,6001,052,1251,025,234442
E1753,426709,316683,623657,209442
E2487,276460,700444,107434,587444
E3691,461659,694641,167632,130439
F1745,999708,816690,867675,521436
F2803,207763,307742,869732,976437
F3436,209405,940393,706387,708437
Table 3. The diversity of C. camphora samples.
Sample IDOTUACEChao1SimpsonShannonCoverage
A110861139.841174.500.0374.91110.9998
A28831009.851042.750.07194.45010.9998
A37471764.721117.560.08063.91480.9992
B1892930.18950.240.04094.83750.9999
B2530684.305684.0710.05563.98920.9998
B39351077.091017.220.03175.33370.9998
C17421645.061040.470.06284.32940.9996
C2509741.62602.840.09533.6370.9999
C35231115.03900.000.16553.62220.9995
D1704732.51755.670.06784.24850.9999
D2773924.20873.500.06284.85070.9998
D310341054.591050.160.04635.03951.0
E18741220.391065.290.04854.46760.9998
E2688756.54731.050.05664.32870.9998
E35891154.671233.100.04585.18620.9998
F1573617.72675.080.05743.74550.9999
F210381139.781095.030.02425.24940.9999
F3549818.44.32645.460.09134.00690.9997

